TFE.1, Figure 1
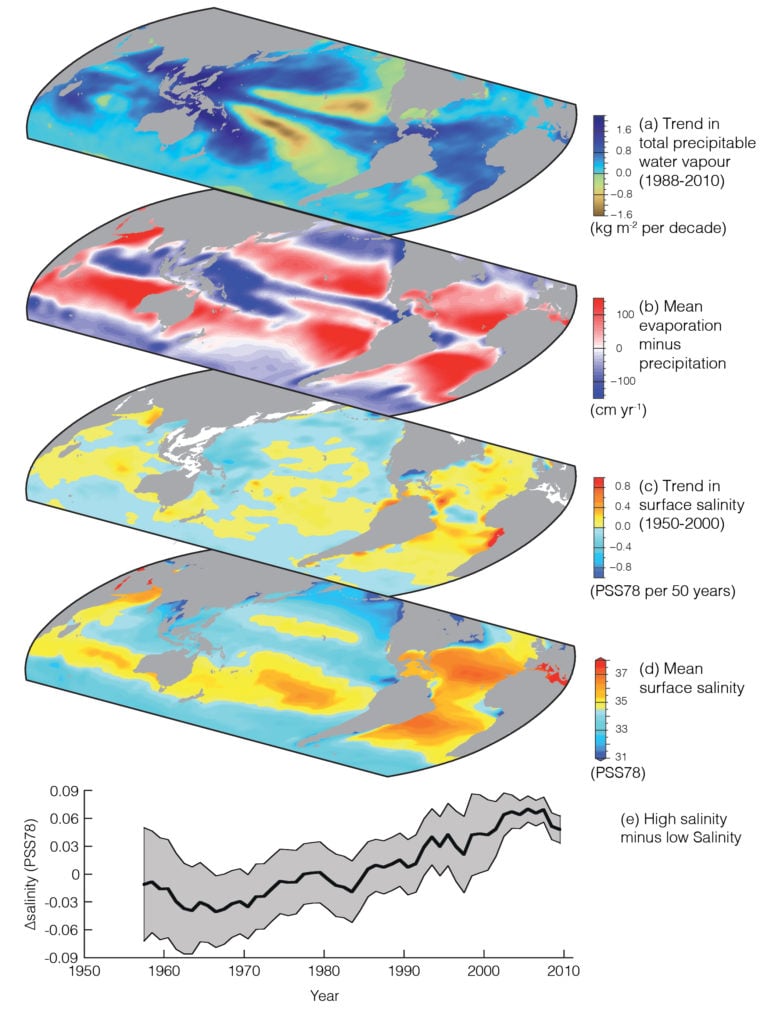
Changes in sea surface salinity are related to the atmospheric patterns of evaporation minus precipitation (E – P) and trends in total precipitable water: (a) Linear trend (1988 to 2010) in total precipitable water (water vapour integrated from the Earth’s surface up through the entire atmosphere) (kg m–2 per decade) from satellite observations. (b) The 1979–2005 climatological mean net evaporation minus precipitation (cm yr–1) from meteorological reanalysis data. (c) Trend (1950–2000) in surface salinity (Practical Salinity Scale 78 (PSS78) per 50 years). (d) The climatological mean surface salinity (PSS78) (blues 35). (e) Global difference between salinity averaged over regions where the sea surface salinity is greater than the global mean sea surface salinity (“High Salinity”) and salinity averaged over regions with values below the global mean (‘Low Salinity’). For details of data sources see Figure 3.21 and FAQ 3.2, Figure 1. {3.9}
You may freely download and copy the material contained on this website for your personal, non-commercial use, without any right to resell, redistribute, compile or create derivative works therefrom, subject to more specific restrictions that may apply to specific materials.