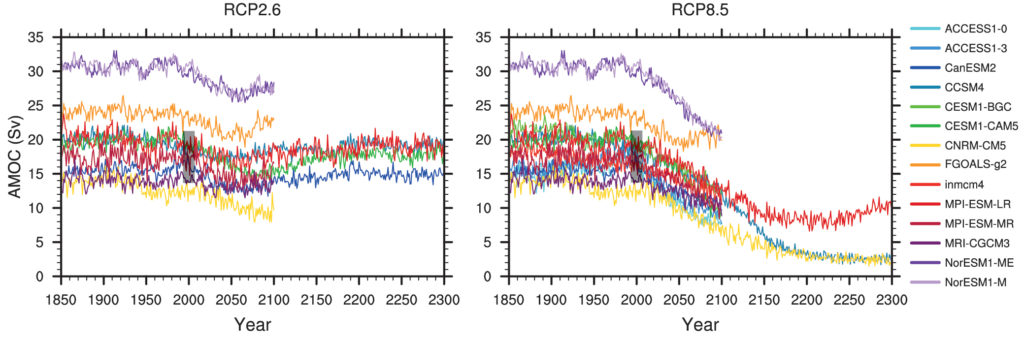
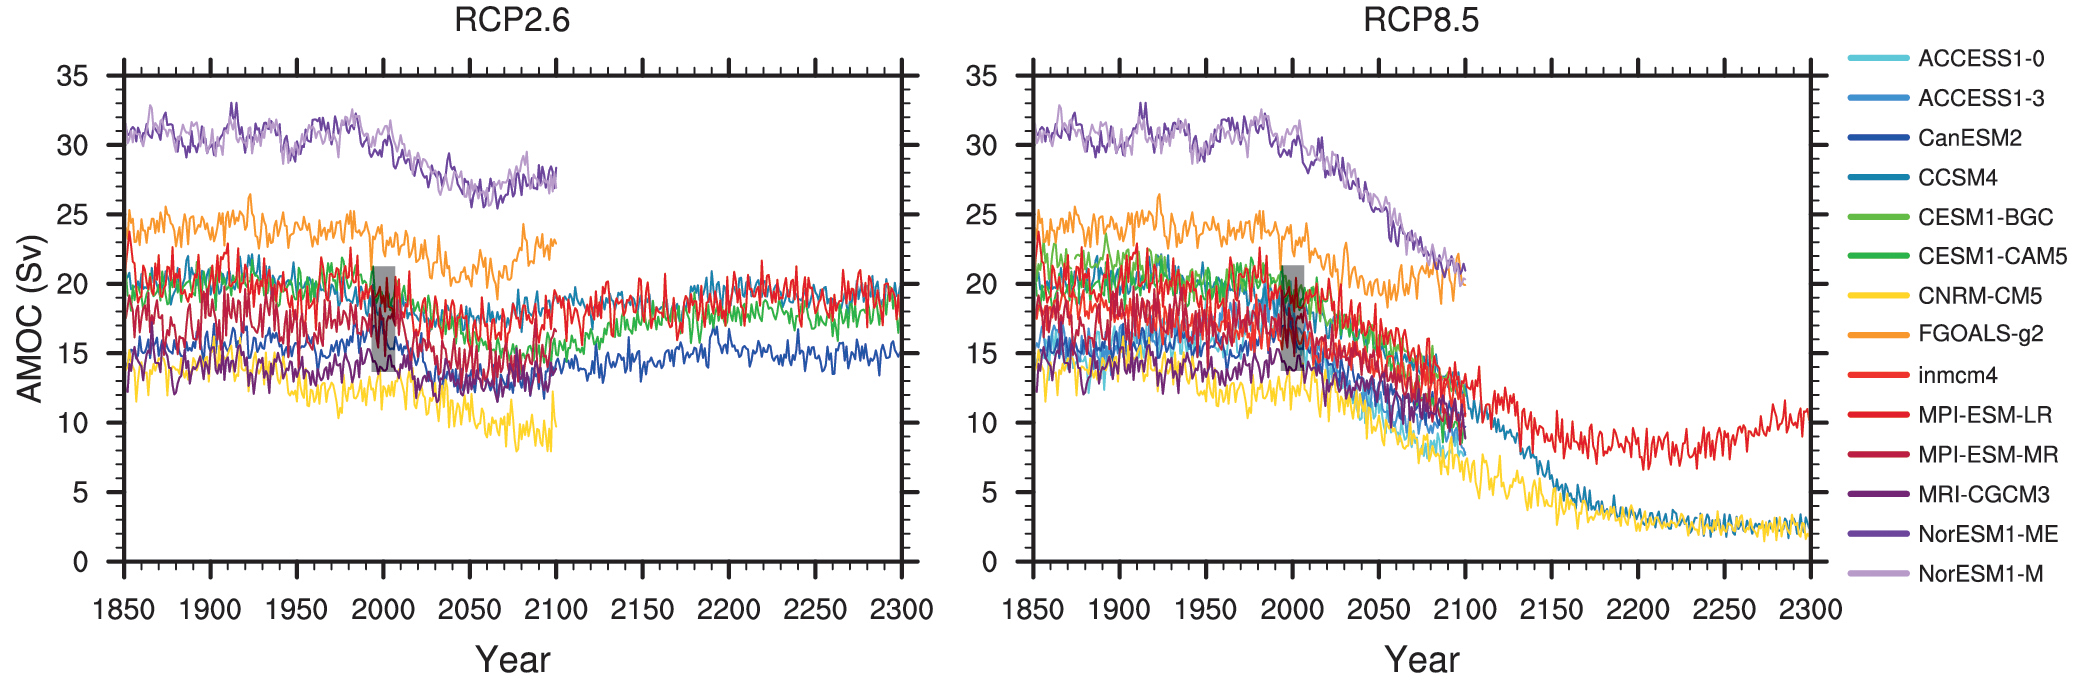
TFE.5, Figure 1
Atlantic Meridional Overturning Circulation (AMOC) strength at 30°N (Sv) as a function of year, from 1850 to 2300 as simulated by different Atmosphere–Ocean General Circulation Models in response to scenario RCP2.6 (left) and RCP8.5 (right). The vertical black bar shows the range of AMOC strength measured at 26°N, from 2004 to 2011 {Figures 3.11, 12.35}
You may freely download and copy the material contained on this website for your personal, non-commercial use, without any right to resell, redistribute, compile or create derivative works therefrom, subject to more specific restrictions that may apply to specific materials.
Share