
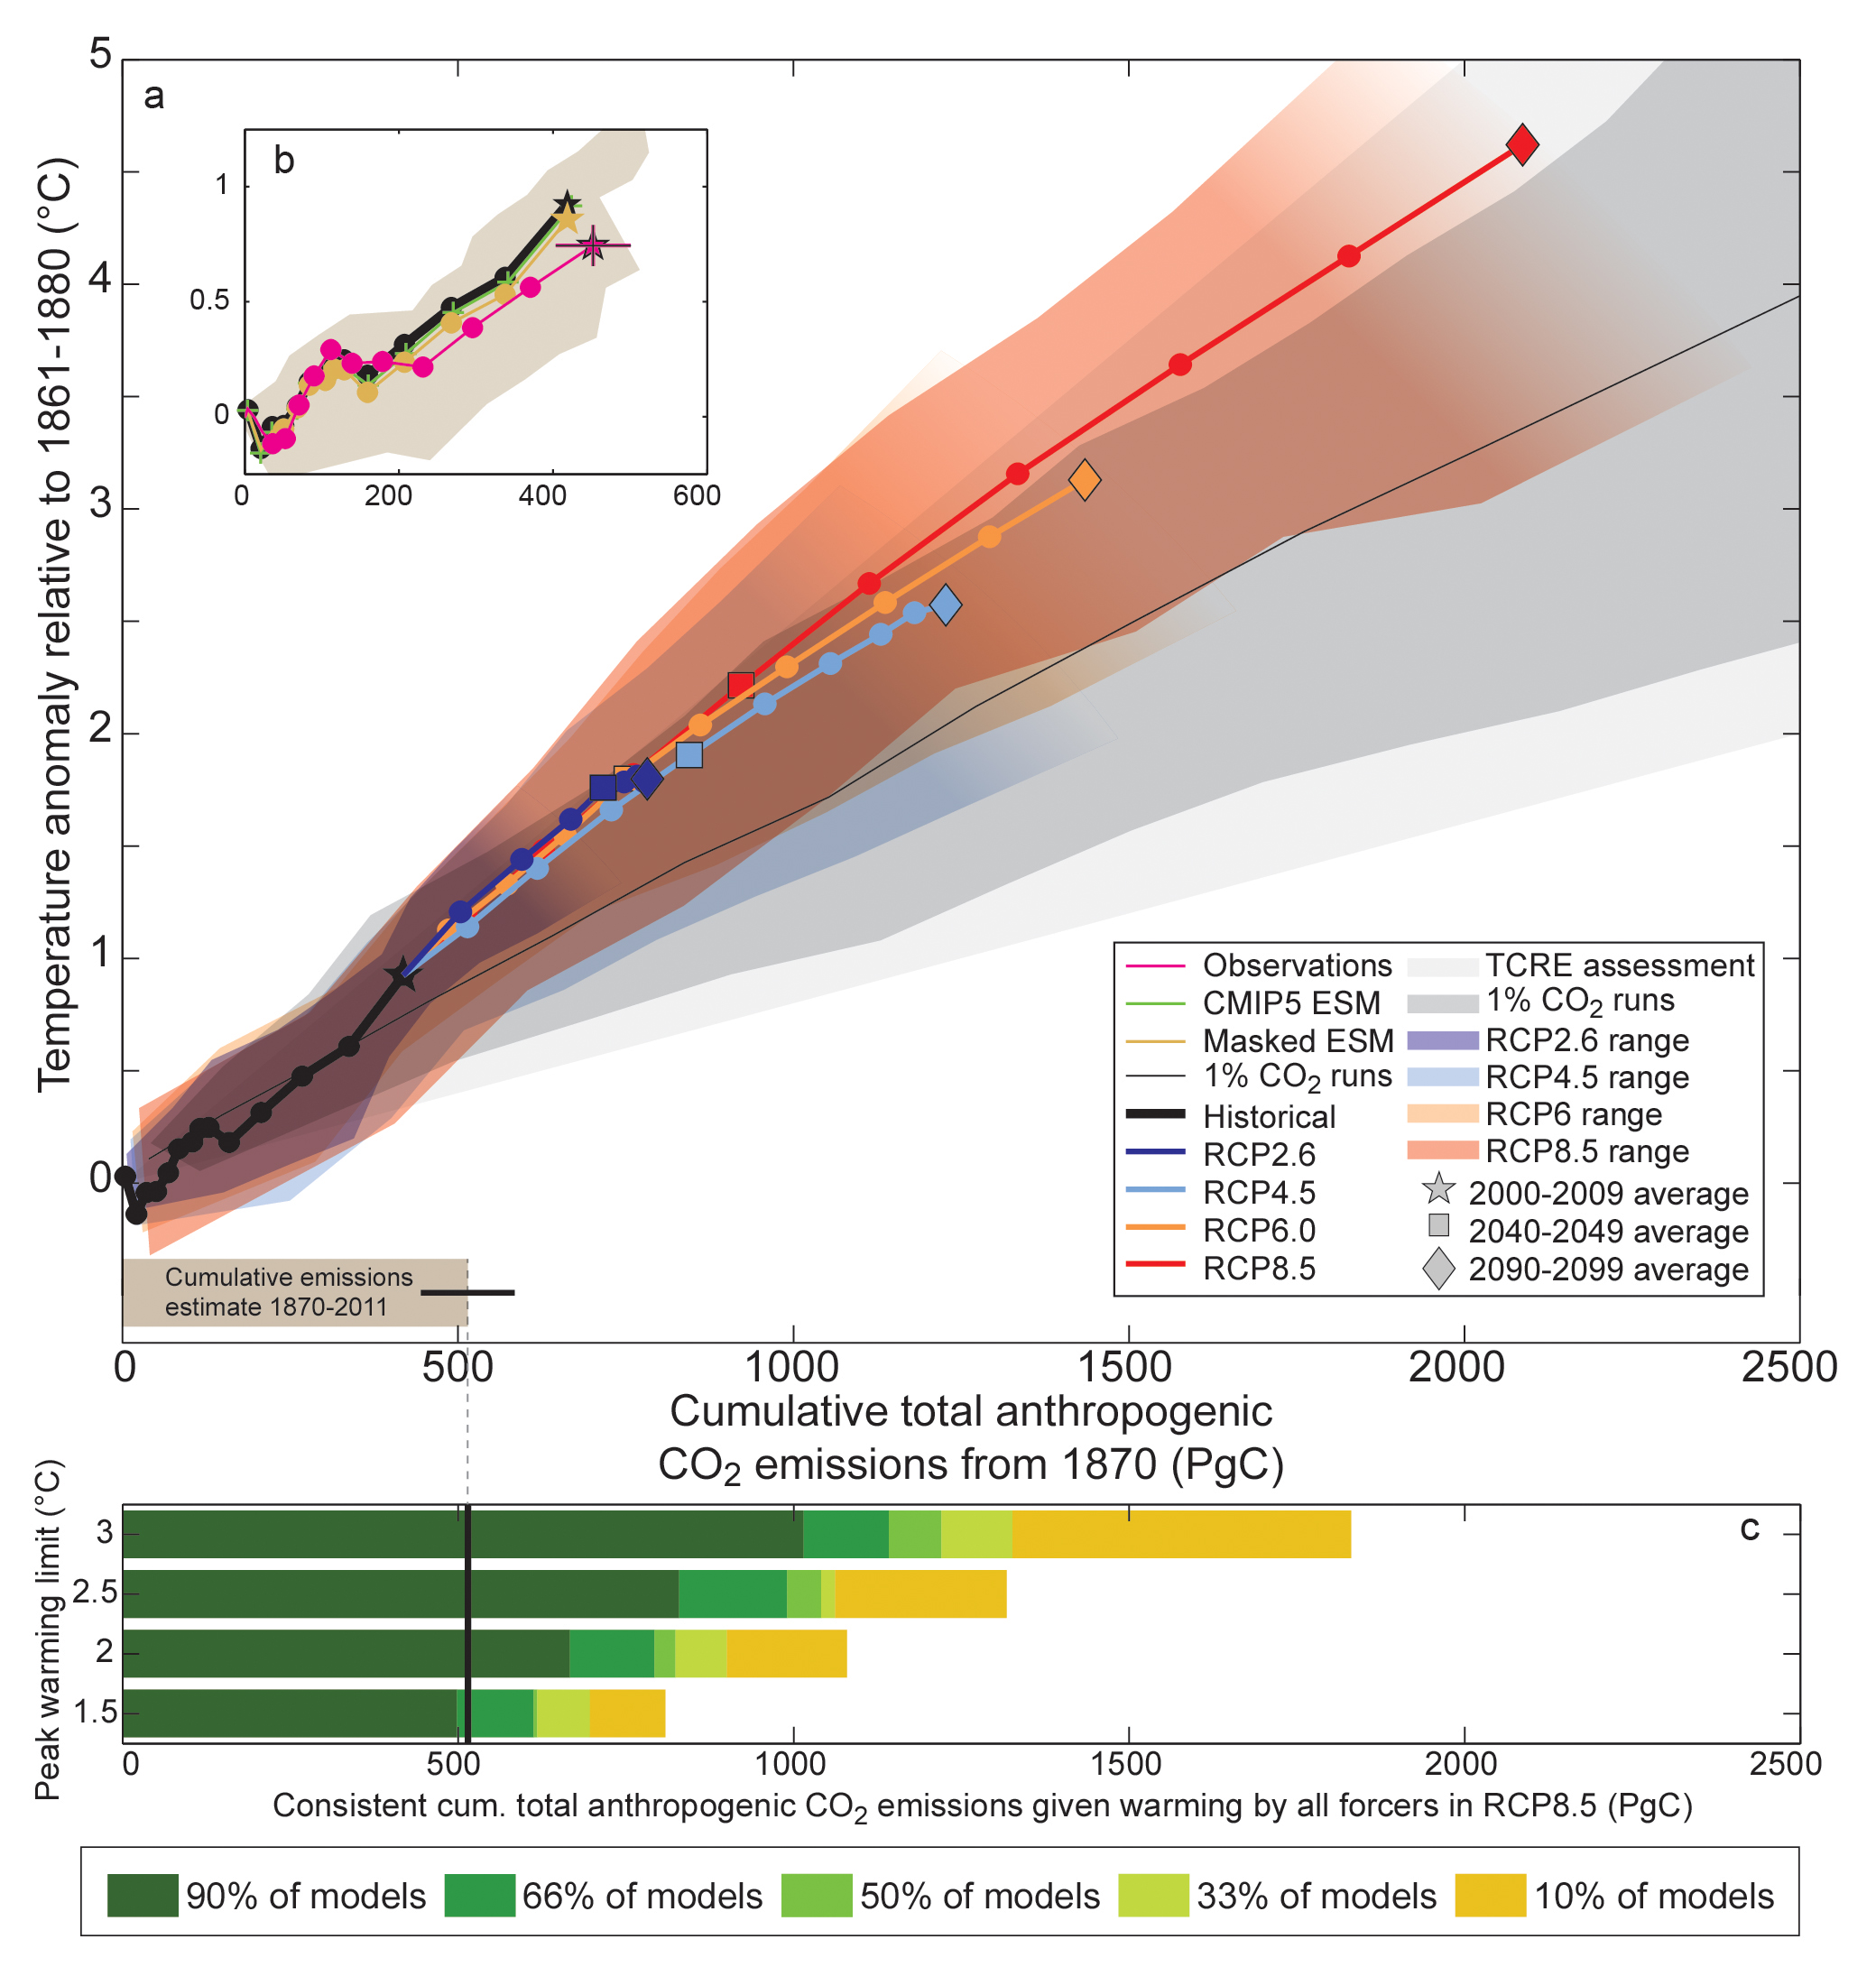
TFE.8, Figure 1
Global mean temperature increase since 1861–1880 as a function of cumulative total global CO2 emissions from various lines of evidence. (a) Decadal average results are shown over all CMIP5 Earth System Model of Intermediate Complexity (EMICs) and Earth System Models (ESMs) for each RCP respectively, with coloured lines (multi-model average), decadal markers (dots) and with three decades (2000–2009, 2040–2049 and 2090–2099) highlighted with a star, square and diamond, respectively. The historical time period up to decade 2000–2009 is taken from the CMIP5 historical runs prolonged by RCP8.5 for 2006–2010 and is indicated with a black thick line and black symbols. Coloured ranges illustrate the model spread (90% range) over all CMIP5 ESMs and EMICs and do not represent a formal uncertainty assessment. Ranges are filled as long as data of all models is available and until peak temperature. They are faded out for illustrative purposes afterward. CMIP5 simulations with 1% yr–1 CO2 increase only are illustrated by the dark grey area (range definition similar to RCPs above) and the black thin line (multi-model average). The light grey cone represents this Report’s assessment of the transient climate response to emissions (TCRE) from CO2 only. Estimated cumulative historical CO2 emissions from 1870 to 2011 with associated uncertainties are illustrated by the grey bar at the bottom of (a). (b) Comparison of historical model results with observations. The magenta line and uncertainty ranges are based on observed emissions from Carbon Dioxide Information Analysis Center (CDIAC) extended by values of the Global Carbon project until 2010 and observed temperature estimates of the Hadley Centre/Climatic Research Unit gridded surface temperature data set 4 (HadCRUT4). The uncertainties in the last decade of observations are based on the assessment in this report. The black thick line is identical to the one in (a). The thin green line with crosses is as the black line but for ESMs only. The yellow-brown line and range show these ESM results until 2010, when corrected for HadCRUT4’s incomplete geographical coverage over time. All values are given relative to the 1861–1880 base period. All time-series are derived from decadal averages to illustrate the long-term trends. Note that observations are in addition subject to internal climate variability, adding an uncertainty of about 0.1°C. (c) Cumulative CO2 emis- sions over the entire industrial era, consistent with four illustrative peak global temperature limits (1.5°C, 2°C, 2.5°C and 3°C, respectively) when taking into account warming by all forcers. Horizontal bars indicate consistent cumulative emission budgets as a function of the fraction of models (CMIP5 ESMs and EMICs) that at least hold warming below a given temperature limit. Note that the fraction of models cannot be interpreted as a probability. The budgets are derived from the RCP8.5 runs, with relative high non-CO2 forcing over the 21st century. If non-CO2 are significantly reduced, the CO2 emissions compatible with a specific temperature limit might be slightly higher, but only to a very limited degree, as illustrated by the other coloured lines in (a), which assume significantly lower non-CO2 forcing. Further detail regarding the related Figure SPM.10 is given in the TS Supplementary Material. {Figure 12.45}
You may freely download and copy the material contained on this website for your personal, non-commercial use, without any right to resell, redistribute, compile or create derivative works therefrom, subject to more specific restrictions that may apply to specific materials.