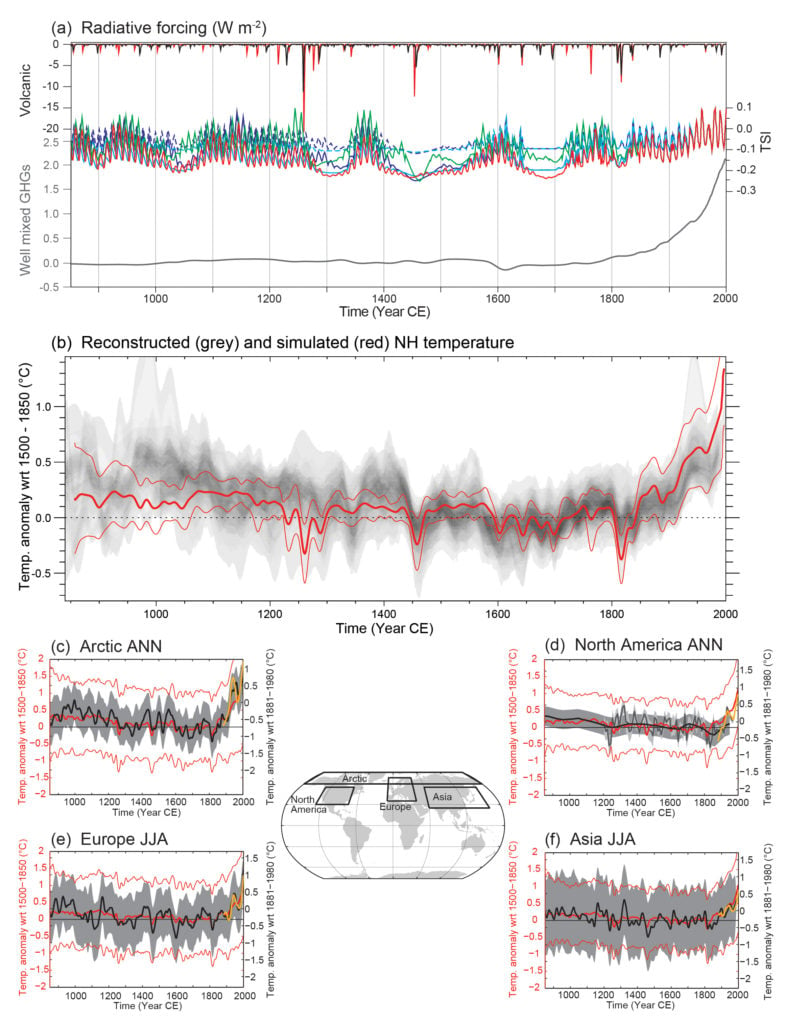
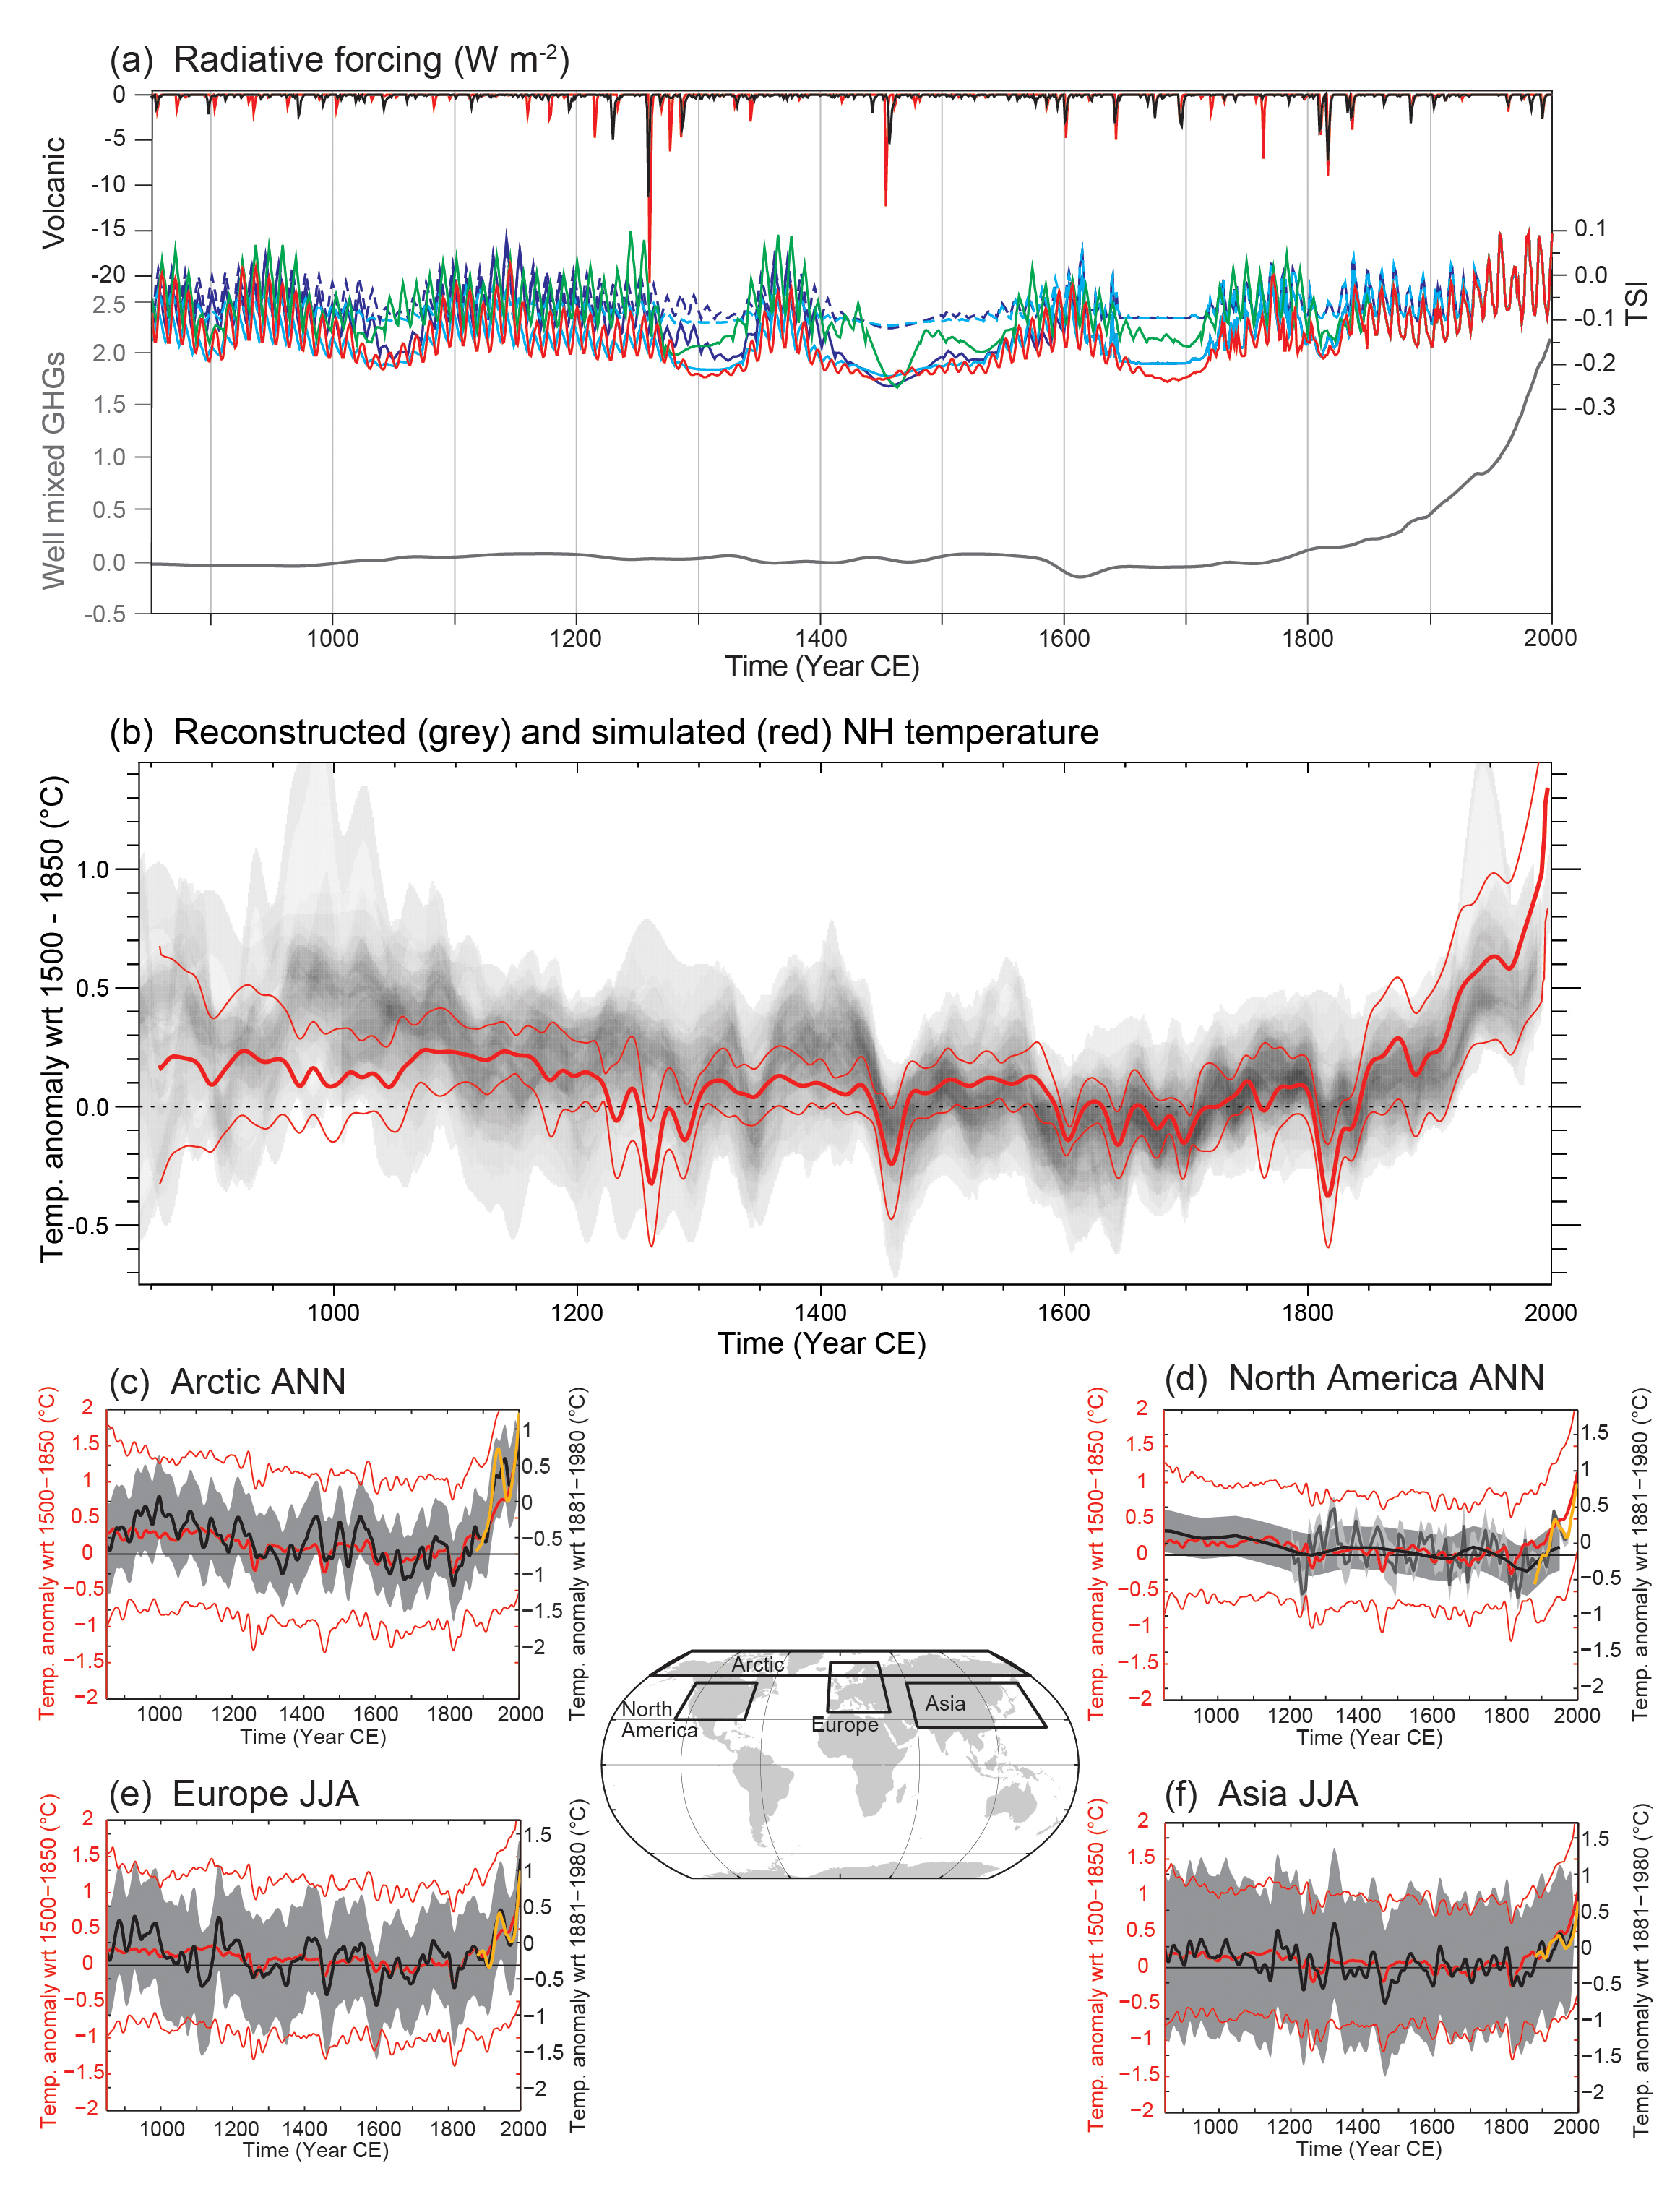
Box TS.5, Figure 1
Last-millennium simulations and reconstructions. (a) 850–2000 PMIP3/CMIP5 radiative forcing due to volcanic, solar and well-mixed greenhouse gases. Different colours illustrate the two existing data sets for volcanic forcing and four estimates of solar forcing. For solar forcing, solid (dashed) lines stand for reconstruction variants in which background changes in irradiance are (not) considered; (b) 850–2000 PMIP3/CMIP5 simulated (red) and reconstructed (shading) Northern Hemisphere (NH) temperature changes. The thick red line depicts the multi-model mean while the thin red lines show the multi-model 90% range. The overlap of reconstructed temperatures is shown by grey shading; all data are expressed as anomalies from their 1500–1850 mean and smoothed with a 30-year filter. Note that some reconstructions represent a smaller spatial domain than the full NH or a specific season, while annual temperatures for the full NH mean are shown for the simulations. (c), (d), (e) and (f) Arctic and North America annual mean temperature, and Europe and Asia June, July and August (JJA) temperature, from 950 to 2000 from reconstructions (black line), and PMIP3/CMIP5 simulations (thick red, multi-model mean; thin red, 90% multi-model range). All red curves are expressed as anomalies from their 1500–1850 mean and smoothed with a 30-year filter. The shaded envelope depicts the uncertainties from each reconstruction (Arctic: 90% confidence bands, North American: ±2 standard deviation. Asia: ±2 root mean square error. Europe: 95% confidence bands). For comparison with instrumental record, the Climatic Research Unit land station Temperature (CRUTEM4) data set is shown (yellow line). These instrumental data are not necessarily those used in calibration of the reconstrctions, and thus may show greater or lesser correspondence with the reconstructions than the instrumental data actually used for calibration; cutoff timing may also lead to end effects for smoothed data shown. All lines are smoothed by applying a 30-year moving average. Map shows the individual regions for each reconstruction. {5.3.5; Table 5.A.1; Figures 5.1, 5.8, 5.12}
You may freely download and copy the material contained on this website for your personal, non-commercial use, without any right to resell, redistribute, compile or create derivative works therefrom, subject to more specific restrictions that may apply to specific materials.