Chapter 8: Water Cycle Changes


This chapter should be cited as:
Douville, H., K. Raghavan, J. Renwick, R.P. Allan, P.A. Arias, M. Barlow, R. Cerezo-Mota, A. Cherchi, T.Y. Gan, J. Gergis, D. Jiang, A. Khan, W. Pokam Mba, D. Rosenfeld, J. Tierney, and O. Zolina, 2021: Water Cycle Changes. In Climate Change 2021: The Physical Science Basis. Contribution of Working Group I to the Sixth Assessment Report of the Intergovernmental Panel on Climate Change [Masson-Delmotte, V., P. Zhai, A. Pirani, S.L. Connors, C. Péan, S. Berger, N. Caud, Y. Chen, L. Goldfarb, M.I. Gomis, M. Huang, K. Leitzell, E. Lonnoy, J.B.R. Matthews, T.K. Maycock, T. Waterfield, O. Yelekçi, R. Yu, and B. Zhou (eds.)]. Cambridge University Press, Cambridge, United Kingdom and New York, NY, USA, pp. 1055–1210, doi: 10.1017/9781009157896.010.
Executive Summary
This chapter assesses multiple lines of evidence to evaluate past, present and future changes in the global water cycle. It complements material in Chapters 2, 3 and 4 on observed and projected changes in the water cycle, and Chapters 10 and 11 on regional climate change and extreme events. The assessment includes the physical basis for water cycle changes, observed changes in the water cycle and attribution of their causes, future projections and related key uncertainties, and the potential for abrupt change. Paleoclimate evidence, observations, reanalyses and global and regional model simulations are considered. The assessment shows widespread, non-uniform human-caused alterations of the water cycle, which have been obscured by a competition between different drivers across the 20th century and that will be increasingly dominated by greenhouse gas forcing at the global scale.
Physical Basis for Water Cycle Changes
Modifications of Earth’s energy budget by anthropogenic radiative forcings drive substantial and widespread changes in the global water cycle. There is high confidence that global mean precipitation and evaporation increase with global warming, but the estimated rate is model-dependent (very likely range of 1–3% per 1°C). The global increase in precipitation is determined by a robust response to global mean surface air temperature (very likely 2–3% per 1°C) that is partly offset by fast atmospheric adjustments to atmospheric heating by greenhouse gases and aerosols. The overall effect of anthropogenic aerosols is to reduce global precipitation and alter large-scale atmospheric circulation patterns through their well-understood surface radiative cooling effect (high confidence). Land-use and land-cover changes also drive regional water cycle changes through their influence on surface water and energy budgets (high confidence). {8.2.1, 8.2.3.4, 8.2.2.2, Box 8.1}
A warmer climate increases moisture transport into weather systems, which, on average, makes wet seasons and events wetter (high confidence). An increase in near-surface atmospheric water holding capacity of about 7% per 1°C of warming explains a similar magnitude of intensification of heavy precipitation events (from sub-daily up to seasonal time scales) that increases the severity of flood hazards when these extremes occur (high confidence). The severity of very wet and very dry events increases in a warming climate (high confidence), but changes in atmospheric circulation patterns alter where and how often these extremes occur, with substantial regional differences and seasonal contrasts. A slowdown of tropical circulation with global warming partly offsets the warming-induced strengthening of precipitation in monsoon regions (high confidence). {8.2.2, 8.2.3, 8.3.1.7, 8.4.1, 8.5.1}
Warming over land drives an increase in atmospheric evaporative demand and the severity of droughts (high confidence). Greater warming over land than over the ocean alters atmospheric circulation patterns and, on average, reduces continental near-surface relative humidity, which contributes to regional drying (high confidence). Increasing atmospheric CO2 concentrations increase plant growth and water-use efficiency, but there is low confidence in how these factors drive regional water cycle changes. {8.2.2, 8.2.3}
Causes of Observed Changes
Human-caused climate change has driven detectable changes in the global water cycle since the mid-20th century (high confidence). Global warming has contributed to an overall increase in atmospheric moisture and precipitation intensity (high confidence), increased terrestrial evapotranspiration (medium confidence), influenced global patterns in aridity (very likely) , and enhanced contrasts in surface salinity and precipitation minus evaporation patterns over the oceans (high confidence). {3.4.2, 3.4.3, 3.5.2, 8.3.1, 9.2.2}
Greenhouse gas forcing has driven increased contrasts in precipitation amounts between wet and dry seasons and weather regimes over tropical land areas (medium confidence) and a detectable precipitation increase in the northern high latitudes (high confidence). Greenhouse gas forcing has also contributed to drying in dry summer climates, including the Mediterranean, south-western Australia, south-western South America, South Africa, and western North America (medium to high confidence). Earlier onset of spring snowmelt and increased melting of glaciers have already contributed to seasonal changes in streamflow in high-latitude and low-elevation mountain catchments (high confidence). {Box 8.2, 8.2.2.1, 8.3.1, 3.3.2, 3.3.3, 3.5.2}
Anthropogenic aerosols have driven detectable large-scale water cycle changes since at least the mid-20th century (high confidence). Shifts in the tropical rain belt are associated with the inter-hemispheric temperature response to the time-evolving radiative influence of anthropogenic aerosols and the ongoing warming influence of greenhouse gases (high confidence). Cooling in the Northern Hemisphere by sulphate aerosols explained a southward shift in the tropical rain belt and contributed to the Sahel drought from the 1970s to the 1980s (high confidence), subsequent recovery from which has been linked with greenhouse gas warming (medium confidence). Observed changes in regional monsoon precipitation, especially over South Asia, East Asia and West Africa, have been limited over much of the 20th century due to increases driven by warming from greenhouse gases being counteracted by decreases due to cooling from anthropogenic aerosols (high confidence). {8.3.1.3, 8.3.2.4, Box 8.1}
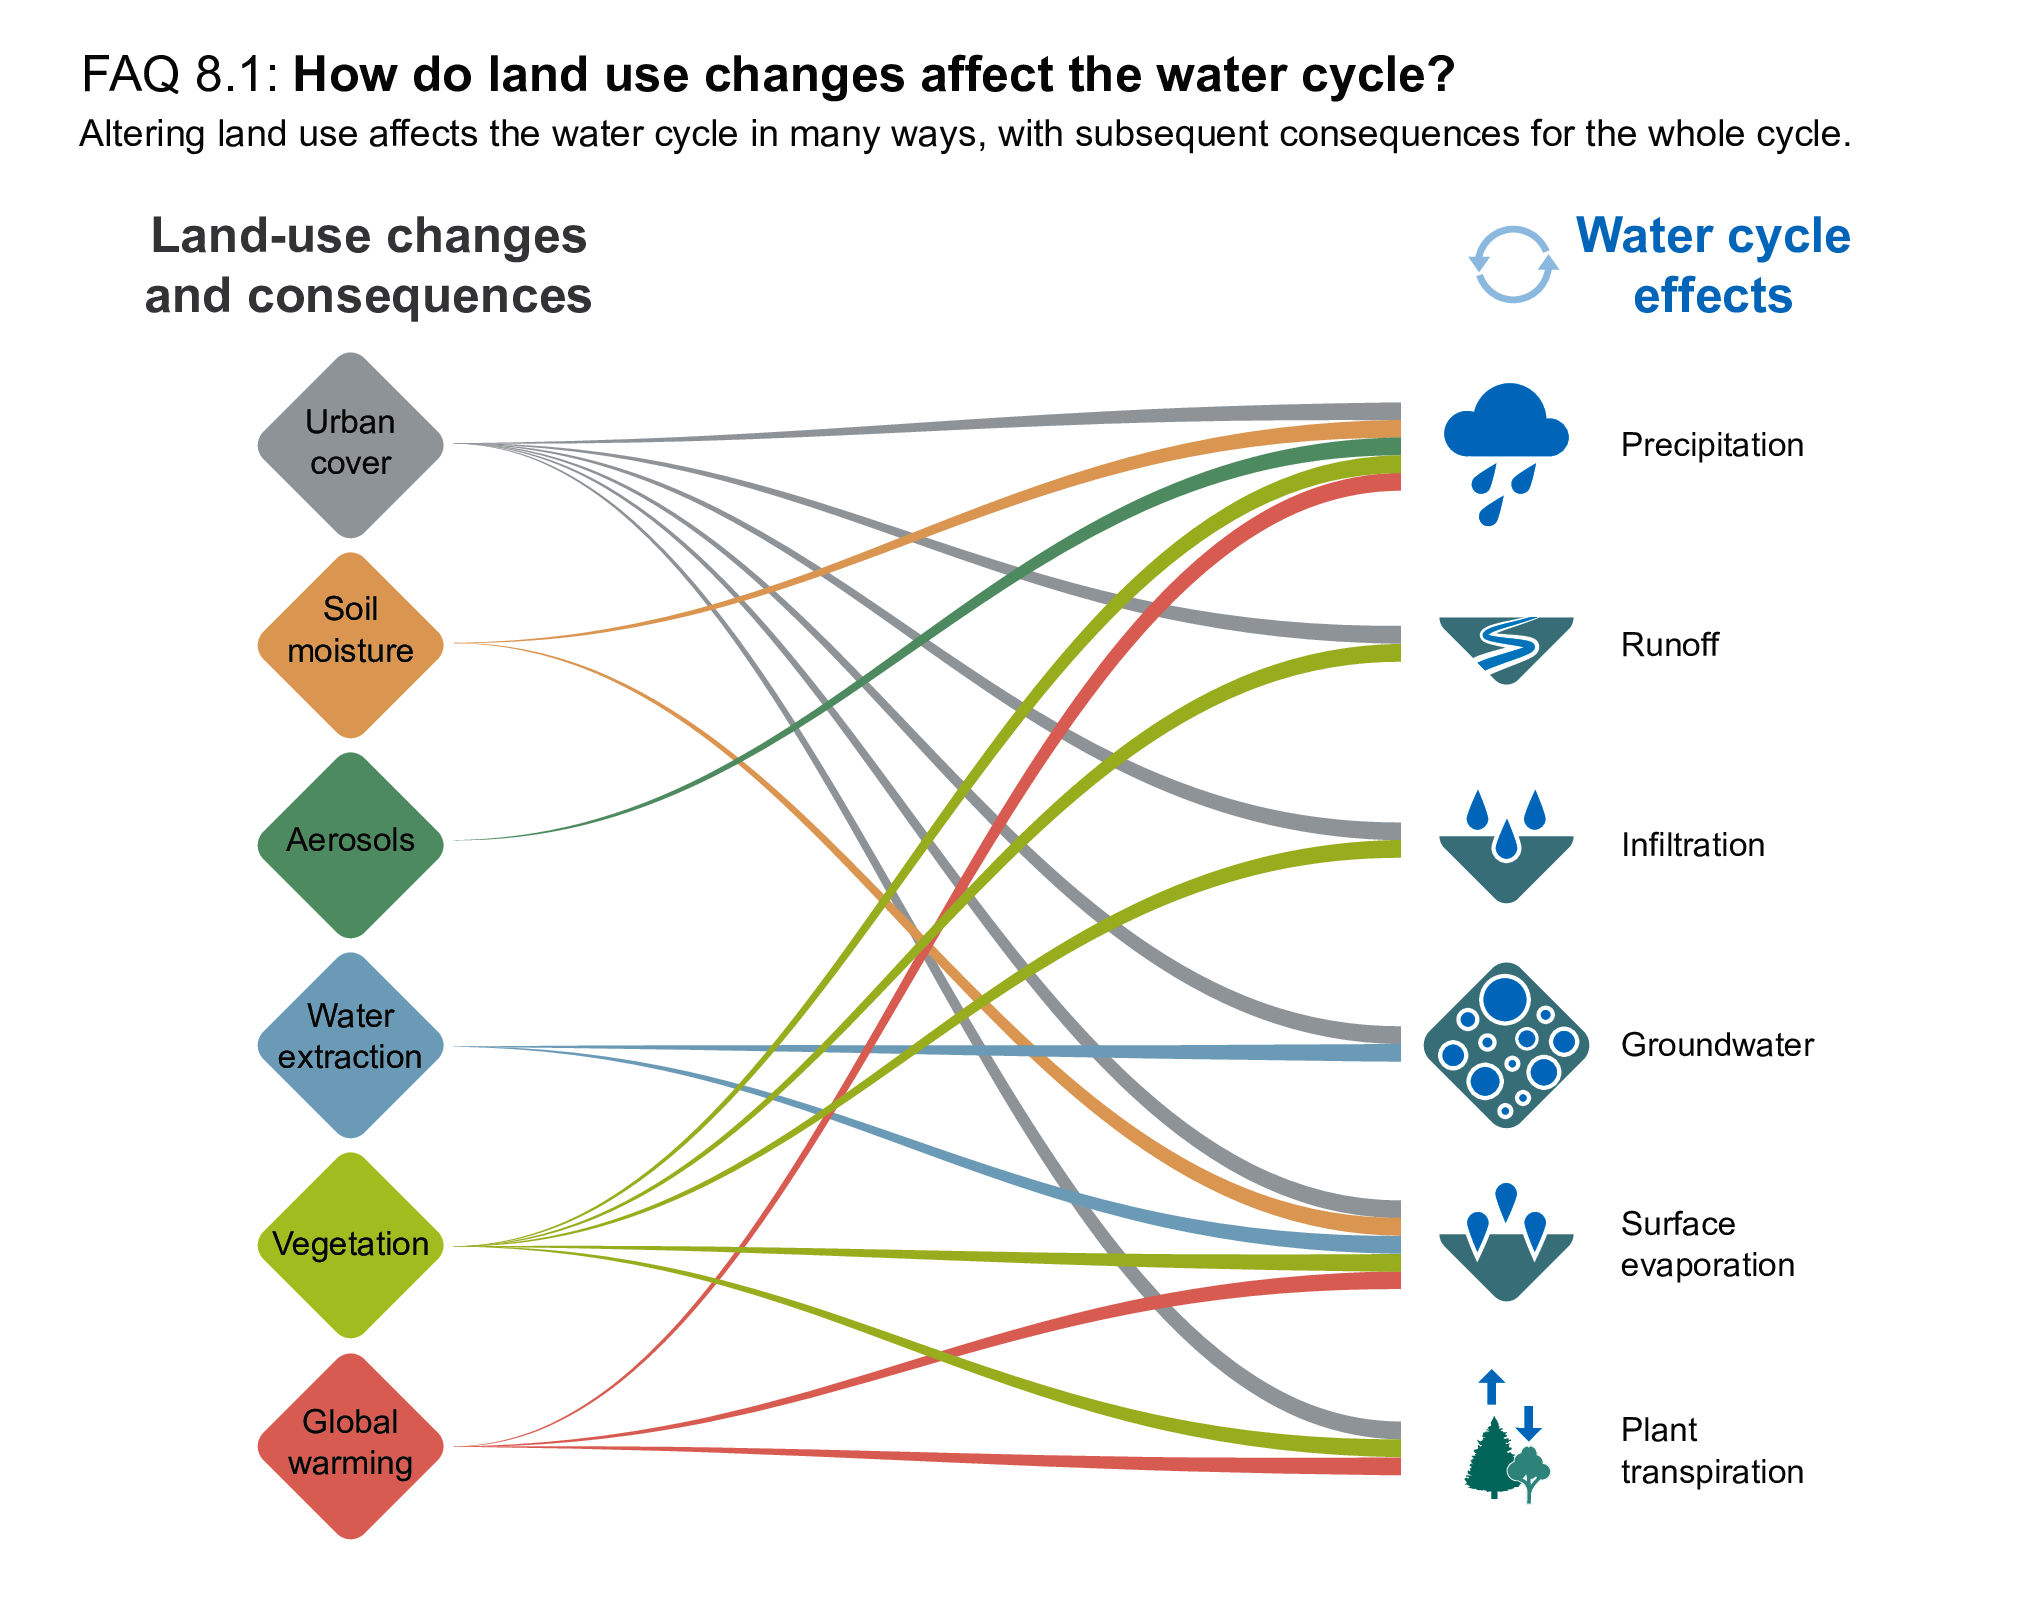
Land-use change and water extraction for irrigation have influenced local and regional responses in the water cycle (high confidence). Large-scale deforestation haslikely decreased evapotranspiration and precipitation and increased runoff over the deforested regions. Urbanization has increased local precipitation (medium confidence) and resulting runoff intensity (high confidence). Increased precipitation intensities have enhanced groundwater recharge, most notably in tropical regions (medium confidence). There is high confidence that groundwater depletion has occurred since at least the start of the 21st century as a consequence of groundwater withdrawals for irrigation in agricultural areas in drylands (e.g., the southern High Plains and California Central Valley of the USA, North China Plain, and north-west India). {8.2.3.4, 8.3.1.7, Box 10.3, FAQ 8.1}
Southern Hemisphere storm tracks and associated precipitation have shifted polewards since the 1970s, especially in the austral summer and autumn (high confidence). It is very likely that these changes are associated with a positive trend in the Southern Annular Mode, related to both stratospheric ozone depletion and greenhouse gas increases. There is medium confidence that the recent observed expansion of the Hadley circulation was caused by greenhouse gas forcing, especially in the Southern Hemisphere, but there is onlylow confidence in how it influences the drying of subtropical land areas. {8.2.2, 8.3.2, 3.3.3}
Future Water Cycle Changes
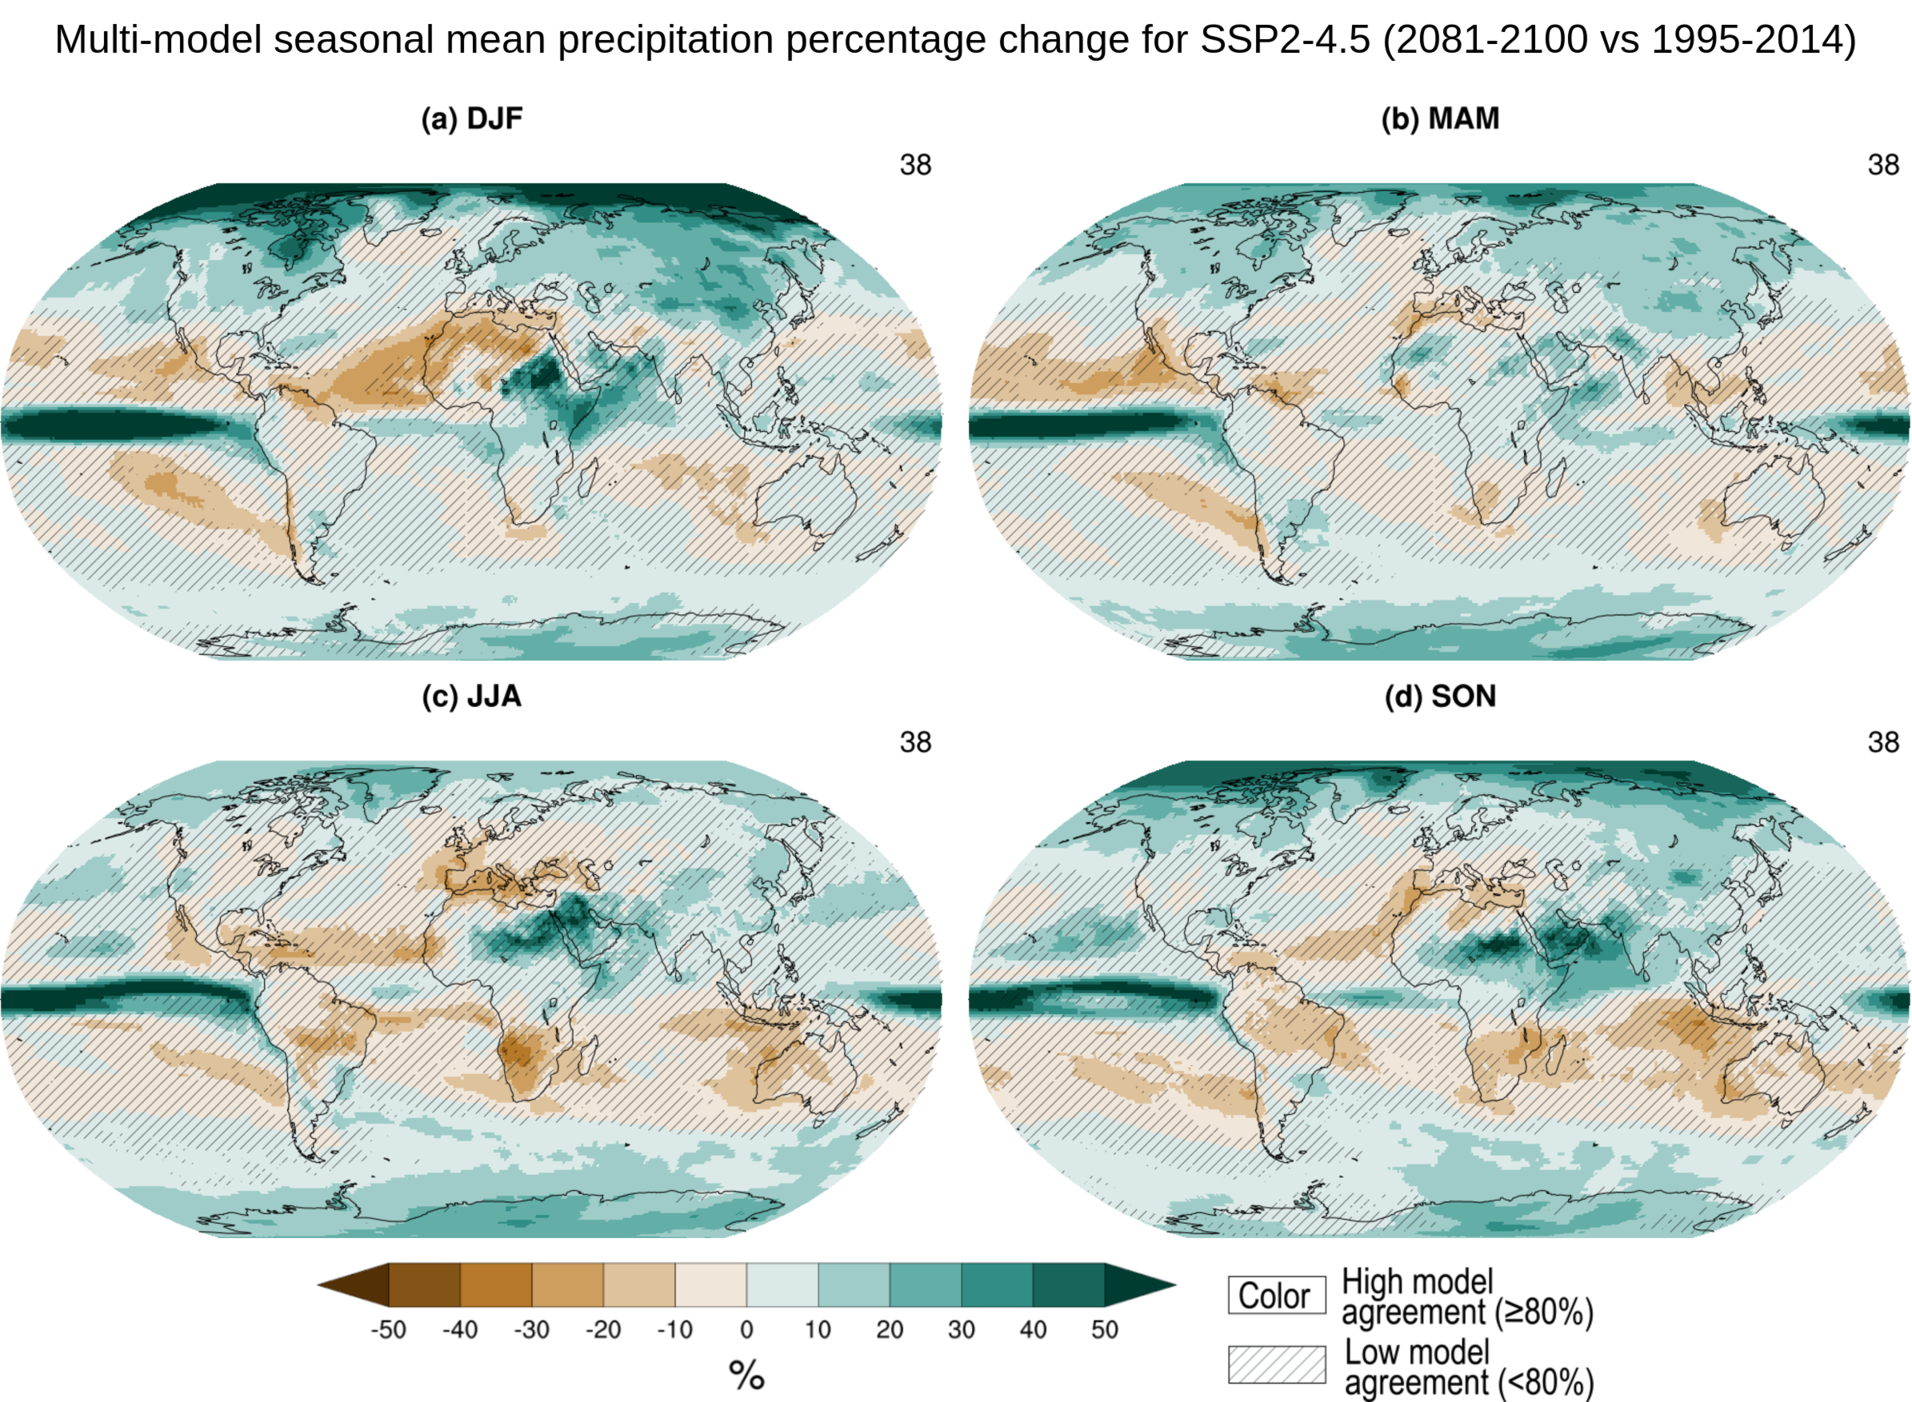
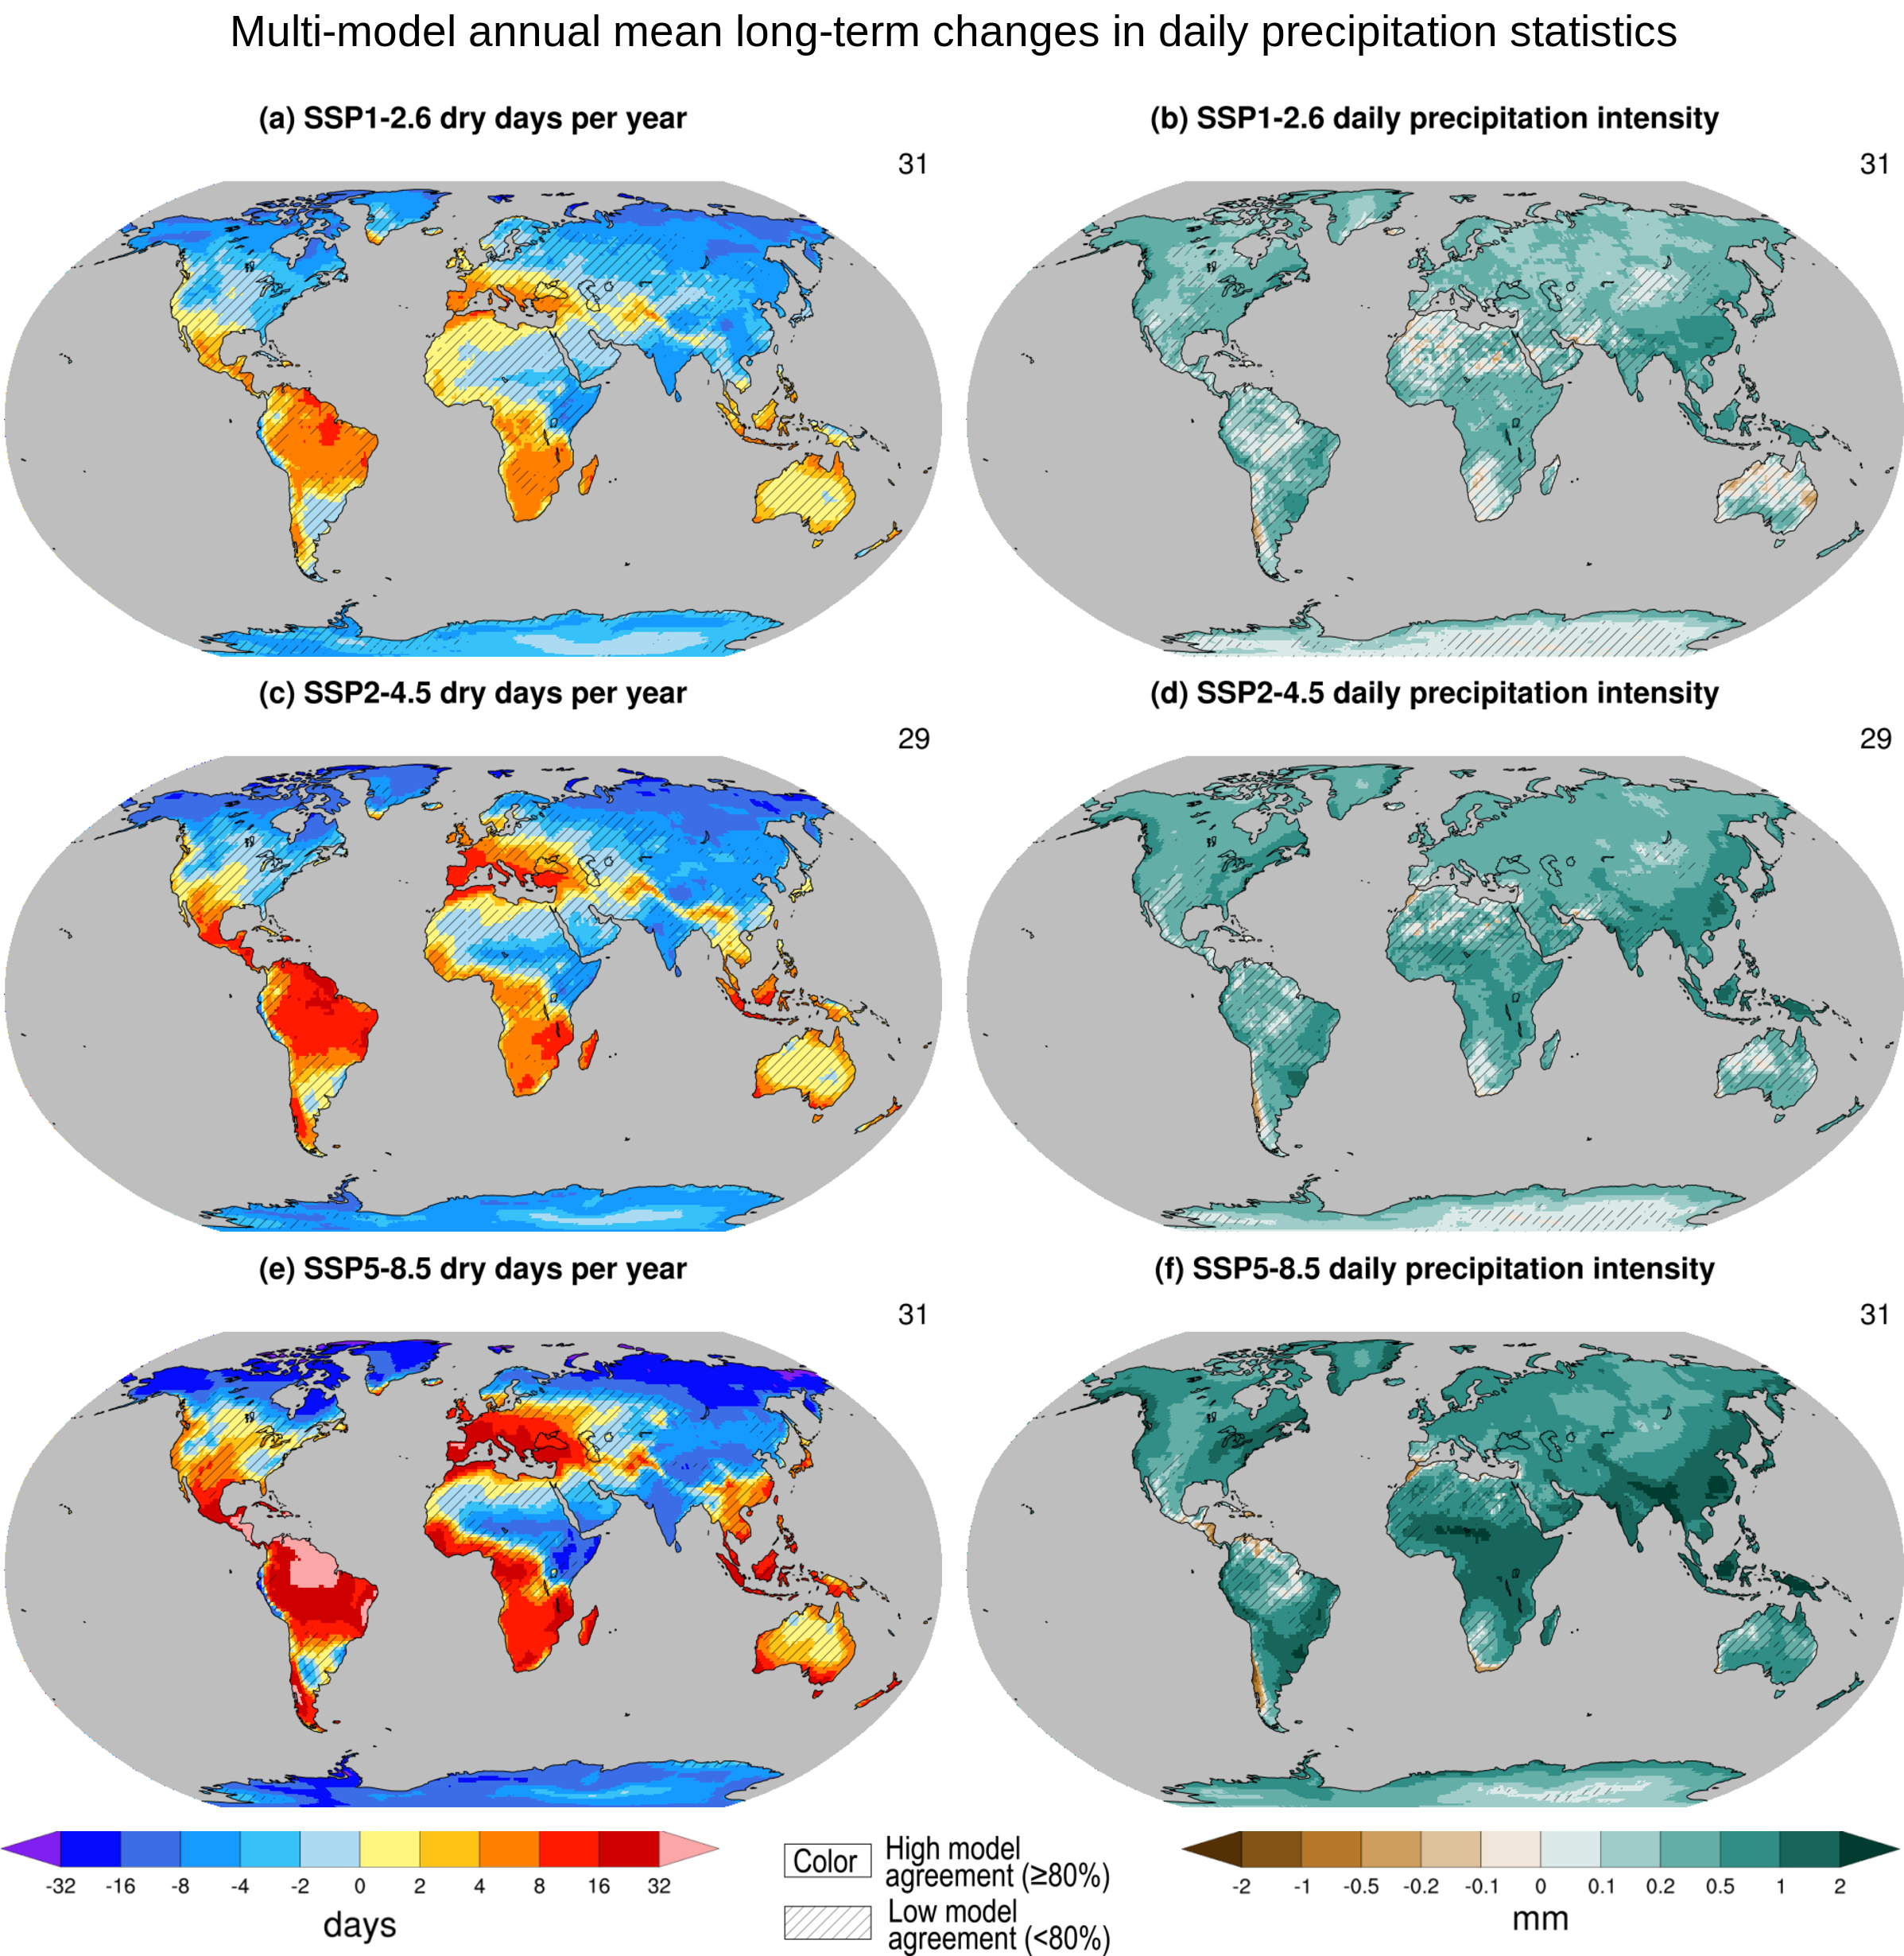
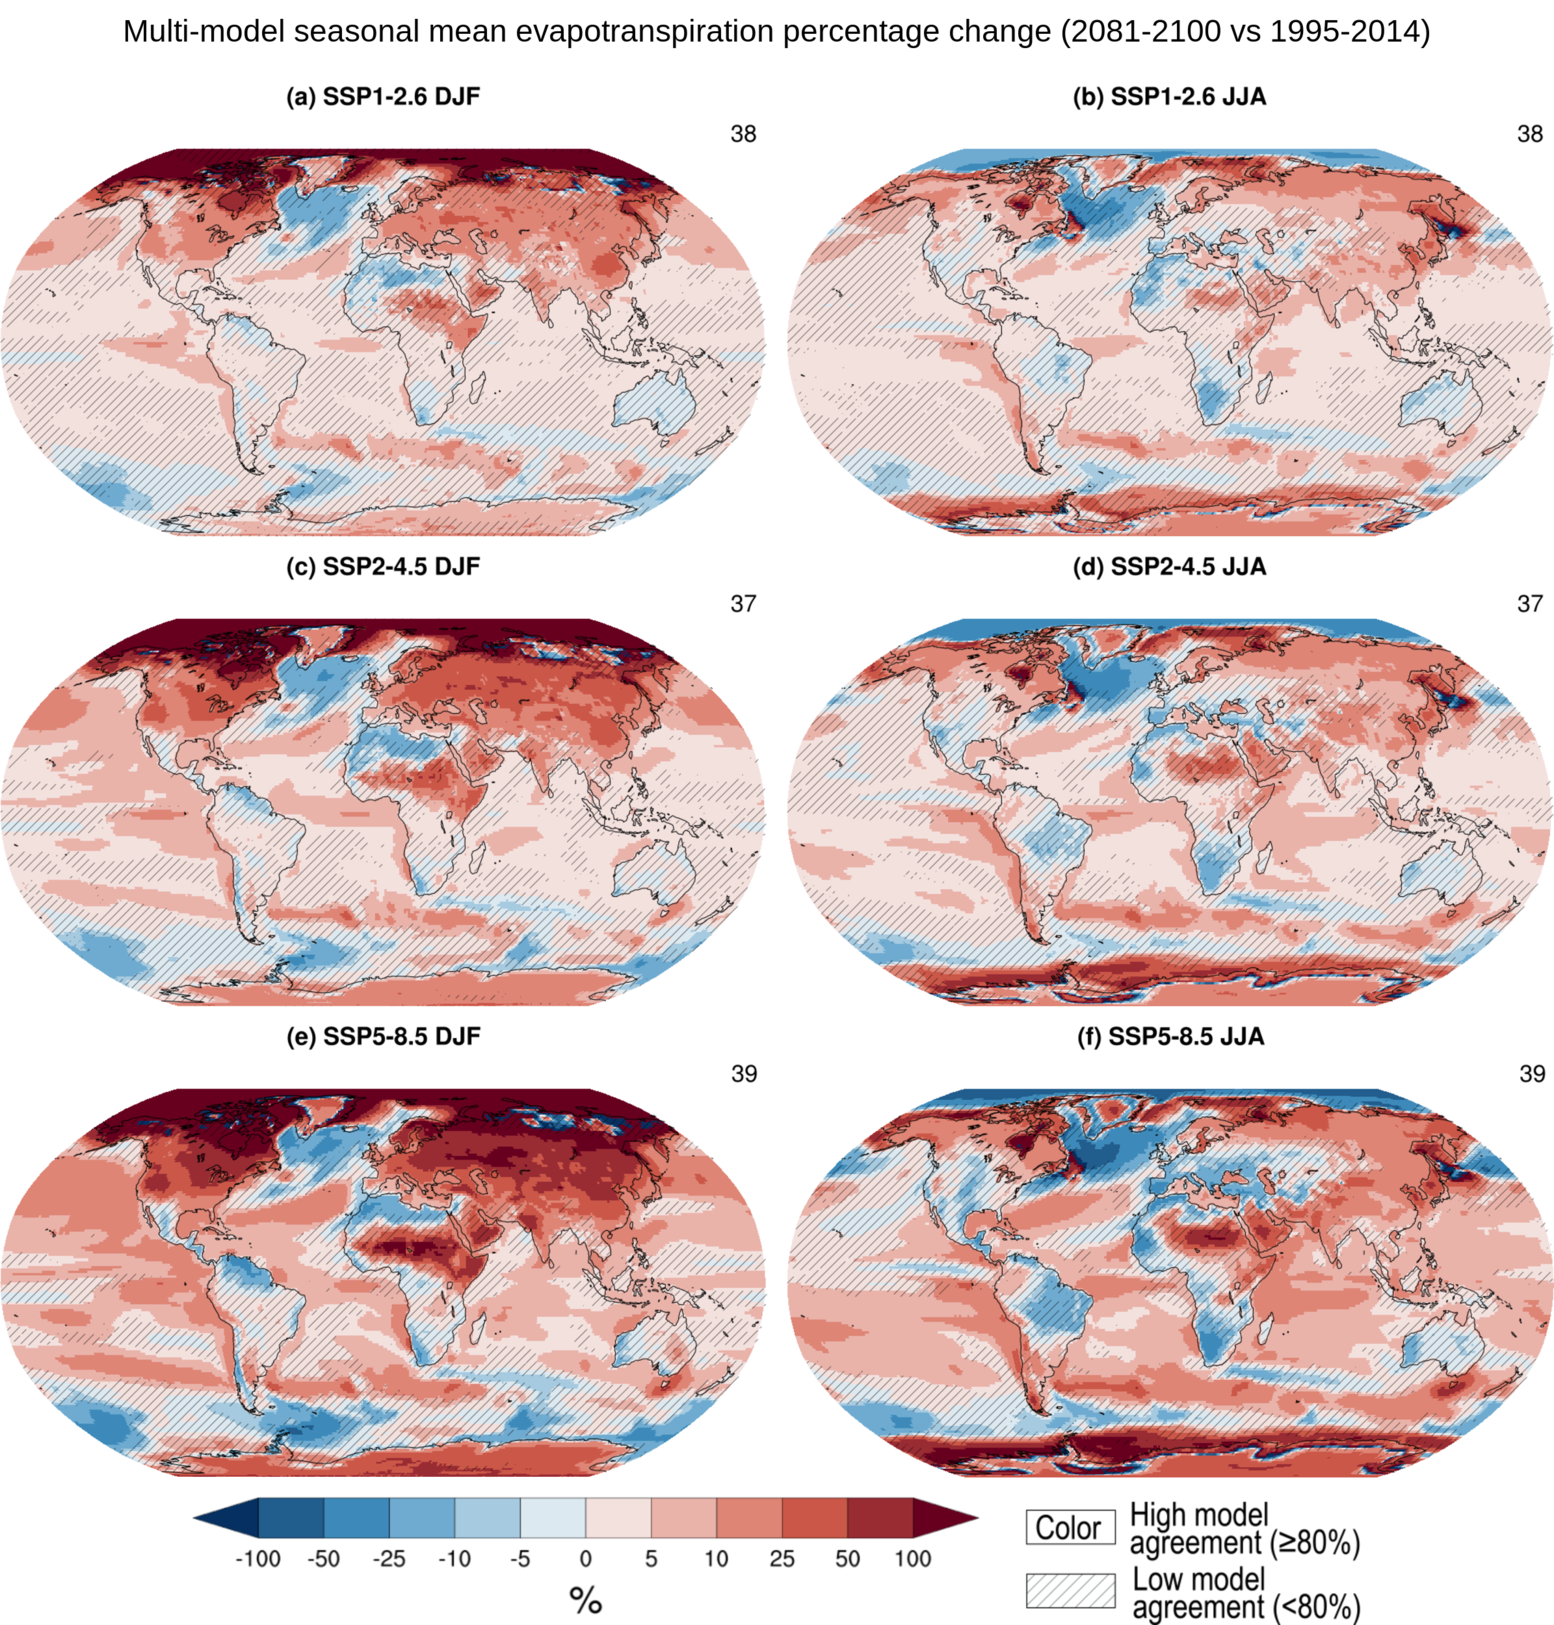
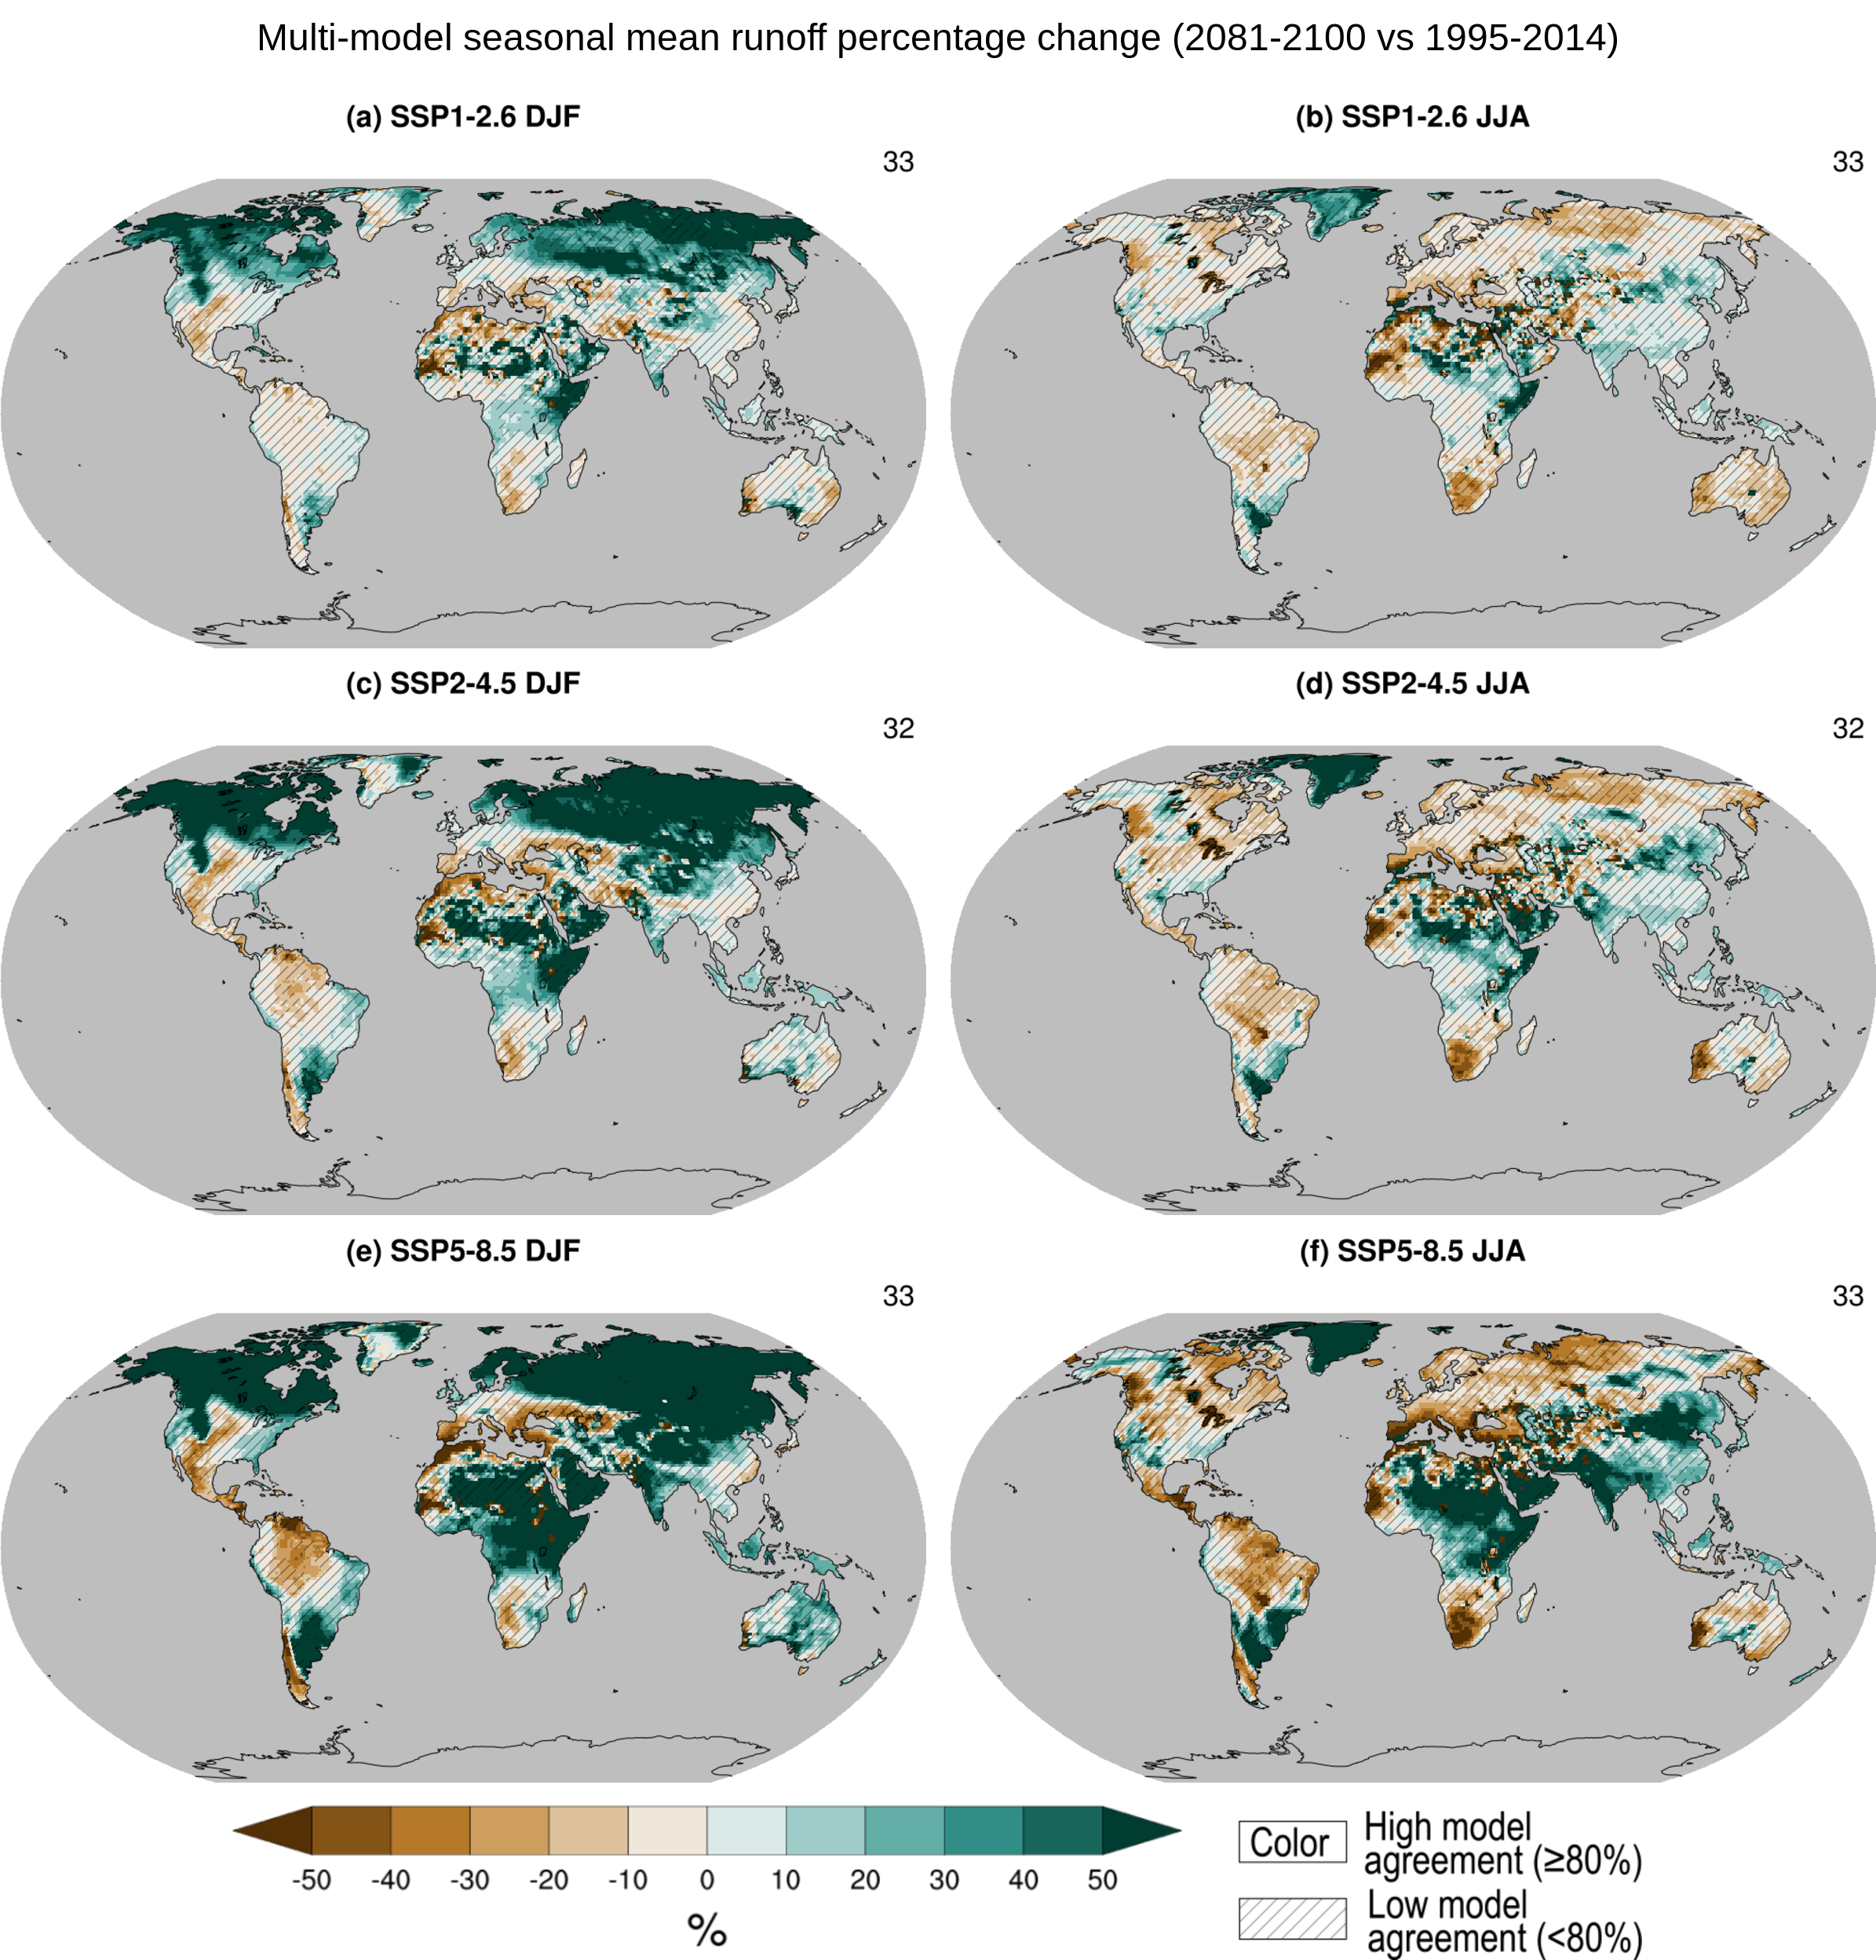
Without large-scale reduction in greenhouse gas emissions, global warming is projected to cause substantial changes in the water cycle at both global and regional scales (high confidence). Global annual precipitation over land is projected to increase on average by 2.4 [–0.2 to +4.7] % (likely range) in the SSP1-1.9 low-emissions scenario and by 8.3 [0.9 to 12.9] % in the SSP5-8.5 very high-emissions scenario by 2081–2100, relative to 1995–2014. It is virtually certain that evaporation will increase over the oceans and very likely that evapotranspiration will increase over land with regional exceptions in drying areas. There is low confidence in the sign and magnitude of projected changes in global land runoff in all Shared Socio-economic Pathway scenarios. Projected increases in precipitation amount and intensity will be associated with increased runoff in the northern high latitudes (high confidence). There is high confidence that mountain glaciers will diminish in all regions and that seasonal snow cover duration will generally decrease. Runoff from small glaciers will typically decrease through loss of ice mass, while runoff from large glaciers is likely to increase with increasing global warming until glacier mass becomes depleted (high confidence). {4.5.1, 8.4.1}
Increased evapotranspiration due to growing atmospheric water demand will decrease soil moisture over the Mediterranean, south-western North America, southern Africa, south-western South America, and south-western Australia (high confidence). In the Mediterranean, south-western South America, and western North America, future aridification will far exceed the magnitude of change seen in the last millennium (high confidence). Some tropical regions are also projected to experience increased aridity, including the Amazon basin and Central America (high confidence). {8.4.1}
Water cycle variability and extremes are projected to increase faster than average changes in most regions of the world and under all emissions scenarios (high confidence). In the tropics and in the extratropics of both hemispheres during summer/warm season, interannual variability of precipitation and runoff over land is projected to increase at a faster rate than changes in seasonal mean precipitation amount (medium confidence). It is very likely that rainfall variability related to the El Niño–Southern Oscillation will be amplified by the end of the 21st century. Sub-seasonal precipitation variability is also projected to increase, with fewer rainy days but increased daily mean precipitation intensity over many land regions (high confidence). Precipitation extremes will increase in almost all regions (high confidence), even where seasonal mean precipitation is projected to decrease (medium confidence). There is high confidence that heavy precipitation events associated with both tropical and extratropical cyclones will intensify. {4.5.1.4, 4.5.3.2, 8.2.3.2, 8.4.1, 8.4.2, 8.5.2, 11.7.1.5}
There are contrasting projections in monsoon precipitation, with increases in more regions than decreases (medium confidence). Summer monsoon precipitation is projected to increase for the South, South East and East Asian monsoon domains, while North American monsoon precipitation is projected to decrease (medium confidence). West African monsoon precipitation is projected to increase over the Central Sahel and decrease over the far western Sahel (medium confidence). There is low confidence in projected precipitation changes in the South American and Australian monsoons (for both magnitude and sign). There is high confidence that the monsoon season will be delayed in North and South America and medium confidence that it will be delayed in the Sahel. {8.2.2, 8.4.2.4}
Precipitation associated with extratropical storms and atmospheric rivers will increase in the future in most regions (high confidence). A continued poleward shift of storm tracks in the Southern Hemisphere (likely) and the North Pacific (medium confidence) will lead to similar shifts in annual or seasonal precipitation. There is low confidence in projections of blocking and stationary waves and therefore their influence on precipitation for almost all regions. {8.4.2}
The seasonality of precipitation, water availability and streamflow will increase with global warming over the Amazon (medium confidence) and in the subtropics, especially in the Mediterranean and southern Africa (high confidence). The annual contrast between the wettest and driest month of the year is likely to increase by 3–5% per 1°C in most monsoon regions in terms of precipitation, precipitation minus evaporation, and runoff (medium confidence). There is high confidence in an earlier onset in spring snowmelt, with higher peak flows at the expense of summer flows in snow-dominated regions globally, butmedium confidence that reduced snow volume in lower-latitude regions will reduce runoff from snowmelt. {8.2.2, Box 8.2, 8.4.1.7, 8.4.2.4}
Confidence in Projections, Non-linear Responses and the Potential for Abrupt Changes
Representation of key physical processes has improved in global climate models, but they are still limited in their ability to simulate all aspects of the present-day water cycle and to agree on future changes (high confidence). Climate change studies benefit from sampling the full distribution of model outputs when considering future projections at regional scales. Increasing horizontal resolution in global climate models improves the representation of small-scale features and the statistics of daily precipitation (high confidence). High-resolution climate and hydrological models provide a better representation of land surfaces, including topography, vegetation and land-use change, which improve the accuracy of simulations of regional changes in the water cycle (high confidence). There is high confidence in the potential added value of regional climate models but only medium confidence that this potential is currently realized. {8.5.1}
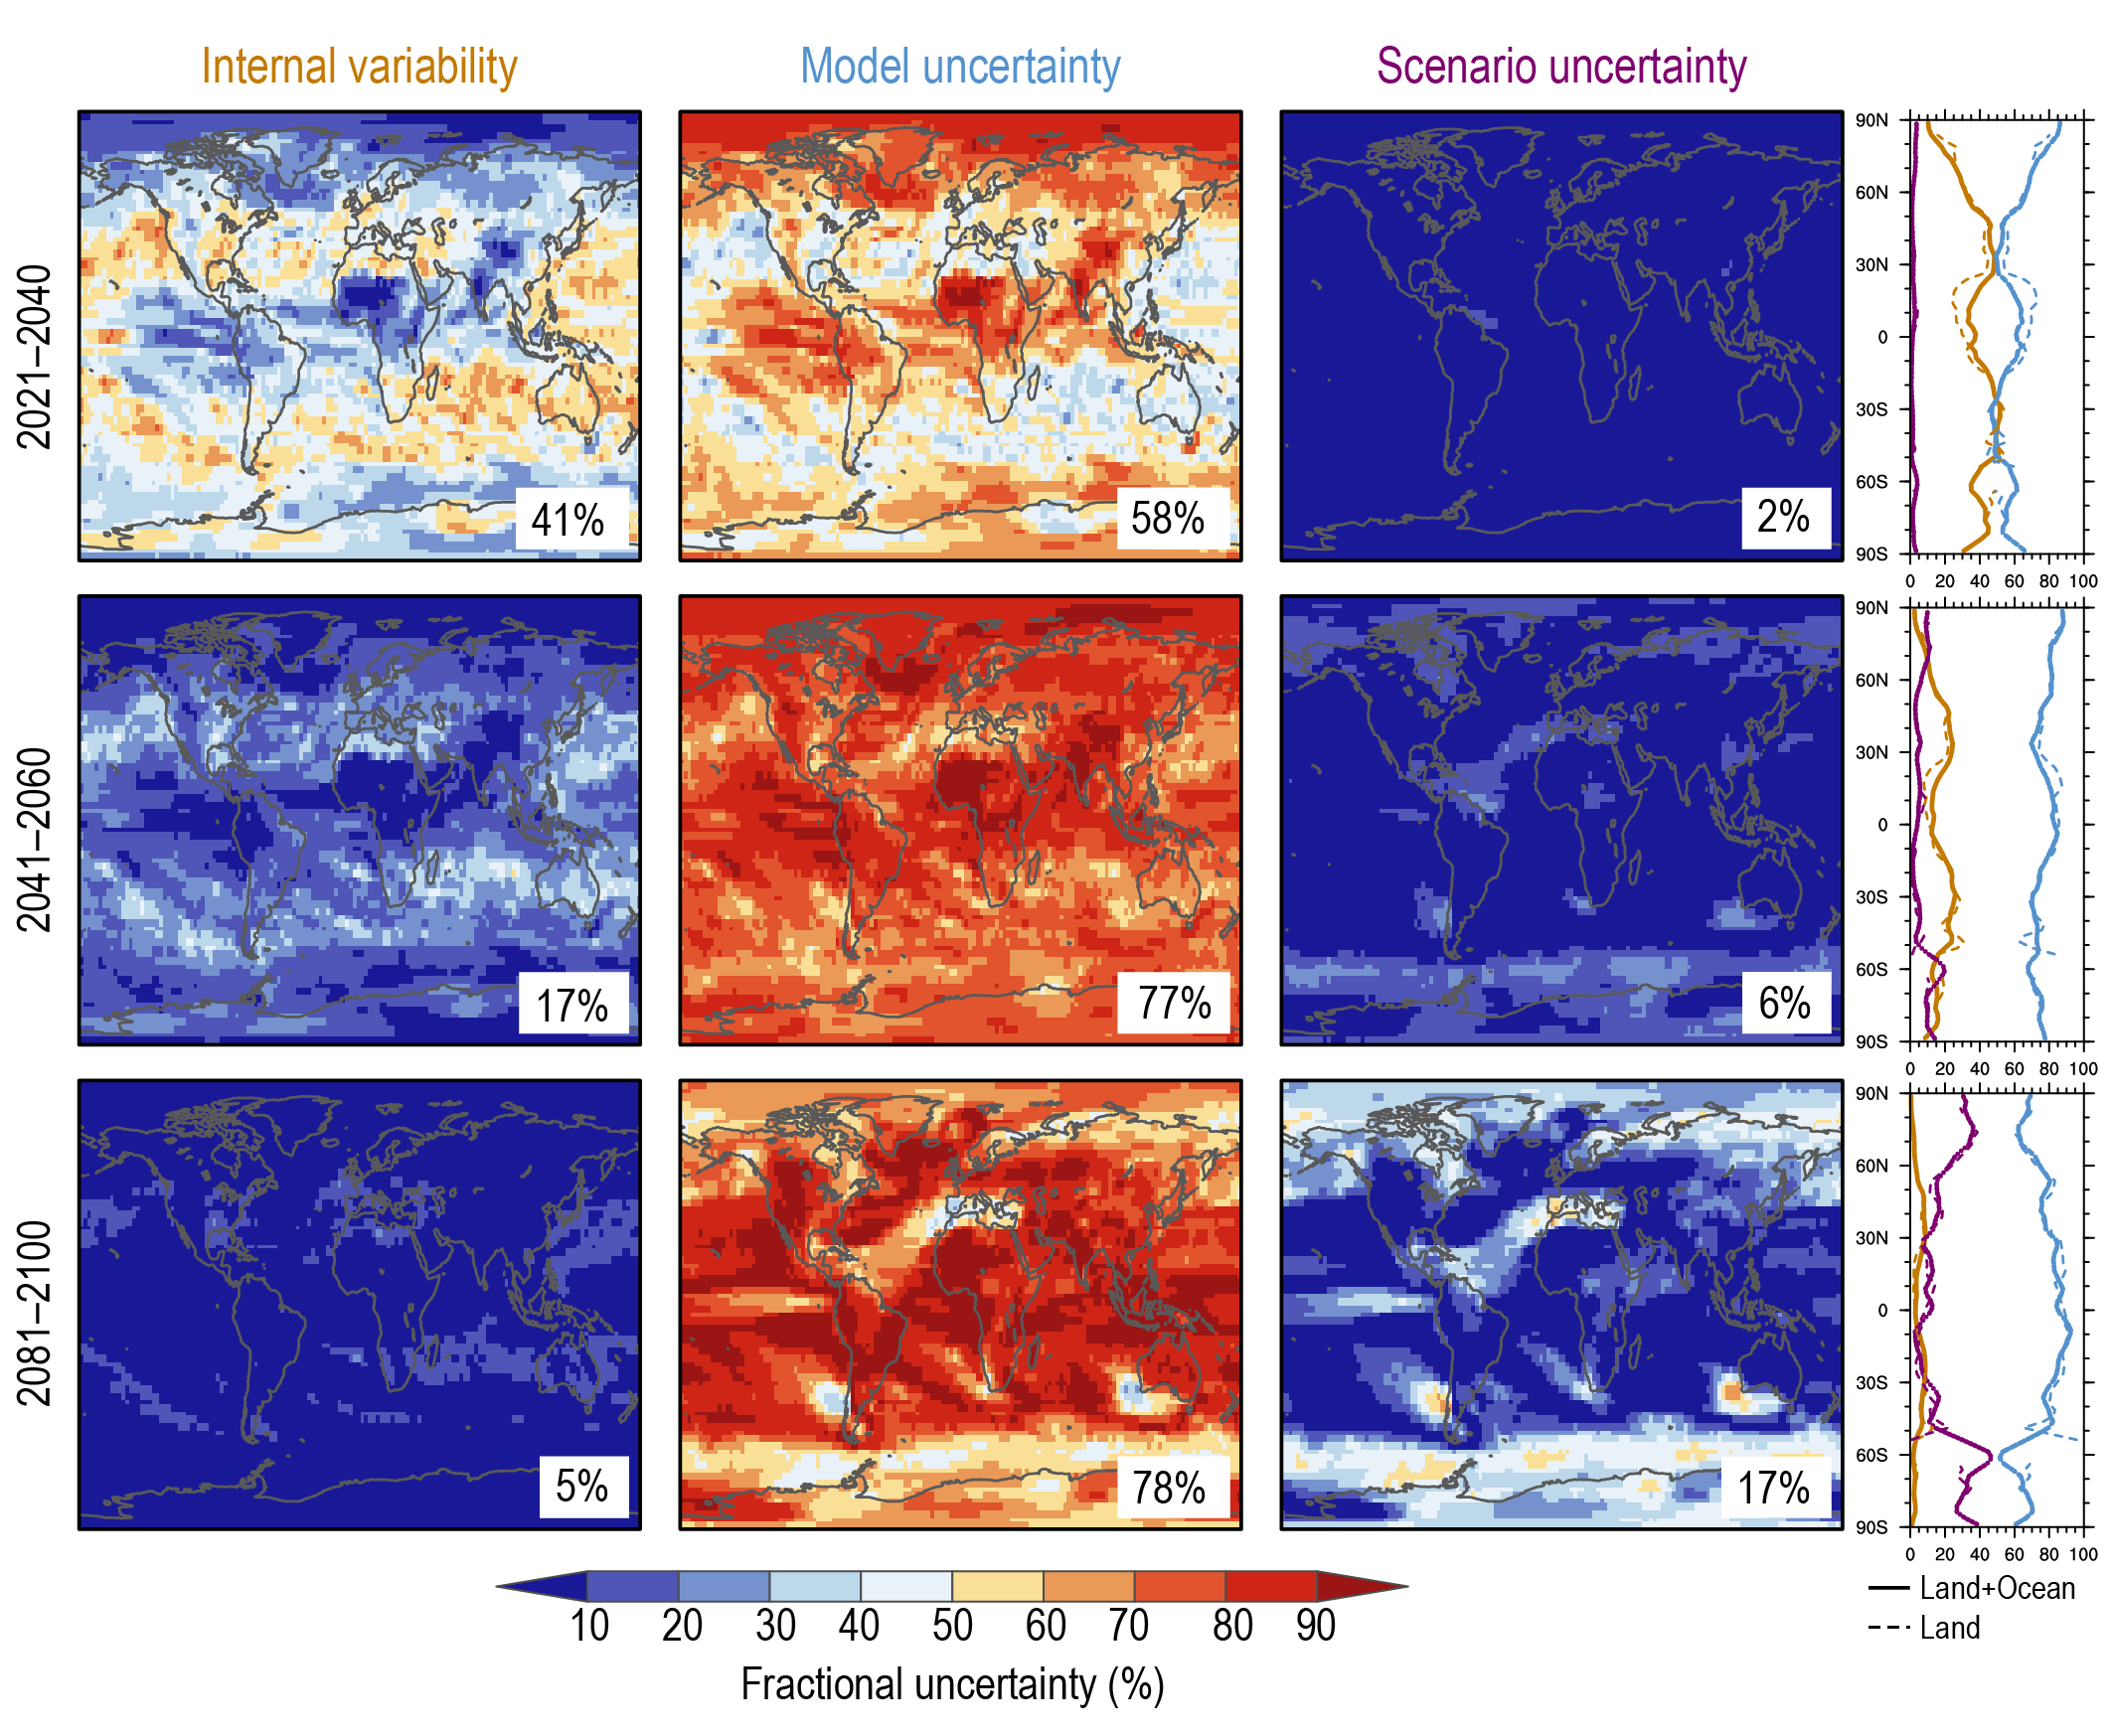
Natural climate variability will continue to be a major source of uncertainty in near-term (2021–2040) water cycle projections (high confidence). Decadal predictions of water cycle changes should be considered with low confidence in most land areas because the internal variability of precipitation is difficult to predict and can offset or amplify the forced water cycle response. Water cycle changes that have already emerged from natural variability will become more pronounced in the near term, but the occurrence of volcanic eruptions (either single large events or clustered smaller ones) can alter the water cycle for several years, decreasing global mean land precipitation and altering monsoon circulation (high confidence). {8.5.2, Cross-Chapter Box 4.1}
Continued global warming will further amplifygreenhouse gas-induced changes in large-scale atmospheric circulation and precipitation patterns (high confidence), but in some cases regional water cycle changes are not linearly related to global warming. Non-linear water cycle responses are explained by the interaction of multiple drivers, feedbacks and time scales (high confidence). Non-linear responses of regional runoff, groundwater recharge and water scarcity highlight the limitations of simple pattern-scaling techniques (medium confidence). Water resources fed by melting glaciers are particularly exposed to non-linear responses (high confidence). {8.5.3}
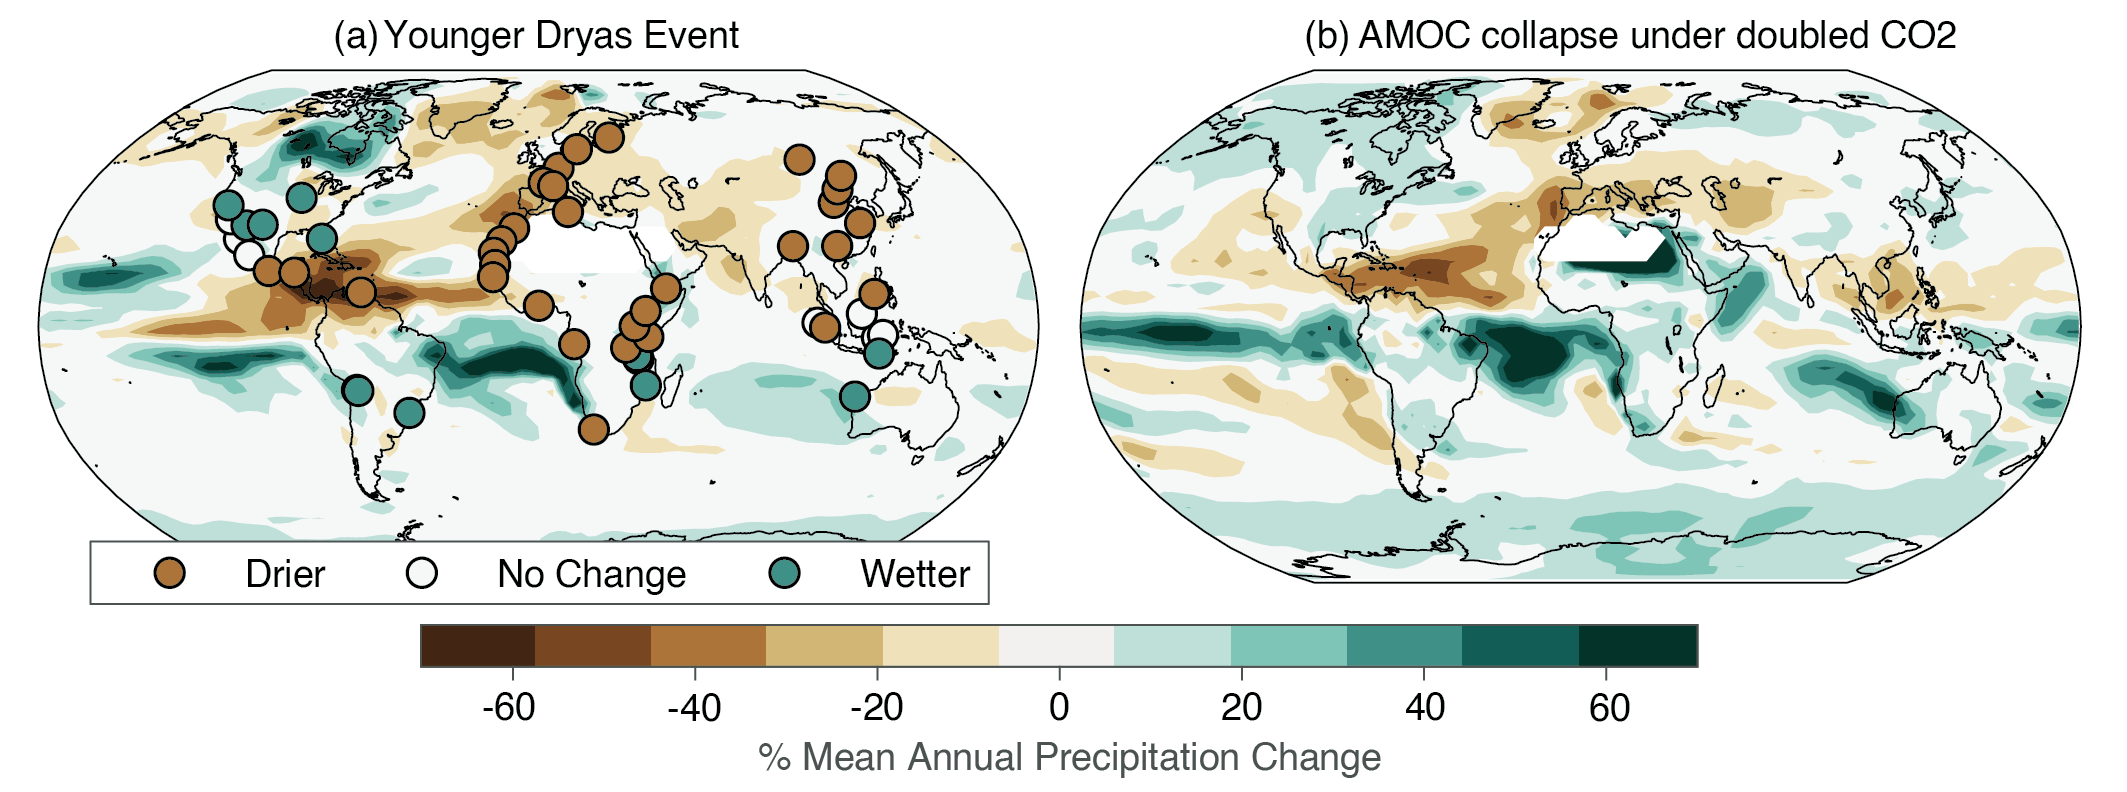
Abrupt human-caused changes to the water cycle cannot be excluded. There is evidence of abrupt change in some high-emissions scenarios, but there is no overall consistency regarding the magnitude and timing of such changes. Positive land surface feedbacks, including vegetation and dust, can contribute to abrupt changes in aridity, but there is onlylow confidence that such changes will occur during the 21st century. Continued Amazon deforestation, combined with a warming climate, raises the probability that this ecosystem will cross a tipping point into a dry state during the 21st century (low confidence). The paleoclimate records show that a collapse in the Atlantic Meridional Overturning Circulation (AMOC) causes abrupt shifts in the water cycle (high confidence), such as a southward shift in the tropical rain belt, weakening of the African and Asian monsoons, strengthening of Southern Hemisphere monsoons, and drying in Europe. There is medium confidence that AMOC will not collapse before 2100, but should it collapse, it is very likely that there would be abrupt changes in the water cycle. {8.6.1, 8.6.2}
Solar radiation modification could drive abrupt changes in the water cycle (high confidence). It is very likely that abrupt water cycle changes will occur if solar radiation modification (SRM) techniques are implemented rapidly or terminated abruptly. The impact of SRM is spatially heterogeneous (high confidence), will not fully mitigate the greenhouse gas-forced water cycle changes (medium confidence), and can affect different regions in potentially disruptive ways (low confidence). {8.6.3}
8.1 Introduction
8.1.1 Scope and Overview
8.1.1.1 Importance of Water for Human Societies and Ecosystems
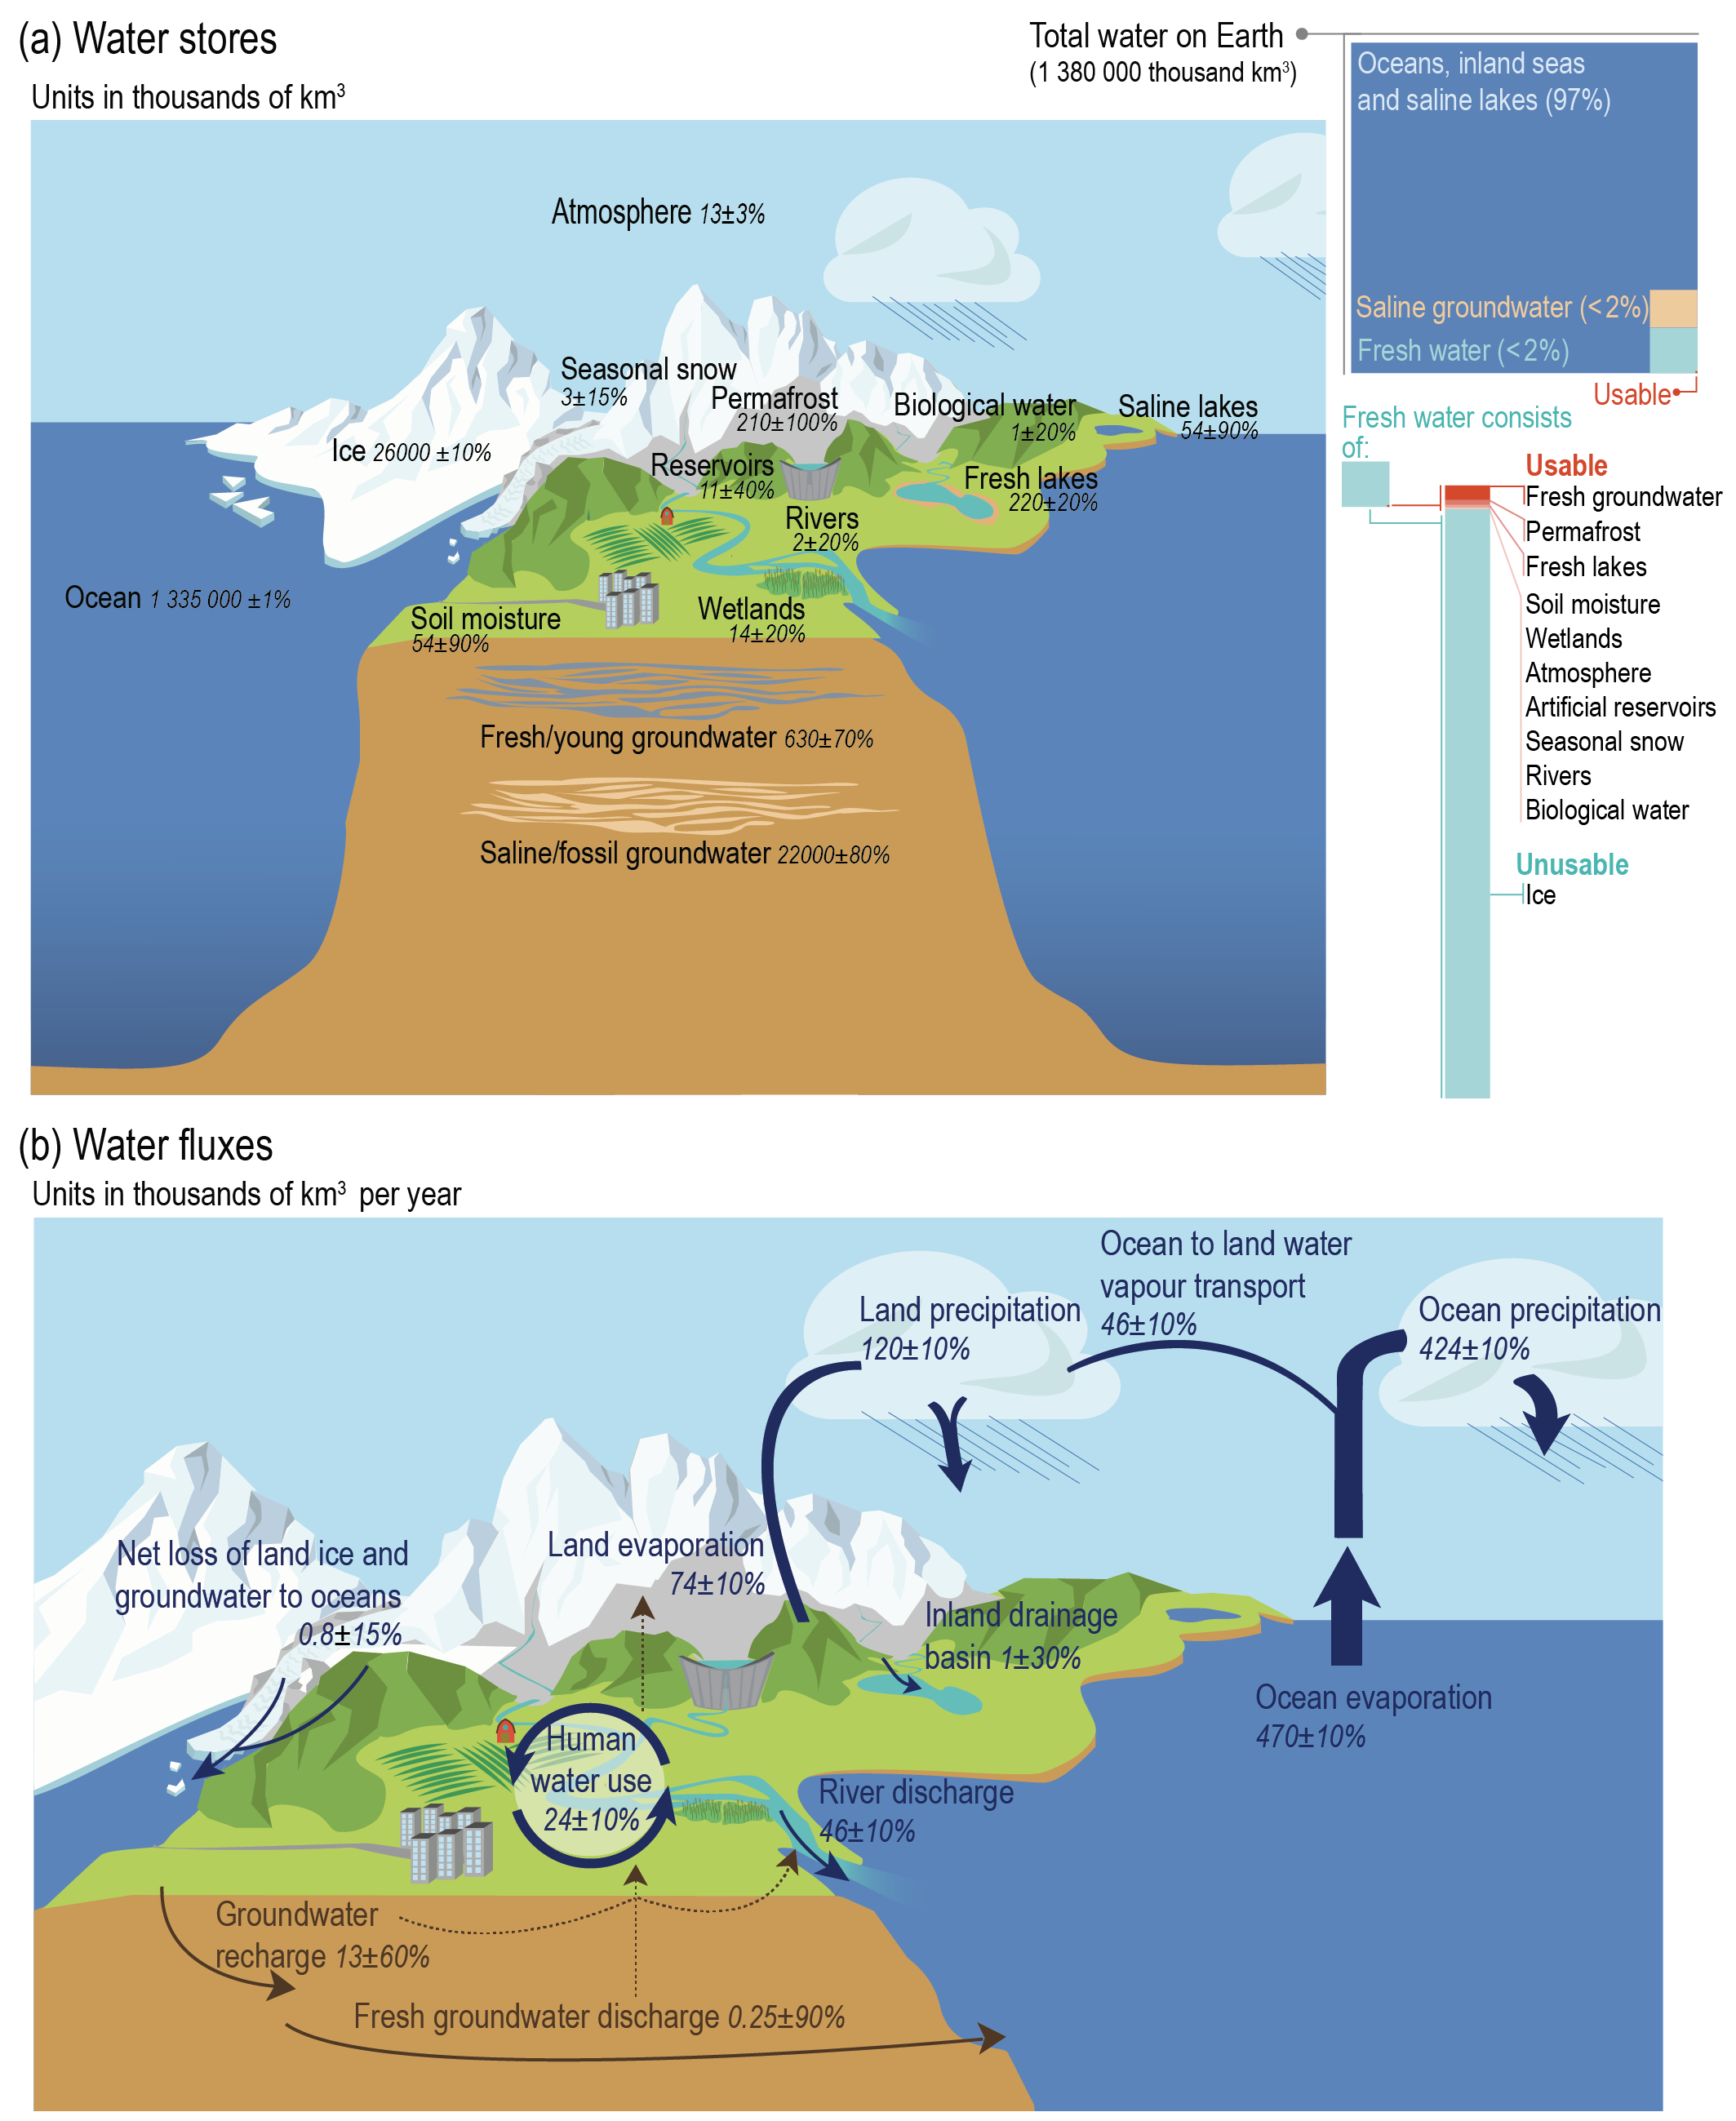
Water is vital to all life on Earth. Seventy-one percent of the Earth is covered by water, with saline ocean water accounting for around 97% of total water availability (Figure 8.1). Terrestrial freshwater represents less than 2% of all water on Earth, and the remainder (around 1–2%) is primarily made up of saline groundwater and saline lakes (Durack, 2015; Abbott et al., 2019). Ice sheets, glaciers and snow pack account for approximately 96% of all freshwater, with less than 4% of freshwater considered easily accessible and available for essential ecosystem functioning and human society’s water resource needs (Durack, 2015; Abbott et al., 2019). This very small fraction of freshwater represents a total volume of about 835,000 km3, mostly contained in groundwater (630,000 km3), the remaining 205,000 km3being stored in lakes, rivers, wetlands and soils (Abbott et al., 2019). Although the natural cycling rate of this amount is theoretically enough to meet global human and ecosystem needs, there are large geographical and seasonal differences that influence the availability of freshwater to meet regional demands.
Freshwater is the most essential natural resource on the planet (Mekonnen and Hoekstra, 2016; Djehdian et al., 2019) and underpins almost all Sustainable Development Goals (SDGs), which require access to adequate and safe resources for drinking and sanitation (SDG 6) and many other purposes. Freshwater supports a range of human activities from irrigation to industrial processes including the generation of hydro-electricity and the cooling of thermoelectric power plants (Bates et al., 2008; Schewe et al., 2014). These activities require sufficient quantities of freshwater that can be drawn from rivers, lakes, groundwater stores, and in some cases, desalinated sea water (Schewe et al., 2014). Recent estimates of global water pools and fluxes suggest that half of global river discharge is redistributed each year by human water use (Abbott et al., 2019). This emphasizes the need to consider both anthropogenic climate change and direct human influences, such as population increase or migration, economic development, urbanization, and land use change, when planning water-related mitigation or adaptation strategies (Jiménez Cisneros et al., 2014).
Water scarcity occurs when there are insufficient freshwater resources to meet water demands, although water problems may also arise from water quality issues or from economic and institutional barriers (AR6 WGII Chapter 4). This affects the preservation of environmental flows that ultimately influence ecosystem functioning and services (Schewe et al., 2014; Mekonnen and Hoekstra, 2016; Djehdian et al., 2019). As such, water availability is a major constraint on human society’s ability to meet the future food and energy needs of a growing population (D’Odorico et al., 2018). Water plays a key role in the production of energy, including hydro-electricity, bioenergy, and the extraction of unconventional fossil fuels (Schewe et al., 2014; D’Odorico et al., 2018; Djehdian et al., 2019). These dependencies have resulted in increasing competition for water between the food and energy sectors. Pressures on this ‘food-energy-water nexus’ are further compounded by increasing globalization, which can transfer large-scale water demands to other regions of the world, raising serious concerns about local food and water security in regions that are highly dependent on agricultural exports or imports (D’Odorico et al., 2018).
The consequences of climate change on terrestrial ecosystems and human societies are primarily experienced through changes to the global water cycle (JiménezCisneros et al., 2014). Changes in the quantity and seasonality of water due to climate change have long been recognized by IPCC and global development agencies as heavily influencing the food security and economic prosperity of many countries, particularly in the arid and semi-arid areas of the world including Asia, Africa, Australia, Latin America, the Mediterranean, and small island developing states (Bates et al., 2008; Schewe et al., 2014; Mekonnen and Hoekstra, 2016). Having too much or too little water increases the likelihood of flooding and drought, as precipitation variability increases in a warming climate (Stockeret al., 2013; Hoegh-Guldberg et al., 2018). Climate change poses a threat to both regional water availability and global water security. Changes in precipitation and glacier runoff and snowmelt influence other hydroclimate variables like surface and subsurface runoff, and groundwater recharge, which are critical to the water, food and energy security of many regions (Oki andKanae, 2006; Jiménez Cisneros et al., 2014; Schewe et al., 2014; Mekonnen and Hoekstra, 2016).
Currently, around four billion people live under conditions of severe freshwater scarcity for at least one month of the year, with half a billion people in the world facing severe water scarcity all year round (Mekonnen and Hoekstra, 2016). The AR5 WGII reported that approximately 80% of the world’s population already suffers from high levels of threat to water security (Jiménez Cisneros et al., 2014). Given the vulnerability of the planet’s freshwater resources and the role of climate change in intensifying adverse impacts on human societies and ecosystems (Hoegh-Guldberg et al., 2018; IPCC, 2018), this chapter evaluates advances in the theoretical, observational and model based understanding of the global water cycle made since AR5 (IPCC, 2013) and AR6 Special Reports.
8.1.1.2 Overview of the Global Water Cycle in the Climate System
As shown in Figure 8.1, the global water cycle is the continuous, naturally occurring movement of water through the climate system from its liquid, solid and gaseous forms among reservoirs of the ocean, atmosphere, cryosphere and land (Stocker et al., 2013). In the atmosphere, water primarily occurs as a gas (water vapour), but it is also present as ice and liquid water within clouds where it substantially affects Earth’s energy balance (Sections 7.4.2.2 and 7.4.2.4). The water cycle primarily involves the evaporation1 and precipitation of moisture at the Earth’s surface including transpiration associated with biological processes. Water that falls on land as precipitation, supplying soil moisture, groundwater recharge, and river flows, was once evaporated from the ocean or sublimated from ice-covered regions before being transported through the atmosphere as water vapour, or in some areas was generated over land through evapotranspiration (Gimeno et al., 2010; van der Ent and Savenije, 2013). In addition, the net flux of atmospheric and continental freshwater is a key driver of sea surface salinity, which in turn influences the density and circulation of the ocean (Chapter 9).
 Figure 8.1 | Depiction of the present-day water cycle based on previous assessments (Trenberth et al., 2011; Rodell et al., 2015; Abbott et al., 2019) with adjustments for groundwater flows (Zhou et al., 2019c; Luijendijk et al., 2020), seasonal snow (Pulliainen et al., 2020) and ocean precipitation and evaporation (Stephens et al., 2012; Allan et al., 2020; Gutenstein et al., 2021). The net loss of frozen and liquid water from land to ocean is estimated from Chapter 9, Table 9.5. In the atmosphere, which accounts for only 0.001% of all water on Earth, water primarily occurs as a gas (water vapour), but it is also present as ice and liquid water within clouds. The ocean is the primary water reservoir on Earth: it comprises mostly liquid water across much of the globe but also includes areas covered by ice in polar regions. Liquid freshwater on land forms surface water (lakes, rivers) and, together with soil moisture and mostly unusable groundwater stores, accounts for less than 2% of global water (Stocker et al., 2013). Solid terrestrial water that occurs as ice sheets, glaciers, snow and ice on the surface, and permafrost currently represents nearly 2% of the planet’s water (Stocker et al., 2013). Water that falls as snow in winter provides soil moisture and streamflow after melting, which are essential for human activities and ecosystem functioning. Note that these best estimates do not lead to a perfectly closed global water budget and that this budget has no reason to be closed given the ongoing human influence through both climate change (e.g., melting of ice sheets and glaciers, see Chapter 9) and water use (e.g., groundwater depletion through pumping into fossil aquifers, see Figure 8.10).
 Understanding the interactions between the water and energy cycles is one of the four core projects of the World Climate Research Programme (WCRP). Latent heat fluxes, released by condensation of atmospheric water vapour and absorbed by evaporative processes, are critical to driving the circulation of the atmosphere on scales ranging from individual thunderstorm cells to the global circulation of the atmosphere (Stocker et al., 2013; Miralles et al., 2019). Water vapour is the most important gaseous absorber in the Earth’s atmosphere, playing a key role in the Earth’s radiative budget (Schneider et al., 2010). As atmospheric water vapour content increases with temperature, it has a considerable influence on climate change (Section 7.4.2.2). Additionally, a small fraction of the atmospheric water content is liquid or solid and has a major effect on both solar and longwave radiative fluxes, from the Earth’s surface to the top of the atmosphere. The cloud response to anthropogenic radiative forcings, both in the tropics and in the extratropics (Zelinka et al., 2020), is therefore also crucial for understanding climate change (Section 7.4.2.4).
The terrestrial water and carbon cycles are also strongly coupled (Cross-Chapter Box 5.1). As atmospheric carbon dioxide (CO2) concentration increases, the physical environment in which plants grow is altered, including the availability of soil moisture necessary for plants’ CO2 uptake and, potentially, the effectiveness of CO2 removal techniques to mitigate climate change (Section 5.6.2.1.2). Rising surface CO2 concentrations also modify stomatal (small pores at the leaf surface) regulation as well as the plants’ biomass, thus affecting ecosystem photosynthesis and transpiration rates and leading generally to a net increase in water use efficiency (Lemordant et al., 2018). These coupled changes have profound implications for the simulation of the carbon and water cycles (Gentine et al. , 2019; see also Section 5.4.1), which can be better assessed with the new generation Earth system models, although both the carbon concentration and carbon-climate feedbacks remain highly uncertain over land Section 5.4.5; Arora et al., 2020). The water constraints on the terrestrial carbon sinks are a matter of debate regarding the feasibility or efficiency of some land-based CO2 removal and sequestration techniques requested to comply with the Paris Agreement (Section5.6.2.2.1; Fuss et al. , 2018; Belyazid and Giuliana, 2019).
8.1.2 Summary of Water Cycle Changes From AR5 and Special Reports
This Report is the first IPCC assessment to include a chapter specifically dedicated to providing an integrated assessment of the global water cycle changes, by building on many chapters from previous reports. This section summarizes observed and projected water cycle changes reported in AR5(IPCC, 2013) and in the recent IPCC Special Reports on Global Warming of 1.5°C (SR1.5), the Ocean and Cryosphere in a Changing Climate (SROCC), and Climate Change and Land (SRCCL).
8.1.2.1 Summary of Observed and Projected Water Cycle Changes from AR5
Based on long-term observational evidence (Hartmann et al., 2013), AR5 concluded it was likely that anthropogenic influence has affected the water cycle since the 1960s (IPCC, 2018). Detectable human influence on changes to the water cycle were found in atmospheric moisture content (medium confidence), global-scale changes of precipitation over land (medium confidence), intensification of heavy precipitation events over land regions where sufficient data networks exist (medium confidence), and very likely changes to ocean salinity through its connection with evaporation minus precipitation change patterns (Sections 2.5, 2.6, 3.3, 7.6, 10.3 and 10.4; Stocker et al., 2013). The AR5 also reported that it is very likely that global surface air specific humidity increased since the 1970s. There was low confidence in the observations of global-scale cloud variability and trends, medium confidence in reductions of pan-evaporation, and medium confidence in the non-monotonic changes of global evapotranspiration since the 1980s. In terms of streamflow and runoff, AR5 identified that there is low confidence in the observed increasing trends of global river discharge during the 20th century. Similarly, AR5 concluded that there is low confidence in any global-scale observed trend in drought or dryness (lack of rainfall) since the mid-20th century. Yet, the frequency and intensity of drought likely increased in the Mediterranean and West Africa, while theylikely decreased in central North America and north-western Australia since 1950.
Water cycle projections in AR5 (Collins et al., 2013) were considered primarily in terms of water vapour, precipitation, surface evaporation, runoff, and snowpack. Globally-averaged precipitation was projected to increase with global warming with virtual certainty (Chapter 12 Executive Summary and Section 12.4.1.1). Regionally, precipitation in some areas of the tropics and polar regions could increase by more than 50% by the end of the 21st century under the RCP8.5 emissions scenario, while precipitation in large areas of the subtropics could decrease by 30% or more (AR5 FAQ 12.2, Figure 12.22). Overall, the contrast of annual mean precipitation between dry and wet regions and between dry and wet seasons (‘wet get wetter, dry get drier’) was projected to increase over most of the globe with high confidence (Chapter 12 Executive Summary and Section 12.4.5.2). Globally, the frequency of intense precipitation events was projected to increase while the frequency of all precipitation events was projected to decrease, leading to the contradictory-seeming projection of a simultaneous increase in both droughts and floods (12.2 and Section 12.4.5.5 in AR5 WGI). Surface evaporation change was projected to be positive over most of the ocean and to generally follow the pattern of precipitation change over land Chapter 12 Executive Summary, and Section 12.4.5.4). Near-surface relative humidity reductions over many land areas were projected to be likely , with medium confidence (Section 12.4.5.1). General decreases in soil moisture in present-day dry regions were considered likely , and projected with medium confidence under the RCP8.5 scenario (Section 12.4.5.3). Soil moisture drying in the Mediterranean, south-west USA and southern African regions was considered likely , with high confidence by the end of this century under the RCP8.5 scenario (Section 12.4.5.3). Projections for annual runoff included both decreases and increases. Decreases in Northern Hemisphere snow cover were assessed as very likely with continued global warming (Section 12.4.6.2). As temperatures increase, snow accumulation was projected to begin later in the year and melting to start earlier, with related changes in snowmelt-driven river flows (FAQ 12.2 and Section 12.4.6.2 in AR5 WGI). In terms of the potential for abrupt change in components of the water cycle, long-term droughts and monsoonal circulation were identified as potentially undergoing rapid changes, but the assessment was reported with low confidence (Sections 12.5.5.8.1 and 12.5.5.8.2, and Table 12.4).
8.1.2.2 Key Findings of AR6 Special Reports
The SR1.5 assessed the impacts of global warming of 1.5°C above pre-industrial levels. The dominant human influence on observed global warming and related water cycle changes was confirmed. Further evidence that anthropogenic global warming has caused an increase in the frequency, intensity and/or amount of heavy precipitation events at the global scale (medium confidence), as well as in drought occurrence in the Mediterranean region (medium confidence) was also reported. Chapter 3 of SR1.5 (Hoegh-Guldberg et al., 2018) highlights that each half degree of additional global warming influences the climate response. Heavy precipitation shows a global tendency to increase more at 2°C compared to 1.5°C, though there is low confidence in projected regional differences in heavy precipitation at 1.5°C compared to 2°C global warming, except at high latitudes or at high altitude where there is medium confidence. A key finding is that ‘limiting global warming to 1.5°C compared to 2°C would approximately halve the proportion of the world population expected to suffer water scarcity, although there is considerable variability between regions (medium confidence)’ (SR1.5). This is consistent with greater adverse impacts found at 2°C compared to 1.5°C for a number of dryness or drought indices (Schleussner et al., 2016; Lehner et al., 2017; Greve et al., 2018). There is also medium confidence that land areas with increased runoff and exposure to flood hazards will increase more at 2°C compared to 1.5°C of global warming.
The Special Report on the Ocean and Cryosphere in a Changing Climate (SROCC) provides a comprehensive assessment of recent and projected changes, specifically in snow and ice-covered areas that form a key component of the water cycle in high-elevation and high-latitude areas. High mountain regions have experienced significant warming since the early 20th century, resulting in reduced snowpack on average (Marty et al., 2017), with glaciers retreating globally since the mid-20th century (Marzeion et al., 2018; Zemp et al., 2019). Glacier shrinkage and snow cover changes have led to changes (both increases and decreases) in streamflow in many mountain regions in recent decades (Milner et al., 2017). Permafrost regions have undergone degradation and ground-ice loss due to recent warming (Lu et al., 2017). Glacier mass loss is projected to continue through the 21st century under all scenarios. In high mountain areas, low-elevation snow cover is also projected to decrease, regardless of emissions scenario. Widespread permafrost thaw is projected to continue through this century and beyond. River runoff in snow- or glacier-fed basins is projected to increase in winter and to decrease in summer (and in the annual mean) by 2100. In the oceans, the Atlantic Meridional Overturning Circulation (AMOC) will very likely weaken over the 21st century under all emissions scenarios (SROCC), with potential effects on atmospheric circulation and the water cycle at the regional scale (see also Section 8.6).
The Special Report on climate change, desertification, land degradation, sustainable management, food security, and greenhouse gas (GHG) fluxes in terrestrial ecosystems (SRCCL) has clear connections with the water cycle. This Report indicates that since 1850–1900, land surface temperature has risen nearly twice as much as global surface temperature (high confidence), with an increase in dry climates (high confidence). Land surface processes modulate the likelihood, intensity and duration of many extreme events including droughts (medium confidence) and heavy precipitation (medium confidence). The direction and magnitude of hydrological changes induced by land use change and land surface feedbacks vary with location and season (high confidence). Desertification exacerbates climate change through feedbacks involving vegetation cover, greenhouse gases and mineral dust aerosol (high confidence). Urbanization increases extreme rainfall events over or downwind of cities (medium confidence). Intensification of rainy events increase their consequences on land degradation.
8.1.3 Chapter Motivations, Framing and Preview
The AR5 report was a major step forward in the assessment of the human influence on the Earth’s water cycle, yet regional projections of precipitation and water resources often remained very uncertain for a range of reasons including modelling uncertainty and the large influence of internal variability (Sections 1.4.3 and 8.5.2; Hawkins and Sutton, 2011; Deser et al. , 2012). Since AR5, longer and more homogeneous observational and reanalysis datasets have been produced along with new ensembles of historical simulations driven by all or individual anthropogenic forcings. These factors, together with improved detection-attribution tools, has enabled a more comprehensive assessment and a better understanding of recent observed water cycle changes, including the competing effects of GHGs and aerosol emissions. New paleoclimate reconstructions have been also developed, particularly from the SH, that were not available at the time of AR5. There have also been advances in modelling clouds, precipitation, surface fluxes, vegetation, snow, floodplains, groundwater and other processes relevant to the water cycle. Convection permitting and cloud-resolving models have been implemented over increasingly large domains and can be used as benchmarks for the evaluation of the current-generation climate models. The added value of increased resolution in global or regional climate models can be also assessed more thoroughly based on dedicated model intercomparison projects (Sections 10.3.3 and 8.5.1). Ongoing research activities on decadal predictions and observational constraints are aimed at narrowing the plausible range of near-term (2021–2040) to long-term (2081–2100) water cycle changes.
This chapter assesses water cycle changes and considers climate change from the perspective of its effects on water availability (including streamflow and soil moisture, snow mass and glaciers, groundwater, wetlands and lakes) rather than only precipitation. The chapter highlights the sensitivity of the water cycle to multiple drivers and the complexity of its responses, depending on regions, seasons and time scales. Anthropogenic drivers include not only emissions of GHGs but also different species of aerosols, land and water management practices. Emphasis is placed on assessing the full range of projections, including ‘low likelihood, high impact’ climate trajectories such as the potential for abrupt changes in the water cycle.
The chapter starts with theoretical evidence that link small-scale processes and drivers, as well as global energy budget and large-scale circulation constraints to physically-understood changes in the global water cycle (Section 8.2). Observed and projected water cycle changes (Sections 8.3 and 8.4, respectively) are assessed in separate sections, but with a parallel structure to facilitate comparison of a specific topic across sections. Projections are primarily assessed on the basis of contrasted emissions scenarios to emphasize the water cycle response to mitigation. Unless otherwise specified, projected anomalies are estimated relative to the 1995–2014 baseline climatology and are assessed over 20-year time slices, 2021–2040, 2041–2060 and 2081–2100 for near-, mid- and long-term changes respectively. Beyond multi-model ensemble means, model response uncertainty, the influence of natural climate variability, and the potential non-linearities in the regional water cycle response are also considered (Section 8.5). Low likelihood but physically plausible high-impact scenarios are also assessed, especially the potential for abrupt climate change (Section 8.6). Final remarks about future studies on water cycle changes (Section 8.7) are also provided, and the chapter addresses three frequently asked questions (FAQs) on the water cycle’s sensitivity to land use change (FAQ 8.1), the projected occurrence and severity of floods (FAQ 8.2) and droughts (FAQ 8.3) at the global scale. This chapter outline is summarized with a schematic (Figure 8.2) which also provides a quick guide to the main topics addressed across the different sections.
 Figure 8.2 | Visual guide to Chapter 8.
 (Chapter 8 has multiple links across all AR6 WGI chapters, so necessarily includes references to other chapter subsections and figures. Model evaluation of large-scale circulation and precipitation is mostly covered by Chapter 3, while hydrological extremes are covered by Chapter 11. Chapter 8 focuses on key processes relevant to the water cycle and their resolution-dependent representation in models. Observed and projected changes in large-scale circulation and precipitation are primarily assessed in Chapters 2, 3 and 4. Beyond global and regional mean precipitation amounts, Chapter 8 also focuses on other precipitation properties (e.g., frequency, intensity and seasonality) and other water cycle variables (evapotranspiration, runoff, soil moisture and aridity, solid and liquid freshwater reservoirs). Key regional phenomena (e.g., tropical overturning circulations, monsoons, extratropical stationary waves and storm tracks, modes of variability and related teleconnections) are also assessed given their major dynamical contribution to regional water cycle changes. Although the biosphere and the cryosphere are key components of the water cycle, a more comprehensive assessment of their responses can be found in Chapters 5 and 9, respectively. Further assessment on regional water cycle changes can be found in Chapters 10 to 12 and in the Atlas. The reader is also referred to the interactive (Atlas for a more detailed assessment of the range of model biases and responses at the regional scale. Beyond WGI, water is also a major topic for both adaptation and mitigation policies so has strong connections with both WGII and WGIII. Assessment of hydrological impacts at basin and catchment scales, including a broader discussion on adaptation and vulnerability, potential threats to water security, societal responses, improving resilience in water systems and related case studies is provided in WGII (Chapter 4).
8.2 Why Should We Expect Water Cycle Changes?
It is well understood that global precipitation and evaporation changes are determined by Earth’s energy balance (Section 8.2.1). At regional scales smaller than about 4000 km, water cycle changes become dominated by the transport of moisture (Dagan et al., 2019a; Jakob et al., 2019; Dagan and Stier, 2020), which depend on both thermodynamic and dynamical processes (Section 8.2.2). The constraints of energy budgets at global scales and moisture budgets at regional scales cause key water cycle characteristics such as precipitation intensity, duration and intermittence to alter as the climate warms (Pendergrass and Hartmann, 2014b; Döll et al., 2018). Future water availability is also determined by changes in evaporation, which is driven by a general increase in the atmospheric evaporative demand (Scheff and Frierson, 2014) and modulated by vegetation controls on evaporative losses (Milly and Dunne, 2016; Lemordant et al. , 2018; Vicente-Serrano et al. , 2020). At regional scales, water cycle changes result from the interplay between multiple potential drivers (CO2, aerosols, land use change and human water use; Section 8.2.3). This section assesses advances in physical understanding of global to regional drivers of water cycle changes.
8.2.1 Global Water Cycle Constraints
The Clausius–Clapeyron equation determines that low-altitude specific humidity increases by about 7% °C–1 of warming, assuming that relative humidity remains constant, which is approximately true at a global scale but not necessarily valid regionally. It is very likely that near surface specific humidity has increased since the 1970s (Section 2.3.1) and total atmospheric water vapour content (precipitable water) is very likely to increase at close to a thermodynamic rate on average globally with continued warming. Different radiative forcing mechanisms lead to some variation in the global mean thermodynamic response by altering the relative humidity distribution: the rate of global precipitable water increase with global surface temperature ranges2 from 6.4 ± 1.5% °C–1 for sulphate aerosol-induced changes to 9.8 ± 3.3% °C–1 for black carbon-induced changes based on idealized modelling (Hodnebrog et al., 2019b). Specific humidity increases at a lower rate over land due to decreasing relative humidity (Collins et al., 2013) as corroborated by observations and simple models (Byrne and O’Gorman, 2018). Prevalent increases in atmospheric water vapour drive powerful amplifying feedbacks (Section 7.4.2.2), intensify atmospheric moisture transport and heavy precipitation events (Section 8.2.3.2), and alter the surface and atmospheric energy balance, thereby influencing global evaporation and precipitation changes (Figure 8.3).
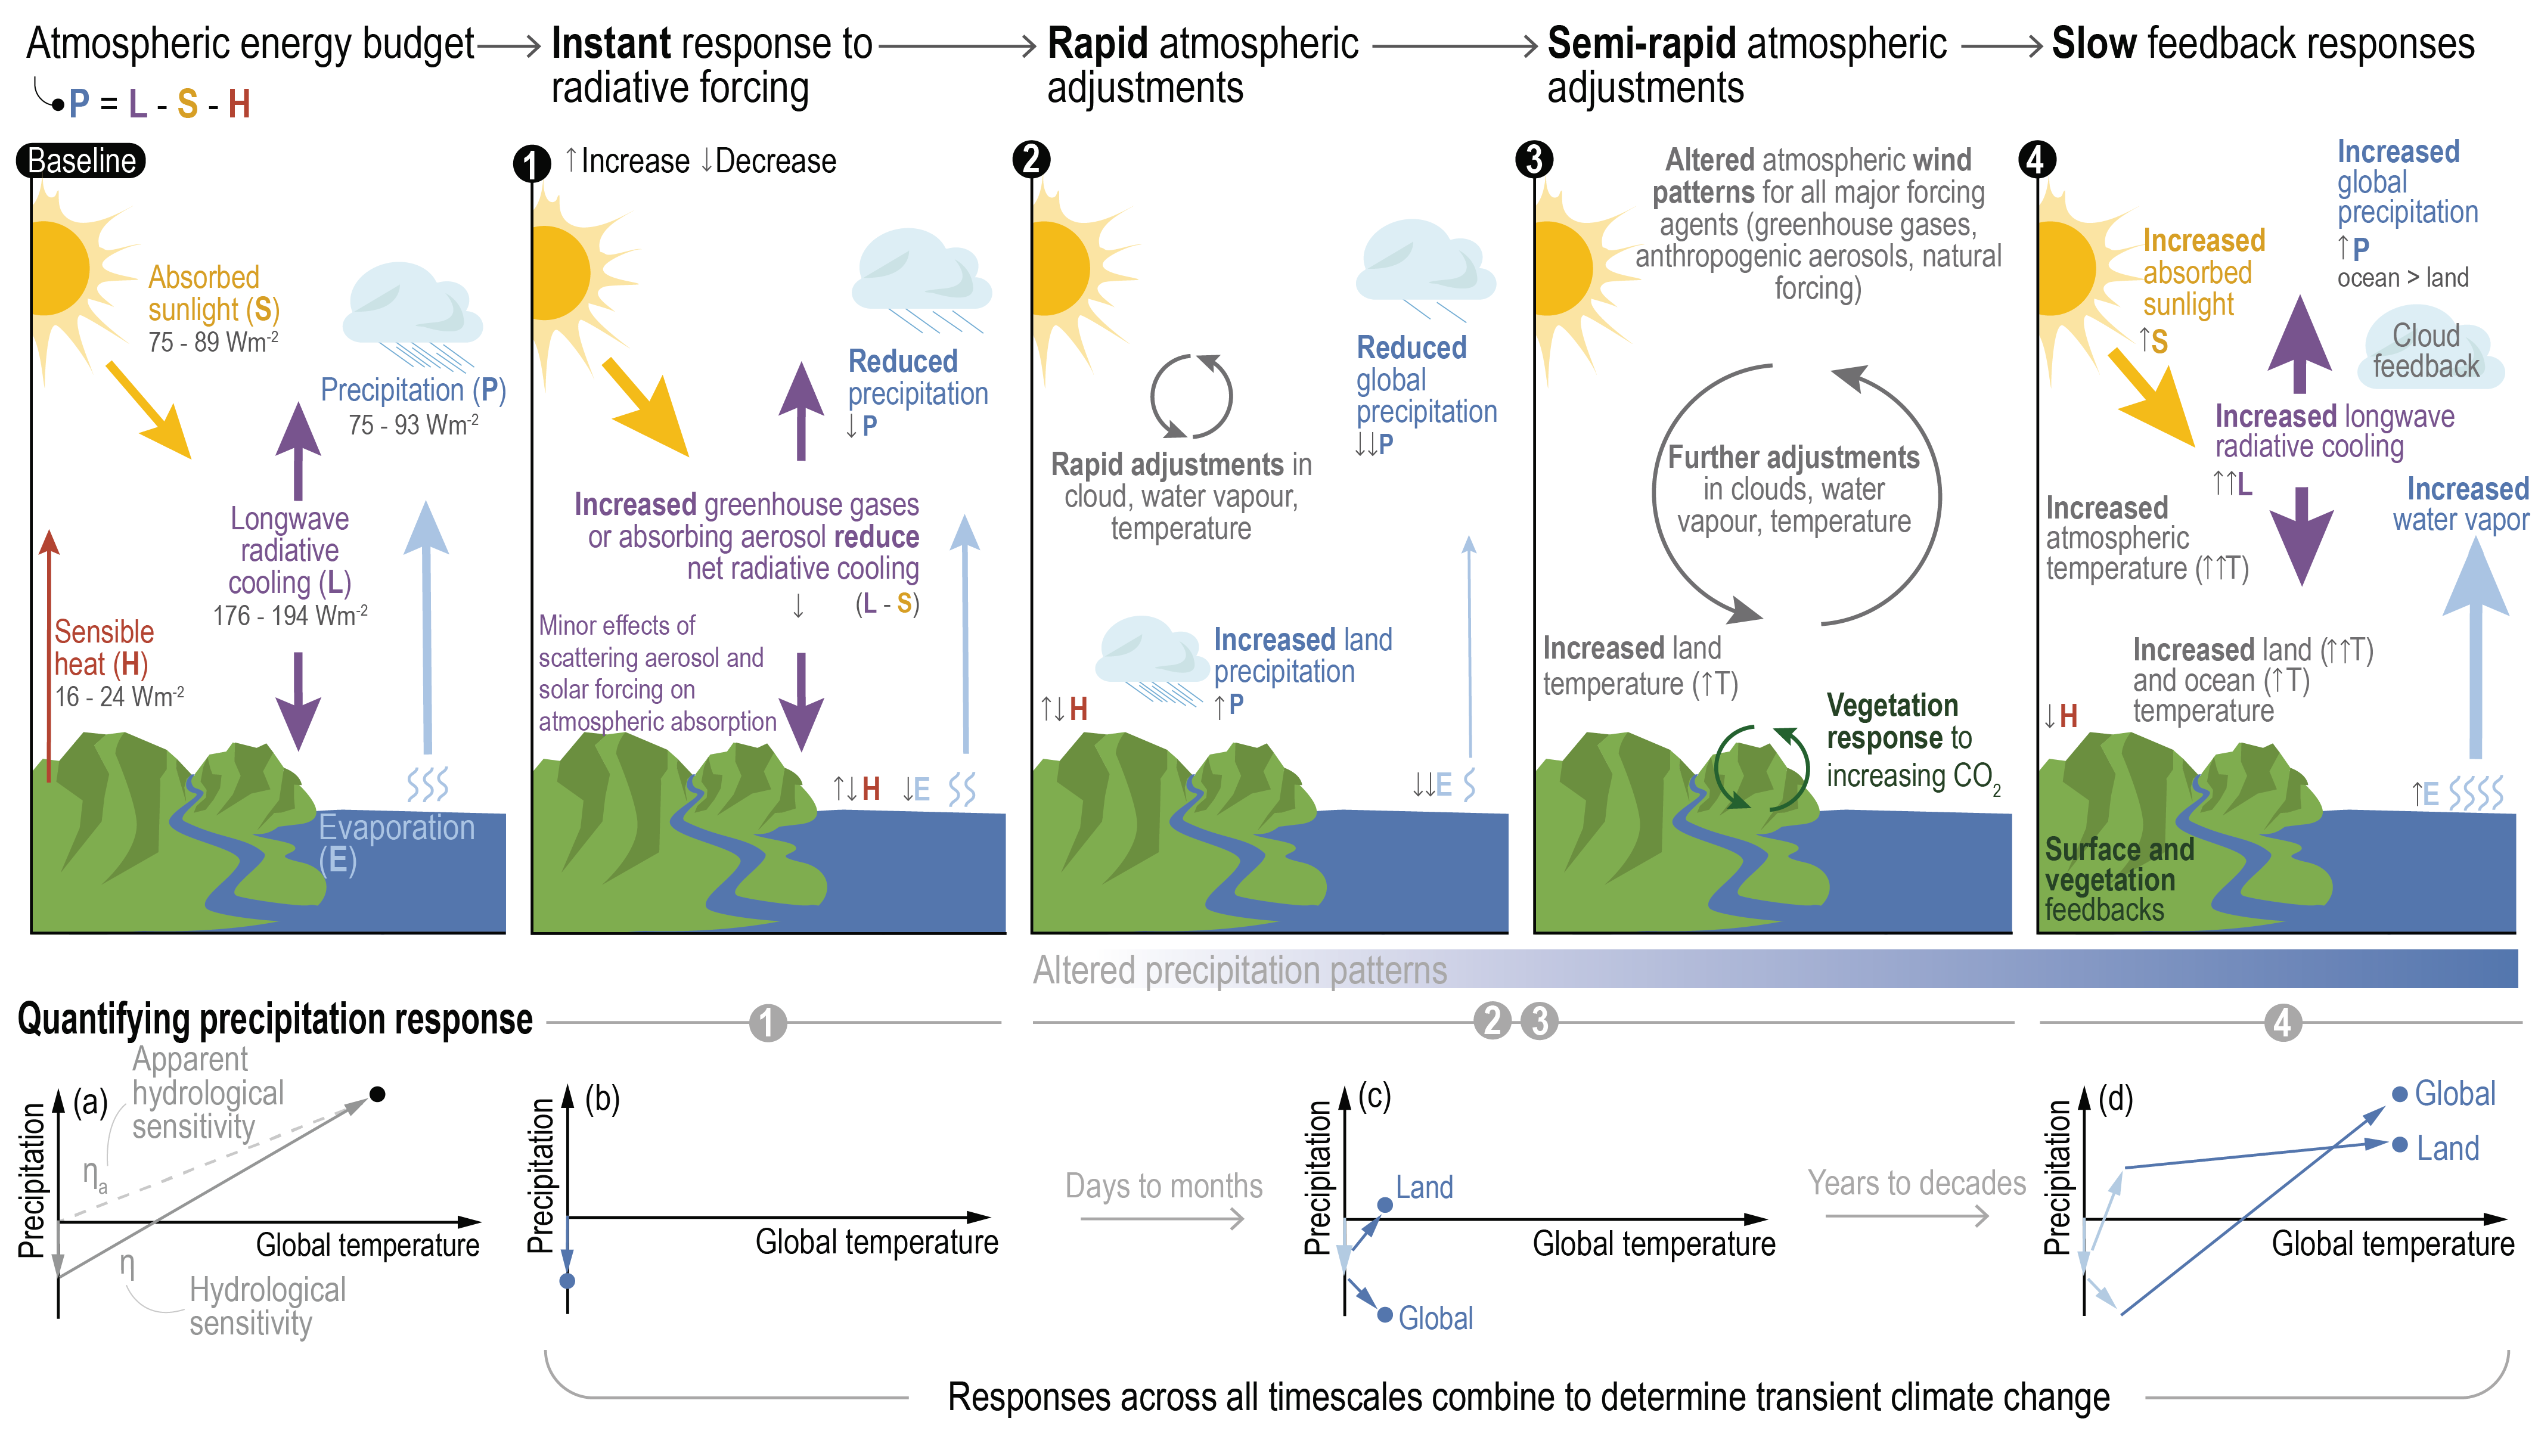
 Figure 8.3 | Schematic representation of fast and slow responses of the atmospheric energy balance and global precipitation to radiative forcing. (‘Baseline’panel) The atmospheric energy budget: (1) responds instantaneously to radiative forcings; (2) leading to rapid atmospheric adjustments; and (3) slower semi‐rapid adjustments involving the land surface and vegetation that further modify atmospheric circulation patterns. (4) This slow precipitation response to global mean surface air temperature is quantified as (a) the hydrological sensitivity, η, and the total precipitation response, including initial rapid adjustments, is termed the apparent hydrological sensitivity, ηa. (b–d) The slow precipitation response over land and ocean develops over time. Large, filled arrows (in panels from ‘baseline’ to 4) depict fluxes or circulation change while small arrows (1–4) denote increases (↑) or decreases (↓) in variables (P is precipitation; L is atmospheric longwave radiative cooling; S is solar radiation absorption by the atmosphere; H is sensible heat flux; E is surface evaporative heat flux; and T is temperature). Adapted from Allan et al. (2020) with statistics taken from Figures 7.2 and Figure 8.1.
 While thermodynamics exert a strong control on water vapour changes, global mean precipitation and evaporation are constrained by the balance of energy fluxes in the atmosphere and at the surface (Figure 8.3). Global mean precipitation increases of 1–3% per 1 °C of warming, as estimated in AR5 (Collins et al., 2013), are explained as a combination of rapid (or fast) atmospheric adjustments and slow temperature-driven responses (Figure 8.3, panels 1–4) to radiative forcings (Andrewset al., 2010; Bala et al., 2010; Cao et al., 2012). Fast atmospheric adjustments are caused by near-instantaneous (hours to days) changes in the atmospheric energy budget (Figure 8.3, panels 1–3) and atmospheric properties (e.g., temperature, clouds and water vapour) in direct response to the radiative effects of a forcing agent (Sherwoodet al., 2015). A further relatively fast (days to months) adjustment of the climate system involves interactions with vegetation and land surface temperature (Figure 8.3, panel 3), which respond more rapidly than ocean temperature to a radiative forcing (Cao et al., 2012; Dong et al., 2014). The slower temperature-dependent precipitation response is driven by the increased atmospheric radiative cooling rate of a warming atmosphere. Warming drives increases in precipitation intensity while frequency is dominated by rapid atmospheric adjustments to the radiative forcing based onabrupt 4×CO2CMIP6 simulations (Douville and John, 2021). Since AR5, many new studies applying the dual rapid adjustment and slow response framework show that global precipitation responses to different forcing agents are physically well understood (Fläschner et al. , 2016; MacIntosh et al. , 2016; Samset et al. , 2016; Myhre et al. , 2018a). Further confidence in the coupled processes involved are provided by simple models representing the energy budget and thermodynamic constraints that limit global mean evaporation to around 1.5% °C–1 (Siler et al., 2019). This strengthens the physical link between energy budget and thermodynamic drivers of the global water cycle (Section 8.2.2.1).
Hydrological sensitivity (η) is defined as the linear change in global mean precipitation with global surface air temperature (GSAT) once rapid adjustments of the hydrological cycle to radiative forcings have occurred (Figure 8.3a). There is robust understanding and high agreement across idealized CO2 forcing CMIP5 and CMIP6 experiments (Fläschner et al., 2016; Samset et al., 2018b; Pendergrass, 2020b) thatη= 2.1–3.1% °C–1 (Figure 8.4). The magnitude ofηdepends primarily on atmospheric net radiative cooling which is controlled by thermal deepening of the troposphere (Jeevanjee and Romps, 2018) and limited by surface evaporation and consequent atmospheric latent heat release and warming (Webb et al., 2018). Climate feedbacks (e.g., temperature lapse rate and clouds) that vary across models (Sections 7.4 and 3.8.2) also modulate the magnitude ofη (O’Gorman et al. , 2012; Fläschner et al. , 2016; T.B. Richardson et al. , 2018a). Uncertainty in ηacross CMIP5 models relating to deficiencies in representing low‐altitude cloud feedbacks (Watanabe et al., 2018) and absorption of shortwave radiation by atmospheric water vapour (DeAngelis et al., 2015) do not apply well to CMIP6 simulations, the latter improvement explained by more accurate radiative transfer modelling (Pendergrass, 2020b).
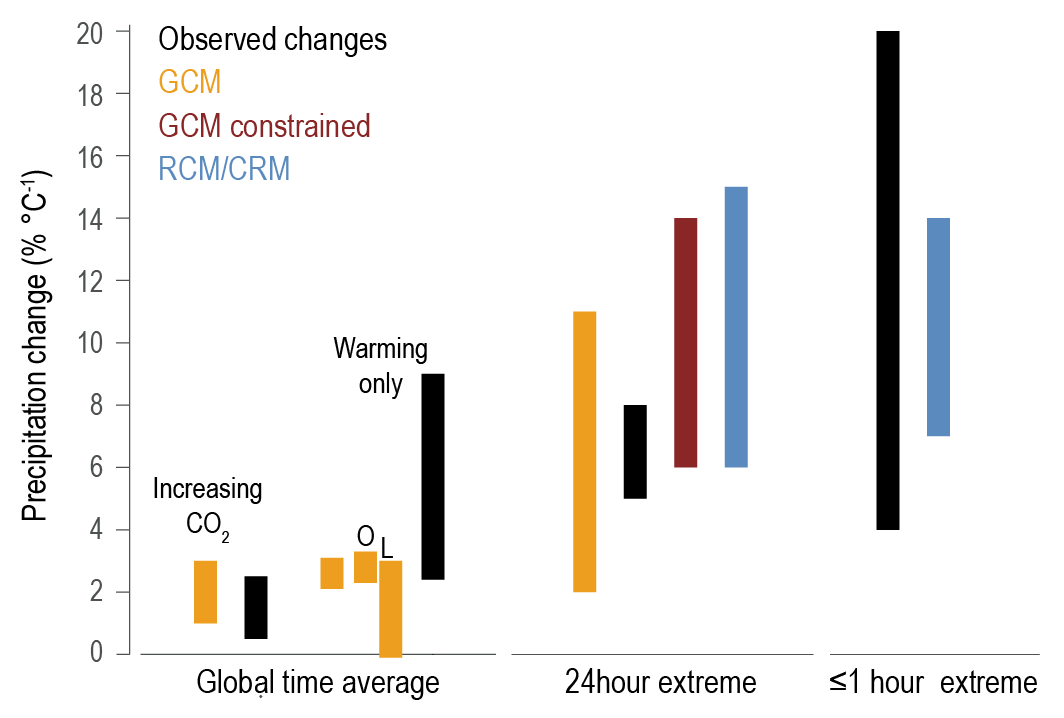
 Figure 8.4 | Estimate (5–95% range) of the increase in precipitation and its extremes with global mean surface warming. Global time-averaged precipitation changes (left) are based on responses to increasing CO2 (apparent hydrological sensitivity, ηa) and the temperature-dependent component (hydrological sensitivity, η), both of which are based on GCM experiments; the land (L) and ocean (O) components (Fläschner et al., 2016; T.B. Richardson et al., 2018a; Samset et al., 2018a; Pendergrass, 2020b; Rehfeld et al., 2020) and observational estimates (GPCP/HadCRUTv4.6) use trends (1988–2014) as a proxy forηa and interannual variability as a proxy forη, with 90% confidence range accounting for statistical uncertainty only (Adler et al., 2017; Allan et al., 2020). For extreme precipitation, assessment is for 24 hour, 99.9th percentile or annual maximum extremes from GCMs (Fischer and Knutti, 2015; Pendergrass et al., 2015; Borodina et al., 2017; Pfahl et al., 2017; Sillmann et al., 2017), regional climate models (RCMs) (Bao et al., 2017), an observationally-constrained tropical estimate (O’Gorman, 2012) and estimates from observed changes (Westra et al., 2013; Donat et al., 2016; Borodina et al., 2017; Zeder and Fischer, 2020; Sun et al., 2021). For hourly and sub-hourly extremes observed changes (Barbero et al., 2017; Guerreiro et al., 2018) and high-resolution models, including RCM and cloud-resolving models (CRMs) are assessed (Ban et al., 2015; Prein et al., 2017; Haerter and Schlemmer, 2018; Hodnebrog et al., 2019a; Lenderink et al., 2019). Further details on data sources and processing are available in the chapter data table (Table 8.SM.1).
 Observed estimates of hydrological sensitivity (η= 3.2 ± 0.8% °C–1) based on interannual variability (Allan et al.,2020) or responses to El Niño–Southern Oscillation (ENSO) of 9% °C–1 (Adler et al., 2017) are not suitable to assess the magnitude of η (Figure 8.4). This is because these relationships depend on amplifying feedbacks associated with ENSO-related cloud changes (G.L. Stephens et al., 2018) that may not be relevant for longer term climate change. However, there is robust evidence and high agreement across observations, modelling and supporting physics that precipitation increases at a lower % °C–1rate than water vapour content in the global mean (Held and Soden, 2006; Collins et al., 2013; Allan et al., 2020), implying an increased residence time of atmospheric water vapour (Hodnebrog et al., 2019b; Dijk et al., 2020). Increasing globalprecipitation, evaporation and moisture fluxes with warming thereby drive an intensification but not acceleration of the global water cycle (Sections 8.3.1.1 and 8.4.1.1).
The overall global mean rate of precipitation change per 1 °C of GSAT increase, apparent hydrological sensitivity (ηa), is reduced compared to hydrological sensitivity by the direct influence of radiative forcing agents on the atmospheric energy balance. Rapid atmospheric adjustments that alter precipitation are primarily caused by GHGs and absorbing aerosols, withhigh agreement and medium evidence across idealized simulations (Fläschner et al.,2016; Samset et al., 2016). A range of rapid precipitation adjustments to CO2 between models are also attributed to vegetation responses leading to a re-partitioning of surface latent and sensible heat fluxes (DeAngelis et al.,2016). Values obtained from six CMIP5 models simulating the Last Glacial Maximum (LGM; 21,000–19,000 years ago) and pre-industrial period (ηa=1.6–3.0%°C–1) are larger than for each correspondingabrupt 4×CO2experiment (ηa=1.3–2.6% °C–1) due to differences in the mix of forcings, vegetation and land surface changes and a higher thermodynamic % °C–1evaporation scaling in the colder state (Figure 8.4, Section 8.4.1.1; G. Li et al., 2013). Updated estimates across comparable experiments from 22 CMIP5/CMIP6 models (Rehfeld et al., 2020) display a consistent range (ηa=1.7 ± 0.6%°C–1). Confirmingηain observations (Figure 8.4) is difficult due to measurement uncertainty, varying rapid adjustments to radiative forcing and unforced variability (Dai and Bloecker, 2019; Allan et al., 2020).
Climate drivers that instantaneously affect the surface much more than the atmospheric energy budget (such as solar forcing and sulphate aerosol) produce only a small rapid adjustment of the global water cycle and therefore largerηathan drivers that immediately modulate the atmospheric energy budget such as GHGs and absorbing aerosol (Salzmann, 2016; Samset et al. , 2016; Lin et al. , 2018; F. Liu et al. , 2018). Thus, global precipitation appears more sensitive to radiative forcing from sulphate aerosols (2.8 ± 0.7% °C–1; ηa≈η) than GHGs (1.4 ± 0.5% °C–1; ηa< η) while the response to black carbon aerosol can be negative (–3.5 ± 5.0% °C–1; ηa<< η) due to strong atmospheric solar absorption (Samset et al., 2016). Therefore, artificially reducing surface-absorbed sunlight through solar radiation modification strategies to mitigate GHG warming will not mitigate precipitation changes (see Sections 4.6.3.3, 6.4.7 and 8.6.3). Aerosol-induced precipitation changes depend upon the type of aerosol species and their spatial distribution. Global mean precipitation increases after complete removal of present-day anthropogenic aerosol emissions (see also Section 4.4.4) in four different climate models (ηa= 1.6–5.5% °C–1) are mainly attributed to sulphate aerosol as opposed to other aerosol species (Samset et al., 2018b). Idealized modelling studies show that sulphate aerosol increases over Europe produce a larger global precipitation response than an equivalent increase in aerosol burden or radiative forcing overAsia, explained by differences in cloud climatology and cloud-aerosol interaction (Kasoar et al., 2018; L. Liu et al., 2018). The vertical profiles of black carbon and ozone further influence the magnitude of the rapid global precipitation response, yet are difficult to observe and simulate (Allen and Landuyt, 2014; MacIntosh et al., 2016; Stjern et al., 2017; Sand et al., 2020).
Hydrological sensitivity is generally lower over land but with a large uncertainty range (η=–0.1 to 3.0% °C–1) relative to the oceans (η= 2.3 to 3.3% °C–1) based on multi-model 4 × CO2 CMIP6simulations (Pendergrass, 2020b), broadly consistent with comparable CMIP5 experiments (T.B. Richardson et al. , 2018a; Samset et al. , 2018a). Suppressed hydrological sensitivity over land (Figures 8.3d and 8.4) is associated with greater warming compared with the oceans, which alters atmospheric circulation and precipitation patterns (Saint-Lu et al., 2020). Also, since oceans supply much of the moisture to fuel precipitation over land, the slower ocean warming rate means there is insufficient moisture supplied to maintain continental relative humidity levels (Byrne and O’Gorman, 2018), which can inhibit convection (J. Chen et al., 2020a). Land surface feedbacks involving soil-vegetation-atmosphere coupling further drive continental drying (Berg et al., 2016; Kumar et al., 2016; Chandan and Peltier, 2020). The suppressed hydrological sensitivity is counteracted by rapid precipitation responses in most GHG-forced simulations, explained by increases in surface downward longwave radiation due to CO2 increases that rapidly warm the land, destabilize the troposphere and strengthen vertical motion in the short term (Chadwick et al., 2014; T.B. Richardson et al., 2016, 2018a). There is medium understanding of how land–sea warming contrast governs rapid precipitation responses based on idealized modelling that shows similar spatial patterns of precipitation response to radiative forcing from GHGs, solar forcing and absorbing aerosols (Xie et al., 2013; Samset et al., 2016; Kasoar et al., 2018). Rapid precipitation adjustments to CO2 have been counteracted by cooling from anthropogenic aerosol increases over land (Box 8.1) but this compensation is expected to diminish as aerosol forcing declines (T.B. Richardson et al., 2018a). Thefast and slow precipitation responses over global land combine on average during transient climate change (Figure 8.3d). This explains a consistent land and ocean mean precipitation increase in projections (Table 4.3) but this is determined by a complex and model-dependent evolution of continental water cycle changes over space and time.
Increases in global precipitation over time, as the climate warms, are partly offset by the overall cooling effects of anthropogenic aerosol and by rapid atmospheric adjustments to increases in GHGs and absorbing aerosol. This explains why multi-decadal trends in global precipitation responses in the satellite era (Adler et al., 2017; Allan et al., 2020) are small and difficult to interpret given observational uncertainty, internal variability and volcanic forcings. The delayed warming effect of rising CO2 concentration, combined with declining aerosol cooling, are expected to increase the importance of the slow temperature-related effects on the energy budget relative to the more rapid direct radiative forcing effects as transient climate change progresses (Shine et al., 2015; Salzmann, 2016; Myhre et al., 2018b).
In summary, there is high confidence that global mean evaporation and precipitation increase with global warming, but the estimated rate is model-dependent (very likely range of 1–3 % °C–1). The global increase in precipitation is determined by a robust response to global surface temperature only (very likely 2–3% °C–1) that is partly offset by fast atmospheric adjustments to the vertical profile of atmospheric heating by GHGs and aerosols. Global precipitation increases due to GHGs are offset by the well-understood overall surface radiative cooling effect by aerosols (high confidence). Over land, the average warming-related increase in precipitation is expected to be smaller than over the ocean due to increasing land –ocean thermal contrast and surface feedbacks, but the overall precipitation increase over land is generally reinforced by fast atmospheric responses to GHGs that strengthens convergence of winds (medium confidence). Global mean precipitation and evaporation increase at a lower rate than atmospheric moisture per 1°C of global warming (high confidence), leading to longer water vapour lifetime in the atmosphere and driving changes in precipitation intensity, duration and frequency and an overall intensification but not acceleration of the global water cycle.
8.2.2 Constraints on the Regional Water Cycle
8.2.2.1 Thermodynamic Constraints on Atmospheric Moisture Fluxes
A warming climate drives increases in atmospheric moisture and horizontal moisture transport from the divergent to the convergent portions of the atmospheric circulation (including storm systems, the tropical rain belt and monsoons) that on average amplifies existing precipitation minus evaporation (P–E) patterns (Held and Soden, 2006). Increased latent heat transports in high latitudes also contribute to polar amplification of warming (Section 7.4.4.1). Although convergent parts of the atmospheric circulation are expected to become wetter (in terms of increasing P–E) and net evaporative regions drier (increasing E–P) these regions are not geographically and seasonally fixed and their location and timing are expected to alter (Section 8.2.2.2). Atmospheric and ocean circulation changes overall decrease the amplification of P–E and salinity patterns. Paleoclimate evidence confirms that during the LGM zonal mean changes were roughly in agreement with thermodynamic expectations (G. Li et al., 2013). However regional changes can be dominated by dynamics, including responses to the large Northern Hemisphere (NH) ice sheets (DiNezio and Tierney, 2013; T. Bhattacharya et al., 2017; Scheff et al., 2017; D’Agostino et al., 2019; Lowry and Morrill, 2019) such that altered P–E patterns are not well described by thermodynamic drivers (Osteret al., 2015; Lora, 2018; Morrill et al., 2018).
There is robust evidence and high agreement across thermodynamics, detailed modelling and observations that amplification of P–E patterns occurs over the oceans (Figure 8.5a) with an associated ‘fresh gets fresher, salty gets saltier’ signature in ocean salinity (Sections 2.3.3.2 and 3.5.2). This amplification is moderated by proportionally larger increases in subtropical ocean evaporation and weakening of the tropical circulation (Section 8.2.2.2), an expectation supported by observations (Skliriset al., 2016) and process understanding (Yang andRoderick, 2019). Thermodynamics explain a smaller low latitude evaporation increase (1% °C–1) than in high latitudes (5% °C–1) with changes in surface radiation, boundary layer adjustments and ocean heat uptake playing a secondary role, based on idealized modelling (Siler et al., 2019). Increased evaporation from warmer oceans and lakes is exacerbated by the loss of surface ice in some regions (Bintanja and Selten, 2014; Laîné et al., 2014; W. Wang et al., 2018; Sharma et al., 2019; Woolway et al., 2020). This can generate a more local moisture source for precipitation, for example in north-west Greenland during non-summer months since the 1980s (Nusbaumer et al., 2019), though moisture transport changes can counteract this effect (Nygård et al., 2020). Ocean stratification due to heating of the upper layers through radiative forcing has been identified as a mechanism that further amplifies surface salinity patterns beyond the responses driven by water cycle changes alone (Zika et al., 2018).
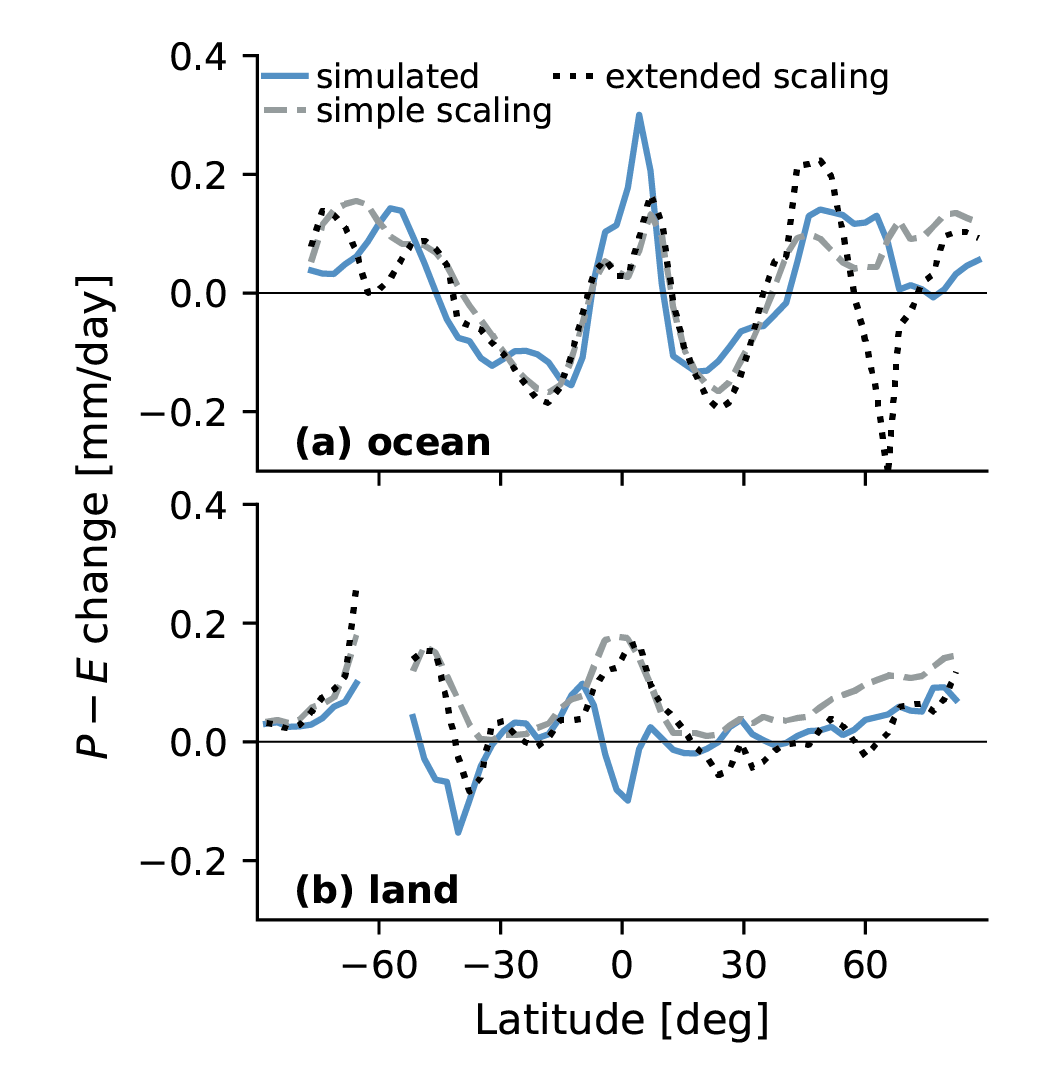
Since AR5, numerous studies have confirmed that changes in P–E with warming over land cannot be interpreted simply as a ‘wet regions get wetter, dry regions get drier’ response (Chadwick et al., 2013; Greve et al., 2014; Roderick et al., 2014; Byrne and O’Gorman, 2015; Scheff and Frierson, 2015). Firstly, P–E is a simplistic diagnostic of the water cycle that inadequately describes ‘dryness’ or aridity (Fu and Feng, 2014; Roderick et al., 2014; Greve and Seneviratne, 2015; Scheff and Frierson, 2015; Greve et al., 2019; Vicente-Serrano et al., 2020). Secondly, terrestrial P–E is generally positive and balanced by surface runoff and percolation into subsurface soils and aquifers (Figure 8.1). As a result, the simple thermodynamic scaling (Figure 8.5b) predicts that P–E over land will become more positive (wetter) with warming (Greve et al., 2014; Roderick et al., 2014; Byrne and O’Gorman, 2015). This is not necessarily true, however, in the dry seasons and regions where terrestrial water is lost to the atmosphere and exported (Sheffield et al., 2013; Kumar et al., 2015; Keune and Miralles, 2019). Thirdly, regional P–E patterns over land are affected by changes in atmospheric circulation, oceanic moisture supply and land surface feedbacks. As the land warms more than oceans, spatial gradients in temperature and relative humidity influence moisture supply and reduce P–E over some land regions, such as southern Chile and Argentina around 30°S–50°S as captured by an extended thermodynamic scaling (Figure 8.5b). Drying of soils can be amplified by vegetation responses (Berg et al., 2016; Byrne and O’Gorman, 2016; Lambert et al., 2017) but limited by atmospheric circulation feedbacks (Zhou et al., 2021). Changes in soil moisture and rainfall intensity (Sections 8.2.3.2 and 8.2.3.3) can alter the partitioning of precipitation between evaporation and runoff, further complicating terrestrial P–E responses (Short Gianotti et al., 2020).
The strong physical basis for regionally and seasonally dependent responses of P–E and the expectation for an increasing contrast between wet and dry seasons and weather regimes is supported byhigh agreement across multiple observational and CMIP5/CMIP6 modelling studies (Liu and Allan, 2013; Kumar et al., 2015; Polson and Hegerl, 2017; Ficklin et al., 2019; Deng et al., 2020; Schurer et al., 2020). Increased moisture transports into storm systems, monsoons and high latitudes increase the intensity of wet events (Section 8.2.3.2), while stronger atmospheric evaporative demand with warming (Scheff and Frierson, 2014; Vicente-Serrano et al., 2018; Cook et al., 2019) is an important mechanism for intensifying dry events (Section 8.2.3.3) and decreasing soil moisture over many subtropical land regions. However, aridification is modulated regionally by poleward migration of the subtropical dry zones and an increasing land –ocean temperature contrast that drives declining relative humidity (Section 8.2.2.2).
To summarize, increased moisture transport from evaporative oceans to high precipitation regions of the atmospheric circulation will drive amplified P–E and salinity patterns over the ocean (high confidence) while more complex regional changes are expected over land. Greater warming over land than ocean alters atmospheric circulation patterns and on average reduces continental near-surface relative humidity which along with vegetation feedbacks can contribute to regional decreases in precipitation (high confidence). Based on an improved understanding of thermodynamic drivers since AR5 and multiple lines of evidence, there is high confidence that very wet or dry seasons and weather patterns will intensify in a warming climate such that wet spells become wetter and dry spells drier.
8.2.2.2 Large-scale Responses in Atmospheric Circulation Patterns
Responses of the large-scale atmospheric circulation to a warming climate are not as well understood as thermodynamic drivers (Shepherd, 2014). The AR5 identified robust features including a weakening and broadening of tropical circulation with poleward movement of tropical dry zones and mid-latitude jets (Collins et al., 2013). These can dominate regional water cycle changes, affecting the availability of freshwater and the occurrence of climate extremes. Atmospheric circulation changes generally dominate the spatial pattern of rapid precipitation adjustments (Section 8.2.1) to different forcing agents in the tropics (Bony et al., 2013; He and Soden, 2015; T.B. Richardson et al., 2016, 2018a; Tian et al., 2017; X. Li et al., 2018). Radiative forcing with heterogeneous spatial patterns such as ozone and aerosols (including cloud interactions; Section 6.4.1 and Box 8.1) drive substantial responses in regional atmospheric circulation through uneven heating and cooling effects(L. Liu et al., 2018; Dagan et al., 2019b; Wilcox et al., 2019). Changes in atmospheric circulation are also driven by slower, evolving patterns of warming and associated changes in temperature and moisture gradients (Bony et al., 2013; Samset et al., 2016, 2018a; Ceppi et al., 2018; Ma et al., 2018). There is strong evidence that large regional water cycle changes arise from the atmospheric circulation response to radiative forcings and associated SST pattern evolution butlow agreement in the sign and magnitude (Chadwick et al., 2016b). The role of prolonged weather regimes in determining wet and dry extremes is also better understood since AR5 (Kingston and McMecking, 2015; Schubert et al., 2016; D. Richardson et al., 2018; Barlow et al., 2019). Advances in knowledge of expected large-scale dynamical responses of the water cycle are further assessed in this section (see also Figure 8.21).
Long-term weakening of the tropical atmospheric overturning circulation is expected as climate warms in response to elevated CO2 (Collins et al., 2013). A weaker circulation is required to reconcile global mean low-level water vapour increases (around 7% °C–1) with the smaller global precipitation responses of about 1–3% °C–1 (Section 8.2.1). The slowdown can occur in both the Hadley and Walker circulations, but occurs preferentially in the Walker circulation in most climate models (Vecchi and Soden, 2007) but this response has been questioned on the basis of model bias in east Pacific SST (Seager et al., 2019a). Weakening is expected to drive P–E decreases over the western Pacific and increases over the eastern Pacific. However, the driving mechanisms for Walker circulation weakening differ to those involved in determining ENSO variability, so it is too simplistic to interpret changes as an El Niño pattern of regional hydrological cycle extremes (Sohn et al., 2019). Internal variability is also capable of temporarily strengthening the Walker circulation (Section 2.3.1.4.1; L’Heureux et al., 2013; Chung et al., 2019) while regional responses depend on the pattern of warming (Sandeep et al., 2014).
Model simulations show a stronger Pacific Walker circulation during the LGM in response to a cooler climate (consistent with an expected weakening in a warmer climate), but a weaker Indian Ocean east– west circulation in response to the exposure of the Sunda and Sahul shelves due to lowered sea level (DiNezio et al., 2011). The latter effect is detectable in proxies for hydroclimate, as well as salinity and sea surface temperature (DiNezio and Tierney, 2013; DiNezio et al., 2018). More relevant to future warming is the mid-Pliocene period (3 million years ago), the last time the Earth experienced CO2 levels comparable to present (see Cross-Chapter Box 2.4). Sea surface temperature (SST) reconstructions show a weakening of the Pacific zonal gradient and a pattern of warmth consistent with a weaker Walker cycle response (Corvec and Fletcher, 2017; Tierney et al., 2019; McClymont et al., 2020). Although the Pliocene SST pattern and wet subtropics contrast with present conditions (Burls and Fedorov, 2017), the paleoclimate record strengthens evidence that a warmer climate is associated with a weaker Walker circulation (Cross-Chapter Box 2.4; Section 3.3.3).
Since AR5, weakening of the tropical circulation has been explained as a rapid response to increasing CO2 concentrations and slower response to warming and evolving SST patterns (He and Soden, 2017; Xia and Huang, 2017; Shaw and Tan, 2018; Chemke and Polvani, 2020). Large-scale tropical circulation weakens by 3–4% in a rapid response to a quadrupling of CO2 concentrations (Plesca et al., 2018), which suppresses tropospheric radiative cooling, particularly in subtropical ocean subsidence regions (Bony et al., 2013; Merlis, 2015; Richardson et al., 2016). The resulting increased atmospheric stability explains the rapid weakening of the Walker circulation (Wills et al., 2017) and Northern Hemisphere Hadley Cell (Chemke and Polvani, 2020). Subsequent surface warming contributes up to a 12% slowing of circulation for a uniform 4°C SST increase, driven by thermodynamic decreases in temperature lapse rate (Plesca et al., 2018).
The regional Inter-tropical Convergence Zone (ITCZ) position, width and strength determine the location and seasonality of the tropical rain belt. Since AR5, multiple studies have linked cross-equatorial energy transport to the mean ITCZ position (Donohoe et al., 2013; Frierson et al., 2013; Bischoff and Schneider, 2014; Boos and Korty, 2016; Loeb et al., 2016; Adam et al., 2018; Biasutti and Voigt, 2019). Multi-model studies agree that aerosol cooling in the NH led to a southward shift in the ITCZ and tropical precipitation after the 1950s up to the 1980s that is linked with the 1980s Sahel drought (Box 8.1; Section 8.3.2.4 and 10.4.2.1). In particular, aerosol-cloud interaction was identified as a potentially important driver of this shift (Chung and Soden, 2017) but this is uncertain since observations suggest that models may overestimate (Malavelle et al. , 2017; Toll et al. , 2017) or underestimate (Rosenfeld et al. , 2019) the aerosol cloud-mediated cooling effects. In addition, greenhouse gas forcing has been invoked in explaining much of the increase in Sahel precipitation since the 1980s through enhanced meridional temperature gradient, with only a secondary role for aerosol (Dong and Sutton, 2015).
Understanding of how ITCZ width and strength respond to a warming climate has improved since AR5 (Byrne and Schneider, 2016; Harrop and Hartmann, 2016; Popp and Silvers, 2017; Dixit et al., 2018; Zhou et al., 2020). Studies suggest that convection gets stronger and more focused within the core of the ITCZ (Lau and Kim, 2015; Byrne et al., 2018). This leads to drying on the equatorward edges of the ITCZ and a moistening tendency in the ITCZ core (Byrne and Schneider, 2016). Feedbacks involving clouds have been identified as an important mechanism leading to tightening and strengthening of the ITCZ (Popp and Silvers, 2017; Su et al., 2017, 2019, 2020; Talib et al., 2018). Stronger ascent in the core amplifies the ‘wet get wetter’ response while reduced moisture inflow near the ITCZ edges reduces this response below the 7% °C–1 Thermodynamic increase in moisture transport. Thus, there is a range of evidence and medium agreement for strengthening and contraction of the ITCZ with warming that sharpens contrasts between wet and dry regimes. However, understanding of how the regional ITCZ location responds in a warming climate is not robust (Section 8.4.2.1) with limited evidence of distinct regional responses to GHG forcing including a northward shift over eastern Africa and the Indian Ocean and a southward shift in the eastern Pacific and Atlantic oceans (Mamalakis et al., 2021). Paleoclimate evidence highlights the distinct regional ITCZ responses to hemispheric asymmetry in volcanic and orbital forcing (McGee et al., 2014; Boos and Korty, 2016; Colose et al., 2016; Denniston et al., 2016; PAGES Hydro2K Consortium, 2017; Singarayer et al., 2017; Atwood et al., 2020) and rapid (>1° latitude over decades) shifts in the ITCZ and regional monsoons in response to AMOC collapse cannot be ruled out (Sections 8.6.1.1 and 5.1.3).
Monsoons are key components of the tropical overturning circulation that can be understood as a balance between net energy input (e.g., radiative and turbulent fluxes) and the export of moist static energy. This is determined by contrasting surface heat capacity between ocean and land and modified through changes in atmospheric dynamics, tropical tropospheric stability and land surface properties (Jalihal et al., 2019). Thermodynamic increases in moisture transport are expected to increase monsoon strength and area (Christensen et al., 2013). Since AR5, evidence continues to demonstrate that monsoon circulation is sensitive to spatially varying radiative forcing by anthropogenic aerosols (Hwang et al. , 2013; R.J. Allen et al. , 2015; Z. Li et al. , 2016b) and GHGs (Dong andSutton, 2015). Changes in SST patterns also play a role (Guo et al., 2016; W. Zhou et al., 2019; Cao et al., 2020) by altering cross-equatorial energy transports and land–ocean temperature contrasts. This evidence continues to support a thermodynamic strengthening of monsoon precipitation that is partly offset by slowing of the tropical circulation but with weak evidence and low agreement for regional aspects of circulation changes. Disagreement between paleoclimate and modern observations, physical theory and numerical simulations of global monsoons have been partly reconciled (Section 3.3.3.2) through improved understanding of regional processes (Harrison et al. , 2015; R. Bhattacharya et al. , 2017; Bhattacharya et al. , 2018; Biasutti et al. , 2018; D’Agostino et al. , 2019; Jalihal et al. , 2019; Seth et al. , 2019), although interpreting past changes in the context of future projections requires careful account of differing forcings and feedbacks (D’Agostinoet al., 2019). Assessment of past changes and future projections in regional monsoons are provided in Sections 2.3.1.4.2, 8.3.2.4 and 8.4.2.4.
Since AR5, understanding of poleward expansion of the Hadley Cells has improved (Section 2.3.1.4.1) but its role in subtropical drying is limited to the zonal mean and dominated by ocean regions (Byrne and O’Gorman, 2015; Grise and Polvani, 2016; He and Soden, 2017; Schmidt and Grise, 2017; Siler et al., 2018; Chemke and Polvani, 2019; Grise and Davis, 2020). Over subtropical land, evolving SST patterns and land–ocean warming contrasts, that are partly explained by rapid responses to CO2 increases, can dominate aspects of the atmospheric circulation response (Byrne and O’Gorman, 2015; He and Soden, 2015; Chadwick et al., 2017; H. Yang et al., 2020) and resultant regional water cycle changes, particularly for projected drying in semi-arid, winter-rainfall dominated subtropical climates (Deitch et al. , 2017; Brogli et al. , 2019; Seager et al. , 2019b; Zappa et al. , 2020). Poleward expansion of the tropical belt is expected to drive a corresponding shift in mid-latitude storm tracks, but the controlling mechanisms differ between hemispheres. Southern Hemisphere expansion is driven by GHG forcing and amplified by stratospheric ozone depletion, while weaker Northern Hemisphere expansion in response to GHG forcing is modulated by tropospheric ozone and aerosol forcing, particularly black carbon (Davis et al. , 2016; Grise et al. , 2019; Watt-Meyer et al. , 2019; Zhao et al. , 2020). However, internal variability is found to dominate observed responses in the NH, precluding attribution to radiative forcing (D’Agostino et al., 2020a). Paleoclimate evidence of poleward expansion and weakening of westerly winds in both hemispheres in the warmer Pliocene is linked to reduced equator-to-pole thermal gradients and ice volume(Abell et al., 2021).
The influence of amplified Arctic warming on mid-latitude regional water cycles is not well understood based on simple physical grounds due to the large number of competing physical processes (Cross-Chapter Box 10.1). The thermal gradient between polar and lower latitude regions decreases at lowlevels due to Arctic warming amplification. However, at higher altitudes, the corresponding thermal gradient increases with warming due to cooling of the Arctic stratosphere and this is consistent with a strengthening of the winter jet stream in both hemispheres, yet there is low agreement on the precise mechanisms (Vallis et al., 2015; Vihma et al., 2016). Changes in the strength of the polar stratospheric vortex can also alter the mid-latitude circulation in winter, but responses are not consistent across models (Oudar et al., 2020a). Nevertheless, thermodynamic strengthening of moisture convergence into weather systems and polar regions is robust (Section 8.2.2.1) and remains valid despite weak understanding of atmospheric circulation change.
In summary, there is high confidence that altered atmospheric wind patterns in response to radiative forcing and evolving surface temperature patterns will affect the regional water cycle in most regions. Mean tropical circulation is expected to slow with global warming (high confidence) but temporary multi-decadal strengthening is possible due to internal variability (medium confidence). Slowing of the tropical circulation reduces the meridional P–E gradient over the Pacific and can partly offset thermodynamic amplification of P–E patterns and strengthening of monsoons (high confidence) but regional characteristics of tropical rain belt changes are not well understood. There is medium confidence in processes driving strengthening and tightening of the ITCZ that increase the contrasts between wet and dry tropical weather regimes and seasons. There is high confidence in understanding of how radiative forcing and global warming drive a poleward expansion of the subtropics and mid-latitude storm tracks but onlylow confidence in how poleward expansion influences drying of subtropical and mid-latitude climates. There is low confidence in understanding how Arctic warming amplification affects mid-latitude regional water cycles but high confidence that thermodynamic strengthening of precipitation within weather systems and in monsoons and polar regions is robust to large-scale circulation changes.
8.2.3 Local-scale Physical Processes Affecting the Water Cycle
Processes operating at local scales are capable of substantially modifying the regional water cycle. This section assesses the development in understanding of processes affecting the atmosphere, surface and subsurface, including cryosphere and biosphere interactions and the direct impacts of human activities.
8.2.3.1 Hydrological Processes Related to Ice and Snow
Declining ice-sheet mass, glacier extent and Northern Hemisphere (NH) sea ice, snow cover and permafrost (Collins et al., 2013; Vaughan et al., 2013) is an expected consequence of a warming climate (Sections 2.3.2, 3.4, 4.3.2.1 and 9.3–9.5). A decline in mountain snow cover and increased snow and glacier melt will alter the amount and timing of seasonal runoff in mountain regions (Sections 3.4.2, 3.4.3 and 9.5). Earlier and more extensive winter and spring snowmelt (X. Zeng et al., 2018) can reduce summer and autumn runoff in snow-dominated river basins of mid–high latitudes of the NH (Rhoades et al., 2018; Blöschl et al., 2019). Since AR5, an earlier but less rapid snowmelt has been explained by reduced winter snowfall and less intense solar radiation earlier in the season (Musselman et al. , 2017; Wu et al. , 2018; Grogan et al. , 2020). Reduced snow cover also increases energy available for evaporation, which can dominate declining river discharge based on modelling of the Colorado River (Milly and Dunne, 2020). An increase in the fraction of precipitation falling as rain compared with snow can lead to declines in both streamflow and groundwater storage in regions where snowmelt is the primary source of recharge (Earman and Dettinger, 2011; Berghuijs et al., 2014). Such regions include western South America and western North America, semi-arid regions which rely on snowmelt from high mountain chains (Ragettli et al., 2016; Milly and Dunne, 2020). Rain-on-snow melt events reduce at lower altitudes due to declining snow cover but increase at higher altitudes where snow tends to be replaced by rain based on observations and modelling (Musselman et al., 2018; Pall et al., 2019), thereby altering seasonal and regional characteristics of flooding (Section 11.5).
Seasonal melt water from high mountain glaciers in Asia (see Cross-Chapter Box 10.4) supply the basic needs of 221 ± 97 million people (Pritchard, 2019; Immerzeel et al., 2020). Glacier-melt in response to warming can initially lead to increased runoff volumes, especially in peak summer flows, but they will eventually decline as most glaciers continue to shrink. SROCC concluded there is high confidence that the peak runoff has already been passed for some smaller glaciers (Hock et al., 2019a). Increased precipitation and glacier-melt can also contribute to rising lake levels and flood hazards in regions such as the inner Tibetan Plateau, Patagonia, Peru, Alaska and Greenland (Lei et al. , 2017; Shugar et al. , 2020; Stuart-Smith et al. , 2020). Since AR5, evidence from multiple locations (New Zealand, Greenland, Antarctica) shows that intrusions of warm, moist air are important in controlling glacier mass balance, the likelihood of extreme ablation or snowfall events depending on air temperature (Gorodetskaya et al. , 2014; Mackintosh et al. , 2017; Mattingly et al. , 2018; Little et al. , 2019; Oltmanns et al. , 2019; Wille et al. , 2019; Adusumilli et al. , 2021). Sensible heating from warm air and increased longwave radiation from atmospheric moisture and low clouds drive melt events (Stuecker et al., 2018).
Reductions in snow, freshwater ice and permafrost affect terrestrial hydrology. Permafrost degradation reduces soil ice and alters the extent of thermokarst lake coverage (Section 9.5.2; M. Meredith et al., 2019). A lag between current climate change and permafrost degradation is expected, given the slow response rates in frozen ground and the fact that snow cover insulates soil from sensible heat exchanges with the air above (Hoegh-Guldberg et al. , 2018; García-García et al. , 2019; Soong et al. , 2020). Post‐wildfire areas are also linked with permafrost degradation in the Arctic based on satellite observations (Yanagiya and Furuya, 2020). An increase in spring rainfall can increase heat advection by infiltration, exacerbating permafrost thaw and leading to increased methane emissions (Section 5.4.7; Neumann et al., 2019). Increased heat transport by Arctic rivers can also contribute to earlier sea ice melt (Park et al., 2020).
In summary, it is virtually certain that warming will cause a loss of frozen water stores, except in areas where temperatures remain below 0°C for most of the year. There is high confidence that warming and reduced snow volume drives an earlier snowmelt, leading to seasonally dependent changes in streamflow. There is medium confidence that weaker sunlight earlier in the season can reduce the rate of snowmelt. Melting of snowpack or glaciers can increase streamflow in high-latitude and high-altitude catchments until frozen water reserves are depleted (high confidence). There is high confidence that warm, moist airflows and associated precipitation dominate glacier mass balance in some regions (New Zealand, Greenland, Antarctica).
8.2.3.2 Processes Determining Heavy Precipitation and Flooding
Evidence that heavy precipitation events (from sub-daily up to seasonal time scales) intensify as the planet warms has strengthened since AR5 (Section 11.4, Box 11.1 and Cross-Chapter Box 3.2) based on improved physical understanding, extensive modelling and increasing observational corroboration (O’Gorman, 2015; Fischer and Knutti, 2016; Neelin et al., 2017). There is robust evidence, with medium agreement across a range of modelling and observational studies, of thermodynamic intensification of wet seasons (Chou et al., 2013; Liu and Allan, 2013; Dunning et al., 2018; Lan et al., 2019; Zhang and Fueglistaler, 2019). Extreme daily precipitation is expected to increase at close to the 7% °C–1 increase in the near-surface atmospheric moisture-holding capacity determined by the Clausius–Clapeyron equation (Section 11.4, Figure 8.4), with limited evidence that higher rates apply for shorter duration precipitation events (Formayer and Fritz, 2017; Lenderink et al. , 2017; Ali et al. , 2018; Guerreiro et al. , 2018; Burdanowitz et al. , 2019; W. Zhang et al. , 2019a). However, observed estimates sample multiple synoptic weather states, mixing thermodynamic and dynamic factors, so are not directly relatable to climate change responses (Bao et al., 2017; Drobinski et al., 2018). The contrasting spatial scales sampled by the observations and models (from global to cloud resolving) explain the large range of daily and sub-daily precipitation scaling with temperature assessed in Figure 8.4.
Since AR5, advances in understanding the expected changes in intense rainfall at the sub-daily time scale (Section 11.4, Figure 8.4) are provided by idealized or high resolution model experiments and observations (Westra et al., 2014; Fowler et al., 2021). There is robust evidence from simplified calculations, convection resolving models and observations that thermodynamics drives an increase in convective available potential energy (CAPE) with warming and therefore the intensity of convective storms (Singh and O’Gorman, 2013; Romps, 2016; Barbero et al., 2019). Also, declining relative humidity over land (Sections 2.3.1.3.2 and 8.2.2.1) increases lifting condensation level, thereby delaying but intensifying convective systems (Louf et al., 2019; J. Chen et al., 2020a). Larger systems are linked with increasing tropopause height (Lenderink et al., 2017) that can also amplify storm precipitation (Prein et al., 2017). However, the heaviest rainfall is not necessarily associated with the most intense (deepest) storms based on satellite data (Hamada et al., 2015; Hamada and Takayabu, 2018). Precipitation intensification can exceed thermodynamic expectations where and when additional latent heating invigorates individual storms (Section 11.4.1) as implied by medium agreement across modelling and observational studies (Berg et al. , 2013; Molnar et al. , 2015; Scoccimarro et al. , 2015; Prein et al. , 2017; Zhou and Wang, 2017; Nie et al. , 2018; Kendon et al. , 2019; Z. Zhang et al. , 2019). This intensification depends on time of day, based on convection-permitting simulations (E.P. Meredith et al., 2019).
Intensification of sub-daily rainfall is inhibited in regions and seasons where available moisture is limited (Prein et al., 2017). However, a fixed threshold temperature above which precipitation is limited by moisture availability is not supported by modelling evidence (Neelin et al., 2017; Prein et al., 2017). Enhanced latent heating within storms can also suppress convection at larger scales due to atmospheric stabilization as demonstrated with high resolution, idealized and large ensemble modelling studies (Loriaux et al. , 2017; Chan et al. , 2018; Nie et al. , 2018; Tandon et al. , 2018; Kendon et al. , 2019). Stability is also increased by the direct radiative heating effect of higher CO2 concentrations (Baker et al., 2018) and influenced by aerosol effects on the atmospheric energy budget and cloud development (Box 8.1). Since AR5, modelling evidence shows increases in convective precipitation extremes are limited by droplet/ice fall speeds (Singh and O’Gorman, 2014; Sandvik et al., 2018) but these processes are only crudely represented (Tapiador et al., 2019a). Idealized regional and coupled global models combined with limitedobservational evidence shows that instantaneous precipitation extremes are sensitive to microphysical processes, while daily extremes are determined more by the degree of convective aggregation (Bao and Sherwood, 2019; Pendergrass, 2020a).
Dynamical changes modify and can dominate thermodynamic drivers of local rainfall and flood hazard change (Box 11.1). For example, increased land –ocean temperature gradients (Section 8.2.2.2) explain more intense rain from convective systems over the Sahel based on satellite data since the 1980s (Taylor et al., 2017) and dynamical feedbacks can invigorate active to break phase transition over India (Karmakar et al., 2017; Roxy et al., 2017). Satellite data shows long-lived, organized mesoscale convective systems contribute disproportionally to extreme tropical precipitation (Roca and Fiolleau, 2020). Since AR5, the spatial variability in soil moisture has been linked with the timing and location of convective rainfall by altering the partitioning between latent and sensible heating. This was demonstrated for the Sahel, Europe and India in observations (C.M. Taylor et al., 2013; Taylor, 2015; Petrova et al., 2018; Barton et al., 2020; Klein and Taylor, 2020) but depends on the moisture-convergence regime (Welty et al., 2020). Only high-resolution convection-permitting models can capture the sub-grid scale mechanisms for convective initiation (C.M. Taylor et al. , 2013; H. Moon et al. , 2019). There is medium evidence that greater tropical cyclone rainfall totals can be caused by dynamical feedbacks (Chauvin et al., 2017) and slower propagation speed as tropical circulation weakens (Kossin, 2018). These processes amplify the thermodynamic intensification of rainfall (Section 11.7.1.2), yet observational support is weak (Chan, 2019; Lanzante, 2019; I.J. Moon et al. , 2019; Knutson et al. , 2020). Slower decay following landfall, explained by larger stores of heat and moisture at higher SSTs, can also amplify rainfall amount based on observations and modelling (Li and Chakraborty, 2020). Rainfall intensity from the outer rain bands of tropical cyclones is also increased by aerosol–cloud interactions (Box 8.1).
The amount and intensity of rainfall within extratropical storms is expected to increase with atmospheric moisture. This is particularly evident for atmospheric rivers (see Glossary) and research since AR5 has confirmed their link with flooding and terrestrial water storage (Froidevaux and Martius, 2016; Paltan et al. , 2017; Waliser and Guan, 2017; Adusumilli et al. , 2019; Ionita et al. , 2020; Payne et al. , 2020). There is robust evidence based on simple physics and detailed modelling that extratropical cyclone rainfall, including atmospheric river events, will intensify through increased atmospheric moisture flux (Lavers et al., 2013; Ramos et al., 2016; Yettella and Kay, 2017; V. Espinoza et al., 2018; Algarra et al., 2020; Xu et al., 2020; Zavadoff and Kirtman, 2020; Zhao, 2020), although changes in dynamical aspects will modify responses regionally (Section 8.4.2.8). For example, stronger latitudinal temperature gradients in the high-latitude upper troposphere drive increased extratropical storm speed around 30°N–70°N based on CMIP5 simulations (Dwyer and O’Gorman, 2017), causing reduced precipitation accumulation.
The response of flood hazard to changing rainfall characteristics depends on time and space scale and the nature of the land surface (Section 11.5.1 and FAQ 8.2). Sustained and heavy rainfall can lead to widespread flooding and landslides while intensification of short-duration intense rainfall can increase the severity and frequency of flash flooding (Marengo et al., 2013; Chan et al., 2016; Gariano and Guzzetti, 2016; Sandvik et al., 2018). Flooding events in many tropical regions (e.g., north-western South America, southern Africa and Australasia) are associated with ENSO variability (Emerton et al., 2017; Takahashi and Martínez, 2019; Pabón-Caicedo et al., 2020) and amplified by thermodynamic increases in water vapour. Flood hazard from heavy rainfall is modulated by snowmelt (Section 8.2.3.1), vegetation characteristics (Page et al., 2020; Murphy et al., 2021) and direct human intervention (Sections 8.2.3.4 and FAQ 8.2) but also can be compounded by sea level rise (Sections 4.3.2.2 and 9.6.4) in coastal and delta regions (Bevacqua et al., 2019; Ganguli and Merz, 2019; Eilander et al., 2020). Antecedent soil moisture conditions are an important modulator of flooding (Section 11.5.1) but become less important for smaller catchments and for more severe floods (Wasko and Nathan, 2019). Depleted soil moisture after more intense dry seasons (Section 8.2.2.1) can allow greater uptake of wet season rainfall before soils saturate. Since AR5, evidence confirms that more intense rainfall increases the proportion of runoff and reservoir recharge relative to infiltration into the soil (Eekhout et al., 2018; Yin et al., 2018). More intense but less frequent storms (Kendon et al., 2019) favour focused groundwater recharge through leakage from surface waters (R.G. Taylor et al., 2013a; Cuthbert et al., 2019a) and runoff and flash flooding where the percolation capacity of the soil is exceeded (Yin et al., 2018).
Increased severity of flooding on larger, more slowly-responding rivers is expected as precipitation accumulations increase during persistent wet events over a season. This can occur where atmospheric blocking patterns repeatedly steer extratropical cyclones across large river catchments, as identified for NH mid-latitudes and Asia (Takahashi et al., 2015; Pfleiderer et al., 2018; Zhou et al., 2018; Blöschl et al., 2019; Lenggenhager et al., 2019; Nikumbh et al., 2019; Zanardo et al., 2019), although groundwater flooding and antecedent conditions including soil moisture and snowmelt also play a role (Muchan et al., 2015; Berghuijs et al., 2019). Increased atmospheric moisture amplifies the severity of these events when they occur in a warmer climate, yet drivers of change in the occurrence of blocking patterns, stationary waves and jet stream position are not well understood (Section 8.2.2.2 and Cross-Chapter Box 10.1).
In summary, there is very high confidence that heavy precipitation events will become more intense in a warming climate. There is high confidence that increased moisture and its convergence within extratropical and tropical cyclones and storms will increase rainfall totals during wet events at close to the 7% °C–1 Thermodynamic response, with low confidence of higher rates for sub-daily intensities. There is medium confidence that more intense but less frequent rainfall increases the proportion of rainfall leading to surface runoff and focused groundwater recharge from temporary water bodies. There is low confidence in how the frequency of flooding will change regionally as it is strongly dependent on catchment characteristics, antecedent conditions and how atmospheric circulation systems respond to climate change, which is less certain than thermodynamic drivers (Section 11.5). However, there is high confidence that increases in precipitation intensity and amount during very wet events (from sub-daily up to seasonal time scales) will intensify severe flooding when these extremes occur.
8.2.3.3 Drivers of Aridity and Drought
Regional changes in aridity – broadly defined as a deficit of moisture – are expected to occur in response to anthropogenic forcings as a consequence of shifting precipitation patterns, warmer temperatures, changes in cloudiness (affecting solar radiation), declining snowpack, changes in winds and humidity, and vegetation cover (Figure 8.6). Evapotranspiration (see Annex VII: Glossary) is a key component of aridity, and is composed of two main processes: evaporation from soil, water and vegetation surfaces; and transpiration, the exchange of moisture between plants and atmosphere through plant stomata. On a global level, warmer temperatures increase evaporative demand in the atmosphere, and thus (assuming sufficient soil moisture is available) increase moisture loss from evapotranspiration (high confidence) (Dai et al., 2018; Vicente-Serrano et al., 2020). On a regional level, aridity is further modulated by seasonal rainfall patterns, runoff, water storage, and interactions with vegetation.
 Figure 8.6 | Climatic drivers of drought, effects on water availability, and impacts. Plus and minus signs denote the direction of change that drivers have on factors such as snowpack, evapotranspiration, soil moisture, and water storage. The three main types of drought are listed, along with some possible environmental and socio-economic impacts of drought (bottom).
 Vegetation is a crucial interface between subsurface water storage (in soil moisture and groundwater) and the atmosphere. Plants alter evapotranspiration and the surface energy balance, and thus can have a large influence on regional aridity (Lemordant et al., 2018). SRCCL concluded there is high confidence that higher atmospheric CO2 increases the ratio of plant CO2 uptake to water loss (water-use efficiency; WUE) through the combined enhancement of photosynthesis and stomatal regulation (Section 5.4.1; DeKauwe et al. , 2013; C.D. Jones et al. , 2013; Deryng et al. , 2016; Swann et al. , 2016; Cheng et al. , 2017; Knauer et al. , 2017; Peters et al. , 2018; Guerrieri et al. , 2019). Modelling studies suggest that increasing WUE can partly counteract water losses from increased evaporative demand in a warmer atmosphere, potentially mitigating aridification (Milly and Dunne, 2016; Bonfils et al. , 2017; Cook et al. , 2018; Y. Yang et al. , 2018). However, observational studies suggest that this effect may be counter-balanced by the increase in plant growth in response to elevated CO2, which results in increased water consumption (De Kauwe et al. , 2013; Donohue et al. , 2013; Ukkola et al. , 2016b; Yang et al. , 2016; Guerrieri et al. , 2019; Mankin et al. , 2019; A. Singh et al. , 2020). In semi-arid regions, increased plant water consumption can reduce streamflow and exacerbate aridification (Ukkola et al. , 2016b; Mankin et al. , 2019; A. Singh et al. , 2020). Thus, there is low confidence that increased WUE in plants can counterbalance increased evaporative demand (Cross-Chapter Box 5.1).
A drought is a period of abnormally dry weather that persists for long enough to cause a serious hydrological imbalance (Glossary; Wilhite and Glantz, 1985; Wilhite, 2000; Cook et al., 2018). Most droughts begin as persistent precipitation deficits (‘meteorological drought’) that propagate over time into deficits in soil moisture, streamflow, and water storage (Figure 8.6), leading to a reduction in water supply (‘hydrological drought’). Increased atmospheric evaporative demand increases plant water stress, leading to ‘agricultural and ecological drought’ (Williams et al. , 2013; C.D. Allen et al. , 2015; Anderegg et al. , 2016; McDowell et al. , 2016; Grossiord et al. , 2020). Evaporative demand affects plants in two ways. It increases evapotranspiration, depleting soil moisture and stressing plants through lack of water (Teuling et al., 2013; Sperry et al., 2016), and also directly affects plant physiology, causing a decline in hydraulic conductance and carbon metabolism, leading to mortality (Figure 8.6; Breshears et al., 2013; Hartmann, 2015; McDowell and Allen, 2015; Fontes et al., 2018). While droughts are traditionally viewed as ‘slow moving’ disasters that typically take months or years to develop, rapidly evolving and often unpredictable flash droughtscan also occur (Otkin et al., 2016, 2018). Flash droughtscan develop within a few weeks, causing substantial disruption to agriculture and water resources (Pendergrass et al., 2020). Conversely, droughts that persist for a long time (usually a decade or more) are called megadroughts. Droughts span a large range of spatial and temporal scales, arise through a variety of climate system dynamics (e.g., internal atmospheric variability, ocean teleconnections), and can be amplified or alleviated by a variety of physical and biological processes. As such, droughts occupy a unique space within the framework of extreme climate and weather events, possessing no singular definition.
While the role of precipitation in droughts is obvious, other climatic drivers are also important, such as temperature, radiation, wind, and humidity (Figure 8.6). These factors have a strong influence on atmospheric evaporative demand, which affects evapotranspiration and soil moisture (Figure 8.6). In snow-dominated regions, high temperatures increase the fraction of precipitation falling as rain instead of snow and advance the timing of spring snowmelt (high confidence) (Vincent et al. , 2015; Mote et al. , 2016, 2018; Berg and Hall, 2017; Solander et al. , 2018). This can result in lower than normal snowpack levels (a ‘snow drought’), and thus reduced streamflow, even if total precipitation is at or above normal for the cold season (Harpold et al., 2017). Plants also affect the severity of droughts by modulating evapotranspiration (Figure 8.6). As discussed above, the effect of elevated CO2 on plants has the potential to both increase and reduce water loss through evapotranspiration via enhanced WUE and plant growth, respectively (Figure 8.6), but there is low confidence in whether one process dominates over another at the global scale.
Drought severity also depends on human activities and decision-making (AghaKouchak et al. , 2015; Van Loon et al. , 2016; Pendergrass et al. , 2020). Societies have developed a variety of strategies to manipulate the water cycle to increase resiliency in the face of water scarcity, including irrigation, creation of artificial reservoirs, and groundwater pumping. While potentially buffering water resource capacity, in some cases these interventions may unexpectedly increase vulnerability (medium confidence). For example, while increased irrigation efficiency may ensure more water is available to crops, the corresponding reduction in runoff and subsurface recharge may exacerbate hydrologic drought (Grafton et al., 2018). Furthermore, while building dams and increasing surface reservoir capacity can boost water resources, they may actually increase drought vulnerability if demands rise to take advantage of the increased supply or if over-reliance on these surface reservoirs is encouraged (Di Baldassarre et al., 2018). Interactions between adaptation, vulnerability, and drought impacts are discussed further in WGII (Chapters 2 and 4).
In summary, there is high confidence that a warming climate drives an increase in atmospheric evaporative demand, decreasing available soil moisture. There is high confidence that higher atmospheric CO2 increases plant water-use efficiency, but low confidence that this physiological effect can counterbalance water losses. Since drought can be defined in a number of ways, there are potentially different responses under a warming climate depending on drought type. Beyond a lack of precipitation, changes in evapotranspiration are critical components of drought, because these can lead to soil moisture declines (high confidence). Under very dry soil conditions, evapotranspiration becomes restricted and plants experience water stress in response to increased atmospheric demand (medium confidence). Human activities and decision-making have a critical impact on drought severity (high confidence).
8.2.3.4 Direct Anthropogenic Influence on the Regional Water Cycle
Human activities influence the regional water cycle directly through modifying and exploiting stores and flows from rivers, lakes and groundwater and by altering land cover characteristics. These actions alter surface energy and water balances through changes in permeability, surface albedo, evapotranspiration, surface roughness and leaf area. Direct redistribution of water by human activities for domestic, agricultural and industrial use of about 24,000 km3yr–1 (Figure 8.1) is equivalent to half the global river discharge or double the global groundwater recharge each year (Abbott et al., 2019). Since AR5, both modelling studies and observations have demonstrated that land use change can drive local and remote responses in precipitation and river flow by altering the surface energy balance, moisture advection and recycling, land –sea thermal contrast and associated wind patterns (Alter et al. , 2015; Wey et al. , 2015; De Vrese et al. , 2016; Pei et al. , 2016; Wang-Erlandsson et al. , 2018; Vicente-Serrano et al. , 2019). There is robust evidence that a warming climate combined with direct human demand for groundwater will deplete groundwater resources in already dry regions (Wada and Bierkens, 2014; D’Odorico et al., 2018; Jia et al., 2019).
The SRCCL presented evidence that extraction of water from the ground or river systems and intensive irrigation increases evaporation and atmospheric water vapour locally (Jia et al., 2019; Mishra et al., 2020). Irrigation can explain declining groundwater storage in some regions, including north-western India and North America (Asoka et al., 2017; G. Ferguson et al., 2018). Simulations spanning 1960–2010 indicate that approximately 30% of the present human water consumption is supplied from non-sustainable water resources (Wada and Bierkens, 2014). However, there is onlylimited evidence that groundwater extraction is lowering streamflow (Mukherjee et al., 2018; de Graaf et al., 2019). Model experiments show that irrigation can either aggravate or alleviate climate‐induced changes of surface or subsurface water (Lenget al., 2015). Widespread extraction of water from rivers can reduce flows and decrease the level and area of inland seas and lakes (Wurtsbaugh et al. , 2017; Torres-Batlló et al. , 2020; X. Wang et al. , 2020). Between 1985 and 2015, about 139,000 km2 of inland water areas have become land, while creation of dams has converted about 95,000 km2 of land to water, particularly in the Amazon and Tibetan Plateau (Donchyts et al., 2016). Direct management of river flow is comparable in magnitude to climate change effects for snow-fed rivers at a continental scale based on a global analysis and a study of 96 Canadian catchments (Tan and Gan, 2015; Arheimer et al., 2017).
The SRCCL assessed with medium confidence that mean and extreme precipitation is increased over and downwind of urban areas (Jia et al., 2019). There is medium confidence that altered thermodynamic and aerodynamic properties of the land surface from urbanization affects evaporation and increases precipitation over or downwind of cities (Box 10.3) due to altered stability and turbulence (Han et al. , 2014; Pathirana et al. , 2014; Jiang et al. , 2016; D’Odorico et al. , 2018; Sarangi et al. , 2018; Boyaj et al. , 2020). However, reduced biogenic aerosol, but increased anthropogenic aerosol emissions modify cloud microphysics and precipitation processes (Box 8.1; Schmidand Niyogi, 2017; D’Odorico et al. , 2018; Fan et al. , 2020; Zheng et al. , 2020). Urbanization also decreases permeability of the surface, leading to increased surface runoff (Chen et al., 2017; Jia et al., 2019). Large-scale infrastructure, such as the construction and operation of dikes, weirs, and hydropower plants, also alters surface energy and moisture fluxes, potentially influencing the regional water cycle. Limited modellingevidence suggests that large-scale solar and wind farms can increase precipitation locally (over the Sahel and North America) when dynamic vegetation responses are represented (Y. Li et al., 2018; Pryor et al., 2020), with remote effects also possible (Lu et al., 2021).
Changes in land use from forest to agriculture can exert profound regional effects on the water cycle (FAQ 8.1) by modifying the surface energy balance and moisture recycling (Krishnan et al. , 2016; Paul et al. , 2016; Llopart et al. , 2018; Singh et al. , 2019). There is medium evidence from modelling and observations over the Amazon and East Africa that deforestation drives increased streamflow (Dos Santos et al., 2018; Guzha et al., 2018; Levy et al., 2018) butlimited evidence that increases in global runoff due to deforestation are counterbalanced by decreases resulting from irrigation (Hoegh-Guldberg et al., 2018). Total Amazon deforestation drives reductions in precipitation but with a large 90% confidence range (–38 to +5 %) based on 44 primarily pre-AR5 climate model simulations (Spracklen and Garcia-Carreras, 2015) with smaller reductions (–2.3 to–1.3 %) attributed to observed Amazon deforestation up to 2010. Climate model development has reduced this uncertainty range but has not altered the median change (Lejeune et al., 2015). Large-scale global deforestation (20 million km2) simulated by 9 CMIP6 models confirms a large range in precipitation amount reduction of–37 ± 54 mm yr–1 over the deforested regions (Boysen et al., 2020). However, small-scale deforestation can increase precipitation locally (Lawrence and Vandecar, 2015). A 50–60% deforestation rate corresponded to a wet season delay of about one week and greater chance of dry spells of eight days or longer based on correlation analysis of rain gauge and land-use data for South America (Leite-Filhoet al., 2019). Forest and grassland fires can also modify hydrological response at the watershed scale (Havel et al., 2018). Afforestation or reforestation aimed at removing CO2 from the atmosphere can also alter the water cycle at the regional scale (Section 8.4.3 and Cross-Chapter Box 5.1).
In summary, there is high confidence that land-use change and water extraction for irrigation drive local, regional and remote responses in the water cycle. Large-scale deforestation is likely to decrease precipitation over the deforested regions but there is low confidence in the effects of limited deforestation. There is medium confidence that deforestation drives increased streamflow relative to the responses caused by climate change. Urbanization can increase local precipitation (medium confidence) and resulting runoff intensity (high confidence). A warming climate combined with direct human demand for water is expected to deplete groundwater resources in dry regions (high confidence).
Box 8.1 | Role of Anthropogenic Aerosols in Water Cycle Changes
Aerosols affect precipitation in two major pathways, by altering the shortwave and longwave radiation and influencing cloud microphysical properties.
Aerosol radiative effects on precipitation
Aerosols scatter and absorb solar radiation which reduces the energy available for surface evaporation and subsequent precipitation. In addition, cooling is incurred by the radiation that is reflected back to space directly by the aerosols and indirectly by the aerosol effect on cloud brightening. Northern Hemisphere (NH) station data indicate decreasing precipitation trends during the 1950s to the 1980s, which have since partially recovered (Wild, 2012; Bonfils et al., 2020). These changes are attributable with high confidence to anthropogenic aerosol emissions from North America and Europe causing dimming through reduced surface solar radiation. This peaked during the late-1970s and partially recovered thereafter following improved air quality regulations (Section 6.2.1; Box 8.1, Figure 1).
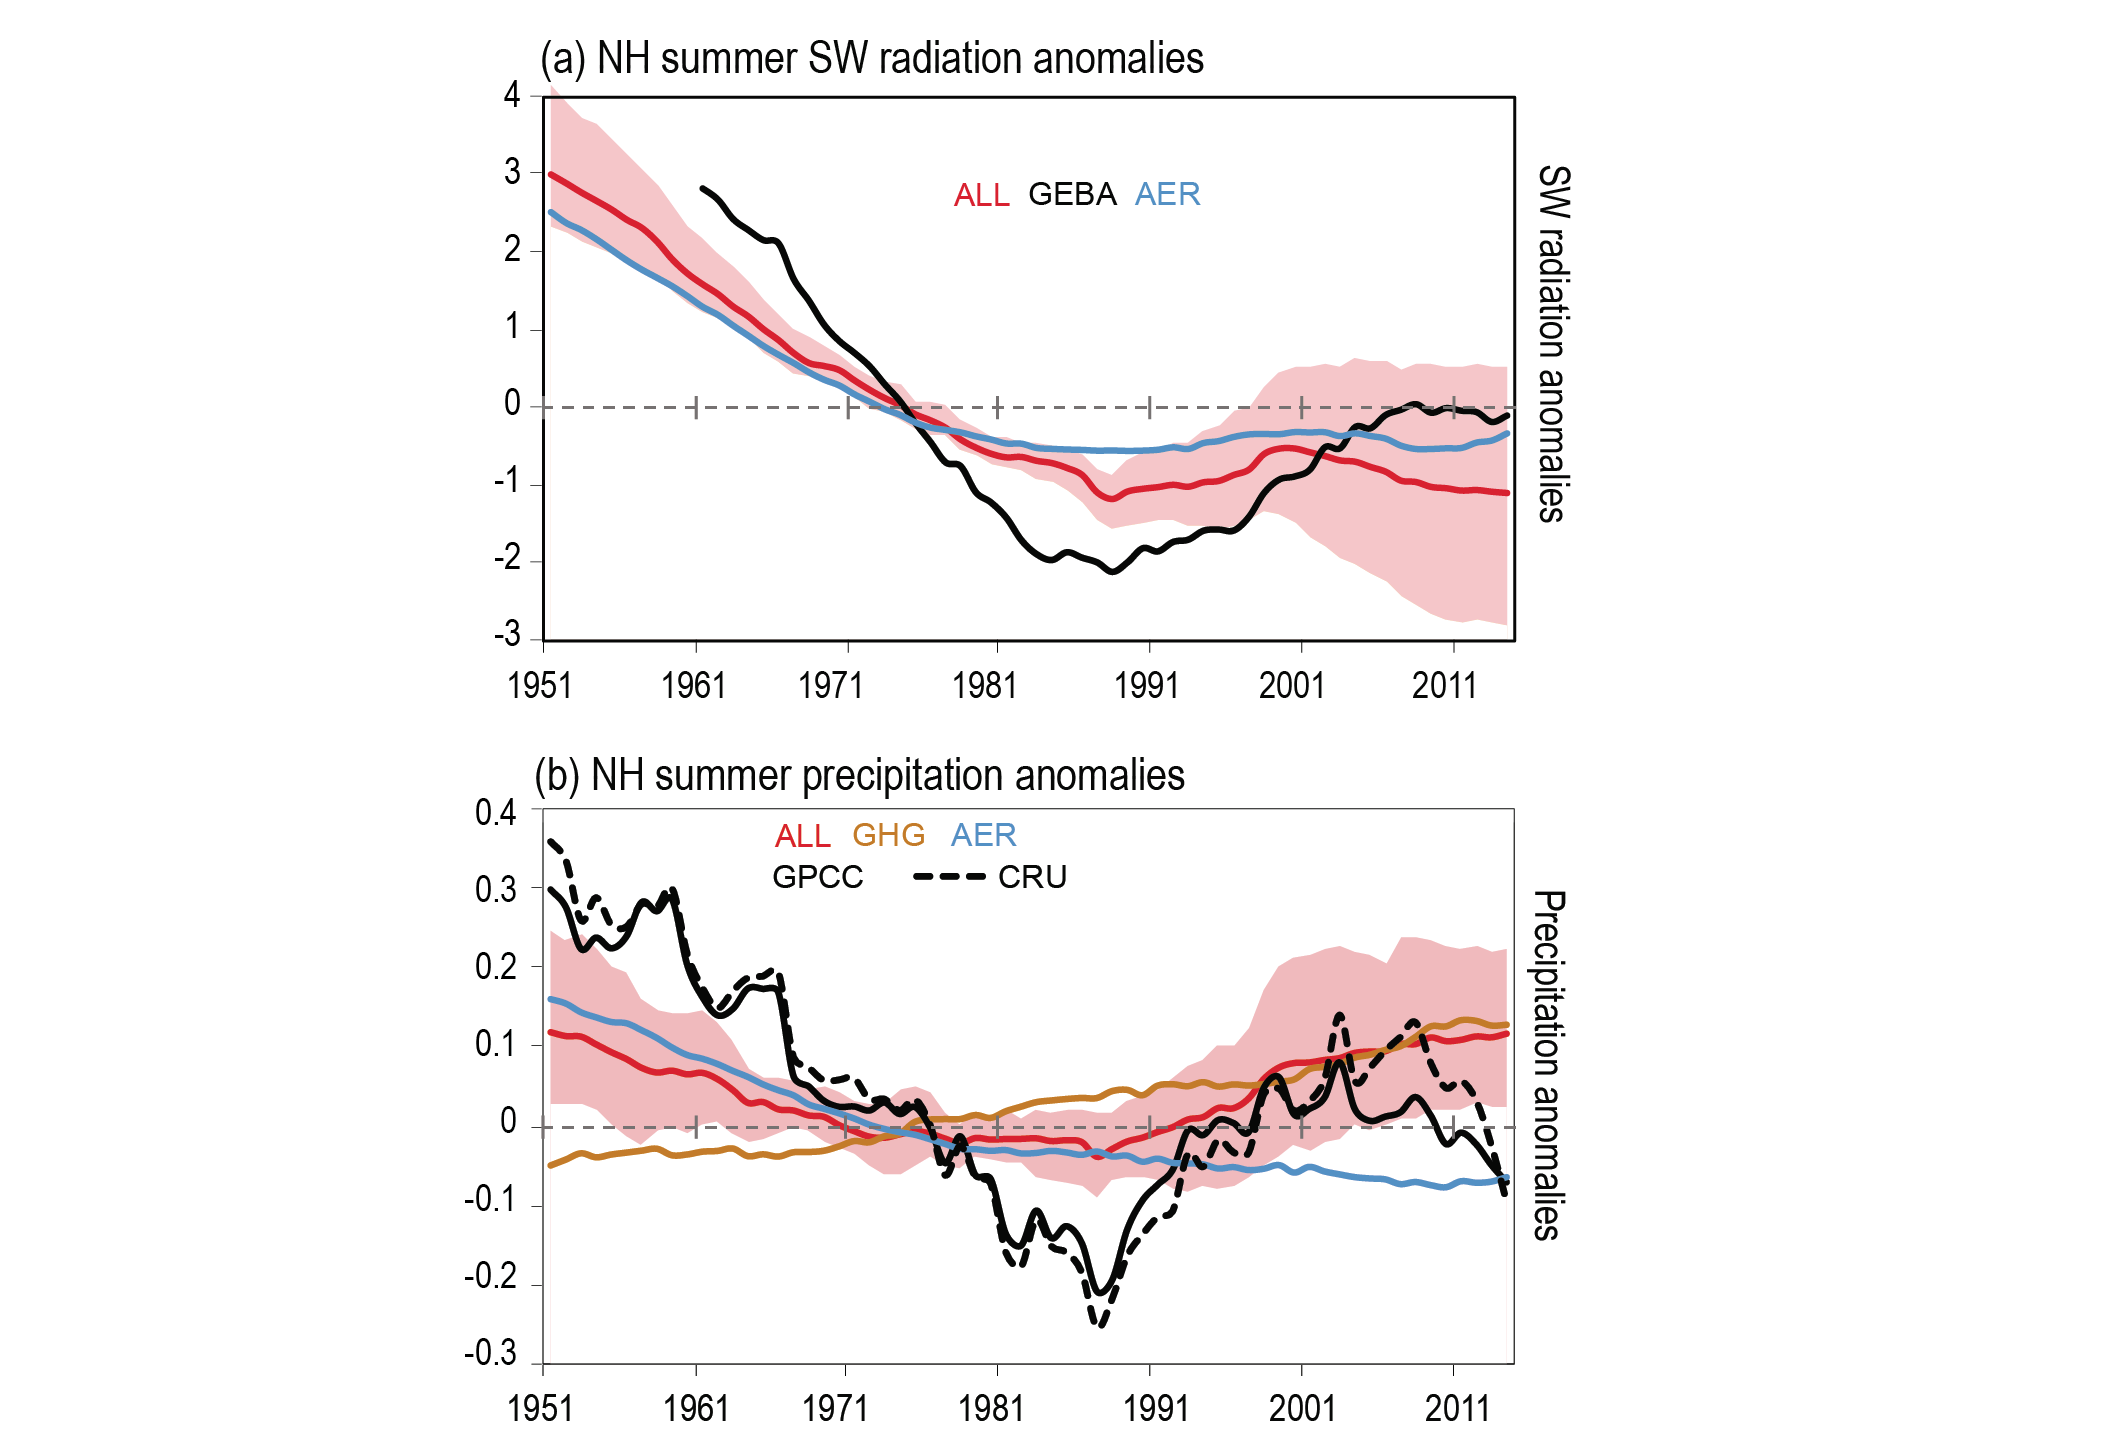
Box 8.1, Figure 1 | Northern Hemisphere surface downward radiation anomalies (W m–2; a) and precipitation anomalies (mm day–1; b) for1951–2014for summer season (May–September) monsoon region (Polson et al. , 2014) from CMIP6 DAMIP experiments. Observed solar radiation anomalies are from GEBA global data from 1961–2014 (Wild et al., 2017) and observed precipitation anomalies are from GPCC and CRU. CMIP6 multi-model mean anomalies are from all-forcings (ALL), greenhouse gas forcing (GHG) and anthropogenic aerosol forcing (AER) experiments. Anomalies are with respect to 1961–1990 and smoothed with a 11-year running mean. Red shading shows the ensemble spread of ALL forcing experiment (5–95% range). Models are masked to the GPCC data set. Further details on data sources and processing are available in the chapter data table (Table 8.SM.1).
Dimming over the NH causes a relative cooling, compared to the Southern Hemisphere (SH), which induces a southward shift of the northern edge of the tropical rain belt (Section 3.3.2.3; Allen et al., 2014; Brönnimann et al., 2015). CMIP5 simulations show that most of the cooling is caused by the aerosol cloud-mediated effect (Chung and Soden, 2017). Dimming also weakens monsoon flow and precipitation, offsetting or even overcoming the expected precipitation increase due to increased GHGs (Ayantika et al., 2021). The oceanic response to a weakened monsoon cross-equatorial flow can further weaken the South Asian monsoon through an amplifying feedback loop (Swapna et al., 2012; Krishnan et al., 2016; Patil et al., 2019). These processes partially explain (medium confidence) the southward shift of the NH tropical edge of the tropical rain belt from the 1950s to the 1980s (Allen et al., 2014; Brönnimann et al., 2015) and the severe drought in the Sahel that peaked in the mid-1980s (Rotstayn et al., 2002; Undorf et al., 2018b). These processes also explain (high confidence) the observed decrease of South East Asian monsoon precipitation during the second half of the 20th century (Figure 8.7; Bollasina et al., 2011; Sanap et al., 2015; Krishnan et al., 2016; Lau and Kim, 2017; Lin et al., 2018; Undorf et al., 2018b).
Absorption of solar radiation by anthropogenic aerosols such as black carbon warms the lower troposphere and increases moist static energy, but also results in larger convection inhibition that suppresses light rainfall (Box 8.1, Figure 2; Y. Wang et al., 2013). Release of aerosol-induced instability, often triggered by topographical barriers, produces intense rainfall, flooding (Fan et al., 2015; Lee et al., 2016) and severe convective storms (medium confidence) (Saide et al., 2015). In particular, aerosols induce intense convection at the Himalaya foothills during the pre-monsoon season, which generates a regional convergence there (medium confidence). This mechanism is termed the ‘elevated heat pump hypothesis’ (Lau and Kim, 2006; D’Errico et al., 2015).

Box 8.1, Figure 2 | Schematic depiction of the atmospheric effects of light-absorbing aerosols on convection and cloud formation: (a) without and (b) with the presence of absorbing aerosols in the planetary boundary layer. The dashed and solid blue lines correspond to the vertical temperature profiles in the absence and presence of the absorbing aerosol layer, respectively, and the solid and dashed red lines denote the dry and moist adiabats, respectively. Absorbing aerosols result in an increasing temperature in the atmosphere but a reduced temperature at the surface. The reduced surface temperature and the increased temperature aloft led to a larger negative energy associated with convective inhibition (–) and a higher convection condensation level (CCL) under the polluted conditions. On the other hand, the absorbing aerosol layer induces a larger convective available potential energy (+) above CCL, facilitating more intensive vertical development of clouds, if lifting is sufficient to overcome the larger convective inhibition. Figure from Y. Wang et al. (2013).
Aerosol cloud microphysical effects
Cloud droplets nucleate on pre-existing aerosol particles which act as cloud condensation nuclei (CCN). Anthropogenic aerosols add CCN, compared to a pristine background, and produce clouds with more numerous and smaller droplets, slower to coalesce into raindrops and to freeze into ice hydrometeors at temperatures below 0°C. Adding CCN suppresses light rainfall from shallow and short-lived clouds, but it is compensated by heavier rainfall from deep clouds. Adding aerosols to clouds in extremely clean air invigorates them by more efficient vapour condensation on the added drop surfaces (Koren et al., 2014; Fan et al., 2018). Clouds forming in more polluted air masses (hence with more numerous and smaller drops) need to grow deeper to initiate rain (Freud and Rosenfeld, 2012; Konwar et al., 2012; Campos Braga et al., 2017). This leads to larger amount of cloud water evaporating aloft while cooling and moistening the air there at the expense of the lower levels, which leads to convective invigoration (Dagan et al., 2017; Chua and Ming, 2020), followed by convergence, air mass destabilization and added rainfall in an amplifying feedback loop
Box 8.1
(Abbott and Cronin, 2021). In addition, delaying rain initiation until greater altitudes are reached transports more cloud water above the 0°C altitude and leads to additional release of latent heat of freezing and/or vapour deposition, which in combination with the added latent heat of condensation enhances the cloud updrafts (Fan et al., 2018). The stronger updrafts invigorate mixed-phase precipitation and the resultant hail and cloud electrification (Rosenfeldet al., 2008; Thornton et al., 2017). This includes the outer convective rainbands of tropical cyclones. There is medium confidence that air pollution enhances flood hazard associated with the outer rain bands at the expense of the inner rain bands (Wang et al., 2014; C. Zhao et al., 2018; Souri et al., 2020).
The aerosol effect on invigoration and rainfall from deep convective clouds peaks at moderate levels (aerosol optical depth of 0.2 to 0.3), but reverses into suppression with more aerosols (H. Liu et al., 2019). More generally, the microphysical aerosol-related processes often compensate or buffer each other (Stevens and Feingold, 2009). For example, suppressed rain by slowing drop coalescence enhances mixed-phase precipitation. Therefore, despite the potentially large aerosol influence on the precipitation forming processes, the net outcome of aerosol microphysical effects on precipitation amount has generallylow confidence, especially when evaluated with respect to the background of high natural variability in precipitation (Tao et al., 2012).
Ice nucleating particle (INP) initiate ice precipitation from persistent supercooled water clouds that have cloud droplets too small for efficient warm rain, or expedite mixed-phase precipitation in short-lived supercooled rain clouds (Creamean et al., 2013). Most INPs are desert and soil dust particles, rather than air pollution aerosols (DeMott et al., 2010). Biogenic particles from terrestrial and marine origin are more rare, but important at temperatures above about–15°C (Murray et al., 2012; DeMott et al., 2016). Dust particles from long-range transport across the Pacific were found to enhance snow-forming processes over the Sierra Nevada in California (Creamean et al., 2013; Fan et al., 2014). The impact of INPs was demonstrated by glaciogenic cloud seeding experiments, which enhanced orographic supercooled clouds with medium confidence of success (French et al., 2018; Rauber et al., 2019; Friedrich et al., 2020). There are still major gaps in understanding the effects of INPs mainly on deep convective clouds (Kanji et al., 2017; Stanford et al., 2017; Korolev et al., 2020).
8.3 How Is the Water Cycle Changing and Why?
This section focuses on the evaluation and attribution of past and recent water cycle changes using observational datasets, theoretical understanding and model simulations. Paleoclimate records and historical observations provide evidence for past water cycle changes caused both by natural variability and human activities (Haug et al., 2003; Buckley et al., 2010; Pederson et al., 2014). Key elements of the observed water cycle changes are assessed in this section, including flux and storage variations across the atmosphere, the continents and to a lesser extent the ocean and cryosphere, as well as related changes in large-scale atmospheric circulation and modes of variability. Particular emphasis is placed on assessing changes across regions and seasons (Box 8.2). Detailed regional assessments are presented in Chapters 10, 11, 12 and Atlas. Further information concerning large-scale observed water cycle changes and their attribution is available in Sections 2.3.1.3 and 3.3.2.
8.3.1 Observed Water Cycle Changes Based on Multiple Datasets
This section provides a process-based evaluation and a comprehensive assessment of observed water cycle changes by integrating multiple lines of evidence including paleoclimate data, historical datasets, theoretical understanding (Section 8.2) and model simulations.
8.3.1.1 Global Water Cycle Intensity and P–E Over Land and Oceans
The human influence on the global water cycle is often summarized as an intensification (Huntington, 2006; DeAngelis et al., 2015; W. Zhang et al., 2019b) or an overall strengthening which has been observed since at least 1980 (high confidence) (see Chapter 2). There is, however, no unique definition of the global water cycle intensity (Trenberth, 2011; Ficklin et al., 2019; Sprenger et al., 2019). One simple metric is the global and annual mean amount of precipitation. Although an increase in global precipitation is consistent with physical expectations (Section 8.2.1), it has not yet been detected and attributed to human activities given large observational uncertainties and low signal-to-noise ratio (Section 3.3.2.2). Other metrics are more suitable to detect and attribute changes in the global water cycle, including the likely increase in global land precipitation since 1950 (Section 2.3.1.4) which is likely due to a human influence (Section 3.3.2.3).
The flux of freshwater between the ocean and atmosphere is determined by the difference between precipitation and evaporation (P–E). Evaporation is measured in very few locations across the global ocean, so that directly assessing P–E over the ocean is very challenging and relies on indirect reanalysis estimates (Robertson et al., 2020). The AR5 presented robust evidence ofan amplifiedoceanic pattern in P–E since the 1960s from both regional and global surface and subsurface salinity measurements and reanalyses. This pattern is consistent with our theoretical understanding of human-induced changes in the water cycle, leading to the conclusion that these changes are very likely the result of anthropogenic forcings (Section 9.2.2.2).
In contrast, AR5 did not provide a conclusive assessment of observed changes in P–E over land. Continental P–E estimated from reanalyses and data-driven land surface models indicate that interannual variations are linked to ENSO (Robertson et al., 2014, 2020). Increasing trends in P–E since 1979 based on land models are not statistically significant. Observations and models show evidence that P–E increases in the wet parts and decreases in the dry parts of tropical circulation systems, which shift in location seasonally and from year to year, with increases in seasonality since 1979 (see Box 8.2; Chou et al., 2013; Liu and Allan, 2013; Fu and Feng, 2014).
In summary, a low signal-to-noise ratio, observational uncertainties and current data assimilation techniques limit the assessment of recent global trends in P–E over both land and ocean. It is likely that the global land P–E variations observed since the late 1970s were dominated by internal variability, mostly linked to ENSO teleconnections (medium confidence). In contrast, the attribution of changes in sea surface salinity (Section 3.5.2.2) suggests that it is extremely likely that human influence has contributed to the regional changes in P–E observed over the global ocean since the mid-20th century.
8.3.1.2 Water Vapour and Its Transport
The AR5 presented evidence of increases in global near-surface and tropospheric specific humidity since the 1970s but with medium confidence of a slowing of near-surface moistening trends over land associated with reduced relative humidity since the late 1990s. According to AR5, radiosonde, Global Positioning System (GPS) and satellite observations of tropospheric water vapour indicate very likely increases at near global scales since the 1970s occurring at a rate that is generally consistent with the Clausius–Clapeyron relation (about 7% °C–1 at low altitudes) and the observed atmospheric warming (Hartmann et al., 2013).
Since AR5, it is very likely that increases in global atmospheric water vapour were observed based on in situ, satellite and reanalysis data (with medium confidence in the magnitude; Section 2.3.1.3). Satellite records show increases in upper tropospheric water vapour (constant relative humidity while temperatures have increased) since 1979 (E.-S. Chung et al. , 2014; Blunden and Arndt, 2020), to which human influence has likely contributed (Section 3.3.2.2). Combined satellite and reanalysis estimates and CMIP6 atmosphere-only simulations (1988–2014) show global mean precipitable water vapour increases of 6.7 ± 0.3 % °C–1, very close to the Clausius–Clapeyron rate (Allan et al., 2020). Satellite-based products show increases close to the Clausius–Clapeyron rate over the ice-free oceans (about 7 to 9 % °C–1; 1998–2008), but reanalysis estimates outside this range (Schröder et al., 2019) are an expected consequence of their changing observing systems (Allan et al., 2014; Parracho et al., 2018). Increases in precipitable water vapour are found over the central and sub-Arctic based on multiple reanalyses with some corroboration from sparse, in situ data (Vihma et al., 2016; Rinke et al., 2019; Nygård et al., 2020).
Declining near-surface relative humidity over land areas (e.g., the USA, Mediterranean, South Asia, South America and southern Africa) is evident in surface observations (Willett et al., 2014, 2020; Dunn et al., 2017). This is consistent with a faster rate of warming over land than ocean (Sections 2.3.1.3 and 8.2.2.1; Byrne and O’Gorman, 2018). CMIP5 simulations underestimate the observed decreases in relative humidity over much of global land during 1979–2015 (Douville and Plazzotta, 2017; Dunn et al., 2017)even when observed SSTs are prescribed (–0.05 to –0.25% per decade compared with an observed rate of –0.4 to –0.8% per decade). It is not yet clear if this discrepancy is related to internal variability or can be explained by deficiencies in models (Vannière et al., 2019; Douville et al., 2020)or observations (Willett et al., 2014). Over the NH mid-latitude continents, there is medium confidence that human influence has contributed to a decrease in near-surface relative humidity in summer(Sections 2.3.1.3 and 3.3.2.3).
Water vapour transport (or convergence) estimates from observations have substantial uncertainties even in regions of high quality radiosonde data. Consequently many studies use reanalyses for water transport estimates instead of instrumental observations. For example, increases in low-level (800–1000 hPa) moisture convergence into the tropical wet regime with a smaller outflow increase in the mid-troposphere (400–800 hPa) with warming was detected in one reanalysis (ERA-Interim; Allan et al., 2014). Modelling evidence combined with statistical analysis demonstrate consistency between reanalysis moisture convergence and P–E over land (Robertson et al., 2016). Advances in reanalysis representation of atmospheric moisture and winds in addition to new observational isotope analysis have improved the ability to identify the main sources of water vapour for key continental regions and quantify the relative contributions from moisture advection and recycling (Gimeno et al. , 2012; van Der Ent et al. , 2014; Joseph et al., 2016).
Observed changes in moisture transport can also arise from changes in atmospheric circulation as well as thermodynamics. For instance, moisture transport into the Arctic region estimated from reanalyses datasets is consistent with radiosonde data (Dufour et al., 2016), with increases since 1979 linked to atmospheric circulation (Nygård et al., 2020). Moisture transport into the Eurasian Arctic was identified to increase by 2.6% per decade during 1948–2008 based on a reanalysis estimate (X. Zhang et al., 2013). More intense moist intrusions associated with atmospheric rivers affecting the Arctic and Europe have been documented since 1979, but with a substantial influence from decadal internal variability (Ummenhofer et al., 2017; Mattingly et al., 2018). A recent strengthening of tropical circulation and associated moisture convergence has been identified since around 2000 for the Amazon region (Arias et al. , 2015; Barichivich et al. , 2018; J.C. Espinoza et al. , 2018; X.Y. Wang et al. , 2018). This was also strenghtened by increased moisture transport from the North Atlantic, driving more abundant latent heat release (Segura et al., 2020) and leading to an increased frequency of extreme floods in the northern Amazon (Barichivich et al., 2018; Heerspink et al., 2020). Overall, increased moisture transport has been linked to increased precipitation over wet tropical land areas (Gimeno et al., 2020) and to more extreme and persistent wet and dry weather events (Konapala et al., 2020) in many regions worldwide.
In summary, there is high confidence that human-caused global warming has led to an overall increase in water vapour and moisture transport throughout the troposphere, at least since the mid-1990s. In particular, there is high confidence that moisture transport into the Arctic has increased but only medium confidence in the attribution of such a trend to a human influence. There is medium confidence that human influence has contributed to a decrease in near-surface relative humidity over the Northern Hemisphere mid-latitude continents during summer(see also Sections 2.3.1.3 and 3.3.2.3).
8.3.1.3 Precipitation Amount, Frequency and Intensity
This section assesses observed changes in precipitation at global and regional scales. Note that changes in precipitation seasonality are assessed in Box 8.2 and that changes in regional monsoons are assessed in section 8.3.2.4 where observed changes in both circulation and rainfall are considered. Further assessment of regional changes in precipitation is presented in Chapters 10, 12 and Atlas, while extreme precipitation is presented in Chapter 11.
The AR5 concluded that it is likely there has been an overall increase in annual mean precipitation amount over mid-latitude land areas in the NH, with low confidence since 1901, butmedium confidence after 1951. There is further evidence of a faster increase since the 1980s (medium confidence) (Sections 2.3.1.3.4 and 3.3.2.2). Precipitation has increased from 1950 to 2018 over mid-high latitude Eurasia, most of North America, south-eastern South America, and north-western Australia, while it has decreased over most of Africa, eastern Australia, the Mediterranean region, the Middle East, and parts of East Asia, central South America, and the Pacific coasts of Canada, as simulated by the CMIP5 multi-ensemble mean (Dai, 2021). Since AR5, there have been updates of several precipitation datasets, including satellite estimates, reanalysis and merged products (Adler et al., 2017; Roca, 2019). However, observational uncertainties remain an issue for assessing regional trends in seasonal or annual mean precipitation amount (Hegerl et al. , 2015; Maidment et al. , 2015; Sarojini et al. , 2016; Beck et al. , 2017), as well as the convective and stratiform types of precipitation (e.g., Ye et al., 2017). Precipitation trends at regional scales are dominated by internal variability across much of the world (Knutson and Zeng, 2018). Regional changes in precipitation amounts can also be obscured by contrasting responses to GHG compared with aerosol forcings (Wu et al., 2013; Hegerl et al., 2015; Xie et al., 2016; Zhao and Suzuki, 2019; Zhao et al., 2020) and changes in precipitation intensity versus frequency (Shang et al., 2019).
Global and regional changes in precipitation frequency and intensity have been observed over recent decades. An analysis of 1875 rain gauge records worldwide over the period 1961–2018 indicates that there has been a general increase in the probability of precipitation exceeding 50 mm day–1, mostly due to an overall boost in rain intensity (Benestad et al., 2019). Such changes in precipitation intensity and frequency have not been formally attributed to human activities, but are consistent with the heating effect of increasing CO2 levels on the distribution of daily precipitation rates (Section 8.2.3.2) and with a distinct overall intensification of heavy precipitation events found in both observations and CMIP5 models, though with an underestimated magnitude (Fischer and Knutti, 2014). Beyond amplified precipitation extremes (Section 11.4.2), CMIP5 models also indicate that anthropogenic forcings have increased temporal variability of annual precipitation amount over land from 1950 to 2005, which is most pronounced in annual mean daily precipitation intensity (Konapala et al., 2017).
Anthropogenic aerosols can alter precipitation intensities both through radiative and microphysical effects (Box 8.1 and Section 8.5.1.1.2). Precipitation suppression through aerosol microphysical effects has been observed in shallow cloud regimes over South America and the south-eastern Atlantic, associated with local biomass burning (Andreae et al., 2004; Costantino and Bréon, 2010), and in industrial regions in Australia (Rosenfeld, 2000; Hewson et al., 2013; Heinzeller et al., 2016). In contrast, precipitation intensification through aerosol microphysical effects in deep convective clouds is seen in many regions such as the Amazon, southern USA, India, and Korea. This is associated with anthropogenic aerosols from cities (Hewson et al., 2013; Fan et al., 2018; S.S. Lee et al., 2018; Sarangi et al., 2018).
In the tropics, increases in precipitation amount are observed in convergence zones and decreases in the descending branches of the atmospheric circulation since 1979 (Chou et al., 2013; Liu and Allan, 2013; Gu et al., 2016; Polson et al., 2016; Polson and Hegerl, 2017), consistent with increased moisture transports with warming (Gimeno et al., 2020). Over tropical land areas, there is substantial variability in the ‘wet convergent regimes get wetter’ and ‘dry divergent regimes get drier’ pattern of trends observed since 1950 that are modulated by decadal changes in ENSO (Liu and Allan, 2013; Gu and Adler, 2018). CMIP6 models indicate an increased contrast between wet and dry regions in the tropics and subtropics (Figure 8.7; Schurer et al., 2020). This provides further evidence that rainfall has increased in wet regimes, and slightly decreased in dry regimes over the period 1988–2019 (Figure 3.14). This greater contrast is primarily attributable to greenhouse gas forcings, although the observed trends are statistically larger than the model responses (Section 3.3.2.3).
Over the African continent, there are distinct precipitation trends observed in multiple datasets since the 1980s (Figure 8.7; Maidment et al., 2015; P. Nguyen et al., 2018). Increases in intense convective storms affecting the Sahel have been attributed to increased land –ocean temperature gradients (Taylor et al., 2017), enhanced by intense heating of the Sahara (Dong and Sutton, 2015) rather than thermodynamics (Section 8.2.2). Changes in Sahel rainfall, with reduced precipitation amounts from the 1960s to the 1980s and a subsequent recovery, are assessed in Sections 8.3.2.4.3 and 10.4.2.1. In eastern Africa, decreasing precipitation amount (−2 to −7 % per decade for 1983–2010) was reported for the March to May ‘long rains’ season (Lyon and Dewitt, 2012; Viste et al., 2013; Liebmann et al., 2014; Maidment et al., 2015; Rowell et al., 2015) and evidence of a recovery since, with internal variability playing a large role in these decadal changes (Wainwright et al., 2019). In contrast, the second ‘short rains’ season in eastern Africa (October to December) does not exhibit significant precipitation trends (Rowell et al., 2015). Increases in annual southern African rainfall of 6–7% per decade during 1983–2010 are linked with the Pacific Decadal Oscillation (PDO; Maidment et al., 2015).
 Figure 8.7 | Linear trends in annual mean precipitation (mm day–1per decade) for 1901–1984 (left) and 1985–2014 (right): (a, e) observational dataset, and the CMIP6 multi-model ensemble mean historical simulations driven by: (b, f) all radiative forcings; (c, g) GHG-only radiative forcings; (d, h) aerosol-only radiative forcings experiment. Colour shades without grey cross correspond to the regions exceeding 10% significant level. Grey crosses correspond to the regions not reaching the 10% statistically significant level. Nine CMIP6-DAMIP models have been used having at least three members. The ensemble mean is weighted per each model on the available and used members. Further details on data sources and processing are available in the chapter data table (Table 8.SM.1).
 (Section 8.3.1.6 assesses changes in precipitation over the Mediterranean region and its connection with drought and aridity.
Rainfall increases have been observed over northern Australia since the 1950s, with most of the increases occurring in the north-west (Dey et al., 2019a, b; Dai, 2021) and decreases observed in the north-east (J. Li et al., 2012) since the 1970s. In contrast, there has been a decline in rainfall over southern Australia related to changes in the intensification and position of the subtropical ridge (CSIRO and BoM, 2015) and anthropogenic effects (Knutson and Zeng, 2018). The drying trend over south-west Australia is most pronounced during May to July, where rainfall has declined by 20% below the 1900–1969 average since 1970 and by about 28% since 2000 (BoM and CSIRO, 2020).
Over South America, there is observational and paleoclimate evidence of declining precipitation amount during the past 50 years over the Altiplano and central Chile, primarily explained by the PDO but with at least 25% of the decline attributed to anthropogenic influence (Morales et al., 2012; Neukom et al., 2015; Boisier et al., 2016; Seager et al., 2019b; Garreaud et al., 2020). In contrast, a significant rainfall increase has been detected over the Peruvian–Bolivian Altiplano (from observational data and satellite-based estimations) since the 1980s (Figure 8.7; Imfeld et al., 2020; Segura et al., 2020). Long-term (1902–2005) precipitation data indicate positive trends over south-eastern South America and negative trends over the southern Andes, with at least a partial contribution from anthropogenic forcing (Gonzalez et al., 2014; Vera and Díaz, 2015; Díaz and Vera, 2017; Boisier et al., 2018; Knutson and Zeng, 2018; see further assessment in Section 10.4.2.2 and Atlas.7.2.2). The Peruvian Amazon has exhibited significant rainfall decreases during the dry season since 1980 (Lavado et al., 2013; Ronchail et al., 2018). Increases in wet season rainfall in the northern and central Amazon since the 1980s and decreases during the dry season in the southern Amazon (Barreiro et al., 2014; Gloor et al., 2015; Martín-Gómez and Barreiro, 2016; J.C. Espinoza et al., 2018; X.Y. Wang et al., 2018; Haghtalab et al., 2020) are not explained by radiative forcing based on CMIP6 experiments (Figure 8.7) and trends are insignificant over longer periods since 1930 (Kumar et al., 2013)or more recently, since 1973 (Almeida et al., 2017). See (Section 8.3.2.4.5 for monsoon-related changes. For the tropical Andes region, trends in annual precipitation show heterogenous patterns, ranging between –4% per decade and +4% per decade in the northern and southern tropical Andes for a 30-year period at the end of the 20th century, although increases during 1965–1984 and decreases since 1984 have been registered in Bolivia (Carmona and Poveda, 2014; Pabón-Caicedo et al., 2020).
Over China, annual precipitation totals changed little from 1973 to 2016, but precipitation intensity significantly increased at a rate of 0.12 mm day–1 per decade, while the number of days with precipitation exceeding 0.1 mm day–1significantly decreased at a rate of 0.9 days per decade (Shang et al., 2019). There is consistency in trend estimates during 1998–2015 over mainland China among satellite-based products and station data, which show increased precipitation amounts in autumn and winter and decreases in summer (Chen and Gao, 2018), consistent with a decreased intensity of East Asian monsoon precipitation (Lin et al., 2014; Deng et al., 2018). Further assessment of precipitation changes over the South and South East Asian and the East Asian monsoon regions is presented in Section 8.3.2.4. An increasing trend in the frequency of heavy rainfall occurrences at the expense of low and moderate rainfall occurrences is found over central India (Krishnan et al., 2016; Roxy et al., 2017) and over eastern China with the latter due to increasing high aerosol levels (Qian et al., 2009; J. Guo et al., 2017; Xu et al., 2017; Day et al., 2018), consistent with the effects of absorbing aerosol on stability and convective inhibition (Box 8.1).
Observed precipitation records since the early 1900s show increases in precipitation totals over central and north-eastern North America that are attributable to anthropogenic warming but larger in magnitude than found in CMIP5 simulations (Knutson and Zeng, 2018; Guo et al., 2019). Decreases in precipitation amount over the central and south-western USA and increases over the north-central USA during 1983–2015 (Cui et al., 2017; P. Nguyen et al., 2018), are not clearly associated with forced responses in CMIP6 simulations (Figure 8.7; see also Section 10.4.2.3). Over Europe, precipitation trends since 1979 do not show coherence across datasets (Zolina et al., 2014; P. Nguyen et al., 2018). Longer records since 1910 show increases for much of Scandinavia, north-western Russia, and parts of north-western Europe/United Kingdom and Iceland (Knutson and Zeng, 2018). Records since 1930 show increases of annual preciptation amount over western Russia (see also Atlas.8.2). Widespread increases in daily precipitation intensity appear clearly over regions with a high density of rain gauges, such as Europe and North America over the 1951–2014 period (Alexander, 2016). Observations during 1966–2016 over northern Eurasia show increases in the contribution of heavy convective showers to total precipitation by 1–2% on average (with local trends of up to 5%) for all seasons except for winter (Chernokulsky et al., 2019). Increases in convective precipitation intensity have been identified, particularly on sub-daily time scales, using a range of modelling and observational data (Berg et al., 2013; Kanemaru et al., 2017; Pfahl et al., 2017).
Snowfall is an important component of precipitation in high-latitude and mountain watersheds. Reanalysis data indicate significant reductions in annual mean potential snowfall areas over NH land by 0.52 million km2 per decade, with the largest decline over the Alps, with snow water equivalent reductions of about 20 mm per decade (Tamang et al., 2020). In the Tibetan Plateau, region-wide winter snowfall has increased but summer snowfall has decreased during the 1960–2014 period (Deng et al., 2017). State-of-the-art model simulations indicate reduced mean annual snowfall in the Arctic, despite the strong precipitation increase, mainly in summer and autum, when temperatures are close to the melting point (Bintanja and Andry, 2017).
In summary, regional changes in precipitation amounts can be obscured by the contrasting responses to GHG and aerosol forcings across much of the 20th century and can thus be dominated by internal variability at decadal to multi-decadal time scales (high confidence). There is, however, a detectable increase in northern high-latitude annual precipitation over land which has been primarily driven by human-induced global warming (high confidence) (Section 3.3.2). Human influence has strengthened the zonal mean precipitation contrast between the wet tropics and dry subtropics since the 1980s (medium confidence), although regional studies suggest a more complex precipitation response to evolving anthropogenic forcings. There is high confidence that daily mean precipitation intensities have increased since the mid-20th century in a majority of land regions with available observations and it is likely that such an increase is mainly due to GHG forcing (see Section 11.4). Section 8.3.2.4 assesses monsoon precipitation changes in detail.
8.3.1.4 Evapotranspiration
The AR5 assessed that there was medium confidence that pan evaporation declined in most regions over the last 50 years, yetmedium confidence that evapotranspiration increased from the early 1980s to the late 1990s. Since AR5, these conflicting observations have been attributed to internal variability and by the fact that evapotranspiration is less sensitive to trends in wind speed and is partly controlled by vegetation greening (K. Zhang et al., 2015; Y. Zhang et al., 2016; Z. Zeng et al., 2018b). Observation-based estimates show a robust positive trend in global terrestrial evapotranspiration between the early 1980s and the early 2010s (Miralles et al., 2014b; Z. Zeng et al., 2014, 2018b; K. Zhang et al., 2015; Y. Zhang et al., 2016). The rate of increase varies among datasets, with an ensemble mean terrestrial average rate of 7.6 ± 1.3 mm yr–1 per decade for 1882–2011 (Z. Zeng et al., 2018a). In addition, a decreasing trend in pan evaporation plateaued or reversed after the mid-1990s (C.M. Stephens et al., 2018) has been reported as due to a shift from a dominant influence of wind speed to a dominant effect of water vapour pressure deficit, which has increased sharply since the 1990s (Yuan et al., 2019). The absence of a trend in evapotranspiration in the decade following 1998 was shown to be at least partly an episodic phenomenon associated with ENSO variability (Miralles et al. , 2014b; K. Zhang et al. , 2015; Martens et al. , 2018). Thus, there is medium confidence that the apparent pause in the increase in global evapotranspiration from 1998 to 2008 is mostly due to internal variability. In contrast to AR5, there are now consistent trends in pan evaporation and evapotranspiration at the global scale, given the recent increase in both variables since the mid-1990s (medium confidence). Given the growing number of quantitative studies, there is high confidence that global terrestrial annual evapotranspiration has increased since the early 1980s.
Since AR5, the predominant contribution of transpiration to the observed trends in terrestrial evapotranspiration has been revisited and confirmed (Good et al., 2015; Wei et al., 2017). Using satellite and ecosystem models, Zhu et al. (2016) found a positive trend in leaf area index during 1982–2009, indicating that greening could contribute to the observed positive trend of evapotranspiration, in line withsimilar studies that focused on the 1981–2012(Y. Zhanget al. , 2016) and1982–2013(K. Zhanget al. , 2015) periods. Zeng et al. (2018) determined that the 8% global increase in satellite-observed leaf area index between the 1980s and the 2010s may explain an increase in evapotranspiration of 12.0 ± 2.4 mm yr–1 (about 55 ± 25% of the total observed increase). Forzieri et al. (2020) estimated that the recent increase in leaf area index led to 3.66 ± 0.45 W m–2 in latent heat flux (about 51 ± 6 mm yr–1) and that the sensitivity of energy fluxes to leaf area index increased by about 20% over the 1982–2016 period. Overall, there is medium confidence that greening has contributed to the global increase in evapotranspiration since the 1980s.
Plant water use efficiency(WUE)is expected to rise with CO2levels (high confidence) (Section 8.2.3.3 and Box 5.2), andcan in theory counteract rising evapotranspiration in a warmer atmosphere (Section 8.2.3.3). However, observational studies suggest that this may not be the case in some ecosystems. For example, Frank et al. (2015) found that while the WUE increased in European forests across the 20th century, transpiration also increased due to more plant growth, a lengthened growing season, and increased evaporative demand. Likewise Guerrieri et al. (2019) observed that while WUE and photosynthesis increased in North American forests, stomatal conductance experienced only modest declines that were restricted to moisture-limited forests. Other studies further suggest that in many ecosystems increased WUE will not compensate for increased plant growth, amplifying declines in surface water availability(De Kauweet al. , 2013; Ukkolaet al. , 2016b; A. Singhet al. , 2020), while drought conditions can also offset the CO2 fertilization effect and lead to a decline in WUE (N. Liu et al., 2020). There is low confidence regarding the impact of plant physiological effects on observed trends in evapotranspiration.
An increasing number of studies have identified signals of attribution in the recent observed trends in evapotranspiration. Douville et al. (2013) found that the post-1960 rise in evapotranspiration in both the mid-latitudes and northern high latitudes was related to anthropogenic radiative forcing. An analysis of CMIP5simulations suggests that anthropogenic forcing accounts for a large fraction of the global mean evapotranspiration trend from 1982 to 2010 (Dong and Dai, 2017). Padrón et al. (2020) determined that increases in evapotranspiration were responsible for the majority of the anthropogenic pattern in dry-season water availability that dominates global trends since 1984. These findings are further supported by CMIP6 model results (Figure 8.8) that show that the recent summer increase in evapotranspiration in the northern mid- and high latitudes is due to GHG forcing and decreasing anthropogenic aerosol emissions over Europe.
 Figure 8.8 | Linear trends in annual mean evapotranspiration (mm day–1 per decade) for1901–1984 (left) and 1985–2014 (right): (a, e) Land Model Intercomparison Project (LMIP) and observational dataset, and the CMIP6 multi-model ensemble mean historical simulations driven by (b, f) all radiative forcings, (c, g) GHG-only radiative forcings, (d, h) aerosol-only radiative forcings experiment. Colour shade without grey cross correspond to the regions exceeding 10% significant level. Grey crosses correspond to the regions not reaching the 10% statistically significant level. Nine CMIP6-DAMIP models have been used having at least three members. The ensemble mean is weighted per each model on the available and used members. The Global Land Data Assimilation System (GLDAS) was not available over the early 20th century so was replaced by a multi-model off-line reconstruction, LMIP, which is consistent with GLDAS over the recent period but may be less reliable over the early 20th century given larger uncertainties in the atmospheric forcings. Further details on data sources and processing are available in the chapter data table (Table 8.SM.1).
 In summary, there is high confidence that terrestrial evapotranspiration has increased since the 1980s. There is medium confidence that this trend is driven by both increasing atmospheric water demand and vegetation greening, and high confidence that it can be partly attributed to anthropogenic forcing. There is low confidence about the extent to which increases in plant water use efficiency have influenced observed changes in evapotranspiration.
8.3.1.5 Runoff, Streamflow and Flooding
The AR5 reported low confidence in the assessment of trends in global river discharge during the 20th century. This is because many streamflow observations have been impacted by land use and dam construction, and the largest river basins worldwide differ in many characteristics, including geography and morphology. In regions with seasonal snow storage, AR5 WGII assessed that there is robust evidence and high agreement that warming has led to earlier spring discharge maxima and robust evidence of earlier breakup of Arctic river ice, as well as indications that warming has led to increased winter flows and decreased summer flows where streamflows are lower and that the observed increases in extreme precipitation led to greater probability of flooding at regional scales with medium confidence. The SROCC found robust evidence and high agreement that discharge due to melting glaciers has already reached its maximum point and has begun declining with smaller glaciers, but onlylow confidence that anthropogenic climate change has already affected the frequency and magnitude of floods at the global scale.
Significant trends in streamflow and continental runoff were observed in 55 out of 200 large river basins during 1948–2012, with an even distribution of increasing and decreasing trends (Section 2.3.1.3.6; Dai, 2016). A global detection and attribution study shows that the simulation of spatially heterogeneous historical trends in streamflow is consistent with observed trends only if anthropogenic forcings are considered (Gudmundsson et al., 2019). Section 3.3.2.4 assesses with medium confidence that anthropogenic climate change has altered regional and local streamflows, although a significant trend has not been observed in the global average (Sections 2.3.1.3.6 and 3.3.2.3). Multiple human-induced and natural drivers have been shown to play an important but variable role in observed regional trends of streamflow for several different areas (Fenta et al. , 2017; Ficklin et al. , 2018; Glas et al. , 2019; Vicente-Serrano et al. , 2019). For instance, decreasing runoff during the dry season has been observed over the Peruvian Amazon since the 1980s (Lavado et al., 2013; Ronchail et al., 2018). Up to 30–50% of the recent multi-decadal decline in streamflow across the Colorado River Basin can be attributed to anthropogenic warming and its impacts on snow and evapotranspiration (Woodhouse et al., 2016; McCabe et al., 2017; Udall and Overpeck, 2017; Xiao et al., 2018; Milly and Dunne, 2020). In the Upper Missouri River basin, Martin et al. (2020) found that warming temperatures have contributed to streamflow reductions since at least the late 20th century. Cold regions in the NH have experienced an earlier occurrence of snowmelt floods, an overall increase in water availability and streamflow during winter, and a decrease in water availability and streamflow during the warm season (Aygün et al., 2019).
Some studies have suggested that dam construction and water withdrawals can be the dominant drivers in observed trends in streamflow amount (Wada et al., 2013). Regionally, land-use and land cover changes have been identified as important factors for streamflow (H. Chen et al., 2020). The impact of surface dimming from aerosol emissions on evaporation was identified as a discernible influence in NH streamflows (Gedney et al., 2014). While changes in annual mean streamflow present a complicated picture, recent studies of changes in the timing of streamflow in snow-influenced basins continue to support a prominent influence from warming (Kang et al., 2016; Dudley et al., 2017; Kam et al., 2018). Global land runoff variations correlate significantly with ENSO variability (Miralles et al., 2014b; Schubert et al., 2016).
Observed changes in flooding are assessed in Section 11.5.2 and are summarized as follows. For changes in the magnitude of peak flow, recent studies show strong spatial heterogeneity in the sign, size and significance of trends. For changes in timing of peak flows, recent studies further support observed changes in snowmelt-driven rivers. Observed changes in runoff and flood magnitude cannot be explained by precipitation changes alone given the possible season- and region-dependent decreases in antecedent soil moisture and snowmelt, which can partly offset the increase in precipitation intensity (Sharma et al., 2018), or the expected effect of urbanization and deforestation which can, on the contrary, amplify the runoff response (Chen et al., 2017; Abbott et al., 2019; Cavalcante et al., 2019). Simulations of mean and extreme river flows are consistent with the observations only when anthropogenic radiative forcing is considered (Gudmundsson et al., 2021).
In summary, the assessment of observed trends in the magnitude of runoff, streamflow, and flooding remains challenging, due to the spatial heterogeneity of the signal and to multiple drivers. There is, however, high confidence that the amount and seasonality of peak flows have changed in snowmelt-driven rivers due to warming. There is also high confidence that land-use change, water management and water withdrawals have altered the amount, seasonality, and variability of river discharge, especially in small and human-dominated catchments.
8.3.1.6 Aridity and Drought
The AR5 reported low confidence that changes in drought since the mid-20th century could be attributed to human influence, owing to observational uncertainties and difficulties in distinguishing decadal-scale variability from long-term trends. Changes in soil moisture, a metric of aridity, were not assessed thoroughly in AR5. Since AR5, new satellite products, land surface reanalyses, and land surface models have been used to document recent changes in soil moisture at the global scale. The science of detection and attribution has also progressed considerably (Trenberth et al., 2015; Easterling et al., 2016; Stott et al., 2016). Attribution efforts have further benefited from the increased use of paleoclimate information, which provides an important constraint on natural variability that is insufficiently sampled by short observational record (Cook et al., 2018; Kageyama et al., 2018).
Several studies have identified a persistent ‘fingerprint’ of anthropogenic forcing in global trends in aridity spanning the last 120 years. Using a combination of tree ring data, CMIP5 model simulations, and reanalysis products, Marvel et al. (2019) determined that the dominant trend in aridity since 1900, characterized by drying in North and Central America and the Mediterranean, is detectable and attributable to external forcing from 1900 to 1949. This trend weakens from 1950 to 1975, possibly due to aerosol forcing (Marvel et al., 2019), but then emerges again from 1981 to present, although it is not detectable in the GLEAM nor MERRA-2 soil moisture reanalysis products. Likewise, Bonfils et al. (2020) investigated changes in precipitation, temperature and continental aridity in CMIP5 historical simulations and found that the dominant multivariate fingerprint, an amplification of wet–dry latitudinal patterns and progressive continental aridification, was associated with greenhouse gas emissions (Figure 8.9a, d), and the second leading fingerprint was associated with anthropogenic aerosols (Figure 8.9e, h). This study found that the anthropogenic greenhouse gas signal is statistically detectable in reanalyses over the 1950–2014 period (signal-to-noise ratio above 1.96). Gu et al. (2019) found that a global trend in declining soil moisture is detectable in the GLDAS-2 reanalysis product and is attributable to greenhouse gas forcing. Padrón et al. (2020) reconstructed the global patterns of dry season water availability from 1902–2014, and found itextremely likely (99% range) that trends in the last three decades of the analysis period could be attributed to anthropogenic forcing, mainly due to increases in evapotranspiration. It is very likely (>90% range) that anthropogenic forcing has affected global patterns of soil moisture over the 20th century.
 Figure 8.9 | Spatial expressions (a–c, e–g) of the leading multivariate fingerprints of temperature (°C), precipitation (mm day–1), and aridity (CMI; the Climate Moisture Index) in CMIP5 historical simulations and the corresponding temporal evolution in both CMIP5 and reanalysis products (d, h).
 The first leading fingerprint is associated with greenhouse gas forcing (a–d) and the second leading fingerprint is associated with aerosol forcing (e–h). CMI is a dimensionless aridity indicator that combines precipitation and atmospheric evaporative demand. Figure after Bonfils et al. (2020). Further details on data sources and processing are available in the chapter data table (Table 8.SM.1).
On a regional scale, the robustness of trend attribution for drought and aridity varies widely. Key trends and their attributions are summarized here, while a complete regional assessment of observed trends in drought and aridity is in Chapter 11 (Sections 11.6.2, 12.3.2 and 12.4).
Several studies have analyzed CMIP5 and land surface models and detected a significant summer drying trend in the NH across the late 20th century that is attributable to anthropogenic forcings (Mueller and Zhang, 2016; Douville and Plazzotta, 2017). This trend is mainly driven by dryland areas such as the western USA and west-central Asia, where both reanalysis products and satellite data confirm there has been a persistent decline in soil moisture since 1990 (Y. Liu et al., 2019a). In the western USA, snow deficits have very likely contributed to recent drying (Mote et al., 2018). Spring snow water equivalent across the Sierra Nevada Mountains reached a record low in 2015 (Margulis et al., 2016; Mote et al., 2016), possibly the lowest of the last five hundred years (Belmecheri et al., 2016). Over the longer California drought (2011–2015) anthropogenic warming alone reduced snowpack levels in the Sierras by 25% (Berg and Hall, 2017). The north-western USA also experienced snow drought in 2015, despite near-normal levels of total cold season precipitation (Mote et al., 2016; Marlier et al., 2017). There is high confidence that anthropogenic warming contributed to these recent snow droughts (Belmecheri et al., 2016; Mote et al., 2016).
In the western USA, anthropogenic warming is amplifying drought and aridity by increasing evaporative demand and water loss to the atmosphere (Weiss et al., 2009; Overpeck, 2013; Cook et al., 2014; Griffin and Anchukaitis, 2014; Williams et al., 2020). For the California drought between 2012–2014, Griffin and Anchukaitis (2014) used paleoclimate reconstructions to determine that while rainfall deficits were not unprecedented, record-high temperatures drove an exceptional decline in soil moisture relative to the last millennium. Williams et al. (2015) concluded that anthropogenic warming accounted for 8–27% of these soil moisture deficits. Robeson (2015) estimated that the California drought was a 1-in-10,000 year event. Tree ring reconstructions indicate that prolonged megadroughts have occurred in the western USA throughout the last 1200 years (Cook et al. , 2004, 2010; B.I. Cook et al. , 2015), forced by internal variability (Coats et al., 2016; Cook et al., 2016b). However, Williams et al. (2020) determined that 2000–2018 drought across the south-western USA was the second driest 19-year period since 800 CE, and attributed nearly half the magnitude of this event to anthropogenic forcing (see also Section 10.4.2.3). Evidence for human signals in drought can also be found in western North American streamflow records, as noted above in Section 8.3.1.5. There is high confidence that anthropogenic forcing has contributed to recent droughts and drying trends in western North America.
Large areas of east-central Asia experienced drying in the early 2000s as a result of warmer temperatures, lower humidity, and declining soil moisture(Wei and Wang, 2013; Z. Liet al. , 2017; Hesslet al. , 2018). Paleoclimate data from the Mongolian plateau suggest that this recent central Asian drought exceeds the 900-year return interval, but is not unprecedented in the last 2060 years (Hessl et al., 2018). There is low confidence due to limited evidence that recent droughts in central Asia can be attributed to anthropogenic forcing.
The Mediterranean region has experienced notable changes in drought and aridity. A number of studies have identified a decline in precipitation since 1960 and attributed this to anthropogenic forcing (Hoerling et al., 2012; Gudmundsson and Seneviratne, 2016; Knutson and Zeng, 2018; Seager et al., 2019b). Kelley et al. (2015) showed that climate change caused a three-fold increase in the likelihood of the 2007–2010 meteorological drought in the eastern Mediterranean. However, historical trends in precipitation across the Mediterranean are spatially variable and contain substantial decadal variability, such that an anthropogenic influence may not be detectable in all areas (Zittis, 2018; Vicente-Serrano et al., 2021). Records of soil moisture provide a clearer signal, indicating that higher temperatures and increased atmospheric demand have played a strong role in driving Mediterranean aridity (Vicente-Serrano et al., 2014). Hydrological modeling suggests that the recent decline in soil moisture in the Mediterranean is unprecedented in the last 250 years (Hanel et al., 2018). Paleoclimate evidence extends this view, additionally indicating that dryness in the Mediterranean is approaching an extreme condition compared to the last millennium (Markonis et al., 2018) and that the 15-year drought in the Levant (1998–2012) has an 89% likelihood of being the driest of the last 900 years (Cook et al., 2016a). Marvel et al. (2019) found that the Mediterranean region contributes strongly to the anthropogenic warming component of the global trend in aridity. There is high confidence that anthropogenic forcings are causing increased aridity and drought severity in the Mediterranean region.
Both central and north-eastern Africa have experienced a decline in rainfall since about 1980 (high confidence) (Lyon and Dewitt, 2012; Lyon, 2014; Hua et al., 2016; Nicholson, 2017). In Central Africa, the decline has been attributed to atmospheric responses to Indo-Pacific sea surface temperature variability (Hua et al., 2018). In north-eastern Africa, droughts have become longer and more intense in recent decades, continuing across rainy seasons (Hoell et al., 2017b; Nicholson, 2017), and this trend appears to be unusual in the context of the last 1500 years (Tierney et al., 2015). Knutson and Zeng (2018) attribute decreased annual precipitation over the Sudan to anthropogenic forcing, but other studies argue that the recent trend cannot yet be distinguished from natural variability, at least over parts of this region (Hoell et al., 2017b; Philip et al., 2018). There remains low confidence due to limited evidence that drying the north-eastern Africa is attributable to human influence. In the Western Cape region of South Africa, human influence increased the likelihood of the severe 2015–2017 drought by a factor of 3–6, depending on the analysis (Otto et al., 2018; Pascale et al., 2020). Anthropogenic forcing also contributed to the 2018 drought, mainly by increasing evapotranspiration (Nangombe et al., 2020). While some analysis of instrumental precipitation data in this region detect a slight long-term drying trend consistent with the simulated anthropogenic response (Seager et al., 2019b), there is strong multi-decadal variability in the data (Wolski et al., 2021). However, a study of streamflow in southern Africa detected a significant decline (Gudmundsson et al., 2019; see also Section 10.6.2). There is medium confidence in the long-term drying trend in this region and its attribution to anthropogenic forcing, and medium confidence that anthropogenic warming has contributed to recent severe drought events.
Several subtropical, semi-arid regions in the Southern Hemisphere have experienced long-term drying trends in the late 20th century. South-western South America (central Chile) experienced a multi-decadal decline in precipitation and streamflow culminating in a post-2010 megadrought that has been partly attributed to anthropogenic GHG emissions and ozone depletion (Boisier et al. , 2016, 2018; Saurral et al. , 2017; Knutson and Zeng, 2018; Seager et al. , 2019b; Garreaud et al. , 2020). There is medium confidence that drying in central Chile can be attributed to human influence. The tree-ring paleoclimate record demonstrates that the mid-century increase in exteme drought events in southern South America is unusual in the context of the last 600 years, suggesting an emerging influence of anthropogenic forcing (Morales et al., 2020).
There has been a 20% decrease in winter (May to July) rainfall in south-western Australia since 1970, with the decline increasing to around 28% since 2000 (Delworth and Zeng, 2014; BoM and CSIRO, 2020). There has also been a significant increase in the average intensity of seasonal droughts in the region since 1911in response to both lower precipitation and increased atmospheric evaporative demand (Gallant et al., 2013). Several studies attribute the precipitation declines in south-western Australia to anthropogenic changes in GHG and ozone (Delworth and Zeng, 2014; Knutson and Zeng, 2018; Seager et al., 2019b). There is high confidence that the observed drying in south-western Australia can be attributed to anthropogenic forcing.
In south-eastern Australia, the average length of droughts have increased significantly, lasting between 10 and 69% longer than droughts during the first half of the 20th century (Gallant et al., 2013). Paleoclimate reconstructions indicate a 97.1% probability that the decadal rainfall anomaly recorded during the 1997–2009 Millennium drought in south-eastern Australia was the worst experienced since 1783 (Gergis et al., 2012), and that the spatial extent and duration of cool season (April to September) rainfall anomalies were either very much below average or unprecedented over at least the last 400 years (Freund et al., 2017). Other paleoclimate studies suggest that the Millennium drought in eastern Australia was not unusual in the context of natural variability reconstructed over the past millennium (Palmer et al. , 2015; Cook et al. , 2016c; Kiem et al. , 2020). While there is currentlylow confidence that recent droughts in eastern Australia can be clearly attributed to human influence (Cai et al., 2014; Delworth and Zeng, 2014; Rauniyar and Power, 2020), there is emerging evidence that declines in April to October rainfall in south-eastern Australia since the 1990s would not have been as large without the influence of increasing levels of atmospheric GHGs (Rauniyar and Power, 2020).
In summary, it is very likely that anthropogenic factors have influenced global trends in aridity, mainly through competing changes in evapotranspiration and/or atmospheric evaporative demand due to anthropogenic emissions of GHG and aerosols. There is high confidence that the frequency and the severity of droughts has increased over the last decades in the Mediterranean, western North America, and south-western Australia and that this can be attributed to anthropogenic warming. There is medium confidence that recent drying and severe droughts in southern Africa and south-western South America can be attributed to human influence. In some regions of western North America and the Mediterranean, paleoclimate evidence suggests that recent warming has resulted in droughts that are of similar or greater intensity than those reconstructed over the last millennium (medium confidence).
8.3.1.7 Freshwater Reservoirs
8.3.1.7.1 Glaciers
The AR5 and SROCC found, with very high confidence, a general decline in glaciers due to climate change in recent decades. There is very high confidence that during the decade 2010–2019 glaciers lost more mass than in any other decade since the beginning of the observational record (Sections 2.3.2.3 and 9.5.1). Human influence is very likely the main driver of the global, near-universal retreat of glaciers since the 1990s (Section 3.4.3.1). In Table 9.5, the contribution of glaciers to sea level rise for different periods is presented; in 1971–2018 glacier mass loss contributed 20.9 [10.0 to 31.7] mm or 22.2% of the sea level rise during that period. The highest mass loss rates are observed in the southern Andes, New Zealand, Alaska, Central Europe and Iceland while the largest mass loss are observed in Alaska, the periphery of Greenland and Arctic Canada (Section 9.5.1 and Figure 9.20). Predominantly, runoff from small glaciers such as in Canada has decreased because of glacier mass loss, while runoff from larger glaciers such as in Alaska has typically increased (Bolch et al., 2010; Thomson et al., 2011; Tennant et al., 2012; WGMS, 2017; Huss and Hock, 2018). Asia contains the largest concentration of glaciers outside the polar regions where the total glacier mass change is –16.3 ± 3.5 Gt yr–1 over 2000–2016 with considerable intra-regional variability (Brun et al., 2017). Mass losses of glaciers in Asia between 2000 and 2018 are –19.0 ± 2.5 Gt yr–1 (Shean et al., 2020). The most negative changes were found in Nyainqentanglha with −4.0 ± 1.5 Gt yr–1, while glaciers in Kunlun, northern Tibetan Plateau, slightly gained mass at 1.4 ± 0.8 Gt yr–1.
There is some evidence that an increase of precipitation over high mountains can offset glacier ablation (melt; Farinotti et al., 2020). However, this process has only been described from the Karakoram region in the north-western Himalaya, where it is thought to be partly responsible to the advances of glacier changes in the last two decades, referred to as the ‘Karakoram Anomaly’ (Farinotti et al., 2020). In the Himalaya, Maurer et al. (2019) observed faster ice loss during 2000–2016 (7.5 ± 2.3 Gt yr–1) compared to 1975–2000 (–3.9 ± 2.2 Gt yr–1). In the Southern Hemisphere, the rate of glacier mass lost in South America is estimated at 19.4 ± 0.6 Gt yr–1based on surface elevation changes over 2000–2011, which include the North and South Patagonian Icefields of South America (Braun et al., 2019), and at −22.9 ± 5.9 Gt yr–1 over 2000–2018 (Dussaillant et al., 2019).
In summary, human-induced global warming has been the primary driver of a global glacier recession since the early 20th century (high confidence). Most glaciers have lost mass more rapidly since the 1960s and in an unprecedented way over the last decade, thereby contributing to increased glacier runoff, especially from larger glaciers until a maximum is reached, which tends to occur later in basins with larger glaciers and higher ice-cover fractions (high confidence).
8.3.1.7.2 Seasonal snow cover
The AR5 assessed that Northern Hemisphere (NH) snow cover extent (SCE) has decreased since the late 1960s, especially in spring (very high confidence). This is confirmed by recent studies (Section 2.3.2.2; Kunkel et al., 2016). AR6 assesses that NH spring snow cover has been decreasing since 1978 (very high confidence) and that this trend extends back to 1950 (high confidence) (Section 9.5.3). Human-caused global warming is the dominant driver of this observed decline (Section 3.4.2; Estilow et al., 2015). Model simulations suggest that surface temperature responses at hemispheric/regional scales explain between 40% and 85% of the SCE trend variability (Mudryk et al., 2017). A decreasing trend in snowfall has also been detected in the NH (Figure 8.1; Rupp et al., 2013). Snowfall as a proportion of precipitation has decreased significantly in recent years (Berghuijs et al., 2014). However, a late-20th-century increase in snowfall in West Antarctica observed in ice cores has been linked to a combination of factors including the anthropogenically forced deepening of the Amundsen Sea Low (Thomas et al., 2015, 2017).
Observations show a rapid recent decrease of spring SCE in NH, mostly in Eurasia and North America, closely linked to temperature change, for example, March to April SCE is decreasing at 3.4% ± 1.1 % per decade (1979–2005; Brown and Robinson, 2011; Hernández-Henríquez et al., 2015). An overall increasing annual trend of the NH SCE since the late 1980s has been observed, in contrast to decreasing trends over 1960s to 1980s that are dominated by the autumn and winter seasons (Barry and Gan, 2020). Such recent positive trends in snow cover extent are however at odds with other surface and satellite datasets and with the negative trends simulated by most CMIP5 and CMIP6 models (Mudryk et al., 2017, 2020). Hernández-Henríquez et al. (2015) also detected positive trends in OctobertoNovember SCE in in the NOAA SCE Climate Data Record (NOAA-CDR), which are not replicated in other datasets (Section 9.5.3). Wu et al. (2018) found slower snowmelt rates over the NH in 1980–2017, with higher ablation rates in locations with deep snow water equivalent (SWE), but due to the reduction of SWE in deep snowpacks, moderate/high ablation rates showed decreasing trends. Santolaria-Otín and Zolina (2020) reported weak but significant decline in SCE in autumn over northern Eurasia and North America during 1979–2005, and similarly for spring, except for northern Siberia which showed higher spring SCE. Kapnick and Hall (2012) detected significant loss of spring mountain snowpack in western USA in 1950–2008. For Canada, extensive decreasing snow depths, SCE and duration were detected since mid-1970s, especially in western Canada during winter and spring (DeBeer et al. , 2016). Berghuijs et al. (2014) show that across the continental USA, catchments with more snowfall than rainfall generally have higher mean streamflow, which will probably decrease with smaller fractions of precipitation falling as snow because of climate warming.
In summary, a decline in the spring NH snow cover extent, snow depth and duration has been observed since the late 1960s and has been attributed to human influence (high confidence). Depending on the region and season, there is low-to-medium confidence in the main drivers of snow cover changes, although various regions exhibit a shortening of the snow cover season which is consistent with global warming. A more detailed assessment of observed changes in seasonal snow cover is provided in Section 9.5.3.
8.3.1.7.3 Wetlands and lakes
Wetlands and lakes affect the climate through their impact on carbon and methane budgets (Section 5.2.2; e.g., Saunois et al., 2016; Zhan et al., 2019) and on surface heat fluxes, with coupled weather and climate effects(e.g., Zhan et al., 2019). Although these features are also affected by human activities and by climate change, AR5 did not specifically report on wetlands and lakes.
Inventories of surface water bodies are not systematically produced at national or regional levels. However, assessments are undertaken at the global scale (Ramsar Convention on Wetlands, 2018). Merging observations from multiple satellite sensors makes it possible to detect surface water even under vegetation and clouds over about 25 years, but with low spatial resolution (Prigent et al., 2016). Most recent multi-satellite products from visible, infrared, and microwave measurements, estimate a surface water area of about 12 to 14 million km2 (including permanent and transitory surfaces, e.g., Aires et al., 2018; Davidson et al., 2018), which is much higher than those provided by optical imagery (about 3 million km2). Inventories show a strong decrease in natural surface water of about 0.8% yr–1 in total from 1970 to the present (Ramsar Convention on Wetlands, 2018) but the sites are not evenly distributed. Multi-satellite estimates show a strong interannual variability in surface water extent over the period 1992–2015 with no clear long-term trend (Prigent et al., 2020).
Human-made water bodies represent approximately 10% of the total continental water surfaces (Figure 8.1; Ramsar Convention on Wetlands, 2018) and consist mainly of reservoirs and rice paddies. High resolution optical imagery over the period 1984–2015 (Donchyts et al., 2016; Pekel et al., 2016) shows a net increase of about 0.1 million km2 in artifical water surfaces, mainly due to the construction of reservoirs. Surfaces of rice paddies are also increasing, especially in South East Asia (Davidson et al., 2018).
In summary, there is high confidence that the extent of human-made surface water has increased over the 20th and early 21st centuries. In contrast, due to low agreement in the observational records at the global scale, there is onlylow confidence in the observed decline of the natural surface water extent in recent years (see also SRCCL).
8.3.1.7.4 Groundwater
As the world’s most widespread store of freshwater (R.G. Taylor et al., 2013a), groundwater is estimated to supply between a quarter and a third of the world’s annual freshwater withdrawals to meet agricultural, industrial and domestic demands (Döll et al., 2012; Wada et al., 2014; Hanasaki et al., 2018).
Attribution of changes in groundwater storage, observed locally through piezometry (Figure 8.10; R.G. Taylor et al., 2013a) or estimated from GRACE satellite measurements (Rodell et al., 2018) at regional scales (>100,000 km2), is often complicated by non-climate influences that include land-use change (Favreau et al., 2009) and human withdrawals (Bierkens and Wada, 2019).
 Figure 8.10 | Trends in Terrestrial Water Storage (TWS; in centimetres per year, cm yr–1) obtained on the basis of GRACE observations from April 2002 to March 2016. The cause of the trend in each outlined study region is briefly explained and colour-coded by category. The trend map was smoothed with a 150 km radius Gaussian filter for the purpose of visualization. However, all calculations were performed at the native 3° resolution of the data product. Figure from Rodell et al. (2018). Further details on data sources and processing are available in the chapter data table (Table 8.SM.1).
 Following a global review of groundwater and climate change (R.G. Taylor et al., 2013a) and AR5 WGII, evidence of an association between heavy or extreme precipitation and groundwater recharge has continued to grow, especially in tropical (Asoka et al., 2018; Cuthbert et al., 2019a; Kotchoni et al., 2019) and subtropical regions (Meixner et al., 2016). Stable-isotope ratios of oxygen and hydrogen at 14 of 15 sites across the tropics trace groundwater recharge to intensive monthly rainfall, commonly exceeding the 70th intensity percentile, approximately (Jasechko and Taylor, 2015). Further, heavy rainfall recharging groundwater resources is often influenced by climate variability such as ENSO and PDO (R.G. Taylor et al., 2013b; Kuss and Gurdak, 2014; Asoka et al., 2017; Cuthbert et al., 2019b; Kolusu et al., 2019; Shamsudduha and Taylor, 2020). Additionally, increases in groundwater storage estimated from GRACE for 37 of the world’s large-scale aquifer systems from 2002 to 2016 are generally found to result from episodic recharge associated with extreme (>90th percentile) annual precipitation.
The overall underestimation of precipitation intensities in global climate models (Wehner et al., 2010, 2020; Goswami and Goswami, 2017) and of their sensitivity to warming temperatures (Borodina et al., 2017) may lead to underestimates of their recharging effect on groundwater (Mileham et al., 2009; Cuthbert et al., 2019b). The limited ability of global climate models to represent key controls on regional rainfall variability like ENSO (Technical (Annex VI and Section 3.7.3; R. Chen et al., 2020) may also underestimate observed recharge from such events that are of particular importance in drylands (R.G. Taylor et al. , 2013b; Cuthbert et al. , 2019b). Numerical representations of the impact of precipitation intensification on groundwater recharge in large-scale models remain constrained by the challenges of including key recharge pathways that consider preferential flowpaths in soils (Beven, 2018) and focused recharge through leakage from surface waters (Döll et al., 2014).
Increasing global freshwater withdrawals, primarily associated with the expansion of irrigated agriculture in drylands, have led to global groundwater depletion that has an estimated range of about 100 and about 300 km3yr–1 from hydrological models and volumetric-based calculations (Bierkens and Wada, 2019). The magnitude of this change is such that its estimated contribution to global sea level rise is in the order of 0.3 to 0.9 mm yr−1 (Wada et al. , 2010; Konikow, 2011; Döll et al. , 2014; Pokhrel et al. , 2015; de Graaf et al. , 2017; Hanasaki et al. , 2018). Groundwater depletion has been observed regionally in The USA High Plains, California’s Central Valley (Scanlon et al., 2012), north-west India(Rodellet al. , 2009; Asokaet al. , 2017), Upper Ganges in India(MacDonald et al., 2016), North China Plain (Feng et al., 2013), north-central Middle East region of Tigris–Euphrates–Western Iran (Voss et al., 2013), Central Asia (Hu et al., 2019), and North Africa (Bouchaou et al., 2013). The regional contribution of agricultural irrigation to groundwater depletion was previously highlighted by SRCCL but no formal assessment of observed changes in global or regional groundwater featured in AR5.
Quantification of changes in groundwater storage from GRACE is currently constrained by uncertainty in the estimation of changes in other terrestrial water stores using uncalibrated, global-scale Land Surface Models (Döll et al. , 2014; Scanlon et al. , 2018) and the limited duration of the period of GRACE observations (2002 to 2016). Centennial-scale piezometry in north-west India reveals that recent groundwater depletion traced by GRACE (Rodell et al., 2009; Chen et al., 2014), follows more than a century of groundwater accumulation through canal leakage (MacDonald et al., 2016). Further, groundwater depletion is often localized occurring below the footprint (200,000 km2) of GRACE, as has been well demonstrated by detailed modelling studies in the California Central Valley (Scanlon et al., 2012) and North China Plain (Cao et al., 2016).
Climate variability and drought affect groundwater depletion mainly due to amplified groundwater withdrawals. For instance, the depletion rate in Central Valley aquifer in the USA from 2006 to 2010 is estimated to range from 6 to 8 km3yr–1using GRACE data (Scanlon et al., 2012). In India, Asoka et al. (2017) show contrasting trends in groundwater storage in the north (declining at 2 cm yr–1) and south (increasing at 1–2 cm yr–1) that is explained by variations in human withdrawals and precipitation linked to Indian Ocean sea surface temperature variability.
Changes in meltwater regimes from glaciers and seasonal snow packs tend to reduce the seasonal duration and magnitude of recharge (Tague and Grant, 2009). Aquifers in mountain valleys show shifts in the timing and magnitude of: (i) peak groundwater levels due to an earlier spring melt; and (ii) low groundwater levels associated with lower baseflow periods (Allen et al., 2010; Dierauer et al., 2018; Hayashi, 2020). The effects of receding alpine glaciers on groundwater systems are not well understood but long-term loss of glacier storage is estimated to reduce summer baseflow (Gremaud et al., 2009). In permafrost regions, coupling between surface water and groundwater systems may be particularly enhanced by warming (Lamontagne-Hallé et al., 2018; Lemieux et al., 2020). In areas of seasonal or perennial ground frost, increased recharge is expected despite a decrease in absolute snow volume (Okkonen and Kløve, 2011; Walvoord and Kurylyk, 2016).
Coastal aquifers are the interface between the oceanic and terrestrial hydrological systems. Global sea level rise (SLR) causes interfaces between freshwater and saline-water to move inland. The extent of seawater intrusion into coastal aquifers depends on a variety of factors including coastal topography, recharge, and groundwater abstraction from coastal aquifers (Comte et al., 2016). Modelling results suggest that the impact of SLR on seawater intrusion is negligible compared to that of groundwater abstraction (Ferguson and Gleeson, 2012; Yu and Michael, 2019). Coastal aquifers under very low hydraulic gradients, such as the Asian mega-deltas, are theoretically sensitive to SLR but, according to evidence from Akter et al. (2019) in the Ganges-Brahmaputra-Megna basin, may be more severely and widely affected by changes in upstream river discharge. They argue further that saltwater inundation from storm surges will have the greatest localized effects.
In summary, there is medium confidence that increased precipitation intensities, partly due to human influence, have enhanced groundwater recharge, most notably in the tropics. There is high confidence that groundwater depletion has occurred since at least the start of the 21st century as a consequence of groundwater withdrawals for irrigation in some of the world’s most productive agricultural areas in drylands (e.g., southern High Plains and California Central Valley in the USA, the North China Plain, north-west India).
8.3.2 Observed Variations in Large-scale Phenomena and Regional Variability
Observed changes in large-scale circulation indicators (Cross-Chapter Box 2.2) are assessed in Chapters 2 and 3 (Sections 2.3.1.4 and 3.3.3). In this chaper we focus on the influence of regional scale teleconnection variabililty on the water cycle and the attribution of these circulation changes. While observed changes in modes of variability are assessed in Chapters 2 and 4 (Sections 2.4 and 4.3.3), here focus on hydrological teleconnections of relevance to the water cycle.
8.3.2.1 Inter-tropical Convergence Zone and Tropical Rain Belts
The AR5 concluded it is likely that the tropical belt, as delimited by the Hadley circulation, has widened since the 1970s. Observations in the satellite era indicate precipitation increases in the core of the Pacific Inter-tropical Convergence Zone (ITCZ) and decreases on the ITCZ margins (Gu et al., 2016; Su et al., 2017). As the satellite period has lengthened, observations have increasingly been used to assess trends in the ITCZ and tropical rain belt. Since AR5, significant narrowing and strengthening of the Pacific ITCZ after 1979 have been identified in atmospheric reanalyses (Wodzicki and Rapp, 2016), but no change in the ITCZ location (Byrne et al., 2018). Atmospheric model simulations suggest that with a narrower ITCZ, the subtropical jet becomes baroclinically unstable at a lower latitude and allows mid-latitude eddies to propagate farther equatorward (Watt-Meyer and Frierson, 2019). Observational analyses also show that the ITCZ narrowing (Zhou et al., 2020) is associated with increased precipitation in the ITCZ core region that is strongly coupled to increasing Outgoing Longwave Radiation (OLR) in the expanding dry zones, particularly over land regions in the subtropics and mid-latitudes (Lau and Tao, 2020). In addition, an eastward movement of the South Pacific Convergence Zone (SPCZ) between 1977 and 1999 has been reported, with associated significant precipitation trends in the South Pacific regions (Salinger et al., 2014).
ITCZ trends seen in satellites, precipitation measurements and reanalysis data are further supported by ocean surface-salinity observations. Long-term salinity observations show a freshening in the cores of the Atlantic and Pacific ITCZs and increased salinity on the ITCZ margins (Durack and Wijffels, 2010; Durack et al., 2012; Terray et al., 2012; Skliris et al., 2014). By investigating simultaneous changes in precipitation, temperature and continental aridity in CMIP5 historical simulations, Bonfils et al. (2020) found a secondary signal (Figure 8.9, right column) characterized by a robust inter-hemispheric temperature contrast (Section 3.3.1.1), a latitudinal shift in the ITCZ (in accordance with the theory of cross-equatorial energy transport; Section 8.2.2.2), and changes in aridity in the Sahel (Section 8.3.1.6). These forced changes are statistically detectable in reanalyses datasets over the 1950–2014 period at the 95% confidence level.
Reconstructions in the Sahel (Carré et al., 2019) and Belize (Ridley et al., 2015) support the southward displacement of the tropical rain belt since 1850 and the narrowing trend of the tropical rainbelt detected in observations (Rotstayn et al., 2002; Hwang et al., 2013). Decreasing precipitation trends in the NH during the 1950s to 1980s have been attributed to anthropogenic aerosol emissions from North America and Europe, which peaked during the late1970s and declined thereafter following improved air quality regulations, causing dimming (brightening) through reduced (increased) surface solar radiation (Box 8.1 Figure 1), in agreement with model simulations (Chiang et al., 2013; Hwang et al., 2013). This is consistent with energetic constraints where tropical precipitation shifts are anti-correlated with cross-equatorial energy transport (Section6.3.3, Box 8.1). It also provides a physical mechanism for the severe drought in the Sahel that peaked in the mid-1980s (Sections 8.3.2.4.3 and 10.4.2.1) and the southward shift of the NH tropical edge from the 1950s to the 1980s (Allen et al., 2014; Brönnimann et al., 2015). However, CMIP5 and CMIP6 models still exhibit strong biases in representing the ITCZ, such as the simulation of a double ITCZ (Oueslati and Bellon, 2015; Adam et al., 2018; Tian and Dong, 2020). The impacts of aerosols and volcanic activity on the position of the ITCZ have been investigated but changes are difficult to characterize from observations (Section 6.3.3.2; Friedman et al. , 2013; J.M. Haywood et al. , 2013; Iles and Hegerl, 2014; Colose et al. , 2016; Chung and Soden, 2017). Such systematic shifts of the ITCZ can have important regional impacts like changes in precipitation (Figure 8.9).
In summary, there is medium confidence that the tropical rain belts over the oceans have been narrowing and strengthening in recent decades, leading to increased precipitation in the ITCZ core region (Section 8.2.2.2). Decreasing precipitation trends in the NH during the 1950s–1980s have been attributed to anthropogenic aerosol emissions from North America and Europe (high confidence).
8.3.2.2 Hadley Circulation and Subtropical Belt
The AR5 reported low confidence in trends in the strength of the Hadley circulation (HC) due to uncertainties in reanalyses but high confidence on the widening of the tropical belt since 1979. In AR6, Chapter 2 (Section 2.3.1.4.1) states that the HC has very likely widened and strengthened since at least the 1980s, mostly in the NH (medium confidence).
The poleward shift of the HC is closely related to migration of the location of tropical cyclone trajectories in bothhemispheres (Sharmila and Walsh, 2018; Studholme and Gulev, 2018), with avery likely poleward shift over the western North Pacific Oceans since the 1940s (Section 11.7.1.2). Moreover, the Western North Pacific Subtropical High has extended westward since the 1970s, resulting in a monsoon rain band shift over China, with excessive rainfall along the middle and lower reaches of the Yangtze River valley along about 30°N over eastern China. At the same time, the effect of anthropogenic aerosols dominated the response to GHG increases over East Asia, resulting in a weakening of the East Asian summer monsoon and causing a drying trend in north-eastern China (Hu, 2003; Yu and Zhou, 2007; T. Wang et al., 2013; Z. Li et al., 2016b; Lau and Kim, 2017) and northern parts of South Asia (Section 8.3.2.4.2; Preethi et al., 2017). During 1977–2007, the precipitation variability over the eastern USA increased due to changes in the intensity and position of the western ridge of the North Atlantic Subtropical High (Li et al., 2011; Diem, 2013).
In the Southern Hemisphere (SH), the HC expansion has been associated with both the intensification and poleward shift of the subtropical high pressure belt (Nguyen et al., 2015), with consequences for precipitation amount over Africa, Australia, South America, and subtropical Pacific islands (Cai et al. , 2012; Grose et al. , 2015; Nguyen et al. , 2015; Sharmila and Walsh, 2018; McGree et al. , 2019). The subtropical ridge in Australia has intensified significantly since 1970, with marked declines observed in April to October rainfall across south-eastern and south-western Australia (Timbal and Drosdowsky, 2013).
The local tropical edges of the meridional overturning cells (as diagnosed from the horizontally divergent wind) are more closely associated with hydroclimate variations than the subtropical ridge (Staten et al., 2019). Poleward expansion of the tropical belt strongly contributes to precipitation decline in the poleward edge of the subtropics (Cai et al., 2012; Scheff and Frierson, 2012; Timbal and Drosdowsky, 2013; He and Soden, 2017; H. Nguyen et al., 2018; Tang et al., 2018), although recent modelling evidence suggests that subtropical precipitation declines are a response to direct CO2 radiative forcing mainly over ocean, irrespective of the HC expansion (He and Soden, 2017). Both reanalyses datasets and climate model simulations suggest that the HC expansion is not associated with widespread, zonally symmetric subtropical drying over land (Schmidt and Grise, 2017).
Since AR5, an improved understanding of the key drivers of the recent HC expansion has been achieved, identifying the role of both internal variability and anthropogenic climate change. Part of the recent expansion (1979–2005) of the HC has been driven by a swing from warm to cold phase of the Pacific Decadal Variability (PDV; Meehl et al., 2016; Grise et al., 2019). The presence of large multi-decadal variability in 20th-century reanalyses means there is limited evidence on the human influence on the recent HC strengthening, yet the southward shift of the southern edge and widening of the SH HC appeared as robust features in all reanalysis datasets, and their trends have accelerated during 1979–2010 (D’Agostino and Lionello, 2017). As assessed in Section 3.3.3.1, GHG increases and stratospheric ozone depletion have contributed to the expansion of the zonal mean HC in the SH since around 1980, and the expansion of the NH HC has not exceeded the range of internal variability (medium confidence). Moreover, Antarctic ozone depletion can cause a poleward shift in the SH mid-latitude jet and HC (Sections 3.3.3 and 6.3.3.2). Further assessment of the attribution of recently observed changes in the HC extent and intensity is found in Section 3.3.3.1.
In summary, it is very likely that the recent HC expansion was associated with poleward shifts of tropical cyclone tracks over the western North Pacific Ocean since the 1940s, and of extratropical storm tracks in the SH since the 1970s. Changes to the HC in the NH may have contributed to subtropical drying and a poleward expansion of aridity during the boreal summer, but there is low confidence due to limited evidence. GHG increases and stratospheric ozone depletion have contributed to expansion of the zonal mean HC in the SH since around 1970, while the expansion of the NH HC has not exceeded the range of internal variability (medium confidence).
8.3.2.3 Walker Circulation
The AR5 concluded that the long-term weakening of the Pacific Walker circulation (WC) from the late 19th century to the 1990s has been largely offset by a recent strengthening (high confidence), though with low confidence in trends of the WC strength due to reanalysis uncertainties and large natural variability. The observed trends in the WC since 1980 are consistent with avery likely WC strengthening in the Pacific, similar to a La Niña pattern, with medium confidence in the magnitude of these changes due to differences between satellite observations and reanalyses.
The causes of the observed strengthening of the WC during 1980–2014 are not well understood due to competing influences from individual external forcings and since this strengthening is outside the range of variability simulated in coupled models (medium confidence), as assessed in Chapter 3 (Section 3.3.3.1). Recent strengthening in the WC has been linked with internal variability (Chung et al., 2019), although one study argues that it could be a response forced by GHG that models do not capture because of common sea surface temperature (SST) biases in the equatorial Pacific (Seager et al., 2019a). It could be also related to an interbasin thermostat mechanism whereby the human-induced Indian Ocean warming emerged earlier than in the tropical Pacific (L. Zhang et al., 2018) and induced a transient strengthening of the zonal sea level pressure gradient and easterly trades in the tropical Pacific (L. Zhang et al., 2019).
The weakening of the PWC observed during most of the 20th century is associated with reductions in land rainfall over the Maritime Continent during 1950–1999 (Tokinaga et al., 2012; Yoden et al., 2017). In contrast, the recent strengthening of the WC has been associated with an intensification of extreme flooding (Barichivich et al., 2018) and an increased frequency of wet days (J.C. Espinoza et al., 2016, 2018) over the north-western Amazon, increased precipitation in South America (Yim et al., 2017), reduced precipitation over eastern Africa (Williams and Funk, 2011; Lyon and Dewitt, 2012), and increased rainfall in southern Africa (Maidment et al., 2015). Internal variability has been shown to have a dominant role in the recent strengthening of the WC (Chung et al., 2019).
In summary, there is high confidence that changes in the WC are associated with changes in the water cycle over regions like the Maritime Continent, South America and Africa. It is very likely that the WC has strengthened in the Pacific since the 1980s, with medium confidence that this strengthening is within the range of internal variability.
8.3.2.4 Monsoons
The AR5 reported low confidence in the attribution of changes in monsoons to human influence, although a detailed attribution assessment of the observed changes in the regional monsoons was not presented.
Large human populations in the monsoon regions of the world heavily depend on freshwater supply for agriculture, water resources, industry, transport and various socio-economic activities. The effects of GHG forcing combined with water vapour feedback (R.J. Allen et al., 2015; Dong and Sutton, 2015; Evan et al., 2015; Dunning et al., 2018) and cloud feedbacks (Stephens et al., 2015; Potter et al., 2017) are fundamental to monsoon precipitation changes in a warming world. Since AR5 there has been improved understanding of precipitation changes associated with regional monsoons. Sections 2.3.1.4.2 and 3.3.3.2 provide an assessment of observed changes and attribution for the global monsoon. Here we provide an assessment of the observed changes in regional monsoons (see Annex V and Figure 8.11) and underlying causes. In AR6, the definition of regional monsoons slightly differs from AR5 and the rationale for it is provided in Annex V (see Glossary). Specific examples of regional monsoons are discussed further in Section 10.4.2, from the perspective of climate change attribution and in Section 10.6.3, from the viewpoint of constructing regional climate messages.
 Figure 8.11 | Regional monsoon precipitation changes from observations and model attribution. Precipitation changes during 1951–2014 are shown as least-square linear trends in box-whisker plots (first and fourth rows) over the six regional monsoons, for example, North American monsoon (NAmerM, July–August–September, JAS), West African monsoon (WAfriM, June–July–August–September, JJAS), South and South East Asian monsoon (SAsiaM, June–July–August–September, JJAS), East Asian monsoon (EAsiaM, June–July–August), South American monsoon (SAmerM, December–January–February, DJF), Australian and Maritime Continent monsoon (AusMCM, December–January–February, DJF), and over the two land domains, for example, equatorial America (EqAmer, June–July–August, JJA) and South Africa (SAfri, December–January–February, DJF), as identified in the map shown in the middle and as described in Annex V. Precipitation changes are computed from observations and from Detection and Attribution Model Intercomparison Project (DAMIP) CMIP6 experiments over the historical period with all-forcing (ALL), GHG-only forcing (labelled GHG), Aerosol-only (AER) and Natural (NAT) forcings prescribed. Observations are based on the CRU (light green) and GPCC (light blue) datasets and the APHRODITE (light orange) dataset for SAsiaM and EAsiaM. CMIP6 simulations are taken from nine CMIP6 models contributing to DAMIP, with at least three members. Ensembles are weight-averaged for the respective model ensemble size. Observed trends are shown as coloured circles and the simulated trends from the CMIP6 multi-model experiments are shown as box-whisker plots. Precipitation anomaly time-series are shown in the second and third row. The thick black line is the multi-model ensemble-mean precipitation anomaly time-series from the ALL experiment and the grey shading shows the spread across the multi-model ensembles. An 11-year running mean has been applied on the precipitation anomaly time-series prior to calculating the multi-model ensemble mean. Further details on data sources and processing are available in the chapter data table (Table 8.SM.1).
 8.3.2.4.1 South and South East Asian Monsoon
The AR5 reported a decreasing trend of global land monsoon precipitation over the last half-century, with primary contributions from the weakened summer monsoon systems in the Northern Hemisphere (NH). Since AR5, several studies have documented long-term variations and changes in the South and South East Asian summer monsoon (SAsiaM) rainfall. The SAsiaM strengthened during past periods of enhanced summer insolation in the NH, such as the early-to-mid Holocene warm period around 9000 to 6000 years before the present (BP) (Masson-Delmotte et al., 2013; Mohtadi et al., 2016; Braconnot et al., 2019) and weakened during cold periods (high confidence), such as the Last Glacial Maximum (LGM) and Younger Dryas (Shakun et al. , 2007; Cheng et al. , 2012; Dutt et al. , 2015; Chandana et al. , 2018; Hong et al. , 2018; E. Zhang et al. , 2018). These long-time scale changes in monsoon intensity are tightly linked to orbital forcing and changes in high-latitude climate (Braconnot et al. , 2008; Battisti et al. , 2014; Araya-Melo et al. , 2015; Rachmayani et al. , 2016; Bosmans et al. , 2018; E. Zhang et al. , 2018). A weakening trend of the SAsiaM during the last 200 years has been documented based on tree ring oxygen isotope chronology from the northern Indian subcontinent (Xu et al., 2018) and South East Asia (Xu et al., 2013), oxygen isotopes in speleothems from northern India (Sinha et al., 2015), and tree ring width chronologies from the Indian core monsoon region (Shi et al., 2017). Nevertheless, the detection of century-long decreases in regional monsoon rainfall is obscured by the presence of multi-decadal time scale precipitation variations (Turner and Annamalai, 2012; Knutson and Zeng, 2018) which are evident in long-term rain guage records extending back to the early 1800s (Sontakke et al., 2008) and emerge in long-term climate simulations (Braconnot et al., 2019).
A significant decline in summer monsoon precipitation is observed over India since the mid-20th century, which is accompanied by a weakening of the large-scale monsoon circulation (Mishra et al. , 2012; Abish et al. , 2013; Krishnan et al. , 2013, 2016; Saha et al. , 2014; Roxy et al. , 2015; Guhathakurta et al. , 2017; Samanta et al. , 2020). This precipitation decline is corroborated by a decreasing trend in the frequency of monsoon depressions that form over Bay of Bengal (Prajeesh et al., 2013; Vishnu et al., 2016), an increasing trend in the frequency and duration of monsoon breaks or ‘dry spells’ (Singh et al., 2014), significant decreases in soil moisture and increases in drought severity across different parts of India post-1950 (Niranjan Kumar et al. , 2013; Ramarao et al. , 2015, 2019; Krishnan et al. , 2016; Ganeshi et al. , 2020; Mujumdar et al. , 2020). While recent studies have reported an apparent recovery of the Indian summer monsoon over a relatively short period since 2003 (Jin and Wang, 2017; Hari et al., 2020), long-term trends for the period 1951–2015 indicate an overall decrease in the regional monsoon precipitation (Kulkarni et al., 2020; Ayantika et al., 2021). A case study on the Indian summer monsoon is provided in Section 10.6.3.
Evidence from several climate modelling studies indicates that the observed decrease in the regional monsoon precipitation during the second half of the 20th century is dominated by the radiative effects of NH anthropogenic aerosols, with smaller contributions due to volcanic aerosols from the Mount Pinatubo (1991) and El Chichón (1982) eruptions (Bollasina et al. , 2011; Polson et al. , 2014; Sanap et al. , 2015; Krishnan et al. , 2016; Liu et al. , 2016; Lau and Kim, 2017; Lin et al. , 2018; Takahashi et al. , 2018; Undorf et al. , 2018a, b; Patil et al. , 2019; M. Singh et al. , 2020; see Box 8.1, Figure 1 and Figure 8.11). Land-use changes over South and South East Asia and the rapid warming trend of the equatorial Indian Ocean during the recent few decades also appear to have contributed to the observed decrease in monsoon precipitation (Roxy et al., 2015; Krishnan et al., 2016; Singh, 2016). Overall, the magnitude of the precipitation response to anthropogenic forcing exhibits large spread across CMIP5 models pointing to the strong internal variability of the regional monsoon (Saha et al., 2014; Salzmann et al., 2014; Sinha et al., 2015), including variations linked to phase changes of the Pacific Decadal Variability (Section AVI.2.6; X. Huang et al., 2020a), uncertainties in representing aerosol–cloud interactions (Takahashi et al., 2018), and the effects of local compared with remote aerosol forcing (Bollasina et al. , 2014; Polson et al. , 2014; Undorf et al. , 2018b). CMIP3 and CMIP5 models do not accurately reproduce the observed seasonal cycle of precipitation over the major river basins of South and South East Asia, limiting the attribution of observed regional hydroclimatic changes (Hasson et al., 2014, 2016; Biasutti, 2019). While warm rain processes and organized convection are known to dominate the heavy orographic monsoon rainfall over the Western Ghats mountains (Shige et al., 2017; Choudhury et al., 2018), in various parts of India (Konwar et al., 2012) and East Asia (Section 11.7.3.1), there are uncertainties in representing the regional physical processes of the monsoon environment, including cloud–aerosol interactions (Sarangi et al., 2017), land –atmosphere (e.g., Bartonet al., 2020) and ocean–atmosphere coupling (Annamalai et al., 2017), in state-of-the-art climate models (see also Section 8.5.1).
In summary, there is high confidence in observational evidence for a weakening of the SAsiaM in the second half of the 20th century. Results from climate models indicate that anthropogenic aerosol forcing has dominated the recent decrease in summer monsoon precipitation, as opposed to the expected intensification due to GHG forcing (high confidence). On paleoclimate time scales, the SAsiaM strengthened in response to enhanced summer warming in the NH during the early-to-mid Holocene, while it weakened during cold intervals (high confidence). These changes are tightly linked to orbital forcing and changes in high-latitude climate (medium confidence).
8.3.2.4.2 East Asian Monsoon
The AR5 reported low confidence in the observed weakening of the East Asian monsoon (EAsiaM) since the mid-20th century. Since AR5, there has been improved understanding of changes in the EAsiaM, based on paleoclimatic evidence, instrumental observations and climate modeling simulations. Rainfall reconstructions from the Loess Plateau in China indicate that the northern extent of the monsoon rain belts migrated at least 300 km to the north-west from the LGM to the mid-Holocene (Yang et al., 2015). Similarly, Pliocene reconstructions indicate stronger intensity of the EAsiaM with a more northward penetration of the monsoon rain belt (S. Yang et al., 2018a). EAsiaM variability has been related to Atlantic Meridional Overturning Circulation (AMOC) dynamics, especially during the last glacial period, but whether the relationship is negative or positive remains uncertain (Sun et al., 2012; Cheung et al., 2018; Kang et al., 2018).
Long-term precipitation observations from China indicate a trend of drying in the north and wetting in the central-eastern China along the Yangtze river valley since the 1950s (Qian and Zhou, 2014; Zhou et al., 2017b; Day et al., 2018), with a weakened EAsiaM low-level circulation that penetrates less far into northern China, increased surface pressure over north-east China and southward shift of the jet stream (Song et al., 2014). The southward shift and enhancement of the jet stream explains the increase of rainfall especially from the Meiyu front (Day et al., 2018) at the expense of drying over north-east China.
Anthropogenic factors such as GHGs and aerosols had an influence on the EAsiaM changes (Figure 8.11; T. Wang et al. , 2013; Song et al. , 2014; Xie et al. , 2016; Chen and Sun, 2017; Ma et al. , 2017; L. Zhang et al. , 2017; Day et al. , 2018; Tian et al. , 2018). Increased precipitation in the southern region has been linked to increased moisture flux convergence driven by GHG forcing while changes in anthropogenic aerosols have weakened the EAsiaM and reduced precipitation in the northern regions (Tian et al., 2018). Aerosol-induced cooling, associated atmospheric circulation changes and sea surface temperature (SST) feedbacks weaken the EAsiaM and favour the observed dry-north and wet-south pattern of rainfall anomalies (T. Wang et al. , 2013; Song et al. , 2014; L. Zhang et al. , 2017; G. Chen et al. , 2018; X. Chen et al. , 2018; Undorf et al., 2018b).
Internal variability and volcanic eruptions also contributed to the weakened EAsiaM (Hsu et al. , 2014; Qian and Zhou, 2014; Zhou et al. , 2017a; Knutson and Zeng, 2018). Since the late 1970s, the EAsiaM weakening has been also linked to SST changes in the Pacific Ocean with warm conditions in the central-eastern tropical part and cold ones in the north, similar to a positive phase of the Pacific Decadal Variability (PDV; Section AVI.2.6; Z. Li et al. , 2016b; Zhou et al. , 2017a). In the late 1990s the transition from a positive to a negative PDV has been associated with the recent recovery observed in the EAsiaM strength (Zhou et al., 2017a). Atlantic Multi-decadal Variability (AMV) also has an influence on the EAsiaM via the global teleconnection pattern propagating from the North Atlantic through the westerly jet (Zuo et al., 2013; Wu et al., 2016a, b). This North Atlantic influence has contributed to the increase of precipitation over the Huaihe-Huanghe valley since the late 1990s (Y. Li et al., 2017). When PDV and AMV are in opposite phase, the former has a larger influence in driving the southern flooding and northern drought pattern over the region (Q. Yang et al., 2017).
In summary, there is strong evidence of a stronger EAsiaM and northward migration of the rainbelt during warmer climates based on paleoclimate reconstructions. There is high confidence that anthropogenic forcing has been influencing historical EAsiaM changes with drying in the north and wetting in the south observed since the 1950s, but there is low confidence in the magnitude of the anthropogenic influence. The transition towards a positive PDV phase has been one of the main drivers of the EAsiaM weakening since the 1970s (high confidence).
8.3.2.4.3 West African Monsoon
Since AR5, there has been improved understanding of the West African monsoon (WAfriM) response to natural and anthropogenic forcing. On paleoclimate time scales, enhanced summer insolation in the Northern Hemisphere (NH) intensified the WAfriM precipitation during the early-to-mid Holocene (high confidence), as seen in rainfall proxy records and climate model simulations (Masson-Delmotte et al. , 2013; Mohtadi et al. , 2016; Braconnot et al. , 2019). Despite improvements in model simulations of the present-day monsoons, CMIP5 and CMIP6 models underestimate mid-Holocene changes in the amount and spatial extent of the WAfriM precipitation (Section 3.3.3.2; Brierley et al., 2020).
During the recent past, long-term rain gauge observations display substantial variability in the WAfriM precipitation over the 20th century (Section 10.4.2.1). The WAfriM experienced the wettest decade of the 20th century during the 1950s and early 1960s (high confidence), over much of the western and central Sahel region, followed abruptly by the driest years during 1970–1989 (Ali and Lebel, 2009; Nicholson, 2013; Descroix et al., 2015). The percentage deficit in the annual rainfall during 1970–1989, relative to the long-term mean, ranged from 60% in the north of Sahel to 25–30% in the south (Le Barbé et al., 2002; Lebel et al., 2003). The long decline in annual rainfall is related to a decrease of rain occurrence over the Sahel (Le Barbé and Lebel, 1997; Frappart et al., 2009; Bodian et al., 2016) and the Soudano-Guinean sub-region of West Africa (Le Barbé et al., 2002), even though the interannual variability pattern is more complex (Balme et al., 2006). Decrease of rainfall occurrences resulted from decreases in large convective events in the core of the rainy season (Bell et al., 2006), that modulate interannual variability of the WAfriM (Panthou et al., 2018).
Wetter conditions of the WAfriM prevailed later from the mid-to-late 1990s, although the positive trend in precipitation started since the late 1980s (see also Section 10.4.2.1) over the Sahel (high confidence) and in the Guinean coastal region (medium confidence), indicating the geographical variation in the wetting recovery (Descroix et al. , 2015; Sanogo et al. , 2015; Bodian et al. , 2016; Nicholson et al. , 2018). While the interannual and decadal variability of annual rainfall is not homogeneous over the entire Sahel, the rainfall recovery was stronger in the east than in the west of the region (Section 10.4.2.1; Nicholson et al., 2018). A shift in the seasonality of the Sahelian rainfall, including delayed cessation has also been reported (Section 10.4.2.1; Nicholson, 2013; Dunning et al., 2018).
In the Sahel region, the emergence of this new rainfall regime is reflected in increased number of heavy and extreme events, compared to the 1970s–1980s, still not exceeding the values registered in the 1950s to 1960s (Descroix et al., 2013, 2015; Panthou et al., 2014, 2018; Sanogo et al., 2015), and in higher interannual variability (W. Zhang et al., 2017b; Akinsanola and Zhou, 2020) associated with SST variations in the tropical Atlantic, Pacific and Mediterranean Sea (Rodríguez-Fonseca et al., 2015; Diakhaté et al., 2019). Increased frequency of extreme rainfall events impacts high flow occurrences of the large Sahelian rivers as well as small to meso-scale catchments (Wilcox et al., 2018). Overall, extreme intense precipitation events are more frequent in the Sahel since the beginning of the 21st century (Giannini et al. , 2013; Panthou et al. , 2014, 2018; Sanogo et al. , 2015; Taylor et al. , 2017). Intensification of mesoscale convective systems associated with extreme rainfall in the WAfriM is favoured by enhancement of meridional temperature gradient by the warming of the Sahara desert (Taylor et al., 2017) at a pace that is two to four times greater than that of the tropical-mean temperature (K.H. Cook et al., 2015; Vizy et al., 2017). Periods of monsoon-breaks and the persistence of low rainfall events are still prominent, particularly after the onset, thus exposing West Africa simultaneously to the potential impacts of dry spells (W. Zhang et al., 2017b) and also extreme localized rains and floods (Engel et al., 2017; Lafore et al., 2017). Occurrence of extreme events is compounded by land use and land cover changes leading to increased runoff (Bamba et al., 2015; Descroix et al., 2018).
The Sahel drought from the 1970s until the early 1990s was related to anthropogenic emissions of sulphate aerosols in the Atlantic, which led to an inter-hemispheric pattern of SST anomalies and associated regional precipitation changes (Section 6.3.3.2 and Box 8.1). Also the combined effects of anthropogenic aerosols and GHG forcing appear to have contributed to the late twentieth century drying of the Sahel through their effect on SST, by cooling the North Atlantic and warming the tropical oceans (Giannini and Kaplan, 2019; Hirasawa et al., 2020). Subsequent aerosol removal led to SST warming of the North Atlantic, shifting the ITCZ further northward and strengthening the WAfriM (Giannini and Kaplan, 2019). The recent recovery has been ascribed to prevailing positive SST anomalies in the tropical North Atlantic potentially associated with a positive phase of the Atlantic Multi-decadal Oscillation (Diatta and Fink, 2014; Rodríguez-Fonseca et al., 2015). The Sahel rainfall recovery has also been attributed to higher levels of GHG in the atmosphere and increases in atmospheric temperature (Dong and Sutton, 2015).
In summary, most regions of West Africa experienced a wet period in the mid-20th century followed by a very dry period in the 1970s and 1980s that is attributed to aerosol cooling of the NH (high confidence). Recent estimates provide evidence of a WAfriM recovery from the mid-to-late 1990s, with more intense extreme events partly due to the combined effects of increasing GHG and decreasing anthropogenic aerosols over Europe and North America (high confidence). On paleoclimate time scales, there is high confidence that the WAfriM strengthened during the early-to-mid Holocene in response to orbitally-forced enhancement of summer warming in the NH.
8.3.2.4.4 North American Monsoon
Since AR5, there have been updates on the observed long-term variations and changes in the North American monsoon (NAmerM). During the Last Glacial Maximum (LGM; 21,000–19,000 years ago), the NAmerM was substantially weaker due to cold, dry mid-latitude air associated with the Laurentide Ice Sheet (T. Bhattacharya et al. , 2017, 2018). The NAmerM strengthened until the mid-Holocene period, in response to ice-emsheet retreat and rising summer insolation, but probably did not exceed the strength of the modern system (low confidence), as indicated by model simulations (Metcalfe et al., 2015) and paleoclimatic reconstructions (Bhattacharya et al., 2018). Paleoclimatic evidence from proxy datasets and mid-Pliocene (PlioMIP1) simulations suggest a wetter south-western USA during that warmer period (A.M. Haywood et al., 2013; Pound et al., 2014; Ibarra et al., 2018) but it is not clear whether this is due to increases of precipitation associated with the monsoon or occurring during the winter season.
During 1948–2010, trends of boreal summer precipitation amount were significantly positive over New Mexico and the core NAmerM region, but significantly negative over south-western Mexico (Hoell et al., 2016). In addition, diverse datasets like CRU, CHIRPS and GPCP show significant decreases of precipitation in parts of the south-western USA and north-western Mexico, including the NAmerM region (Cavazos et al., 2020; Ashfaq et al., 2021). Other studies suggest a strengthening of the NAmerM upper level anticyclone since the mid-1970s, with a more frequent northward location (Diem et al., 2013). Between 1910–2010, the number of precipitation events increased across the northern Chihuahuan desert, within the NAmerM domain, despite a decrease in their magnitude, and the length of extreme dry and wet periods also increased (Petrie et al., 2014).
An increase in intense rainfall and severe weather events has been observed in several locations, especially in south-western Arizona since 1991, resulting from increases in atmospheric moisture content and instability; a change that has been confirmed by convective-permitting model simulations (Luong et al., 2017; Pascale et al., 2019). A dense network of 59 rain gauges located in south-eastern Arizona suggests an intensification of monsoon sub-daily rainfall since the mid-1970s (Demaria et al., 2019), as expected by a stronger global warming signature for sub-daily rather than daily or monthly precipitation accumulation (Section 11.4). Section 10.4.2.3 provides further details on changes in precipitation in south-western North America. Evidence from multiple reanalyses suggests that increases in NAmerM rainfall have contributed to the increasing trend of global monsoon precipitation (Section 2.3.1.4.2; Lin et al., 2014). In addition, more frequent occurrence of earlier retreats of the NAmerM since 1979 is documented (Arias et al., 2012, 2015), in association with the positive phase of the Atlantic Multi-decadal Variability (AMV) and a westward expansion of the North Atlantic Subtropical High (W. Li et al., 2011, 2012).
Analyses from a 50-km resolution GCM indicate that the NAmerM response to CO2 is very sensitive to SST biases, showing reductions in summer NAmerM precipitation with increased CO2 when the SST biases are small (Pascale et al., 2017) in contrast to CMIP5 models (Cook and Seager, 2013; Maloney et al., 2014; Torres-Alavez et al., 2014; Hoell et al., 2016). The NAmerM has been shown to be also sensitive to sulphur dioxide (SO2) emissions (García-Martínez et al., 2020).
In summary, both paleoclimate evidence and observations indicate an intensification of the NAmerM in a warmer climate (medium confidence). The intensification recorded since about the 1970s has been partly driven by GHG emissions (medium confidence).
8.3.2.4.5 South American Monsoon
Since AR5, there has been improved understanding of changes in the South American monsoon (SAmerM) as evidenced from paleoclimate records, instrumental observations and climate model simulations. However, general circulation models (GCMs) still exhibit difficulties in reproducing SAmerM precipitation amount (Rojas et al., 2016; D’Agostino et al., 2020b). Paleoclimate evidence suggests a relatively stronger SAmerM during the 1400–1600 period (Bird et al. , 2011b; Vuille et al. , 2012; Ledru et al. , 2013; Apaéstegui et al. , 2014; Novello et al. , 2016; Wortham et al. , 2017). Last millennium GCM simulations are able to reproduce stronger SAmerM during the 1400–1600 period in comparison with warmer epochs such as the 900–1100 period (Rojas et al., 2016) or the current warming period (Díaz and Vera, 2018). PMIP3/CMIP5 simulations indicate a consistent weaker SAmerM during the mid-Holocene (6000 years ago; see Cross-Chapter Box 2.1) in comparison to current conditions (Bird et al., 2011a; Mollier-Vogel et al., 2013; Prado et al., 2013a; D’Agostino et al., 2020b), thus favouring savannah/grassland-like vegetation (Smith and Mayle, 2018), in agreement with climate reconstructions from different proxies (Prado et al., 2013b). Signals of weak and strong SAmerM during mid-Holocene and LGM, respectively, are evident also in high-resolution long-term (i.e., more than about 22,000 years) rainfall reconstructions based on oxygen isotopes in speleothems from Brazil (Novello et al. , 2017; Stríkis et al. , 2018; Campos et al., 2019).
Isotope records from caves in the central Peruvian Andes show that the late Holocene (<3000 years ago) was characterized by multi-decadal and centennial-scale periods of significant decline in intensity of the SAmerM (Bird et al., 2011a; Vuille et al., 2012). This could be partly due to a reduction in the zonal SST gradient of the Pacific Ocean, favouring El Niño-like conditions (Kanner et al., 2013). Other studies suggest increased SAmerM precipitation amount during the Late Holocene, in association with the expansion of the tropical forest (Smith and Mayle, 2018). Well-dated equilibrium lines of glaciers during the deglaciation suggest that the AMOC enhances Atlantic moisture sources and precipitation amount increase over the tropical and southern Andes (Beniston et al., 2018).
Observations during 1979–2014 suggest that poleward shifts in the South Atlantic Convergence Zone (SACZ) noted in recent decades (Talento and Barreiro, 2018; Zilli et al., 2019), are associated with precipitation amount decrease along the equatorward margin and increase along the poleward margin of the convergenze zone (Zilli et al., 2019). Several observational studies identified delayed onsets of the SAmerM after 1978 related to longer dry seasons in the southern Amazon (Fu et al. , 2013; Yin et al. , 2014; Arias et al. , 2015; Debortoli et al. , 2015; Arvor et al. , 2017; Giráldez et al. , 2020; Haghtalab et al. , 2020; Correa et al. , 2021). In contrast, other studies indicate a trend toward earlier onsets of the SAmerM (Jones and Carvalho, 2013). These discrepancies are explained by the methodology used and the domain considered for the SAmerM, confirming the occurrence of delayed onsets of the SAmerM since 1978 (Correa et al., 2021). CMIP5 simulations show trends toward delayed onsets of the SAmerM in association with anthropogenic forcing, although the simulated trends underestimate the observed trends (Fu et al., 2013). Total rainfall reductions are observed in the southern Amazon during September–October–November after 1978 (Fu et al., 2013; Bonini et al., 2014; Debortoli et al., 2015, 2016; Espinoza et al., 2019), consistent with reductions in river discharge in the region (Molina-Carpio et al. , 2017; Espinoza et al. , 2019; Heerspink et al., 2020).
Significant increases in precipitation have been observed over south-eastern Brazil during 1902–2005 while non-significant decreases have been found over central Brazil (Vera andDíaz, 2015). In Bolivia, increases were observed during 1965–1984, while reductions have occurred since then (Seiler et al., 2013). However, the Peruvian Amazon does not reveal significant changes in mean rainfall during 1965–2007 (Lavado et al., 2013; Ronchail et al., 2018). Historical simulations from CMIP5 ensembles adequately capture the observed summer precipitation amount over central and south-eastern Brazil, thereby providing high confidence in interpreting the observed variability of SAmerM for the period 1960–1999 (Gulizia and Camilloni, 2015; Pascale et al., 2019). Also, CMIP5 simulations indicate that the anthropogenic forcing associated with increased GHG emissions is necessary to explain the positive trends in upper-troposphere zonal winds observed over the South American Altiplano (Vera et al., 2019). However, the detection of anthropogenically-induced signals for precipitation is still ambiguous in monsoon regions, like the SAmerM (Hoegh-Guldberg et al., 2018).
In summary, there is high confidence that the SAmerM onset has been delayed since the late 1970s. This is reproduced by CMIP5 simulations that consider anthropogenic forcing. There is also high confidence that precipitation during the dry-to-wet transition season has been reduced over the southern Amazon. Paleoclimate reconstructions and simulations suggest a weaker SAmerM during warmer epochs such as the Mid-Holocene or the 900–1100 period, and stronger monsoon during colder epochs such as the LGM or the 1400–1600 period (high confidence).
8.3.2.4.6 Australian and Maritime Continent Monsoon
Since AR5, several studies have examined observed variability and changes in the Australian and Maritime Continent monsoon (AusMCM) using paleoclimate records, instrumental observations and modeling studies (Denniston et al., 2016; Zhang and Moise, 2016). Paleoclimate reconstructions and modelling indicate that the Indo–Australian monsoon may vary in or out of phase with the EAsiaM, depending on whether there is a meridional displacement or expansion of the tropical rainfall belt (Ayliffe et al., 2013; Denniston et al., 2016). For instance, mid-Holocene simulations suggest that the AusMCM weakens and contracts due to a decreased net energy input and a weaker dynamic component (D’Agostino et al., 2020b).
Rainfall increases have been observed over northern Australia since the 1950s, with most of the increases occurring in the north-west (Dey et al., 2019a, b; Dai, 2021) and decreases observed in the north-east (J. Li et al., 2012) since the 1970s. There is also a trend towards more intense convective rainfall from thunderstorms over northern Australia (Dowdy, 2020). There is no consensus on the cause of the observed Australian monsoon rainfall trends, with some studies suggesting changes are due to altered circulation driving increased moisture transport or increased frequency of the wettest synoptic regimes (Catto et al., 2012; Clark et al., 2018). Other studies find that model simulations that include anthopogenic aerosols (Rotstayn et al., 2012; Dey et al., 2019a) are better able to capture observed Australian monsoon rainfall trends than simulations with natural or GHG forcing only (Knutson and Zeng, 2018).
The Maritime Continent (MC) experiences the influence of both the Asian and the Australian monsoons, with rainfall peaking during boreal winter/austral summer (Robertson et al., 2011). Reductions in land rainfall and marine cloudiness over the MC and weakening of surface moisture flux convergence have been observed in the period 1950–1999 (Tokinaga et al., 2012; Yoden et al., 2017). These trends are indicative of a slowdown of the Walker Circulation, with positive sea level pressure trends over the MC and negative trends over the central equatorial Pacific (Tokinaga et al., 2012). More recently (1981–2014), a trend of increasing annual rainfall over large areas of the MC has been identified (Hassim and Timbal, 2019). Given the large variability in MC rainfall on interannual time scales, the choice of time period may influence the calculated rainfall trend (Hassim and Timbal, 2019).
During 1951–2007 daily rainfall extremes did not increase over the MC, in contrast to the rest of South East Asia (Section 11.4.2; Villafuerte and Matsumoto, 2015). Rainfall extremes in Indonesia increased in austral summer, as evidenced from station weather observations for the period 1983–2012 (Supari et al., 2018).
In summary, notable rainfall increases have been observed in parts of northern Australia since the 1970s, although there is low confidence in the human contribution to these changes. Rainfall changes have been observed over the MC region but there is low confidence in the identification of trends because of large variability at interannual time scales.
8.3.2.5 Tropical Cyclones
The AR5 assessed low confidence in centennial changes in tropical cyclone (TC) activity globally, and in the attribution of observed changes in TCs to anthropogenic forcing. Since AR5, there has been considerable progress in understanding the observed changes of TCs and an overall improved knowledge of the sensitivity of TCs to both GHG and aerosol forcing (Knutson et al., 2019; Sobel et al., 2019).
Although observational data limitations (Lau and Zhou, 2012) tend to limit detection of anthropogenic forced increases in TC precipitation (Knutson et al., 2019), there is medium confidence that anthropogenic forcing has contributed to observed heavy rainfall events over the USA associated with TCs (Kunkel et al., 2012) and other regions with sufficient data coverage (Section 11.7.1.2; Bindoff et al., 2013). There has been increased frequency of TC heavy rainfall events over several areas in the USA since the late 19th century that is greater than what would be expected solely from changes in US landfall frequency, suggesting the increasing role of TCs have in causing heavy rainfall events (Kunkel et al., 2010). For example, there is evidence for an anthropogenic contribution to the extreme rainfall of Hurricane Harvey in 2017 (Emanuel, 2017; Risser and Wehner, 2017; van Oldenborgh et al., 2017; Trenberth et al., 2018; S.-Y.S. Wang et al., 2018).
While TCs cause extreme local rainfall and flooding, they can be also an important contributor to annual precipitation and regional fresh water resources (Hristova-Veleva et al., 2020). Transport of moisture by TCs is an important contributor for precipitation over the coastal areas of East Asia mostly from July through October, with the TC rainfall accounting for nearly 10% to 30% of the total rainfall in the region (L. Guo et al., 2017). Local TC rainfall totals depend on rain-rate and translation speed (the speed of TC movement along the storm track) with slow TCs such as Hurricane Harvey (2017), providing a clear example of the effect of slow translation speed on local rainfall accumulation, with urbanization exacerbating the storm total rainfall and flooding (Section 11.7.1; W. Zhang et al., 2018).
In addition to evidence that rain-rates have increased, there is evidence that TC translation speed has slowed globally (Kossin, 2018) thus amplifying thermodynamic intensification of rainfall and may be linked to anthropogenic forcing (Gutmann et al., 2018). This is limited evidence however, so there is medium confidence of a detectable change in TC translation speed over the US. Since the 1900s, and there is low confidence for a global signal because of limited agreement among models and due to data heterogeneity. However, the slowdown is consistent with theoretical and modelling studies that indicate a general weakening of the tropical circulation with warming that reduces the speed of the TC system (Chauvin et al., 2017), though there is limitedobservational evidence (Sections 8.2.3.5 and 11.7.1).
In summary, there is medium confidence of an observed increase in TC precipitation intensity in regions with sufficient data coverage Robust physical understanding (Section 8.2.3.2) and detailed singular event attribution studies provide evidence that tropical cyclone rainfall has increased with a warming climate (high confidence, Section 11.7.1.4).
8.3.2.6 Stationary Waves
Stationary waves are planetary-scale waves that are approximately stable (stationary) in terms of geographic position, as opposed to propogating planetary waves, and are important both as part of the climatological general circulation and seasonal and shorter-term anomalies. They are related to surface features including land –ocean contrasts and major mountain ranges, as well as atmospheric features including the jet stream, storm tracks, and blocking, which are considered separately in the following sections. While zonal mean changes in P–E (precipitation minus evaporation) are dominated by thermodynamic effects (Section 8.2.2.1), changes in stationary waves are of key importance in understanding zonal asymmetries in the water cycle response to global warming (Wills and Schneider, 2015; Wills et al., 2019). The AR5 did not explicitly assess stationary waves, but noted changes in related circulation features such as a likely poleward shift of the Northern Hemisphere (NH) storm tracks and an increase in frequency and eastward shift in North Atlantic blocking anticyclones, although there was low confidence in the global assessment of blocking.
Since AR5, several studies have demonstrated a link between stationary wave amplitude and wet and dry extremes in several different regions of the NH (Liu et al., 2012; Coumou et al., 2014; Screen and Simmonds, 2014; Yuan et al., 2015) with changes in moisture transport playing an important role (Yuan et al., 2015). A ‘resonance mechanism’ has been proposed for an increasing amplitude of stationary waves (Petoukhov et al., 2013, 2016; Coumou et al., 2014; Kornhuber et al., 2017)and several studies have linked increasing amplitude of stationary waves to Arctic warming (Francis and Vavrus, 2012, 2015; Liuet al. , 2012; Tanget al. , 2014) as well as to global warming (Mannet al. , 2017). However, other studies have not identified an increase in stationary wave amplitude (Barnes, 2013; Screen and Simmonds, 2013a, b).
There has been considerable work on linkages (teleconnections) between Arctic warming and the mid-latitude circulation (see also Cross-Chapter Box 10.1). The limited amount of research on Southern Hemisphere (SH) stationary waves suggests changes in high-latitude, mid-tropospheric stationary waves which influence Antarctic precipitation (Turner et al., 2017) and changes in stratospheric stationary waves that are associated with ozone depletion rather than increases in GHGs (L. Wang et al., 2013). The observed climatology of NH winter stationary waves is well-represented in the CMIP5 multi-model mean (Wills et al., 2019) but individual models have important deficiencies in reproducing stationary wave variability (Lee and Black, 2013). In the SH, the observed climatology of stationary waves in CMIP5 models has considerable bias in both phase and amplitude (Garfinkel et al., 2020). A comprehensive assessment is not yet available for CMIP6 models.
In summary, there is low confidence in strengthened winter stationary wave activity over the North Atlantic, associated with increased poleward moisture fluxes east of North America There is medium confidence in a recent amplification of the NH stationary waves in summer, but no formal attribution to anthropogenic climate change.
8.3.2.7 Atmospheric Blocking
Atmospheric blocking refers to persistent, semi-stationary weather patterns characterized by a high-pressure (anticyclonic) anomaly that interrupts the westerly flow in the mid-latitudes of both hemispheres. By redirecting the pathways of mid-latitude cyclones, blocking can affect the water cycle and lead to negative precipitation anomalies in the region of the blocking anticyclone and positive anomalies in the surrounding areas (Sousa et al., 2017). In this way, blocking can also be associated with extreme events such as heavy precipitation (Lenggenhager et al., 2019), drought (Schubert et al., 2014) and heatwaves (Miralles et al., 2014a). The AR5 reported low confidence in global-scale changes in blocking, due to methodological differences between studies.
Currently no consensus exists on observed trends in blocking during 1979–2013. (Horton et al., 2015) identified increasing trends in anticyclonic circulation regimes based on geopotential height fields in the mid-troposphere, which may be partly related to the tropospheric warming itself and thus not represent real changes in the statistics of weather (Horton et al., 2015; Woollings et al., 2018). Hanna et al. (2018) and (Davini and D’Andrea, 2020) reported a significant increase in the frequency of summer blocking over Greenland. A weakening of the zonal wind, eddy kinetic energy and amplitude of Rossby waves in summer in the NH (Coumou et al., 2015, Kornhuber et al., 2019) and an increased ‘waviness’ of the jet stream associated with Arctic warming (Francis and Vavrus, 2015; Pfahl et al., 2015; Luo et al., 2019) have also been identified, which may be linked to increased blocking.
In contrast, it has been shown that observed trends in blocking are sensitive the choice of the blocking index, and that there is a large internal variability that complicates the detection of forced trends (Barnes et al., 2014; Cattiaux et al., 2016; Woollings et al., 2018), compromising the attribution of any observed changes in blocking. Many climate models still underestimate the occurrence of blocking, at least in winter over north-eastern Atlantic and Europe (Dunn-Sigouin and Son, 2013), which leads to caution in the interpretation of their results for these regions. However, over the Pacific Ocean there have been large improvements in the simulation of blocking for the last 20 years(Davini and D’Andrea, 2016; Patterson et al. , 2019). In the SH, increases in blocking frequency have occurred in the South Atlantic in austral summer (Dennison et al., 2016) and in the southern Indian Ocean in austral spring (Schemm, 2018). A reduced blocking frequency has been found over the south-western Pacific in austral spring (Sections 2.3.1.4.3 and 3.4.1.3.3; Schemm, 2018).
In summary, no robust trend in atmospheric blocking has been detected in modern reanalyses and in CMIP6 historical simulations (medium confidence). The lack of trend is explained by strong internal variability and/or the competing effects of low-level Arctic amplification and upper-level tropical amplification of the equator-to-pole temperature gradient (medium confidence).
8.3.2.8 Extratropical Cyclones, Storm Tracks and Atmospheric Rivers
8.3.2.8.1 Extratropical cyclones and storm tracks
The AR5 indicated low confidence in long-term changes in the intensity of extratropical cyclones (ETC) over the 20th century derived from centennial reanalyses and storminess proxies based upon sea level pressure. This was confirmed by the SREX assessment that the main Northern Hemisphere (NH) and Southern Hemisphere (SH) extratropical storm tracks likely experienced a poleward shift during the last 50 years (Seneviratne et al., 2012) with low confidence, and inconsistencies within reanalysis datasets remain.
Since AR5 there has been considerable progress in quantifying storm track activity using multiple reanalysis products and different methodologies (Hodges et al. , 2011; Neu et al. , 2013; Tilinina et al. , 2013; X.L. Wang et al. , 2016). Over the NH increases in the total number of cyclones from 1979 show a large spread of trends across different estimates (Section 2.3.1.4.3; Neu et al., 2013; Z. Li et al., 2016a; Grieger et al., 2018) resulting in low confidence in any clear increase of in the total number of cyclones. However, starting from the early 1990s, most reanalyses show increases in the total cyclone number by about 2–5% per decade (Figure 8.12). Increasing trends in the total number of cyclones are dominated by the increase in the number of shallow and moderate cyclones (which are more dependent on the datasets and identification methods used) than with decreasing number of deep cyclones since the early 1990s (Tilinina et al., 2013; Chang, 2018). In the SH the variability of the total number of cyclones is characterized by strong inter-decadal variability preventing a clear assessment of trends. However, in contrast to the NH,there is a significant increasing trend in the number of deep cyclones (about 10% over 1979–2018) in ERA5, ERA-Interim, JRA55 and MERRA, and in the CFSR dataset after 2000 (Figure 8.12; Reboita et al., 2015; X.L. Wang et al., 2016).
 Figure 8.12 | Annual anomalies (with respect to the reference period1979–2018) of the total number of extratropical cyclones (a, b) and of the number of deep cyclones (<980 hPa) (c, d) over the Northern (a, c) and the Southern (b, d) Hemispheres in different reanalyses (shown in colours in the legend).
 Note different vertical scales for panels (a, b) and (c, d). Thin lines indicate annual anomalies and bold lines indicate five-year running averages. (e, f) The number of reanalyses (out of five) simultaneously indicating statistically significant (90% level) linear trends of the same sign during 1979–2018 for JFM (January–February–March) over the Northern Hemisphere (e) and over the Southern Hemisphere (f). Updated from Tilinina et al. (2013). Further details on data sources and processing are available in the chapter data table (Table 8.SM.1).
Changes in the number of deep storms, which are often associated with heavier precipitiation over the North Atlantic and North Pacific, exhibit strong seasonal differences and decadal variability (Colle et al. , 2015; Chang et al. , 2016; Matthews et al. , 2016; Priestley et al. , 2020a). An increase in the number of summer cyclones over the Atlantic-European sector (Tilinina et al. , 2013) is consistent with the increase in the strength of the strongest fronts over Europe (Schemm et al. , 2018). Chang et al. (2016) reported a decrease in the number of strong summer storms in the latitudinal band 40°N–75°N over the last decades, however, the assessment of seasonal trends in the Atlantic-European sector is complicated by the choice of region, attribution of tracks to the region selected, and thresholds used to identify trajectories, leading to low confidence on regional seasonal trends. For the SH, Grieger et al. (2018) reported a growing number of cyclones over sub-Antarctic region in the austral-summer during 1979–2010, while statistically significant trends were absent during the austral winter.
Analysis of storm track activity over longer periods suffers from uncertainties associated with changing data assimilation and observations before and during the satellite era, resulting in in homogeneities and discontinuities in centennial reanalyses (Krueger et al. , 2013; X.L. Wang et al. , 2013, 2016; Chang and Yau, 2016; Varino et al. , 2019). Feser et al. (2015) reviewed multiple storm track records for the Atlantic-European sector and demonstrated growing storm activity north of 55°N from the 1970s to the mid-1990s with declining trend thereafter, sugesting strong inter-decadal variability in storm track activity. This was also confirmed by Krueger et al. (2019) from the analysis of geostrophic winds derived from sea level pressure gradients.
Poleward deflection of mostly oceanic winter storm tracks since 1979 was reported in both the North Atlantic and North Pacific (Tilinina et al., 2013; J. Wang et al., 2017). This large-scale tendency has regional variations and may be seasonally dependent. Wise and Dannenberg (2017) reported a southward shift in the east Pacific storm track from the 1950s to mid-1980s followed by northward deflection in the later decades. (King et al., 2019) reported an association of Atlantic storm track migrations with SSW events with Central and South European precipitation anomalies. Over centennial time scales, Gan and Wu (2014) reported an intensification of storm tracks in the poleward and downstream regions of the North Pacific and North Atlantic upper troposphere using the NOAA–CIRES–DOE Twentieth Century Reanalysis. Poleward migration of the SH storm tracks (Grise et al., 2014; X.L. Wang et al., 2016; Dowdy et al., 2019) was identified during the austral summer and is closely associated with cyclone-associated frontal activity (Solman and Orlanski, 2014, 2016) and cloud cover (Bender et al., 2012; Norris et al., 2016).
The representation of ETCs in both climate models and reanalyses is resolution-dependent, hence changes must be assessed with caution (Section 3.3.3.3). In particular, CMIP5 models show a systematic underestimation of the intensity of ETCs (Zappa et al., 2014), a feature that is partially related to their relatively coarse resolution or other possible deficiencies such as an excess of dissipation (Chang et al., 2013). The best representation of ETCs and their intensity in the North Atlantic are provided by relatively high horizontal resolution CMIP5 models (Zappa et al., 2014). Using a single high-resolution climate model, (Hawcroft et al., 2016) showed that precipitation amount associated with ETCs was generally well simulated, though with too much precipitation during the strongest ECTs compared with observed estimations.
In summary, there is low confidence in recent changes in the total number of extratropical cyclones over both hemispheres. It is as likely as not that the number of deep cyclones over the NH has decreased after 1979 and it is likely that the number of deep extratropical cyclones increased over the same period in the SH. It is likely that extratropical cyclone activity in the SH has intensified during austral summer with no significant changes in austral winter. There is medium confidence that boreal-winter storm tracks during the last decades experienced poleward shifts over the NH and SH oceans. There is low confidence of changes in extratropical cyclone activity prior 1979 due to inhomogeneities in the intrumental records and modern reanalyses.
8.3.2.8.2 Atmospheric rivers
Atmospheric rivers (ARs) are long, narrow (up to a few hundred kilometres wide), shallow (up to few kilometres deep) and transient corridors of strong horizontal water vapour transport that are typically associated with a low-level jet stream ahead of the cold front of an extratropical cyclone (Ralph et al., 2018). Atmospheric rivers were not assessed in AR5. ARs are associated with atmospheric moisture transport from the tropics to the mid- and high latitudes (Zhu and Newell, 1998), although the drivers of moisture transport relative to the different airstreams within extratropical cyclones remains a subject of current study (Dacre et al., 2019). While much previous research has focused on the west coast of North America, ARs occur throughout extratropical and polar regions (e.g., Guan and Waliser, 2015) and are often associated with locally-heavy precipitation, including a substantial fraction of all mid-latitude extreme precipitation events (e.g., Waliser and Guan, 2017). ARs also affect East Asia strongly during the period from late spring to summer (Kamae et al., 2017). ARs can be related to warming/melt events trough the intrusions of warm and moist air in Antarctica, Greenland and New Zealand (Bozkurt et al., 2018; Mattingly et al., 2018; Little et al., 2019), contributing about 45–60% of total annual precipitation in subtropical South America (Viale et al., 2018). They alsotransport moisture from South America to the western and central South Atlantic, feeding the ARs that reach the west coast of South Africa(Ramos et al., 2019). However, the estimation of precipitation rate from ARs can have large uncertainties, especially as ARs hit topographically complex coastal regions (Behrangi et al., 2016), which can cause complexities in quantifying AR-related precipitation.
Analysis of observed trends in the characteristics of ARs has been limited. Gershunov et al. (2017) and Sharma and Déry (2019) have shown a rising trend in land-falling AR activity over the west coast of North American since 1948. (Gonzales et al., 2019) have also documented a seasonally-asymmetric warming of ARs affecting the West Coast of the USA since 1980, which has hydrological implications for the timing and magnitude of regional runoff. Longer-term paleoclimate analysis of ARs is even more limited, although Lora et al. (2017) reported that in the last glacial maximum, AR landfalls over the North American west coast were shifted southward compared to the present conditions.
In summary, it is likely that there was an increasing trend in the AR activity in the eastern North Pacific since the mid-20th century. However, there is low confidence in the magnitude of this trend and no formal attribution, although such an increase in activity is consistent with the expected and observed increase in precipitable water associated with human-induced global warming.
8.3.2.9 Modes of Climate Variability and Regional Teleconnections
Following on from the assessment in Chapters 2 and 3, this section considers changes in modes of variability at seasonal to interannual time scales in terms of their implications on recent water cycle changes. These modes are described in details in Technical Annex IV.
8.3.2.9.1 Tropical modes
The amplitude of the El Niño–Southern Oscillation (ENSO; Section AIV.2.3) variability has increased since 1950 (Section 2.4.2) but there is no clear evidence of human influence (Sections 2.4.2 and 3.7.3).
ENSO influences precipitation and evaporation dynamics, river flow and flooding at a global scale (Figure 3.37; Ward et al., 2014, 2016; Martens et al., 2018). Reconstruction (1804–2005) of Thailand’s Chao Praya River peak season streamflow displays a strong correlation with ENSO (Xu et al., 2019). Based on water storage estimates from 2002 to 2015, drought conditions over the Yangtze River basin followed La Niña events and flood conditions followed El Niño events (Z. Zhang et al., 2015). Strong correlation between ENSO and terrestrial water storage has been identified mostly in the subtropics but with diverse intensities and time lags depending on the region (Ni et al., 2018). The likelihood of increased/decreased flood hazard during ENSO events has a complex spatial pattern with large uncertainties (Emerton et al., 2017).
Tropical SSTs and associated global circulation may increase rainfall in West Africa, as observed in some years during 1950–2015, despite the presence of El Niño (Pomposi et al., 2020). During an El Niño summer, equatorial convective systems and the associated Walker circulation tend to shift eastward, leading to decreases in Indian summer monsoon rainfall (Li and Ting, 2015; Roy et al., 2019). This teleconnection is modulated by Indian Ocean Variability (Terray et al., 2021), as observed during the extreme positive IOD event in 2019 (Ratna et al., 2021). Since the end of the 19th century, synchronous hydroclimate changes (medium confidence) have been identified over south-eastern Australia and South Africa (Gergis and Henley, 2017) modulated by ENSO, as well as other regional fluctuations like the Botswana High over southern Africa (Driver and Reason, 2017). Over southern South America, the ENSO influence on precipitation (Cai et al., 2020; Poveda et al., 2020) interacts with the influence of SAM (Pedron et al., 2017), exhibiting large multi-decadal variations because of changes in the correlation between the two large-scale modes (Vera and Osman, 2018). Other processes underlying ENSO teleconnections of relevance for water cycle changes include water vapour and moisture transports, like over the Middle East (Sandeep and Ajayamohan, 2018), south-eastern China (S. Yang et al., 2018b), or central Asia (X. Chen et al., 2018), south-eastern South America (Martin-Gomez et al., 2016; Martín-Gómez and Barreiro, 2016), Australia (Rathore et al., 2020) and southern USA (Okumura et al., 2017).
There is no evidence of a trend in the Indian Ocean Dipole (IOD; Section AIV.2.4) mode and associated anthropogenic forcing (Sections 2.4.3 and 3.7.4). The AR5 concluded that the IOD is likely to remain active, affecting climate extremes in Australia, Indonesia and East Africa. Since the AR5, IOD teleconnections have been identified extending further to the Middle East (Chandran et al., 2016), to the Yangtze river (Xiao et al., 2015), where in boreal summer and autumn positive IOD events tend to increase the precipitation in the south-eastern and central part of the basin, and to the southern Africa extreme wet seasons (Hoell and Cheng, 2018). During the last millenium, the combined effect of a positive IOD and El Niño conditions have caused severe droughts over Australia (Abram et al., 2020). In the satellited period, it is found more effective in inducing significant decrease of rainfall over Indonesia, with the opposite occurring for negative IOD events (As-syakur et al., 2014; Nur’utami and Hidayat, 2016; Pan et al., 2018). Similarly, over the Ganges and Brahmaputra river basins major droughts have been recorded during co-occurring El Niño and positive IOD, while floods occurred during La Niña and negative IOD conditions (Pervez and Henebry, 2015). Over equatorial East Africa the IOD affects the short rain season (medium confidence) exacerbating flooding and inundations independently of ENSO (Behera et al., 2005; Conway et al., 2005; Ummenhofer et al., 2009; Hirons and Turner, 2018). Extreme conditions, like the 2019 Australian bushfires and African flooding, have been associated with strong positive IOD conditions (Cai et al., 2021).
Intraseasonal variability, like the Madden Julian Oscillation (MJO, Section AIV.2.8) and the Boreal Summer Intraseasonal Oscillation (BSISO), are highly relevant to the water cycle (Maloney and Hartmann, 2000; Lee et al., 2013; Yoshida et al., 2014; Nakano et al., 2015). Since AR5, studies on MJO teleconnections within the tropics and from the tropics to higher latitudes have continued (Guan et al., 2012;Mundhenk et al., 2018; Tseng et al., 2019; Aberson and Kaplan, 2020; Finney et al., 2020b; Fowler and Pritchard, 2020; Fromang and Rivière, 2020).
The strength and frequency of the MJO have increased over the past century (medium confidence) (Oliver and Thompson, 2012; Maloney et al., 2019; Cui et al., 2020) because of global warming (Arnold et al., 2015; Carlson and Caballero, 2016; Wolding et al., 2017; Maloney et al., 2019). A 20th century reconstruction suggests a 13% increase of the MJO amplitude (Oliver and Thompson, 2012), with differences in seasonal variability (Tao et al., 2015; Z. Wang et al., 2020). However, up to half of changes recorded during the second half of the 20th century could be due to internal variability (Schubert et al., 2013). Other observed changes in MJO characteristics include a decrease (by threetofour days) in the residence time over the Indian Ocean but an increase (by five to six days) over the Indo-Pacific and Maritime Continent sectors (Roxy et al., 2019).
Consequences of these changes are increased rainfall over South East Asia, northern Australia, south-west Africa and the Amazon, and drying over the west coast of the USA and Equador (Roxy et al., 2019). During the austral summer, air–sea interactions and location of the MJO active phase are important to modulate the strength of the rainfall response in the South Atlantic Convergence Zone (Shimizu and Ambrizzi, 2016; Alvarez et al., 2017), including its southward shift (Barreiro et al., 2019). In the austral winter, the intraseasonal variability is mostly influential over regions of the Amazonian basin (Mayta et al., 2019). Some MJO phases are particularly effective in conjuction with tropical cyclones in enhancing westerly moisture fluxes towards East Africa (Finney et al., 2020b).
Simulated changes in MJO precipitation amplitude are extremely sensitive to the pattern of SST warming (Takahashi et al., 2011; Maloney and Xie, 2013; Arnold et al., 2015) and ocean–atmosphere coupling (DeMott et al., 2019; Klingaman and Demott, 2020). In agreement with results from previous model generations, most CMIP5 models still underestimate MJO amplitude, and struggle to generate a coherent eastward propagation of precipitation and wind (Hung et al., 2013; Jiang et al., 2015; Ahn et al., 2017), affecting regional surface climate in the tropics and extratropics. In addition, most CMIP5 models simulate an MJO that propagates faster compared with observations, with a poorly represented intra-seasonal precipitation variability (Ahn et al., 2017). Over the Indian Ocean, the propagation speed of convection in some CMIP5 models tends to be slower than observed due to a strong persistence of equatorial precipitation (Hung et al., 2013; Jiang et al., 2015). Among other processes, improving the moisture-convection coupling, the representation of moist convection, the interaction between lower tropospheric heating and boundary layer convergence, and the topography of the Maritime Continent improve simulations of the MJO (Ahn et al. , 2017, 2020a; Kim and Maloney, 2017; Yang and Wang, 2019; H. Tan et al. , 2020; Y.-M. Yang et al. , 2020). In fact, CMIP6 models reproduce the amplitude and propagation of the MJO better than CMIP5 models due to increased horizontal moisture advection over the Maritime Continent (Ahn et al., 2020b). Despite the diverse theories of MJO evolution and processes that have been developed since its discovery, a better understanding of its dynamics is still needed (Jiang et al., 2020; Zhang et al., 2020). Furthermore, metrics based on dynamical processes are needed to assess model simulations of these events (Stechmann and Hottovy, 2017; B. Wang et al., 2018) as well as related teleconnections (J. Wang et al., 2020).
In summary, multiple water cycle changes related to ENSO and IOD teleconnections have been observed across the 20th century (high confidence), mostly dominated by interannual to multi-decadal variations. The MJO amplitude has increased in the second half of the 20th century partly because of anthropogenic global warming (medium confidence) altering regional precipitation signals.
8.3.2.9.2 Extratropical modes
A positive trend has been observed in the Northern Annular Mode (NAM; Section AIV.2.1) in the second half of the 20th century, which partially reversed since the 1990s (Section 2.4.5.1), but the detection and attribution of these changes remain difficult (Section 3.7.1). The linkages of the NAM with weather and climate extremes in the northern extratropics are still unclear in models and observations (Vihma, 2014; Overland et al., 2016; Screen et al., 2018). However, robust links are identified between precipitation trends and variability in Europe and the phases of the Atlantic component of the NAM, that is, the NAO (Moore et al., 2013; Comas-Bru and McDermott, 2014). Reduced winter precipitation is well correlated with the NAO over Southern Europe and Mediterranean countries (Kalimeris et al. , 2017; Corona et al. , 2018; Vazifehkhah and Kahya, 2018; Neves et al. , 2019). NAO teleconnections in those regions include influences on groundwater and streamflow (Zamrane et al., 2016; Massei et al., 2017; Jemai et al., 2018). Remote teleconnections of the NAO have been identified over Northern China, the Yangtze River valley and India (Jin and Guan, 2017; Di Capua et al., 2020). The summer phase of the NAO is significantly correlated with variations in summer rainfall in East China, with the thermal forcing of the Tibetan Plateau providing a link to this Eurasian teleconnection (Z. Wang et al., 2018).
In the Southern Hemisphere (SH), an observed positive trend is identified in the strength of the Southern Annular Mode (SAM, Section AIV.2.2) since 1950, especially in austral summer (high confidence, Section 2.4.1.2). While stratospheric ozone depletion and GHG increases largely contributed to this change, climate models still have trouble simulating the SAM and its response to ozone and GHGs (Section 3.7.2). Shifts in the south-westerly winds (Fletcher et al., 2018) and the expansion of the SH Hadley cell (Kang and Polvani, 2011; H. Nguyen et al., 2018) influence SAM-related rainfall anomalies in in southern South America and southern Australia during the austral spring–summer. Over New Zealand, large-scale SLP and zonal wind patterns associated with SAM phases modulate regional river flow (Li and McGregor, 2017). The SAM also influences precipitation and water vapour changes over Antarctica via moisture fluxes (Marshall et al., 2017; Oshima and Yamazaki, 2017; Grieger et al., 2018) but CMIP5 models are limited in their ability to simulate these regional teleconnections (Marshall and Bracegirdle, 2015; Palerme et al., 2017). SAM and its interaction with other large-scale modes of climate variability, like ENSO (Fogt et al., 2011) and the Indian Ocean Dipole (Hoell et al., 2017a), are responsible for fluctuations in southern African rainfall (Nash, 2017) and southern South America (Gergis and Henley, 2017). In May, the SAM can trigger a southern Indian Ocean Dipole SSTA favoring more or less precipitation over the Indian sub-continent and adjacent areas (Dou et al., 2017), also affecting subsequent summer monsoon in the South China Sea (T. Liu et al., 2018). Over South America, a positive SAM is associated with dry conditions (Holz et al., 2017) due to reduced frontal and orographic precipitation and weakening of moisture convergence. Regions particularly affected include Chile (Boisier et al., 2018) and the rivers of central Patagonia (Rivera et al., 2018).
In summary, while the attribution of 20th century variations of the NAM/NAO is still unclear, there is a strong relationship with precipitation changes over Europe and in the Mediterranean region (high confidence). SAM teleconnections are associated with changes in moisture transport and extend to South America, Australia and Antarctica (high confidence) with documented drying occurring as a result of the very likely human-induced SAM trend toward its positive phase observed from the 1970s until the 1990s (Section 3.7.2).
8.4 What Are the Projected Water Cycle Changes?
We consider global and regional climate projections of the water cycle, assessing projected changes in each component of the water cycle (Section 8.4.1) and the global-scale and regional phenomena that directly impact it (Section 8.4.2).
8.4.1 Projected Water Cycle Changes
Most projected changes in the water cycle are not expected to be uniform in space or time. They are driven by both dynamical and thermodynamical processes (Section 8.2) and have not necessarily emerged yet in the recent observational record (Section 8.3) as they are superimposed on substantial natural fluctuations in weather and climate. Therefore, projecting regional water cycle changes remains challenging. However, a number of physically understood responses can be evaluated using both CMIP5 and CMIP6 models, which are important for guiding decision making that anticipates, prepares for, and responds to water cycle changes. In this section, global maps of projected changes in water cycle variables are assessed using the WGI AR6 ‘simple method’ (see Cross-Chapter Box Atlas1), which uses hatching to highlight where less than 80% of the models agree on the sign of projected changes. This choice differs from Section 4.2.6 for a number of reasons. These include the weak signal-to-noise ratio of projected hydrological changes in low to medium emissions scenarios, the sensitivity of their statistical significance to the baseline reference period, and the non-Gaussian distribution of many water cycle variables (see Cross-Chapter Box Atlas.1 for more details on strengths and limitations of the hatching methods implemented within AR6).
8.4.1.1 Global Water Cycle Intensity and P–E Over Land and Oceans
As discussed in 8.3.1.1, the definition of global water cycle intensity varies from the simple metric of increases in global mean precipitation to broader joint considerations of water vapour and its transport, precipitation minus evaporation (P–E) rates and continental runoff (Figure 8.1). The AR5 determined that globally averaged precipitation is virtually certain to increase with temperature and that there is high confidence that the contrast of annual mean precipitation between dry and wet regions and seasons will increase over most of the globe as temperatures and moisture transports increase (Collins et al., 2013). The AR5 also highlighted that continued ocean warming for a few decades after GHG forcing stabilizes or begins to decrease will also lead to further increases in global mean precipitation and evaporation.
Mid-term: 2041–2060Minus Reference Period | Long Term: 2081–2100Minus Reference Period | ||||||||||
1995–2014reference period | SSP1-1.9 | SSP1-2.6 | SSP2-4.5 | SSP3-7.0 | SSP5-8.5 | SSP1-1.9 | SSP1-2.6 | SSP2-4.5 | SSP3-7.0 | SSP5-8.5 | |
Global Annual | |||||||||||
Precipitation (mm day–1) | 2.96 [2.76 to 3.17] | 0.06 [0.03 to 0.11] | 0.07 [0.03 to 0.12] | 0.07 [0.04 to 0.12] | 0.06 [0.03 to 0.11] | 0.08 [0.03 to 0.14] | 0.06 [0.02 to 0.11] | 0.09 [0.04 to 0.17] | 0.12 [0.07 to 0.21] | 0.15 [0.08 to 0.24] | 0.2 [0.1 to 0.33] |
Precipitable Water (kg m2) | 24.79 [23.06 to 26.82] | 1.42 [0.7 to 2.26] | 1.84 [1.03 to 2.62] | 2.29 [1.6 to 3.09] | 2.7 [1.92 to 3.92] | 3.15 [2.13 to 4.38] | 1.11 [0.28 to 2.13] | 2.11 [0.98 to 3.15] | 3.76 [2.41 to 5.08] | 6.2 [4.24 to 8.83] | 7.92 [5.21 to 10.69] |
Global Land Annual | |||||||||||
Precipitation (mm day–1) | 2.27 [1.98 to 2.58] | 0.07 [0.02 to 0.11] | 0.07 [–0.0 to 0.13] | 0.06 [0.01 to 0.13] | 0.06 [0.02 to 0.12] | 0.09 [0.01 to 0.16] | 0.06 [0.01 to 0.1] | 0.08 [0.02 to 0.16] | 0.11 [0.02 to 0.19] | 0.14 [0.03 to 0.22] | 0.2 [0.07 to 0.32] |
Precipitation – Evaporation (mm day–1) | 0.87 [0.49 to 1.26] | 0.02 [0.0 to 0.03] | 0.02 [–0.01 to +0.05] | 0.02 [–0.02 to +0.06] | 0.03 [–0.0 to +0.06] | 0.04 [0.0 to 0.1] | 0.01 [–0.0 to +0.03] | 0.03 [–0.01 to +0.08] | 0.04 [–0.01 to 0.07] | 0.07 [0.0 to 0.12] | 0.1 [0.01 to 0.22] |
Runoff (mm day–1) | 0.79 [0.54 to 1.0] | 0.02 [0.0 to 0.05] | 0.04 [–0.0 to +0.1] | 0.04 [–0.0 to +0.11] | 0.04 [0.01 to 0.08] | 0.06 [0.01 to 0.14] | 0.02 [–0.0 to +0.03] | 0.04 [–0.0 to +0.13] | 0.06 [0.0 to 0.17] | 0.1 [0.02 to 0.2] | 0.15 [0.04 to 0.27] |
Precipitable Water (kg m2) | 18.86 [17.12 to 21.28] | 1.23 [0.57 to 1.96] | 1.58 [0.77 to 2.42] | 1.96 [1.34 to 2.76] | 2.33 [1.63 to 3.46] | 2.72 [1.79 to 3.84] | 0.95 [0.19 to 1.95] | 1.78 [0.8 to 2.77] | 3.18 [2.04 to 4.34] | 5.33 [3.57 to 7.5] | 6.81 [4.35 to 9.32] |
In this Report, Chapter 4 provides an updated assessment of global annual precipitation (Section 4.3.1), finding that it is very likely that annual precipitation averaged over all land regions continuously increases as global surface temperatures increase in the 21st century (high confidence). CMIP6 projections for long-term changes in P–E (Figure 8.13) show that, for all scenarios, P–E increases over the tropics and high latitudes and decreases over the subtropics, resulting from a thermodynamically driven amplification of P–E patterns (Section 8.2.2.1). Both the intensity of changes and the spread among the models is larger for the higher emissions scenarios. A less coherent latitudinal pattern and smaller magnitude of P–E changes over land reflect the complex influence of land–ocean warming contrast, atmospheric circulation change and vegetation feedbacks (Section 8.2.2.1). However, stronger atmospheric moisture transport, increases in precipitation and evaporation over global land and ocean and larger continental runoff that is in part fed by melting of glaciers characterizes a more intense water cycle with global warming.
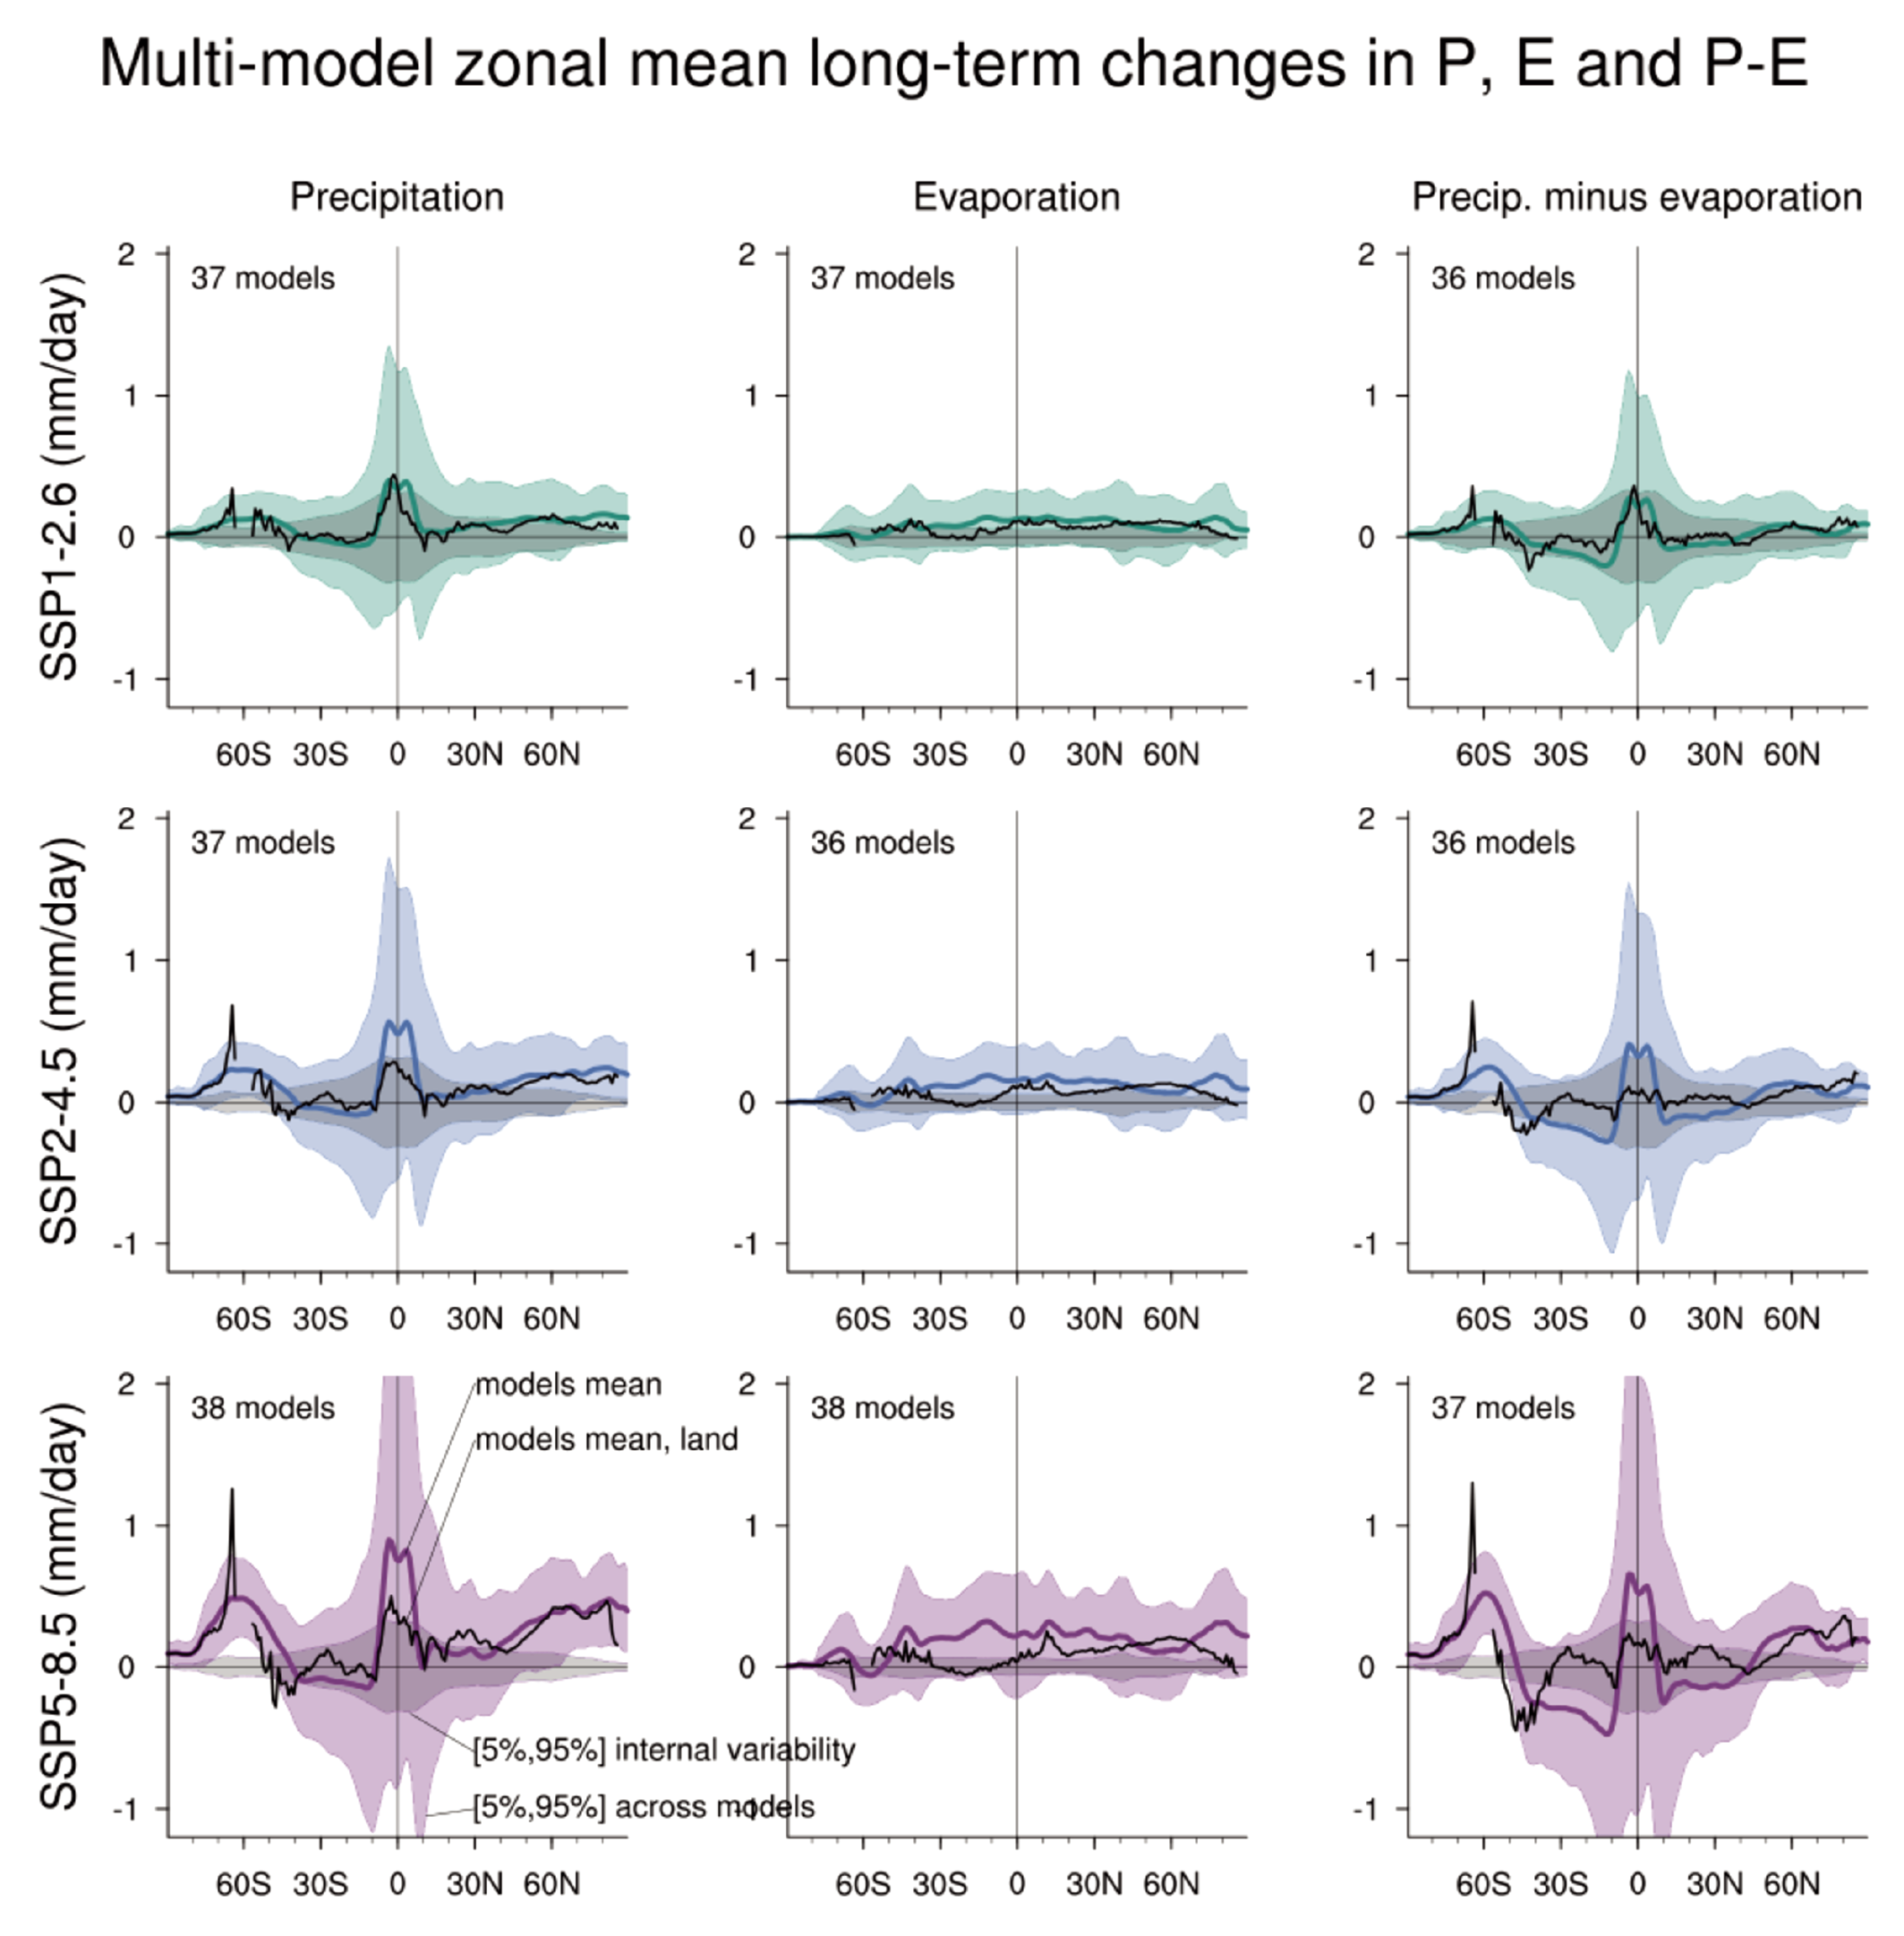 Figure 8.13 | Zonal and annual-mean projected long-term changes in the atmospheric water budget. Zonal and annual mean projected changes (mm day–1) in P (precipitation, left column), E (evaporation, middle column), and P–E (right column) over both land and ocean areas (coloured lines) and over land only (black lines) averaged across available CMIP6 models (number provided at the top left of each panel) in the SSP1-2.6 (top row), SSP2-4.5 (middle row) and SSP5-8.5 (bottom row) scenario, respectively. Shading denotes confidence intervals estimated from the CMIP6 ensemble under a normal distribution hypothesis. Colour shading denotes changes over both land and ocean. Grey shading represents internal variability derived from the pre-industrial control simulations. All changes are estimated for 2081–2100 relative to the 1995–2014 base period. Further details on data sources and processing are available in the chapter data table (Table 8.SM.1).
 Global and global land mean water cycle changes from CMIP6 projections are shown in Table 8.1. Increases in global and continental precipitation, P–E and runoff in both the mid-term and long-term illustrate the future intensification of the water cycle, with the magnitude of change increasing with emissions scenarios. Consistent with AR5, CMIP6 simulations of global mean precipitation show a systematic multi-model mean increase of 1.6 to 2.9 % °C–1 warming (apparent hydrological sensitivity; Section 8.2.1) by 2081–2100 relative to present day across the new SSP scenarios (using global surface air temperature change from Table 4.1). It is well understood that rising concentrations of CO2 drive a long-term increase in global precipitation with warming, but with the increase partly offset by rapid atmospheric adjustments to the direct atmospheric heating from radiative forcing agents (Section 8.2.1). The largest apparent hydrological sensitivity is found for SSP1-1.9, where the suppressing effects on precipitation from atmospheric heating by greenhouse gases (GHGs) rapidly reduce as their concentration falls. Additional warming due to reduced aerosol loadings under the SSP scenarios (Lund et al. , 2019) further increases global precipitation (Rotstayn et al., 2013; Wu et al., 2013; Salzmann, 2016; T.B. Richardson et al., 2018b; Samset et al., 2018b; Westervelt et al., 2018), with particularly strong contributions from increased monsoon rainfall over East and South Asia (Levy et al., 2013; Westervelt et al., 2015; Dwyer and O’Gorman, 2017).
Over global land there is a small range in global mean multi-model mean precipitation increase across scenarios in the mid-term (2.6–4.0 %), which widens (to 2.6–8.8 %) in the long-term (Table 8.1). The long-term projections are consistent with the Chapter 4 assessment that global annual precipitation over land is projected to increase on average by 2.4 [–0.2 to +4.7] % (likely range) in the SSP1-1.9 low-emissions scenario and by 8.3 [0.9 to 12.9] % in the SSP5-8.5 high emissions scenario by 2081–2100 relative to 1995–2014. Small differences in assessed model mean changes in Chapter 4, Table 4.2 result from a slightly different set of models considered for Table 8.1. Over land, P–E increases by around 2–3% in the mid-term (apart from SSP5-8.5 where increases are almost 5%) and around 1–12% in the long-term, determined by increased moisture transport from the ocean to land Section 8.4.1.2). Runoff increases are larger and less certain due to additional inputs from glacier melt and changes in groundwater storage (Section 8.4.1.7). Overall, precipitation and runoff are very likely to increase over the global land in all scenarios in the mid- and long term. P–E is likely to increase over global land in the mid- and long term and very likely in SSP1-1.9, SSP3-7.0 and SSP5-8.5 pathways. The mid-term consistency in projections across scenarios is not apparent for precipitable water vapour, which increases over land by around 6–15% in the mid-term and 5–36% in the long-term across all scenarios. This implies that increases in extreme precipitation (closely related to atmospheric water vapour content; Section 8.2.3.2) are dependent on mitigation pathway, even in the mid-term (Section 11.4.5). Water vapour residence time (computed as the ratio of precipitable water vapour to precipitation from values in Table 8.1) increases from eight days in the present to nine days in mid-term and up to about ten days in the long-term over land in SSP3-7.0, indicating a longer time to moisten the atmosphere between precipitation events. The CMIP6 projections are therefore consistent with anintensification but not acceleration of the global water cycle.
In summary, it is virtually certain that global water cycle intensity, considered in terms of global and continental mean precipitation, evaporation and runoff, will increase with continued global warming. Global annual precipitation over land is projected to increase on average by 2.4 [–0.2 to +4.7] % (likely range) in the SSP1-1.9 low-emissions scenario and by 8.3 [0.9 to 12.9] % in the SSP5-8.5 high emissions scenario by 2081–2100 relative to 1995–2014.
8.4.1.2 Water Vapour and Its Transport
Globally, AR5 assessed that by the end of the 21st century, the average quantity of water vapour in the atmosphere could increase by 5–25%, depending on emissions. The AR5 assessed that increases in near-surface specific humidity over land are very likely , but that it was also likely that near-surface relative humidity would decrease over many land areas, although with only medium confidence. In terms of moisture transport, AR5 assessed that it was likely that moisture transport into the high latitudes would increase and that there was high confidence that, over the ocean, atmospheric moisture transport from the evaporative regions to the wet regions would increase.
CMIP6 climate models continue to project a steady increase in global mean column-integrated water vapour by around 6–13% by 2041–2060 and 5–32% by 2081–2100, depending on scenario (Table 8.1). This is consistent with projected atmospheric warming (Section 4.5.1.2) and the Clausius–Clapeyron relationship (Section 8.2.1) where every degree Celsius of warming is associated with an approximate 7% increase in atmospheric moisture in the lower atmospheric layers where most of the water vapour is concentrated. This increase sustains a positive feedback on anthropogenic global warming (Section 7.4.2.2). In contrast, the response of clouds is much more spatially heterogeneous, microphysically complex, and model-dependent so that the projected cloud feedbacks remain a key uncertainty for constraining climate sensitivity (Section 7.4.2.4).
CMIP6 models project an overall decrease in near-surface relative humidity over land, although with some regional and seasonal variations in their response (Figure 4.26). Regional changes in near-surface humidity over land are dominated by thermodynamic processes and are primarily controlled by moisture transport from the warming ocean (Chadwick et al., 2016a). Increases in specific humidity lower than the thermodynamic rate are explained by greater warming over land than ocean and modulated by land –atmosphere feedbacks such as soil moisture and plant stomatal changes (Section 8.2.2.1; Berg et al., 2017; Douville et al., 2020). This explains why climate models continue to project a contrasting response of near-surface relative humidity, with a slight and possibly overestimated increase over the oceans and a consistent but possibly underestimated decrease over land (Byrne and O’Gorman, 2016; Douville and Plazzotta, 2017; R. Zhang et al., 2018).
While projections of water vapour are well understood due to the constraints of the Clausius–Clapeyron relationship, projections of water vapour transport are complicated regionally by the role of changes in the wind field, which is influenced by a wide variety of factors. Additionally, there has been relatively little general evaluation of moisture transport in models. In CMIP5 models, both the mean and variability of the vertically-integrated moisture transport is projected to increase, largely due to increases in water vapour (Lavers et al., 2015), with substantial regional differences (Levang and Schmitt, 2015). Single-model studies have illustrated projected increases in low-altitude moisture transport into convergence regions (Allan et al., 2014) and from ocean to land (Zahn and Allan, 2013) that are consistent with present day trends. Increases in moisture transport have been linked to increases in large precipitation accumulations over land (Norris et al., 2019). Based on robust physics and supported by modelling studies, it is well understood that moisture transport increases into convergent parts of the atmospheric circulation such as storm systems, the tropical rain belt and high latitudes (Section 8.2.2.1), but changes in atmospheric circulation that are less well understood alter moisture transport regionally (Section 8.2.2.2). Therefore, given the limited examination of moisture transport in models, regional projections should be considered with caution. Changes in moisture transport specifically associated with monsoons, atmospheric rivers, and other specific circulation features are discussed further in the following sections.
In summary, there is high confidence in continued increases in global mean column integrated water vapour and near-surface specific humidity over land. There is medium confidence in region and season-dependent decreases in near-surface relative humidity over land, due to the complex physical processes involved . In general, there will be increases in moisture transport into storm systems, monsoons and high latitudes (medium confidence).
8.4.1.3 Precipitation Amount, Frequency and Intensity
This section assesses projected changes in precipitation at regional scales. Note that changes in precipitation seasonality are assessed in Box 8.2 and that changes in regional monsoons are assessed in Section 8.4.2.4, where both circulation and rainfall are considered. Further assessments of regional projections of precipitation are presented in Chapters 10, 12 and the Atlas, while a comprehensive assessment of changes in precipitation extremes is provided in Chapter 11.
The AR5 assessed that the contrast of mean precipitation amount between dry and wet regions and seasons is expected to increase over most of the globe as temperatures increase (high confidence), but with large regional variations. Precipitation over the high latitudes, equatorial Pacific Ocean, mid-latitude wet regions, and monsoon regions were assessed as likely to increase under the RCP8.5 scenario, and in many mid-latitude and subtropical dry regions as likely to decrease (AR5 Chapters 7, 12, and 14). Extreme precipitation over most mid-latitude land areas and wet tropical regions was assessed as very likely to become more intense and more frequent.
Geographical patterns of projected precipitation changes show substantial seasonal contrasts and regional differences, including over land (Figure 8.14 and Figure 4.27). Projections for 2081–2100under the SSP2-4.5scenariosuggest increased precipitation over the tropical oceans, north-eastern Africa, the Arabian Peninsula, India, south-eastern Asia and the Polar regions while decreased precipitation is projected mainly over the subtropical regions (Section 4.5.1.4). Precipitation changes contrast regionally in the tropics with wetter wet seasons over South Asia, central Sahel and eastern Africa, but less precipitation over Amazonia and coastal West Africa (Section 8.4.2.4). These large-scale responses are associated with stronger moisture transports in a warmer climate that are modulated by the greater warming over land than ocean, atmospheric circulation responses and land surface feedbacks (Section 8.2.2). There is agreement across CMIP5 and CMIP6 modelling studies that precipitation increases in wet parts of the atmospheric circulation and decreases in dry parts (Liu and Allan, 2013; Kumar et al., 2015; Deng et al., 2020; Schurer et al., 2020) although these regions shift with atmospheric circulation changes. The overall pattern is robust across different model scenarios and time horizons (Tebaldi and Knutti, 2018), but some deviations from the mean pattern cannot be excluded due to the multiple time scales and non-linear atmospheric or land surface processes involved (Section 8.5.3). Near-term regional changes in precipitation are more uncertain because of a stronger sensitivity to natural variability (Section 8.5.2) and non-GHG anthropogenic forcings (Section 4.4.1.3 and 8.4.3.1).
 Figure 8.14 | Projected long-term relative changes in seasonal mean precipitation. Global maps of projected relative changes (%) in seasonal mean of precipitation averaged across available CMIP6 models (number provided at the top right of each panel) in the SSP2-4.5 scenario. All changes are estimated for 2081–2100 relative to the 1995–2014 base period. Uncertainty is represented using the simple approach. No overlay indicates regions with high model agreement, where ≥80% of models agree on sign of change; diagonal lines indicate regions with low model agreement, where <80% of models agree on sign of change. For more information on the simple approach, please refer to the Cross-Chapter Box Atlas.1. Further details on data sources and processing are available in the chapter data table (Table 8.SM.1).
 Projected changes in regional precipitation also arise as a response to changes in large-scale atmospheric circulation (Section 8.2.2.2 and 8.4.2), both in the tropics (Chadwick et al. , 2016b; Byrne et al. , 2018) and extratropics (Shaw, 2019; Oudar et al., 2020b). Despite variability in simulated changes, CMIP5 climate models consistently project large rainfall changes (of varying sign) over considerable proportions of tropical land during the 21st century (Chadwick et al., 2016b). Since AR5, some robust responses in large-scale circulation patterns have been identified. For example, and as further assessed in Section 8.4.2, CMIP6 models project a northward shift in the tropical rain belt over eastern Africa and the Indian Ocean and a southward shift in the eastern Pacific and Atlantic oceans (Mamalakis et al., 2021). A projected strengthening and tightening of the tropical rain belt increases the contrasts between wet and dry tropical weather regimes and seasons. It is less clear how the well understood poleward expansion of the subtropics and mid-latitude storm tracks influences precipitation over subtropical and mid-latitude continents (Section 8.2.2.2).
An ensemble of 31 CMIP6 models under the SSP5-8.5 scenario projects increases precipitation by 10–30% over much of the USA and decreases by 10–40% over Central America and the Caribbean by 2080–2099 (Almazroui et al., 2021). This CMIP6 ensemble also projects an increase in annual precipitation over the southern Arabian Peninsula and a decrease over the northern Arabian Peninsula, as also projected by CMIP3 and CMIP5 models (Almazroui et al., 2020a). Annual mean precipitation is projected to increase over South Asia during the 21st century under all scenarios, although the rate of change varies within the region based on 27 CMIP6 models (Almazroui et al., 2020c). CMIP6 projections also display a reduction in annual mean precipitation over northern and southern Africa while increases are projected over Central Africa, under the SSP1-2.6, SSP2-4.5 and SSP5-8.5 scenarios (Almazroui et al., 2020b). The AR6 (Atlas assesses that regions where annual mean rainfall is likely to increase include the Ethiopian Highlands, East, South and North Asia, south-eastern South America, northern Europe, northern and eastern North America, and the Polar Regions. In contrast, regions where annual mean rainfall is likely to decrease include southern Africa, coastal West Africa, Amazonia, south-western Australia, Central America, south-western South America, and the Mediterranean.
The AR5 identified that high-latitude precipitation increase may lead to an increase in snowfall in the coldest regions and a decrease of snowfall in warmer regions due to a decreased number of freezing days. The fraction of precipitation falling as snow and the duration of snow cover was projected to decrease. Heavy snowfall events globally are not expected to decrease significantly with warming as they occur close to the water freezing point, which will migrate poleward and in altitude (O’Gorman, 2014; Turner et al., 2019). There are only a small number of studies evaluating the implications of this mechanism in specific regions. A study for the north-eastern USA indicates smaller reductions for major snowfall events against the broader decline in snowfall expected from thermodynamic effects (Bintanja and Andry, 2017). Arctic snowfall is projected to decrease as rainfall makes up more of the precipitation (Zarzycki, 2018).
Beyond annual or seasonal mean precipitation amounts, an implication of the parallel intensification of the global water cycle and of the increased residence time of atmospheric water vapour (Section 8.2.1) is that the distribution of daily and sub-daily precipitation intensities will experience significant changes (Pendergrass and Hartmann, 2014b; Pendergrass et al., 2015; Bador et al., 2018; Douville and John, 2021), with fewer but potentially stronger events (high confidence) (Section 4.3.3). CMIP6 projections show that in the long-term more drier days but more intense single events of precipitation are expected, regardless of scenario (Figure 8.15). Over almost all land regions, it is very likely that extreme precipitation will intensify at a rate close to the 7% °C–1 of global warming, but with large spatial differences (Sections 11.4 and 8.2.3.2). The projected increase in precipitable water is expected to lead to an increase in the highest possible precipitation intensities and an increase in the probability of occurrence of extreme precipitation events on the global scale (Neelin et al., 2017), regardless of how annual-mean precipitation changes (O’Gorman and Schneider, 2009; O’Gorman, 2015). The projected increase in heavy precipitation intensity is also found for daily mean precipitation intensity though at a lower rate (Pendergrass and Hartmann, 2014a).
 Figure 8.15 | Projected long-term relative changes in daily precipitation statistics. Global maps of projected seasonal mean relative changes (%) in the number of dry days (i.e., days with less than 1 mm of rain) and daily precipitation intensity (in mm day–1, estimated as the mean daily precipitation amount at wet days – for example, days with intensity above 1 mm day–1) averaged across available CMIP6 models (number provided at the top right of each panel) in the SSP1-2.6 (a, b), SSP2-4.5 (c, d) and SSP5-8.5 (e, f) scenario respectively. Uncertainty is represented using the simple approach. No overlay indicates regions with high model agreement, where ≥80% of models agree on sign of change; diagonal lines indicate regions with low model agreement, where <80% of models agree on sign of change. For more information on the simple approach, please refer to the Cross-Chapter Box Atlas.1. Further details on data sources and processing are available in the chapter data table (Table 8.SM.1).
 An increase in the number of dry days is also projected in several regions of the world (Polade et al., 2014; Berthou et al., 2019a), which can dominate the annual precipitation change at least in the subtropics (Polade et al., 2014; Douville and John, 2021). These findings are supported by CMIP6 projections showing a widespread increase in daily mean precipitation intensity over land (Figure 8.15b,d,f) as well as an increase in the number of dry days in the subtropics and over Amazonia and Central America (Figure 8.15a,b,c). Such changes in precipitation regimes, as well as the general increase in the frequency and intensity of precipitation extremes (Section 11.4.5), contribute to an overall increase in precipitation variability (Polade et al., 2014; Pendergrass et al., 2017; Douville and John, 2021). This is also found in CMIP6 models, which show a stronger increase of interannual variability than in seasonal mean precipitation changes, apart from in the winter extratropics where both quantities increase at the same rate with increasing global warming levels (Figure 8.16).
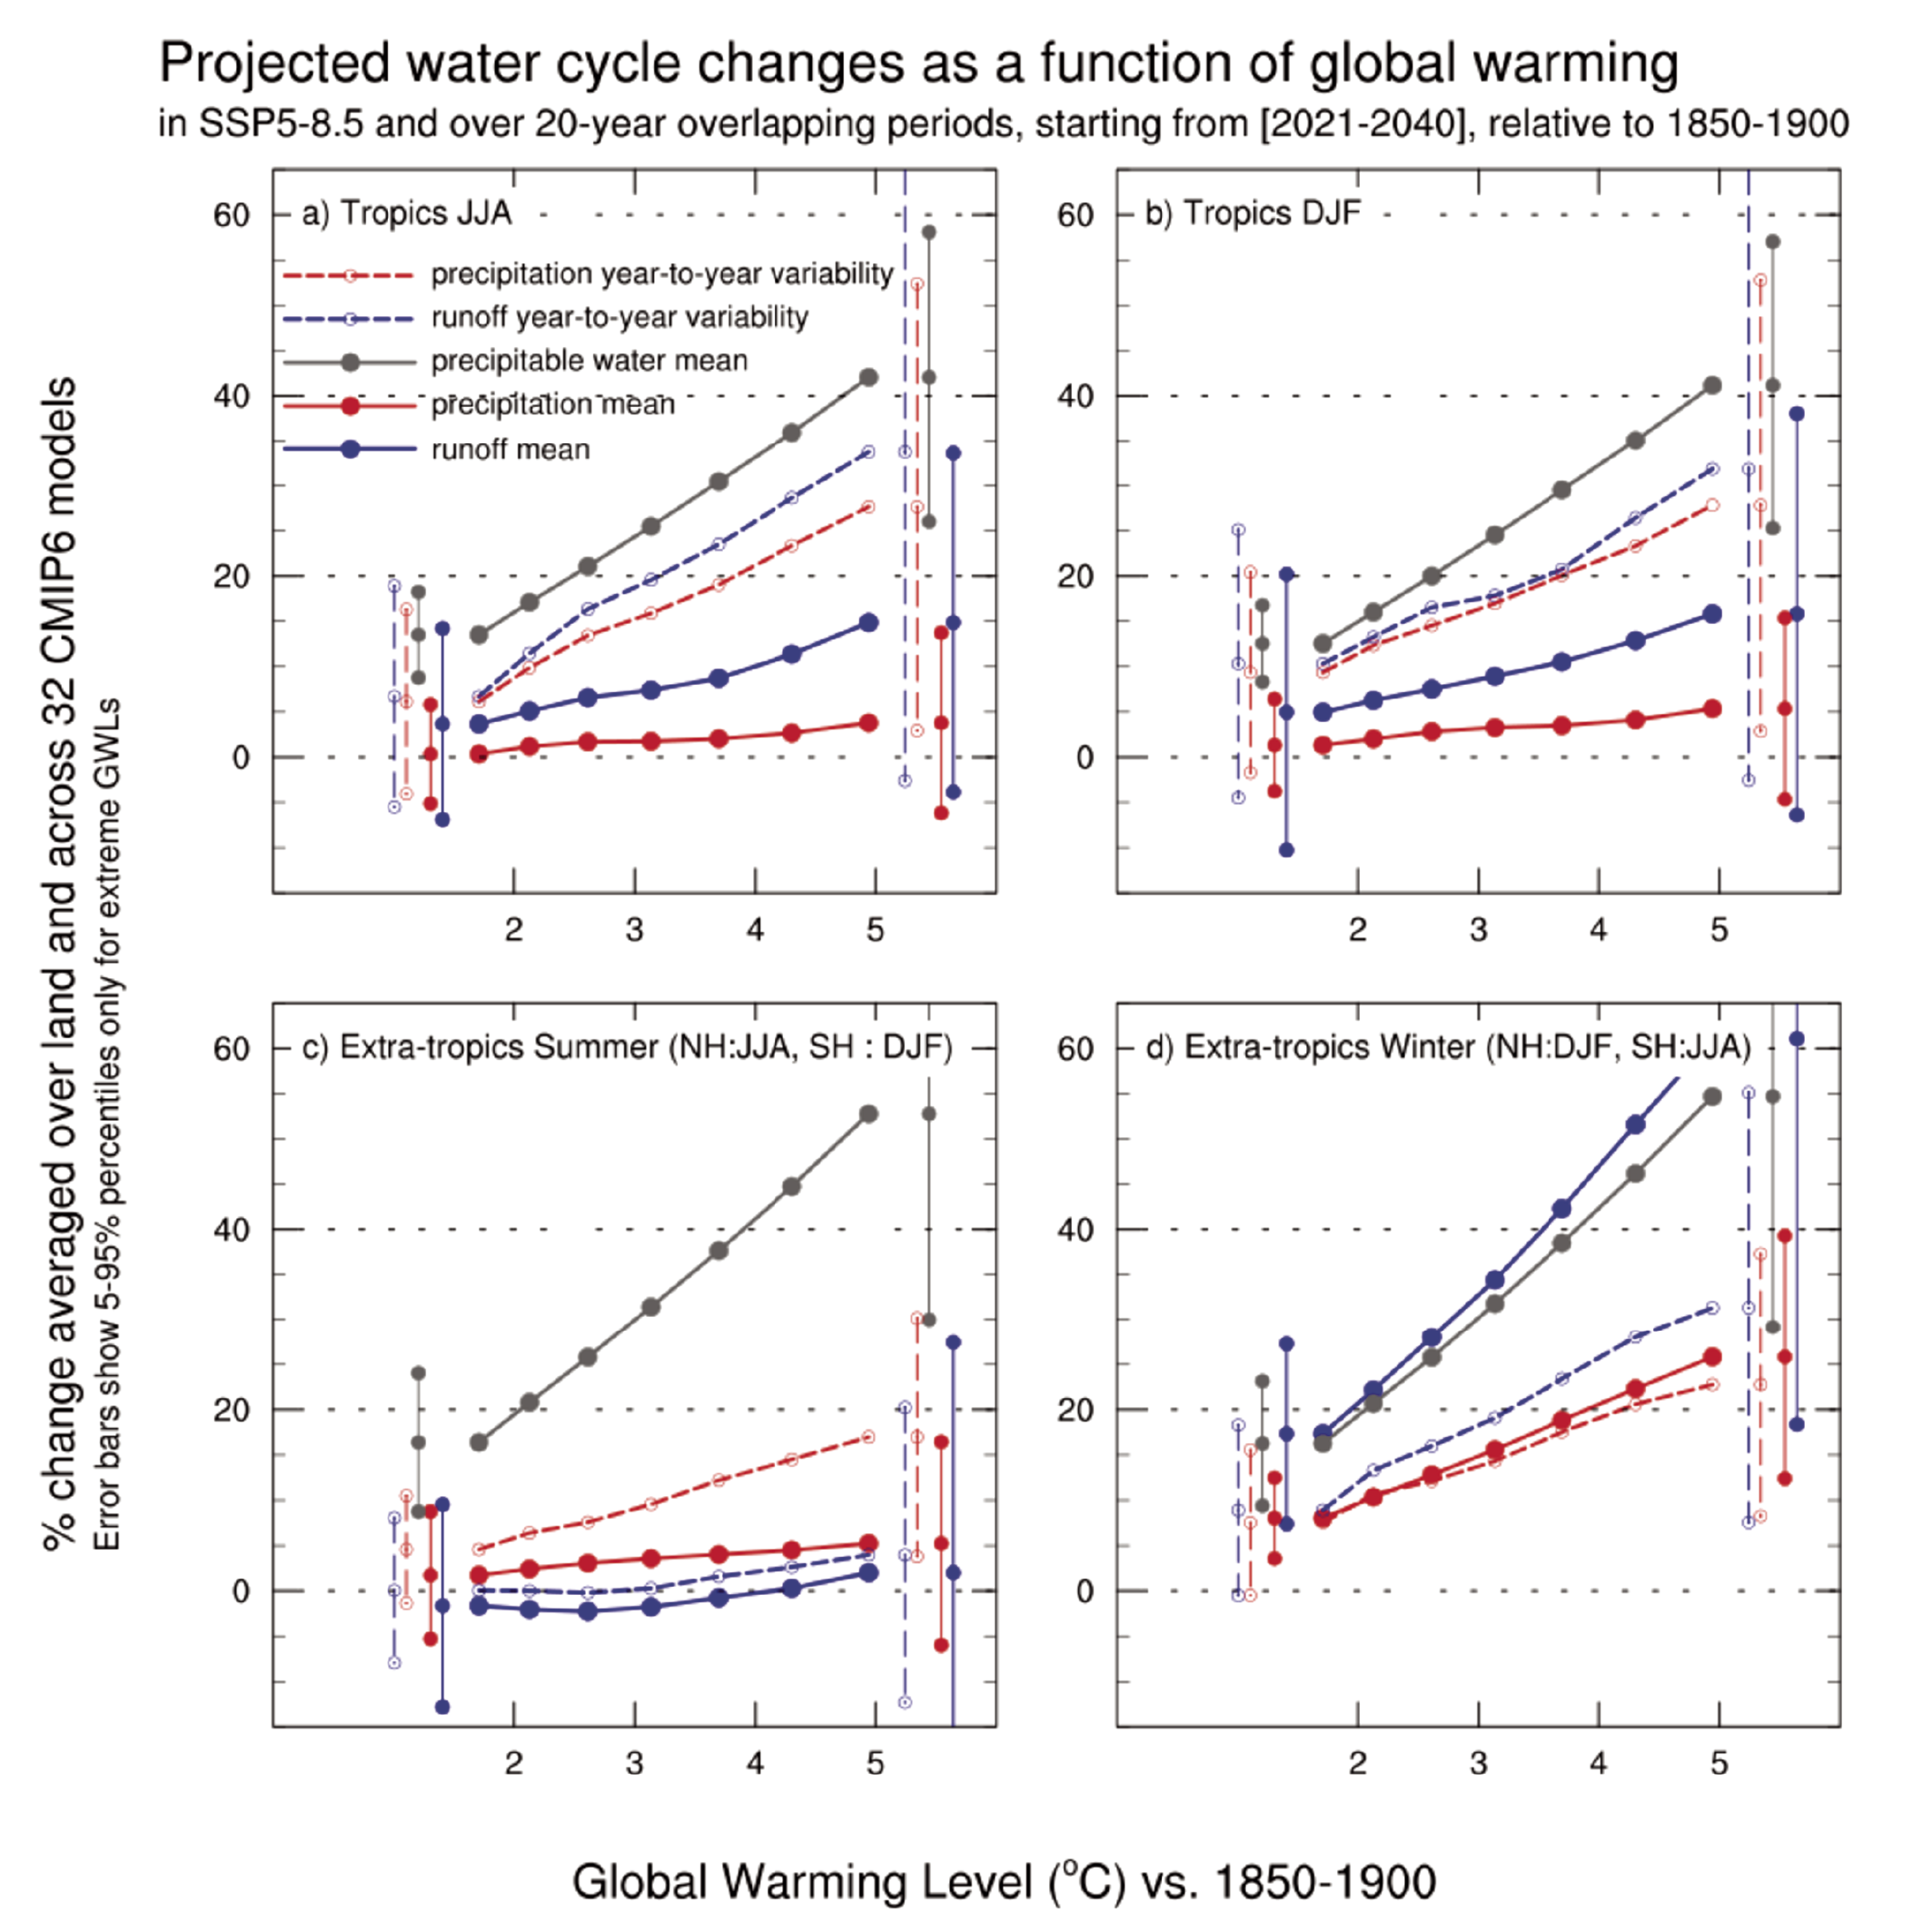 Figure 8.16 | Rate of change in components of water cycle mean and variability across increasing global warming levels. Relative change (%) in seasonal mean total precipitable water (grey line), precipitation (red solid lines), runoff (blue solid lines), as well as in standard deviation of precipitation (red dashed lines) and runoff (blue dashed lines) averaged over extratropical land in (c) summer and (d) winter, and tropical land in (a) June–July–August (JJA) and (b) December–January–February (DJF) as a function of global mean surface temperature for the CMIP6 multi-model mean across the SSP5-8.5 scenario. Extratropical winter refers to DJF for Northern Hemisphere and JJA for Southern Hemisphere (and the reverse for extratropical summer). Each marker indicates a 21-year period centred on consecutive decades between 2015 and 2085 relative to the 1995–2014 base period. Precipitation and runoff variability are estimated by their standard deviation after removing linear trends from each time series. Error bars show the 5–95% confidence interval for the warmest 5°C global warming level. Figure adapted from Pendergrass et al. (2017) and updated with CMIP6 models. Further details on data sources and processing are available in the chapter data table (Table 8.SM.1).
 In summary, it is virtually certain that global precipitation will increase with warming due to increases in GHG concentrations and decreases in air pollution. There is high confidence that total precipitation will increase in the high latitudes, with a shift from snowfall to rainfall except in the coldest regions and seasons. There is also high confidence that precipitation will decrease over the Mediterranean, southern Africa, Amazonia, Central America, south-western South America, south-western Australia and coastal West Africa and that monsoon precipitation will increase over South Asia, East Asia and central-eastern Sahel. See (Section 8.4.2.4 for a more detailed assessment of changes in regional monsoons. Daily mean precipitation intensities, including extremes, are projected to increase over most regions (high confidence). The number of dry days is projected to increase over the subtropics, Amazonia, and Central America (medium confidence). There is high confidence in an overall increase in precipitation variability over most land areas.
Box 8.2 | Changes in Water Cycle Seasonality
Observed changes
The AR5 did not highlight observed changes in water cycle seasonality and SRCCL mostly emphasized changes in vegetation seasonality. Since AR5, a number of relevant studies have been published, but often with conflicting results. Based on three in situdatasets, reduced precipitation seasonality was identified over 62% of the terrestrial ecosystems analysed from 1950–2009 (Murray-Tortarolo et al. 2017). In contrast, both in situ and satellite data show a general increase in the annual range of precipitation from 1979 to 2010, which is dominated by wetter wet seasons (Chou et al., 2013). This paradox may be partly explained by a larger aerosol radiative forcing in the middle of the 20th century as well as by internal variability (Kumar et al., 2015; see also Box 8.1). For instance, the ‘long rains’ over East Africa experienced declining trends in the 1980s and 1990s (Nicholson, 2017), which was linked to anthropogenic aerosols and SST patterns (Rowell et al., 2015), followed by a recent recovery that was linked to internal variability (Wainwright et al., 2019). Two satellite datasets revealed decreased rainfall seasonality in the tropics but an increased seasonality in the subtropics and mid-latitudes since 1979, without clear attribution (Marvel et al., 2017).
Large differences have been found across seven global precipitation datasets, with no region showing a consistent, statistically significant, positive or negative trend over the last three decades (X. Tan et al., 2020). Regional studies suggest that observed changes in precipitation seasonality are neither uniform nor stable across the 20th century (X. Li et al. , 2016; Mallakpour and Villarini, 2017; Sahany et al. , 2018; Deng et al. , 2019). Since the 1980s, there is growing evidence that contrasts between wet and dry regimes, including seasonality, have increased (Liu and Allan, 2013; Polson et al. , 2013; Murray-Tortarolo et al. , 2016; Tapiador et al. , 2016; Gallego et al. , 2017; Polson and Hegerl, 2017; Barkhordarian et al. , 2018; Lan et al. , 2019; Liang et al. , 2020; Schurer et al., 2020).
Additional changes in seasonality may manifest in the timing and duration of wet seasons. A later monsoon onset trend was reported throughout India from 1901 to 2013 (Sahany et al., 2018). Conversely, an earlier rainfall onset was implicated in increased springtime rainfall over the Tibetan Plateau in recent decades (W. Zhang et al., 2017a). Winter and early spring precipitation over the north-western Himalaya for the period 1951–2007 shows an increasing trend of daily precipitation extremes in association with enhanced amplitude variations of extratropical synoptic-scale systems known as ‘Western Disturbances’ (Madhura et al. , 2014; Cannon et al. , 2015; Krishnan et al. , 2019). In China, an earlier onset was observed during 1961-2012 (Deng et al., 2019). In the African Sahel, rainfall has been most concentrated in the peak of the rainy season since the end of the 20th century (Biasutti, 2019). A shift in the seasonality of Sahelian rainfall, including delayed cessation has also been reported (Section 10.4.2.1; Nicholson, 2013; Dunning et al., 2018). Over southern Africa, an observed earlier onset (1985–2007) is in contrast to a simulated historical and projected future delay in the wet season (Maidment et al., 2015; Dunning et al., 2018). An increasingly early onset of the North American monsoon has been observed from 1978 to 2009 (Arias et al. , 2015). Seasonality changes in the South American monsoon indicate delayed onsets since 1978 (Fu et al. , 2013; Yin et al. , 2014; Arias et al. , 2015; Debortoli et al. , 2015; Arvor et al. , 2017; Giráldez et al. , 2020; Haghtalab et al. , 2020; Correa et al., 2021).
In northern high latitudes, a shorter snow season (X. Zeng et al., 2018) is mainly due to an earlier onset of spring snowmelt (Peng et al., 2013) which has been attributed to anthropogenic climate change (Najafi et al., 2016). Changes in snow seasonality affect streamflow at the regional scale, with an earlier peak in spring and a possible decrease of low-level flow in summer (Berghuijs et al., 2014; Kang et al., 2016; Dudley et al., 2017), while glacier shrinking can also alter the low-level flow in mountain catchments (Lutz et al., 2014; Milner et al., 2017; Huss and Hock, 2018). This can be partly ameliorated by water management in regulated catchments (Arheimer et al., 2017), but not in large river basins such as the Amazon which also shows an increased seasonality of discharge since 1979 (Liang et al., 2020).
Increasing aridity contrasts between wet and dry seasons over the late 20th century have been suggested (Kumar et al., 2015), with a human-induced decrease of water availability during the dry season over Europe, western North America, northern Asia, southern South America, Australia and eastern Africa (Padrón et al., 2020). Seasonal contrasts in microwave surface soil moisture measurements have also increased over 1979–2016 (Pan et al., 2019). Terrestrial water storage variations derived from gravimetric measurements since 2003 show a strong seasonality which is underestimated by global hydrological models (Scanlon et al., 2019) and whose multi-decadal trends are difficult to interpret given the direct effect of enhanced water use (Rodell et al., 2018; Scanlon et al., 2018).
In summary, there is medium confidence that the annual range of precipitation has increased since the 1980s, at least in subtropical regions and over the Amazon. There is low confidence that this increase is due to human influence and that GHG forcing has already altered the timing or duration of wet seasons . There is high confidence that the human-induced retreat of the springtime snow cover and melting of glaciers have already contributed to changes in streamflow seasonality in high-latitude and low-elevation mountain catchments, and medium confidence that human activities have also contributed to an increased seasonality of water availability, including a drier dry season, in the extratropics.
Project ed changes
The AR5 reported with high confidence that the contrast between wet and dry seasons will generally increase with global warming and that monsoon onset dates will likely become earlier or show little change, while monsoon retreat dates will likely be delayed, resulting in a lengthening of the wet season in many regions.
Since AR5, several studies have further documented a projected increase in rainfall seasonality and the understanding of the underlying mechanisms has been improved (Sections 8.2.1 and 8.3.2). CMIP5 models show that the seasonal concentration of annual precipitation will increase over many regions by the end of the 21st century, with robust model agreement in most subtropical regions where an increase in the mean number of dry days was also reported in the RCP8.5 scenario (Pascale et al., 2016). The semi-arid, winter rainfall dominated subtropical climate is projected to shift poleward and eastward, with the equatorward margins replaced by a more arid climate type. However, evolving SST patterns and land –ocean warming contrasts cause more complex responses (Alessandri et al. , 2015; Polade et al. , 2017; Brogli et al. , 2019; Zappa et al. , 2020). Projections over California show a stronger and shorter wet season (Polade et al., 2017; Dong et al., 2019). Decreases in future winter and spring rainfall are projected over south-western Australia (Hope et al., 2015). Central Asia is projected to experience wetter winters, associated with an increase in snow depth in the north-eastern regions (Y. Li et al., 2019). Even in a +2°C climate, both extreme precipitation and dryness will increase significantly in the extratropics, amplifying the seasonal precipitation range (Fujita et al., 2019). A single-model study shows that the annual range of precipitation increases globally by 2.6% per 1°C of global warming in stabilized low-warming scenarios (Z. Chen et al., 2020a).
In the tropics, an amplified annual cycle (by about 3–5% °C–1) of global land monsoon hydroclimates (precipitation, precipitation minus evaporation (P–E), and runoff) is projected by CMIP5 models under the RCP8.5 scenario, mostly due to a more intense wet season (W. Zhang et al., 2019b). A longer rainy season is projected by CMIP6 models over most regional monsoon areas except in the Americas (Moon and Ha, 2020). A delayed onset and cessation of the wet season over West Africa and the Sahel (Dunning et al., 2018) and a slightly delayed onset of South Asian monsoon rainfall (Hasson et al., 2016) are projected by CMIP5 models. CMIP5 projections suggest a strengthening of the annual cycle and a lengthening of the dry season in Southern Amazonia (Fu et al. , 2013; Reboita et al. , 2014; Boisier et al. , 2015; Pascale et al. , 2016; Sena and Magnusdottir, 2020). This is further verified by the projections from six CMIP6 models (Moon and Ha, 2020). A wet season shorter by 5–10 days by the end to the 21st century is projected for southern Africa (Dunning et al., 2018).
An increase in streamflow seasonality is projected over several large rivers in the low-mitigation RCP8.5 scenario, but with only small changes in the seasonality timing, except in northern high latitudes due to the earlier but potentially slower snowmelt in a warmer world (Eisner et al., 2017; Musselman et al., 2017). At the end of the century in a high-emissions scenario, peak snowmelt timing is projected to occur one month earlier and peak water volume is 79% lower in the eastern USA (Rhoades et al., 2018). Earlier snowmelt is projected, for example, by 30 days at the end of the 21st century in RCP4.5 for the Sierra Nevada in the western USA (F. Sun et al., 2018). Sub-seasonal changes in water availability were found in many regions in the RCP8.5 scenario. However, these should be considered with caution given the magnitude of model errors (C.R. Ferguson et al., 2018). Increases in the seasonality of water availability has been found to be more pronounced in areas with high atmospheric evaporative demand, giving rise to a pattern of seasonally variable regimes becoming even more variable (Konapala et al., 2020). RCP4.5 and RCP8.5 projections show a pronounced soil drying in summer and autumn over western Europe, and a springtime drying over northern Europe due to an earlier snowmelt (Ruosteenoja et al., 2018).
A simple relative seasonality metric (Walsh and Lawler, 1981) applied to global projections based on CMIP6 models and SSP scenarios supports previous CMIP5 findings, especially the amplified seasonality of precipitation around the Mediterranean, and across southern Africa, California, southern Australia and the Amazon (Box 8.2, Figure 1). While such changes are not significant in the low-emissions SSP1-2.6 scenario, they are consistent with the increased frequency of dry days projected over the same regions (Figure 8.16). In monsoon regions outside the Americas, rainfall seasonality does not show a significant increase even in high-emissions scenarios. This challenges previous CMIP5 findings based on the difference between maximum and minimum monthly precipitation in a year (W. Zhang et al., 2019b) and higher sensitivity to the projected increase in precipitation extremes (Section 11.4.5). In the northern high latitudes, milder winters are associated with wetter conditions and a decrease in precipitation seasonality.

Box 8.2, Figure 1 | Projected long-term changes in precipitation seasonality. Global maps of projected changes in precipitation seasonality (simply defined as the sum of the absolute deviations of mean monthly rainfalls from the overall monthly mean, divided by the mean annual rainfall as in Walsh and Lawler, 1981) averaged across available CMIP6 models (number provided at the top right of each panel) in the SSP1-2.6 (b), SSP2-4.5 (c) and SSP5-8.5 (d) scenario respectively. The simulated 1995–2014 climatology is shown in panel (a). All changes are estimated in 2081–2100 relative to 1995–2014. Uncertainty is represented using the simple approach. No overlay indicates regions with high model agreement, where ≥80% of models agree on sign of change. Diagonal lines indicate regions with low model agreement, where <80% of models agree on sign of change. For more information on the simple approach, please refer to the Cross-Chapter Box Atlas.1. Further details on data sources and processing are available in the chapter data table (Table 8.SM.1).
In summary, the annual range of precipitation, water availability and streamflow will increase with global warming over subtropical regions and the Amazon (medium confidence), especially around the Mediterranean and across southern Africa (high confidence). The contrast between the wettest and driest month of the year is likely to increase by 3–5% °C–1 with global warming in most monsoon regions, in terms of precipitation, water availability (P–E) and runoff (medium confidence). There is medium confidence that the monsoon season could be delayed in a warmer climate in the Sahel. There is high confidence of earlier snowmelt.
8.4.1.4 Evapotranspiration
Since AR5, there is a growing body of evidence suggesting that future projections in evapotranspiration are driven by changes in temperature and relative humidity (Laîné et al. , 2014; Pan et al. , 2015; Ukkola et al. , 2016a), as well as precipitation patterns, as found in AR5.
Analysis of CMIP5 models suggests that atmospheric evaporative demand will increase over most areas of the world in high-emissions scenarios (virtually certain), mostly as a consequence of an increase in vapour pressure deficit (Scheff and Frierson, 2014, 2015; Greve and Seneviratne, 2015; Vicente-Serrano et al., 2020). CMIP5 models also project an increase in evapotranspiration over most land areas (medium confidence) (Laîné et al., 2014). However, regional changes in evapotranspiration can also be influenced by changes in soil moisture and vegetation, which modulate the moisture flux from the land to the atmosphere. Several studies of CMIP5 projections suggest that increases in plant water use efficiency will limit or counteract rising evapotranspiration (Milly and Dunne, 2016; Swann et al. , 2016; Lemordant et al. , 2018; Y. Yang et al. , 2018). However, other studies have found that transpiration increases due to the impact of climate change on growing season length, leaf area, and evaporative demand (Section 8.2.3.3; Frank et al. , 2015; Mankin et al. , 2017, 2018, 2019; Guerrieri et al. , 2019; S. Zhou et al. , 2019; Vicente-Serrano et al. , 2020). The parametrizations accounting for these complex physiological processes in global climate models may also be insufficient (Franks et al., 2017; Peters et al., 2018; Peano et al., 2019). Thus, there is currentlylow confidence in the role of vegetation physiology in modulating future projections of evapotranspiration.
CMIP6 models project a geographical pattern of changes in evapotranspiration similar to previous generation models (Figure 8.17), although the magnitude is generally larger than found for CMIP5 projections (X. Liu et al., 2020). There is, however, a strong seasonality in many regions, with a larger relative increase in the winter season of the Northern Hemisphere (NH) and smaller relative changes in the summer (Figure 8.17). Evapotranspiration increases in most land regions, except in areas that are projected to become moisture-limited (due to reduced precipitation and increased evaporative demand), such as the Mediterranean, South Africa, and the Amazonian basin (medium confidence). The patterns of change increase in magnitude from low to high-emissions SSP scenarios (medium confidence).
 Figure 8.17 | Projected long-term relative changes in seasonal mean evapotranspiration. Global maps of projected relative changes (%) in seasonal mean of surface evapotranspiration for December–January–February (DJF; left panels) and June–July–August (JJA; right panels) averaged across available CMIP6 models (number provided at the top right of each panel) for SSP1.2-6 (a, b) SSP2-4.5 (c, d) and SSP5-8.5 (e, f) scenario respectively. All changes are estimated in 2081–2100 relative to 1995–2014. Uncertainty is represented using the simple approach. No overlay indicates regions with high model agreement, where ≥80% of models agree on sign of change; diagonal lines indicate regions with low model agreement, where <80% of models agree on sign of change. For more information on the simple approach, please refer to the Cross-Chapter Box Atlas.1. Further details on data sources and processing are available in the chapter data table (Table 8.SM.1).
 In summary, future projections indicate that anthropogenic forcings will drive an increase in global mean evaporation over most oceanic areas (high confidence) (Figure 8.17), an increase in global atmospheric demand (virtually certain) and an increase in evapotranspiration over most land areas, with the exception of moisture-limited regions (medium confidence). However, substantial uncertainties in projections of evapotranspiration, especially at seasonal and regional scales, remain (see also Section 8.2.3.3 and Cross-Chapter Box 5.1).
8.4.1.5 Runoff, Streamflow and Flooding
The AR5 assessed that projected changes in runoff had low confidence over the period 2016–2035; however, under the RCP8.5 scenario, runoff increases by 2100 are likely in high northern latitudes. This is consistent with projected regional precipitation increases, based on consistency of changes across different generations of models and different forcing scenarios, and with runoff decreases being likely in southern Europe, the Middle East and southern Africa. There was considerable uncertainty in the magnitude and direction of change for some regions, largely driven by the uncertainty in projected precipitation changes, particularly across south Asia. For flooding, AR5 assessed with medium confidence that flooding would increase over parts of South and South East Asia, tropical Africa, north-east Eurasia, and South America, and decrease for parts of Northern and Eastern Europe, Anatolia, Central Asia, Central North America, and southern South America. The SR1.5 assessed with medium confidence that warming of 2°C would increase the fraction of global area affected by flood hazard relative to warming of 1.5°C. Projected climate-driven changes to runoff, streamflow, and flooding will occur in the context of potential human-caused land-use and land-cover changes, which can have a large influence on surface water (Sterling et al., 2013) but which have considerable uncertainty in projections (Prestele et al., 2016).
Since AR5, studies confirm that global mean annual runoff increases with global surface temperature increase (X. Zhang et al. , 2014, 2018; Lehner et al. , 2019), but varies regionally (Chen et al. , 2017; H. Yang et al. , 2017; Cook et al. , 2020). CMIP5 models display a large spread in the ratio of runoff to precipitation for the present-day climate, which applies also to future runoff changes under global warming (Lehner et al., 2019). In studies of CMIP6 projections, runoff increases in most parts of the northern high latitudes and Asia and north and eastern Africa, and decreases in the Mediterranean region, southern Africa, southern Australia and in parts of western Africa, as well as in Central and South America (Greve et al., 2018; Cook et al., 2020). Projected changes in runoff also vary seasonally. In the Northern Hemisphere (NH), runoff increases during winter since more precipitation falls as rain than snow and decreases in the summer as less snow is available to contribute to runoff during the warm season (Cook et al., 2020). Global maps of projected changes for December–January–February and June–July–August are shown in Figure 8.18, showing projected changes becoming larger and more consistent in the higher emissions scenarios. Runoff projections for CMIP6 are also shown in Figure 8.16 for tropical and extratropical averages at a range of global mean warming levels and in Table 8.1 for global land in different future scenarios. In the tropics, both the mean and interannual variability of runoff increase with warming. The increase in variability is roughly twice as large as the increase in the mean, and has a large spread across models. In the extratropics, changes are small in the summer but there are large increases in the winter, with the mean increasing much more than the variability, in contrast to the tropics.
 Figure 8.18 | Projected long-term relative changes in seasonal mean runoff. Global maps of projected relative change (%) in runoff seasonal mean for December–January–February (DJF; left panels) and June–July–August (JJA; right panels) averaged across available CMIP6 models (number provided at the top right of each panel) SSP1.2-6 (a, b), SSP2-4.5 (c, d) and SSP5-8.5 (e, f) scenario respectively. All changes are estimated in 2081–2100 relative to 1995–2014. Uncertainty is represented using the simple approach. No overlay indicates regions with high model agreement, where ≥80% of models agree on sign of change, diagonal lines indicate regions with low model agreement, where <80% of models agree on sign of change. For more information on the simple approach, please refer to the Cross-Chapter Box Atlas.1. Further details on data sources and processing are available in the chapter data table (Table 8.SM.1).
 Changes in streamflow vary regionally and increase in magnitude with emissions scenarios, as with runoff (although the two are not equivalent, as runoff includes both surface runoff and streamflow). Streamflow projections additionally require the use of hydrologic models forced by the output from climate models and have not been as widely explored as they are not variables directly included in climate models. On an annual basis, streamflows have been projected to increase in the northern high latitudes and tropical Asia and Africa, and to decrease in the Mediterranean, tropical South America, and South Africa (Döll et al., 2018). For a 4°C global warming, half of the global land area is projected to be exposed to increased high flows (average increase 25%), while about 60% may be exposed to decreased low flows (average decrease 50%) (Asadieh and Krakauer, 2017).
Changes in the seasonality of runoff and streamflow are assessed in Box 8.2. The seasonality of runoff and streamflow (calculated as the annual difference between the wettest and driest months of the year), is expected to increase with global warming in the subtropics, especially in the Mediterranean and southern Africa with high confidence, and in the Amazon with medium confidence. For regions where snowmelt is an important contributor to streamflow, there is high confidence that snowmelt occurring earlier in the year will result in peak flows also occurring earlier in the year, and medium confidence that reduced snow volume and the weaker solar radiation earlier in the year will reduce the most intense flows (see Section 8.2.3.1). In roughly half of 56 large-scale glacierized drainage basins, projected runoff changes show an increase until a maximum is reached, beyond which runoff steadily declines because of limited ice volumes (Huss and Hock, 2018).
As future changes in flood events are assessed in Chapters 9, 11 and 12, only a summary is presented here. There are a number of complicating factors for projecting both pluvial (overland) and fluvial (river) flooding that limit confidence in their assessment. In addition to precipitation, flooding also depends on basin and river characteristics such as permeability, antecedent soil moisture, and antecedent flow levels for river flooding, so projections of extreme precipitation and flooding are not always closely linked (Section 8.2.3.2). Possible changes in water resources management and land use add another layer of complexity to future changes. There is medium confidence in a general increase in pluvial and fluvial flooding, although there are large regional variations, discussed further in Sections 11.5.5, and 12.4. There is medium confidence in a substantial increase in the frequency of extreme sea level events for coastal regions (Section 9.6.4.2) and the associated coastal flooding is regionally assessed in Section 12.4. The risk of glacier lake outburst floods (GLOFs) is expected to increase with glacier melting in some high mountain regions (Section 12.4).
In summary, there is medium confidence that global runoff will increase with global warming, but with large regional and seasonal variations. There is high confidence that runoff will increase in the northern high latitudes and decrease in the Mediterranean region and southern Africa. There is medium confidence that runoff will increase in regions of central and eastern Africa, and decrease in Central America and parts of southern South America, with the magnitude of the change increasing with emissions. There is medium confidence that the seasonality of runoff and streamflow will increase with global warming in the subtropics. In snow-dominated regions, there is high confidence that peak flows associated with spring snowmelt will occur earlier in the year and medium confidence that snowmelt-induced runoff will decrease with reduced snow, except in glacier-fed basins where runoff may increase in the near term. There is medium confidence that flooding in general will increase, although with considerable variation based on geographic region and flood type. These projected climate-related changes will occur in the context of human-caused land-use and land-cover changes, which may also have a large influence.
8.4.1.6 Aridity and Drought
The AR5 concluded that regional to global-scale projections of aridity and drought remained relatively uncertain compared to other aspects of the water cycle. It reported that there is a likely increase in drought occurrence (medium confidence) by 2100 in regions that are currently drought-prone under the RCP8.5 scenario due to projected decreases in soil moisture. It stated that it is likely that the most prominent projected decreases in soil moisture would occur in the Mediterranean, south-western USA, and southern Africa, consistent with projected changes in the Hadley circulation and increased surface temperatures. These AR5 conclusions are generally supported by more recent analyses of CMIP5 models (Feng and Fu, 2013; Berg et al., 2017; Cook et al., 2018).
Results from the latest generation of models in CMIP6 are largely congruent with CMIP5. Consistent with the coherent nature of warming in future projections, increases in vapour pressure deficit and evaporative demand are widespread and consistent across regions, seasons, and models, increasing in magnitude in accordance with the emissions scenario (high confidence) (Figure 8.19; Scheff and Frierson, 2014, 2015; Vicente-Serrano et al., 2020). Even under a low-emissions scenario (SSP1-2.6), projections of soil moisture show significant decreases in the Mediterranean, southern Africa, and the Amazonian basin (high confidence) (Figure 8.19). Under mid- and high-emissions scenarios (SSP2-4.5 and SSP5-8.5), coherent declines emerge across Europe, westernmost North Africa, south-western Australia, Central America, south-western North America, and south-western South America (high confidence) (Figure 8.19; Cook et al., 2020). Compared to CMIP5 results, CMIP6 models exhibit more consistent drying in the Amazonian basin (Parsons, 2020), more extensive declines in total soil moisture in Siberia (Cook et al., 2020), and stronger declines in westernmost North Africa and south-western Australia (Figure 8.19).
 Figure 8.19 | Projected long-term relative changes in annual mean soil moisture and vapour pressure deficit. Global maps of projected relative changes (%) in annual mean vapor pressure deficit (left), surface soil moisture (top 10cm, middle) and total column soil moisture (right) from available CMIP6 models (number provided at the top right of each panel) for the SSP1.2-6 (a, b, c), SSP2-4.5 (d, e, f) and SSP5-8.5 (g, h, i) scenarios respectively. All changes are estimated for 2081–2100 relative to a 1995–2014 base period. Uncertainty is represented using the simple approach. No overlay indicates regions with high model agreement (‘Robust change’), where ≥80% of models agree on sign of change, diagonal lines indicate regions with low model agreement, where <80% of models agree on sign of change. For more information on the simple approach, please refer to the Cross-Chapter Box Atlas.1. Further details on data sources and processing are available in the chapter data table (Table 8.SM.1).
 Soil moisture in the top soil layer (10 cm) shows more widespread drying than total soil moisture, reflecting a greater sensitivity of the upper soil layer to increasing evaporative demand (Figure 8.19; Berg et al., 2017). Conversely, total column soil moisture represents the carry-over of moisture from previous seasons deeper in the soil column, and potentially higher sensitivity to vegetation processes (Berg et al., 2017; Kumar et al., 2019). Central America, the Amazonian basin, the Mediterranean region, southern Africa, and south-western Australia are projected to experience significant declines in total soil moisture, whereas declines in Europe (north of the Mediterranean), western Siberia, and north-eastern North America are limited to the surface (Figure 8.19). It should be noted that because models differ in their number of hydrologically active layers, there is less confidence in total soil moisture projections than surface soil moisture projections. Based on surface soil moisture projections, more than 40% of global land areas (excluding Antarctica and Greenland) are expected to experience robust year-round drying, even under lower emissions scenarios (Cook et al., 2020). The percentage of land area experiencing drying is slightly lower when runoff is used as an aridity metric instead (20–30%); taking this into consideration, it is estimated that about a third of global land areas will experience at least moderate drying in response to anthropogenic emissions, even under SSP1-2.6 (medium confidence) (Cook et al., 2020).
Although there are regions where multiple models predict consistent and significant changes in soil moisture, as with evapotranspiration (Section 8.4.1.4), there is still uncertainty in these projections related to the response of plants to elevated CO2. Most models project increases in two variables that have opposite effects on surface water availability: plant water use efficiency (WUE) and leaf area index (LAI; see Section 8.4.1.4). As discussed in Sections 8.2.3.3, 8.3.1.4 and 8.4.1.4, there is low confidence in how these changes in plant physiology will affect future projections of evapotranspiration, and likewise, drought and aridity.
Changes in meteorological (precipitation-based) drought duration and intensity in CMIP6 models are more robust than projected changes in mean precipitation, more than found in CMIP5 projections (Ukkola et al., 2020). Significant increases in drought duration are expected in Central America, the Amazonian basin, south-western South America, the Mediterranean, westernmost North Africa, southern Africa, and south-western Australia, on the order of 0.5 to 1 month for a moderate emissions scenario (SSP2-4.5) and two months for a high-emissions scenario (SSP5-8.5; Ukkola et al., 2020). Drought intensity is projected to increase in the tropics, mainly in the Amazonian basin, Central Africa, and southern Asia, as well as in Central America and south-western South America (Ukkola et al., 2020). The CORDEX South Asia multi-model ensemble projections indicate an increase in the frequency and severity of droughts over central and northern India during the 21st century, under the RCP4.5 and RCP8.5 scenarios (medium confidence) (Mujumdar et al., 2020). Under intermediate or high-emissions scenarios, the likelihood of extreme droughts (events that have magnitudes equal to or less than the 10th percentile of the 1851–1880 baseline period) increases by 200–300% in the Amazonian basin, south-western North America, Central America, the Mediterranean, southern Africa, and south-western South America (Cook et al., 2020). Even under a low-emissions scenario (SSP1-2.6), the likelihood of extreme droughts increases by 100% in south-western North America, south-western South America, the Amazon, the Mediterranean, and southern Africa (Cook et al., 2020). Thus, there is high confidence that drought severity and intensity will increase in the Mediterranean, southern Africa, south-western South America, south-western North America, south-western Australia, Central America and the Amazonian basin.
Paleoclimate records provide context for these future expected changes in drought and aridity. In the Mediterranean, western North America, and Central Chile, there is high confidence that climate change will shift soil moisture (as represented by the Palmer Drought Severity Index) outside the range of observed and reconstructed values spanning the last millennium (Figure 8.20; Cook et al., 2014; Otto-Bliesner et al., 2016). Warmer temperatures, leading to increased evaporative losses, are clearly implicated in the projected future drying in these semi-arid regions (Dai et al., 2018), emphasizing the central role that warming plays in driving increased evaporative demand (Vicente-Serrano et al., 2020). In contrast, future trajectories are more uncertain in regions like Central Asia and eastern Australia–New Zealand where projected changes in precipitation and soil moisture are less coherent (Figure 8.19 and 8.20; Hessl et al., 2018). More information on projected changes in drought, including specific categories or drought, can be found in Section 11.6.5 and Section 12.4.
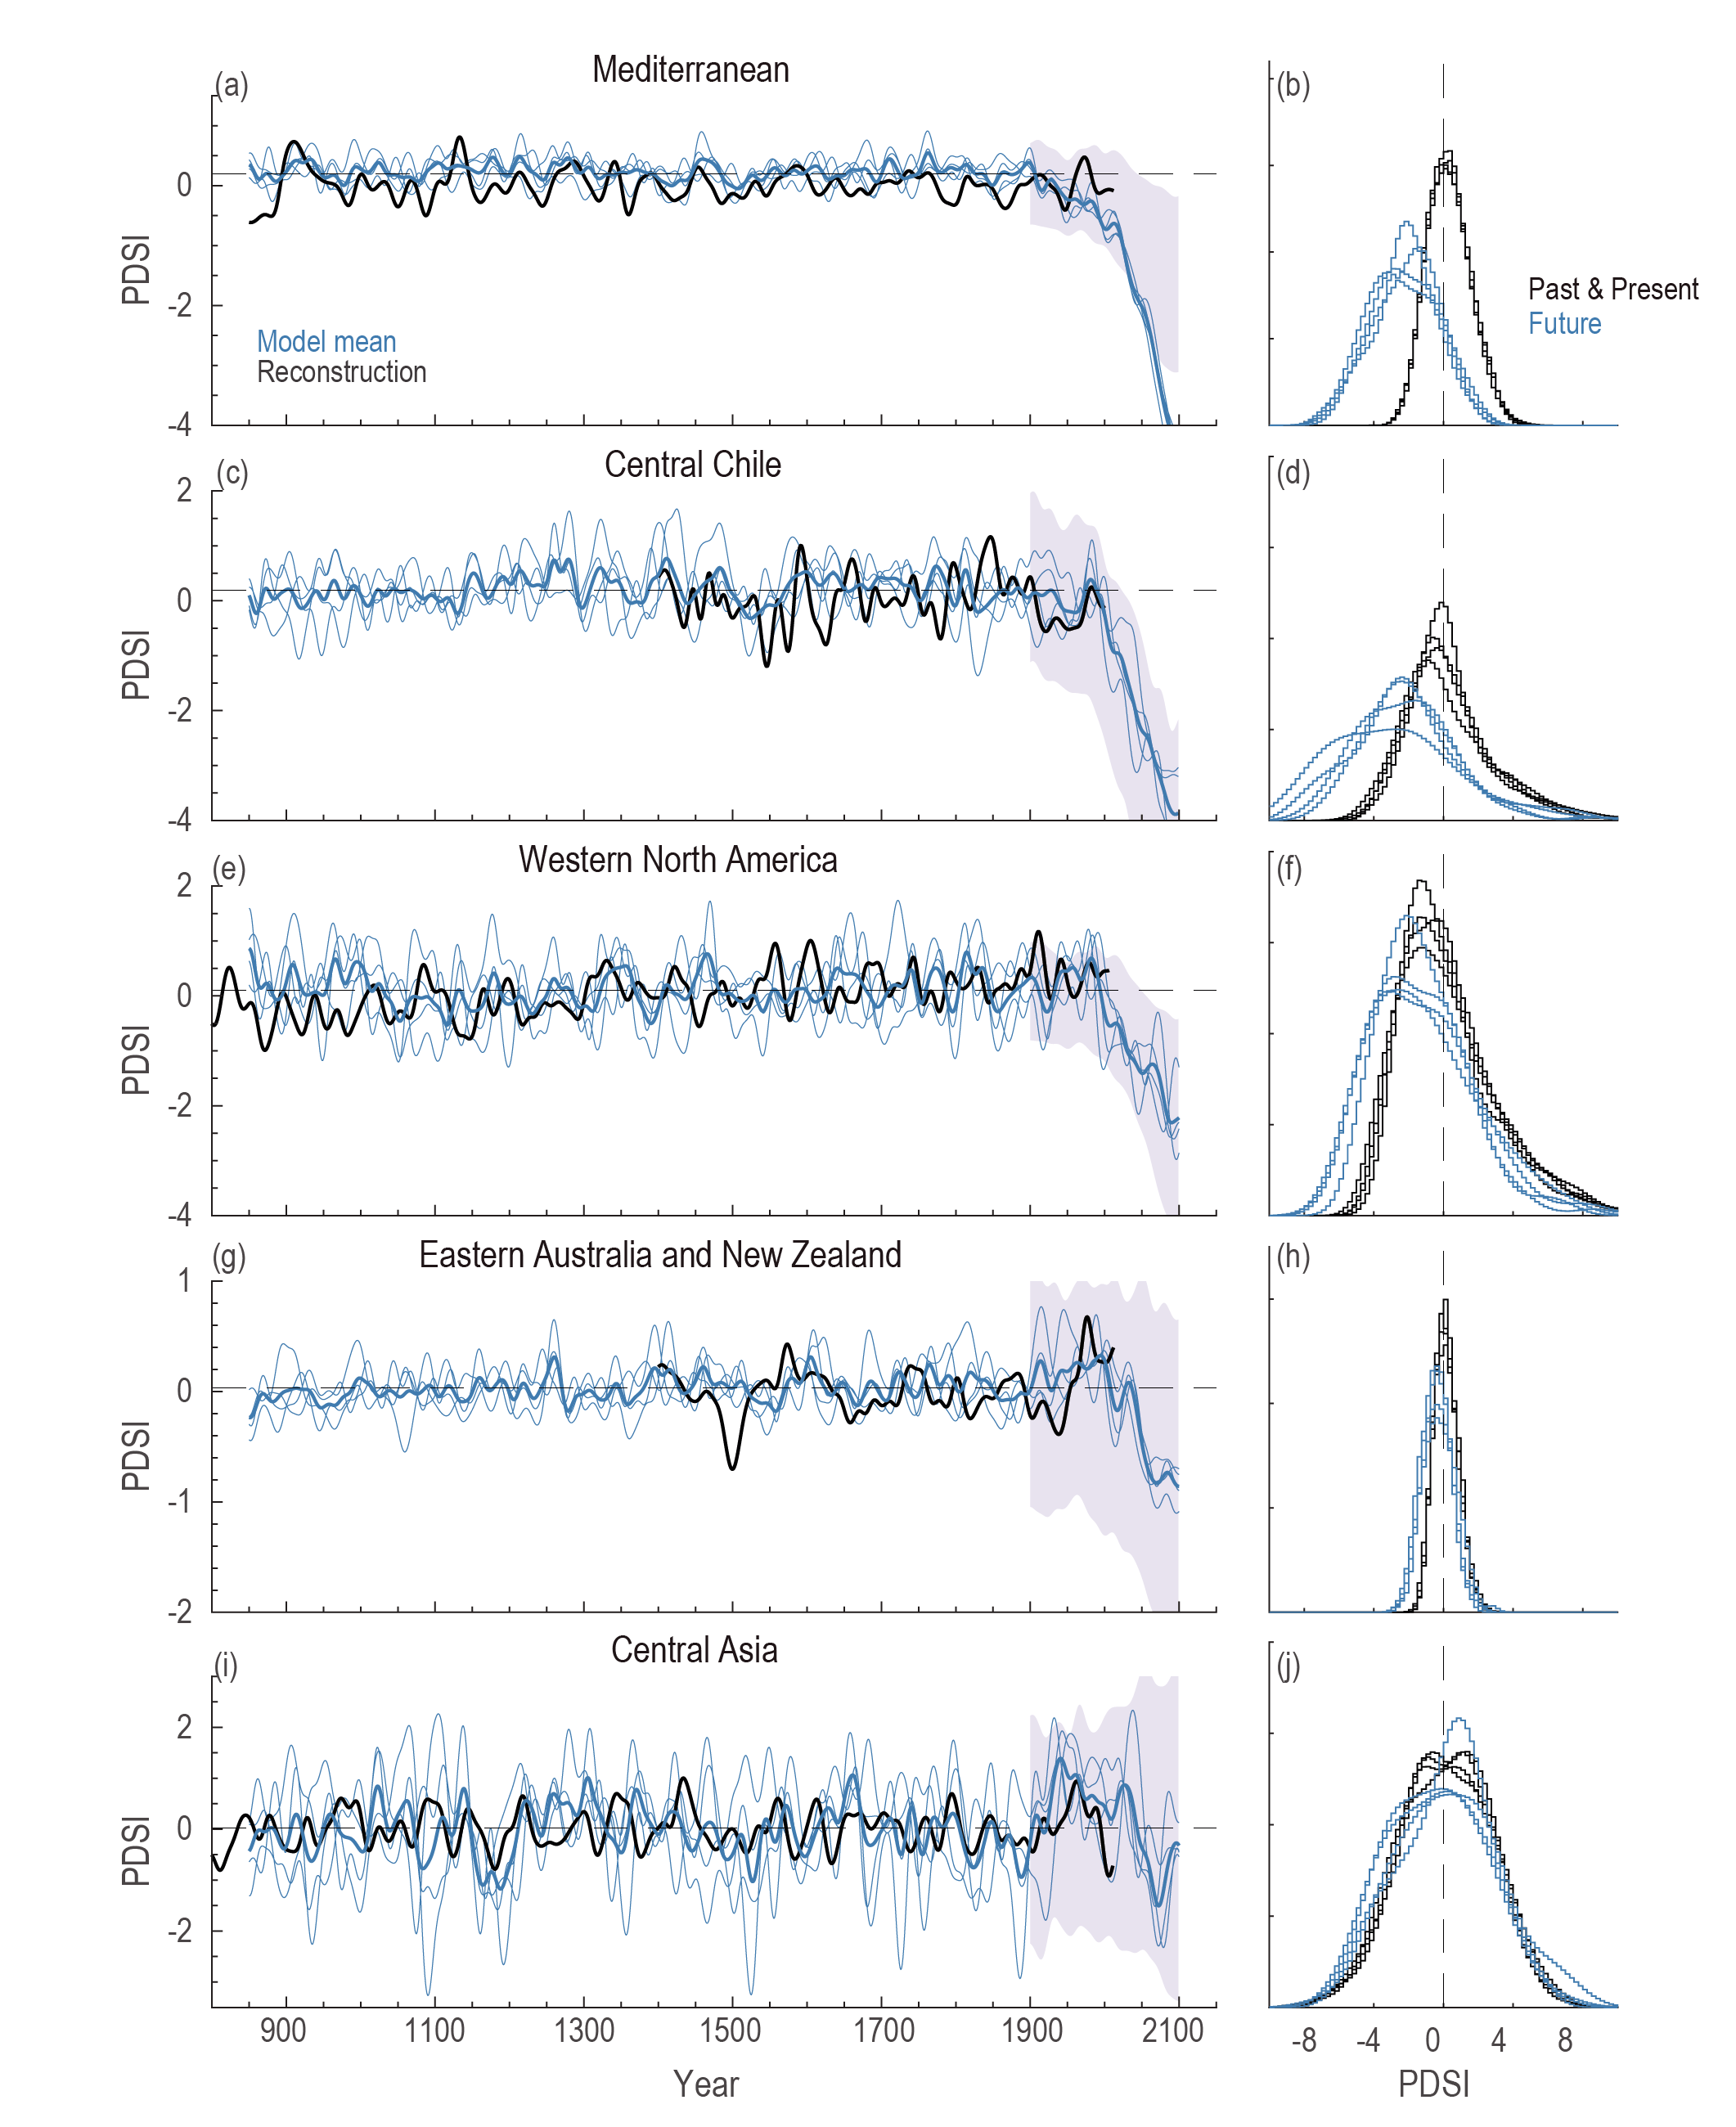 Figure 8.20 | Past-to-future drought variability in paleoclimate reconstructions and models for select regions. On the left (a, c, e, g, i), tree-ring reconstructed Palmer Drought Severity Index (PDSI) series (black line) for the Mediterranean (10°W–45°E, 30°–47°N; E.R. Cook et al., 2015; Cook et al., 2016a), central Chile (70°W–74°W, 32°S–37°S; Morales et al., 2020), western North America (117°W–124°W, 32°N–38°N; Cook et al., 2010; Griffin and Anchukaitis, 2014), Eastern Australia and New Zealand (136°E–178°E, 46°S–11°S; Palmer et al., 2015), and Central Asia (99°E–107°E, 47°N–49°N; Pederson et al., 2014; Hessl et al., 2018) plotted in comparison to the past-to-future, fully-forced simulations from four ensemble members (thin blue lines) from the NCAR CESM Last Millennium Ensemble (thick blue line = ensemble mean) (Otto-Bliesner et al., 2016) for the same regions. The shaded area represents the range (10th to 90th percentile) of historical and future (RCP8.5) PDSI (Penman–Monteith) simulations from 15 CMIP5 models and 34 ensemble members for the same regions (1900–2100; Cook et al., 2014). On the right (b, d, f, h, j), the distribution of annual PDSI values from the past and present (850 to 2005 CE) (black) is compared to the future distribution (2006 to 2100 CE) (blue). The distributions show each of the four ensemble members from the CESM LME simulations. The future component of the CESM LME follows the RCP8.5 scenario. Further details on data sources and processing are available in the chapter data table (Table 8.SM.1).
 In summary, there is high confidence that soil moisture will decline in semi-arid, winter-rainfall dominated areas including the Mediterranean, southern Africa, south-western North America, south-western South America, and south-western Australia, as well as in Central America and the Amazonian basin. In general, these regions are expected to become drier both due to reduced precipitation (medium confidence) and increases in evaporative demand (high confidence). These same regions are likely to experience increases in drought duration and/or severity (high confidence). The magnitude of expected change scales with emissions scenarios (high confidence) but even under low-emissions trajectories, large changes in drought and aridity are expected to occur (high confidence) with consequences for regional water availability. In the Mediterranean, Central Chile, and western North America, future aridification will far exceed the magnitude of change seen over the last millennium (high confidence).
8.4.1.7 Freshwater Reservoirs
8.4.1.7.1 Glaciers
Previous assessments have concluded that recent warming has led to a reduction in low-elevation snow cover (high confidence) (SROCC), permafrost (high confidence) (SROCC), and glacier mass (high to very high confidence) (AR5; SROCC). The SROCC noted that these declines are projected to continue almost everywhere over the 21st century (high confidence), with complete glacier loss expected in regions with only small glaciers (very high confidence). The SROCC supported the AR5 finding that glacier recession would continue even without further changes in climate. The SROCC concluded that cryosphere changes had already altered the seasonal timing and volume of runoff (very high confidence), which in turn had affected water resources and agriculture (medium confidence), and projected peak water runoff had already been reached before 2019 in some of the glacier regions considered.
(Chapter 9 provides detailed assessment of glacier observations and projections (Figures 9.20 and 9.21, and Section 9.5.1). Here, a summary of their key findings is presented. Since SROCC, the coordinated Glacier Model Intercomparison Project (GlacierMIP; Box 9.3; Marzeion et al., 2020) has advanced modelling efforts. Global glacier volumes will substantially decline in coming decades regardless of emissions scenario; under a high-emissions scenario some areas will lose nearly all of their glacier mass (Section 9.5.1.3). The projected global glacier mass loss over 2015–2100 is 29,000 ± 20,000 Gt for SSP1-2.6 to 58,000 ± 30,000 Gt for SSP5-8.5 (Section 9.5.1). Because of their lagged response to warming, glaciers will continue to lose mass for decades even if global temperature is stabilized (very high confidence) (Section 9.5.1).
Global glacier mass loss projections show a scenario-dependent geographic partitioning of when peak in runoff occurs (Marzeion et al., 2020), consistent with previous studies (Radić et al., 2014; Huss and Hock, 2018; Hock et al., 2019b). Under a low-emissions scenario (Marzeion et al., 2020) all regions exhibit runoff in the decades prior to 2050. Under a high-emissions scenario however, low- and mid-latitude regions show peak runoff before approximately 2060, whereas Arctic regions peak in later decades around 2070–2090. Antarctic glacier losses will not have peaked by the end of the century in the high-emissions scenario. Globally, peak runoff of 2.5 to 3 mm yr–1sea level equivalent occurs around 2090 (Marzeion et al., 2020). Regional projections are presented in detail in Section 9.5.1 and Figure 9.21, and briefly summarized below.
Himalaya and Central Asia: Glaciers in the Himalayas feed ten of the world’s most important river systems and are critical water sources for nearly two billion people (Wester et al., 2019). However, they are some of the most vulnerable ‘water towers’ (Immerzeel et al., 2020) that are projected to experience volume losses of approximately 30 to 100% by 2100 depending on global emissions scenarios (Marzeion et al., 2020). Under mid-range emissions scenarios glaciers in this region are projected to reach peak runoff during the period 2020 to 2040 (Marzeion et al., 2020).
Alaska, Yukon, British Columbia: Post-AR5 but pre-SROCC projections indicated a potential 70 ± 10% reduced volume of glacier ice in western Canada relative to 2005 (Clarke et al. , 2015), with few glaciers remaining in the Interior and Rockies regions and maritime glaciers in north-western British Columbia surviving only in a diminished state. Recent global projections support these earlier findings, showing that glacier mass in western Canada and the USA may reduce by 50% under low-emissions scenarios and be completely lost under the highest emissions and most sensitive glacier model combinations (Figure 9.21; Marzeion et al. , 2020). Arctic Canada and Alaskan glaciers are projected to experience more modest mass loss (0–60% depending on region, scenario, and model; Marzeion et al., 2020).
Andes: Huss and Hock (2018) concluded that peak glacier mass was reached prior to 2019 for 82–95% of the glacier area in the tropical Andes. This is consistent with more recent global model simulations that show mass loss rates from low latitude glaciers that universally decline from the start of simulations in 2015, regardless of emissions scenario (Marzeion et al., 2020). Peak runoff in low-latitude Andean glacier-fed rivers has therefore already passed (Frans et al., 2015; Polk et al., 2017) but in the Southern Andes may occur in the latter half of the century under high-emissions scenarios (Marzeion et al., 2020).
In summary, glaciers are projected to continue to lose mass under all emissions scenarios (very high confidence). Runoff from glaciers is projected to peak at different times in different places, with maximum rates of glacier mass loss in low latitude regions taking place in the next few decades in all scenarios (high confidence). While runoff from small glaciers will typically decrease because of glacier mass depletion, runoff from larger glaciers will increase with increasing global warming until glacier mass is similarly depleted, after which runoff peaks and then declines and which tends to occurs later in basins with larger glaciers and higher ice-cover fractions (high confidence). Glaciers in the Arctic and Antarctic will continue to lose mass through the latter half of the century and beyond (high confidence).
8.4.1.7.2 Seasonal snow cover
The AR5 assessed as very likely that the amount and seasonal duration of Northern Hemisphere (NH) snow cover will reduce under global warming (AR5 Sections 11.3.4.2 and 12.4.6.2). Changes in the total amount of water in the snow cover (snow water equivalent) are less certain because of the competing influences of temperature and precipitation.
As snow cover is assessed in Chapter 9 (Section 9.5.3.3), only an overview of that assessment is provided here. Changes in seasonality of snow cover are assessed in Box 8.2. The continued consistency of reported results across all generations of model projections, along with improvements in process understanding, has increased confidence in snow cover projections since AR5.
In summary, based on the results of Chapter 9, it is nowvirtually certain that future NH snow cover extent and duration will continue to decrease with global warming. While most studies have focused on the NH, process understanding suggests with high confidence that these results apply to the Southern Hemisphere (SH) as well. There is high confidence in snowmelt occurring earlier in the year. Changes to the timing and amount of snowmelt will have a strong influence on all the other aspects of the water cycle in regions with seasonal snow, including run-off, soil moisture, and evapotranspiration.
8.4.1.7.3 Wetlands and lakes
The AR5 did not include specific projections for wetlands and lakes. The SRCCL and SROCC provided some discussion of wetlands projections. For coastal wetlands, SRCCL noted the importance of sea level rise for increased saltwater intrusion, although projections of coastal wetland area with sea level rise are inconclusive. Some studies project substantial decreases (Spencer et al., 2016) while others indicate possible increases (Schuerch et al., 2018). SRCCL also noted the general expectation for decreases in water resources, including wetlands, in areas of decreased rainfall due to increased evaporation.
Local studies of inland wetlands project decreases in a range of environments including mountain (Lee et al., 2015), mid- to high latitude (D. Zhao et al., 2018), and prairie(Sofaeret al. , 2016) regions. In addition to affecting wetland extent and density, changes in flooding can also affect the connectivity between wetlands and rivers (Karimet al. , 2016). Despite a number of uncertainties underlying the general response of wetlands to climate change, there are multiple ways climate change may cause considerable stress on both inland and coastal wetlands (Junket al. , 2013; Moomawet al. , 2018).
Widespread changes are also projected for lakes (Woolway et al., 2020), including changes in lake temperature (Fang and Stefan, 1999; Sahoo et al., 2016), ice (Sharma et al., 2019), evaporation (W. Wang et al., 2018), and stability and mixing (Woolway and Merchant, 2019). Note that lake ice is also considered in Chapter 12 of this Report. To date, CO2 -induced lake acidification, analogous to ocean acidification, has not been the focus of many studies but may occur with continued emissions (Phillips et al., 2015). While glacier lakes in general increase with melting glaciers (Linsbauer et al., 2016; Colonia et al., 2017; Magnin et al., 2020) no clear projections are currently available (see discussion in Chapter 9). Projections of lake level means and variability show substantial changes for individual lakes (Bucak et al., 2017; Li et al., 2021) but can be sensitive to methodology, due to the competing processes involved (Notaro et al., 2015). Projected changes to wetlands and lakes due to climate change will occur in the context of widespread and continuing human-caused conversion and degradation of wetlands (e.g, Davidson, 2014), and where water withdrawals have a large impact on lake levels (e.g., Micklin, 2016).
In summary, there is medium confidencethat inland wetland extent will decrease in regions of projected precipitation decrease and evaporation increase, and high confidencethat sea level rise will increase saltwater intrusion into coastal wetlands. However, there is low agreementon the influence of sea level rise on the extent of coastal wetlands. Regarding lakes, there is high confidence for temperature increases and ice decreases, based on both projections and physical expectations, and low confidence for non-homogeneous decreases in mixing, given there is currentlylimitedevidence.
8.4.1.7.4 Groundwater
Groundwater projections were not assessed in AR5. Groundwater processes are not explicitly included in most current CMIP6 models and so must be calculated separately with hydrologic models (e.g., R.G. Taylor et al. , 2013; Cuthbert et al. , 2019a). A range of factors are important in assessing groundwater projections, including the mean difference between precipitation and evaporation, the intensity of precipitation (R.G. Taylor et al., 2013a), and in changes in snow (Tague and Grant, 2009), glaciers (Gremaud et al., 2009), and permafrost (Okkonen and Kløve, 2011). Climate impacts on groundwater are occurring in the context of severe and growing human-caused groundwater depletion (WGII; Konikow and Kendy, 2005; Rodell et al., 2018; Bierkens and Wada, 2019), and water scarcity issues (Mekonnen and Hoekstra, 2016). Climate-related changes to the water cycle can influence water demand (for example, precipitation decreases in an irrigated area), and anthropogenic groundwater depletion can influence the water cycle through interactions with surface energy fluxes, surface water, and vegetation (Cuthbert et al., 2019a), although uncertainties in estimates of future groundwater depletion are large (Smerdon, 2017; Bierkens and Wada, 2019). Some aspects of groundwater change will be irreversible, including the increase of saltwater intrusion into coastal aquifers with sea level rise (Werner and Simmons, 2009), and depletion of fossil aquifers and aquifers with very long recharge times (Bierkens and Wada, 2019).
Globally, two modelling studies have shown substantial decreases in groundwater in regions including the Mediterranean, north-eastern Brazil and south-western Africa, with less clarity for other regions (Döll, 2009; Portmann et al. , 2013). Recent regional-scale analyses of the impact of water cycle changes on groundwater recharge (e.g., Meixner et al. , 2016; Tillman et al. , 2017; Shrestha et al. , 2018) suggest changes in both seasonality and spatial distribution, which are amplified under a higher greenhouse-gas emissions scenario (i.e., RCP 8.5 compared to RCP4.5). Seasonality changes are linked to increases during wet winter periods and declines during dry summer periods. Changes in spatial distribution are linked with increases in more humid regions and declines in more arid locations. Uncertainty in projections of groundwater were found to be substantially influenced by the conceptual and numerical models employed to estimate groundwater recharge (Meixner et al., 2016; Hartmann et al., 2017). Accordingly, current research on estimating water cycles change on groundwater includes a focus on improving the numerical representation of groundwater systems (Bierkens et al., 2015; Döll et al., 2016).
In summary, based on known limitations in current modelling, no confident assessment of groundwater projections is made here, although important climate-related changes in groundwater recharge are expected. In many environments, such climate-related impacts are expected to occur in the context of substantial human groundwater withdrawals depleting groundwater storage.
8.4.2 Projected Changes in Large-scale Phenomena and Regional Variability
A weakening of the tropical circulation represents a balance between thermodynamic increases in low level water vapour (about 7% °C–1) and smaller increases in global precipitation(1–3%°C–1) that are influenced by rapid adjustments to radiative forcings as well as slow responses to warming (Section 8.2.2.2; Bony et al. , 2013; Chadwick et al. , 2013; Ma et al. , 2018). Since AR5, additional drivers of tropical circulation weakening have been identified, including mean SST warming and changes in spatial patterns of SST (He and Soden, 2015), and the direct CO2 radiative effect (Bony et al., 2013; He and Soden, 2015; Merlis, 2015).
8.4.2.1 ITCZ and Tropical Rain Belts
CMIP5 projections show no consistent shift in the zonal mean position of the ITCZ (Donohoe et al. , 2013; Donohoe and Voigt, 2017; Byrne et al. , 2018). The ITCZ position is strongly connected to cross-equatorial energy transport (Kang et al. , 2008; Bischoff and Schneider, 2014), which also shows no consistent change in future projections (Donohoe et al., 2013). Since AR5 it has been reported that most CMIP5 models project a narrowing of the ITCZ in response to surface warming together with intensified ascent in the core region and weakened ascent on the ITCZ edges (Lau and Kim, 2015; Byrne et al., 2018), implying a narrowing of precipitation regions influenced by the ITCZ. Modelled changes in the width and intensity of the zonal mean ITCZ are strongly anti-correlated, for example, narrowing is associated with increased intensity while broadening with decreased intensity. Such changes are associated with changes in tropical high cloud fraction and outgoing longwave radiation (Su et al., 2017; Byrne et al., 2018).
Regional shifts in tropical convergence zones are much larger than their zonal mean, and associated regional changes in precipitation (Chadwick et al., 2013; Mamalakis et al., 2021) are characterized by considerable uncertainties across models (Kent et al., 2015; Oueslati et al., 2016). Over the tropical oceans, shifts in rain bands are strongly coupled with changes in SSTs (Xie et al. , 2010; Huang et al. , 2013). Over tropical land, factors including remote SST increases (Giannini, 2010), the direct CO2 effect (Biasutti, 2013) and land–atmosphere interactions (Chadwick et al., 2017; Kooperman et al., 2018) influence projections. CMIP6 models project a clear northward ITCZ shift over eastern Africa and the Indian Ocean as well as a southward shift over the eastern Pacific and Atlantic oceans, as a result of regionally-contrasting inter-hemispheric energy flows (Mamalakis et al., 2021). The northward movement of the ITCZ over Africa has been linked to an intensification of the Saharan heat low associated with greenhouse gas (GHG) warming (Dong and Sutton, 2015), causing the tropical rain belt to seasonally migrate farther northward and reside there longer (Cook and Vizy, 2012; Dunning et al., 2018). In southern Africa, the projected delay in the wet season onset (Dunning et al. , 2018) is also associated with a circulation-based northward shift in the tropical rain band (Lazenby et al., 2018).
In summary, consistent with the AR5, the overall weakening of the tropical circulation is projected in CMIP5 and CMIP6 simulations with high confidence. It is likely that the zonal mean of the ITCZ will narrow and strengthen in the core region with projected surface warming (high confidence). Distinct regional shifts in the ITCZ will be associated with regional changes in precipitation amount and seasonality (medium confidence).
8.4.2.2 Hadley Circulation and Subtropical Belt
The AR5 found that the Hadley cells are likely to slow down and expand in response to radiative forcing, but with considerable internal variability. Given the complexities in forcing mechanisms, AR5 assigned low confidence to near-term changes in the structure of the Hadley circulation. The widening Hadley cells were expected to result in a poleward expansion of subtropical dry zones.
Model simulations since AR5 project a more noticeable and consistent weakening of the Northern Hemisphere (NH) winter Hadley cell than the Southern Hemisphere (SH) winter cell (Seo et al., 2014; Zhou et al., 2016), related to changes in meridional temperature gradient, static stability, and tropopause height (Seo et al., 2014; D’Agostino et al., 2017). Changes in SST patterns reduces the magnitude of Hadley cell weakening (Gastineau et al., 2009; Ma et al., 2012). There is considerable structure in Hadley circulation strength changes with longitude, associated with cloud-circulation interactions (Su et al., 2014). Subtropical anticyclones are projected to intensify over the north Atlantic and south Pacific but to weaken elsewhere (He et al., 2017).
A consistent poleward expansion of the edges of the Hadley cells is projected (Nguyen et al., 2015; Grise and Davis, 2020), particularly in the SH, consistent with observed trends (Figure 8.21 and Section 8.3.2.2; Nguyen et al. , 2015). The main driver of future expansion appears to be greenhouse gas forcing (Grise et al., 2019), with uncertainty in magnitude due to internal variability (Kang et al., 2013). Proposed mechanisms for poleward expansion include increased dry static stability (Frierson et al. , 2007; Lu et al. , 2007), increased tropopause height (Chen and Held, 2007; Chen et al. , 2008), stratospheric influences (Kidston et al., 2015) and radiative effects of clouds and water vapour (Shaw and Voigt, 2016; see also Section 4.5.1.5). Hadley cell expansion is thought to be associated with the precipitation declines projected in many subtropical regions (Shaw and Voigt, 2016), but more recent work suggests that these reductions are mainly due to the direct radiative effect of CO2 forcing (He and Soden, 2015), land –sea contrasts in the response to forcing (Shaw and Voigt, 2016; Brogli et al. , 2019) and SST changes (Sniderman et al., 2019). In semi-arid, winter rainfall-dominated regions (such as the Mediterranean), thermodynamic processes associated with the land –sea thermal contrast and lapse rate changes dominate the projected precipitation decline in summer, whereas circulation changes are of greater importance in winter (Brogli et al. , 2019). The hydroclimates in these regions are projected to evolve with time due to changing contributions from rapid atmospheric circulation changes and their associated SST responses, as well as slower SST responses to anthropogenic forcing (Zappa et al., 2020).
In summary, CMIP5 and CMIP6 models project a weakening of the Hadley cells, with high confidence for the NH in boreal winter and low confidence for the SH in austral winter. The Hadley cells are projected to expand polewards with global warming, most notably in the SH (high confidence). There is currentlylow confidence in the impacts on regional precipitation in subtropical regions.
8.4.2.3 Walker Circulation
The AR5 determined that the Pacific Walker circulation was likely to slow down over the 21st century, which would lead to decreased precipitation over the western tropical Pacific and increases over the central and eastern Pacific. Recent studies show consistency with AR5 conclusions but also show an eastward shift over the Pacific, mostly due to a shift towards more ‘El Niño-like’ conditions under global warming (Bayr et al., 2014). Other studies suggest that the weakening of the Walker circulation is related to the response of the western North Pacific monsoon and to changing land–sea temperature contrasts, while a positive ocean–atmosphere feedback amplifies the weakening of both east–west SST gradient and trade winds in the tropical Pacific (Zhang and Li, 2017).
Since AR5, the paradox between the projected weakening and the observed strengthening of the Walker circulation since the 1990s (Section 8.3.2.2) has triggered debate about the drivers of these changes (England et al. , 2014; McGregor et al. , 2014; Kociuba and Power, 2015; Vilasa et al. , 2017; Chung et al. , 2019). Projected changes in equatorial SST gradients are not entirely consistent with observed trends (Coats and Karnauskas, 2017; Seager et al., 2019a), and one CMIP5 model that projects a future strengthening of the Walker circulation is more consistent with observations than other models (Kohyama et al., 2017). Other studies suggest that these differences arise from the dominant influence of internal climate variability to the observed trends (Chung et al., 2019), or as a consequence of a systematic cold bias of most CMIP5 models in their Equatorial Pacific cold tongues (Seager et al., 2019a). However, the latter hypothesis is based on a simplified model of tropical Pacific dynamics and is not consistent with the current physical understanding of the tropical circulation response to increasing CO2 levels (Section 8.2.2.2) or with independent paleoclimate evidence suggesting a weaker Walker circulation under warmer climates (Tierney et al., 2019; McClymont et al., 2020). Different time scales of the tropical Pacific responses to global warming have been highlighted by numerical experiments with both comprehensive and simplified models. Results suggest a transient strengthening of the Walker circulation related to Indian Ocean warming (L. Zhang et al., 2018), followed by a slower weakening linked to a strengthened eastern Pacific cold tongue warming emerging after 50–100 years (Section 7.4.4.2.1; Heede et al., 2020).
CMIP6 projections provide further evidence of a significant long-term weakening of the Walker circulation (Figure 8.21). For instance, a pronounced weakening of the upper-level tropical easterly jet is projected both over the Indian Ocean and tropical eastern Pacific, where declines are projected to exceed 70% by 2100 in the high-emissions SSP5-8.5 scenario (S. Huang et al., 2020). CMIP6 models agree on a future decrease of the equatorial zonal temperature gradient (Fredriksen et al., 2020), which can lead to weaker trade winds over the tropical Pacific. However, CMIP6 models show a diversity of SST warming patterns in the tropical Pacific (Freund et al., 2020), which contributes to uncertainties in the response of both Walker circulation and ENSO to continued warming.
 Figure 8.21 | Schematic depicting large-scale circulation changes and impacts on the regional water cycle. The central figures show precipitation minus evaporation (P–E) changes at 3°C or global warming relative to an 1850–1900 base period (mean of 23 CMIP6 SSP5-8.5 simulations). Annual mean changes (large map) include contours (ocean only) depicting control climate P–E = 0 mm day–1lines with the solid contour enclosing the tropical rain belt region and dashed lines representing the edges of subtropical regions. Confidence levels assess understanding of how large-scale circulation change affect the regional water.
 In summary, there is high confidence that the Pacific Walker circulation will weaken by the end of the 21st century, and will be associated with decreased precipitation over the western tropical Pacific and increases farther east. Discrepancies between observed and simulated changes in SSTs in the tropics indicate that a temporary strengthening of the Walker Circulation can arise from a transient response to GHG radiative forcing (low confidence) and from internal variability (medium confidence).
8.4.2.4 Monsoons
In AR5, monsoon precipitation over land was projected to intensify by the end of the 21st century, due to thermodynamic increases in moisture convergence despite weakening of the tropical circulation (see Section 8.2.1.3). Following the definition of regional monsoons in Annex V and Figure 8.11, and the assessment of the observed changes (Section 8.3.2.4), here we provide an assessment of projected changes in regional monsoons. Assessment is provided either in terms of SSP and RCP scenarios and global warming levels available since AR5, or from the newly available CMIP6 projections (Figure 8.22 and Table 8.2). Table 8.2 provides projected changes across the five SSPs used in this Report for precipitation (mm day–1), P–E (mm day–1) and runoff (mm day–1) over the regional monsoons for the mid (2041–2060) and long term (2081–2100).
Mid-term: 2041–2061 Minus Reference Period | Long Term: 2081–2100 Minus Reference Period | ||||||||||
1995–2014 Reference Period | SSP1-1.9 | SSP1-2.6 | SSP2-4.5 | SSP3-7.0 | SSP5-8.5 | SSP1-1.9 | SSP1-2.6 | SSP2-4.5 | SSP3-7.0 | SSP5-8.5 | |
South and South East Asian Monsoon (June–July–August–September, JJAS) | |||||||||||
Precipitation | 8.42 [6.66 to 10.14] | 0.44 [0.08 to 0.74] | 0.47 [0.1 to 0.96] | 0.42 [0.03 to 0.81] | 0.32 [–0.08 to +0.94] | 0.54 [0.11–1.18] | 0.46 [0.16 to 0.7] | 0.52 [0.13 to 1.09] | 0.66 [0.16 to 1.1] | 0.94 [0.3 to 1.78] | 1.46 [0.66 to 2.49] |
Runoff | 3.75 [1.8 to 5.71] | 0.23 [0.1 to 0.38] | 0.29 [0.02 to 0.65] | 0.29 [–0.0 to +0.66] | 0.24 [–0.04 to +0.52] | 0.38 [0.07–0.78] | 0.19 [–0.02 to +0.35] | 0.29 [–0.04 to +0.65] | 0.42 [0.04 to 0.83] | 0.7 [0.12 to 1.2] | 1.14 [0.36 to 2.05] |
P–E | 5.19 [3.68 to 6.5] | 0.28 [0.03 to 0.52] | 0.36 [–0.0 to +0.76] | 0.36 [0.02 to 0.69] | 0.3 [–0.04 to +0.85] | 0.45 [0.06–0.95] | 0.27 [0.06 to 0.38] | 0.38 [0.11 to 0.76] | 0.51 [0.02 to 0.83] | 0.81 [0.24 to 1.56] | 1.15 [0.45 to 1.84] |
East Asian Monsoon (June–July–August, JJA) | |||||||||||
Precipitation | 5.59 [4.47 to 6.86] | 0.37 [–0.09 to +0.93] | 0.37 [–0.09 to +0.87] | 0.34 [0.05 to 0.76] | 0.22 [–0.16 to +0.88] | 0.43 [0.03 to 1.1] | 0.43 [0.07 to 1.02] | 0.44 [–0.0 to +1.08] | 0.51 [0.11 to 1.09] | 0.59 [0.02 to 1.31] | 0.84 [0.24 to 1.74] |
Runoff | 2.24 [1.28 to 3.41] | 0.11 [–0.16 to +0.4] | 0.13 [–0.19 to +0.42] | 0.13 [–0.15 to +0.4] | 0.15 [–0.29 to +0.76] | 0.2 [–0.11 to +0.72] | 0.16 [–0.08 to +0.49] | 0.16 [–0.13 to +0.58] | 0.22 [–0.13 to +0.64] | 0.36 [–0.05 to +0.87] | 0.51 [0.06 to 1.24] |
P–E | 2.41 [1.51 to 3.31] | 0.1 [–0.31 to +0.51] | 0.13 [–0.2 to +0.48] | 0.17 [–0.04 to +0.53] | 0.17 [–0.2 to +0.75] | 0.23 [–0.09 to +0.86] | 0.16 [–0.07 to +0.57] | 0.18 [–0.18 to +0.65] | 0.24 [–0.1 to +0.76] | 0.4 [–0.08 to +0.93] | 0.5 [–0.13 to +1.34] |
North American Monsoon (July–August–September, JAS) | |||||||||||
Precipitation | 3.05 [2.24 to 3.96] | 0.13 [–0.08 to +0.43] | 0.07 [–0.27 to +0.32] | 0.02 [–0.32 to +0.41] | –0.03 [–0.37 to +0.38] | –0.03 [–0.43 to +0.52] | 0.18 [–0.05 to +0.44] | 0.04 [–0.35 to +0.39] | –0.1 [–0.51 to +0.37] | –0.19 [–0.76 to +0.44] | –0.15 [–0.96 to +0.57] |
Runoff | 0.46 [0.09 to 0.87] | 0.03 [–0.04 to +0.12] | 0.03 [–0.07 to +0.16] | 0.02 [–0.1 to +0.14] | –0.0 [–0.1 to +0.14] | –0.0 [–0.11 to +0.14] | 0.04 [–0.03 to +0.15] | –0.0 [–0.19 to +0.15] | –0.03 [–0.22 to +0.14] | –0.05 [–0.23 to +0.19] | –0.06 [–0.29 to +0.23] |
P–E | 0.78 [–0.1 to +1.45] | 0.06 [–0.1 to +0.2] | 0.02 [–0.18 to +0.24] | 0.0 [–0.22 to +0.23] | –0.03 [–0.24 to +0.2] | –0.04 [–0.31 to +0.27] | 0.09 [–0.06 to +0.31] | 0.01 [–0.22 to +0.25] | –0.08 [–0.28 to +0.25] | –0.17 [–0.68 to +0.25] | –0.18 [–0.72 to +0.38] |
South American Monsoon (December–January–February, DJF) | |||||||||||
Precipitation | 8.44 [5.98 to 10.22] | 0.09 [–0.2 to +0.3] | 0.12 [–0.29 to +0.62] | 0.09 [–0.47 to +0.62] | 0.07 [–0.55 to +0.62] | 0.07 [–0.5 to +0.71] | 0.02 [–0.32 to +0.36] | 0.09 [–0.33 to +0.58] | 0.07 [–0.63 to +0.81] | 0.05 [–1.17 to +0.82] | –0.0 [–1.22 to +1.19] |
Runoff | 2.49 [1.11 to 4.38] | –0.02 [–0.23 to +0.26] | –0.01 [–0.43 to +0.53] | 0.01 [–0.45 to +0.46] | –0.03 [–0.49 to +0.36] | –0.03 [–0.56 to +0.53] | –0.04 [–0.27 to +0.28] | –0.01 [–0.41 to +0.39] | –0.01 [–0.58 to +0.55] | –0.06 [–0.81 to +0.24] | –0.04 [–0.85 to +0.93] |
P–E | 4.5 [2.83 to 6.01] | 0.04 [–0.23 to +0.25] | 0.08 [–0.26 to +0.47] | 0.04 [–0.43 to +0.53] | 0.04 [–0.5 to +0.61] | 0.02 [–0.45 to +0.58] | –0.01 [–0.32 to +0.29] | 0.03 [–0.34 to +0.43] | –0.02 [–0.63 to +0.62] | –0.02 [–1.03 to +0.72] | –0.09 [–1.11 to +0.98] |
Australian and Maritime Continent Monsoon (December–January–February, DJF) | |||||||||||
Precipitation | 8.63 [6.79 to 10.7] | 0.26 [0.04 to 0.49] | 0.22 [–0.23 to +0.53] | 0.28 [–0.2 to +0.79] | 0.25 [–0.14 to +0.73] | 0.38 [0.0 to 0.84] | 0.15 [–0.09 to +0.34] | 0.24 [–0.36 to +0.74] | 0.5 [–0.1 to +1.07] | 0.65 [–0.08 to +1.33] | 0.9 [0.09 to 1.76] |
Runoff | 3.82 [1.78 to 7.25] | 0.2 [–0.01 to +0.48] | 0.23 [–0.11 to +0.48] | 0.29 [–0.11 to +0.7] | 0.24 [–0.13 to +0.56] | 0.35 [–0.03 to +0.87] | 0.12 [–0.06 to +0.39] | 0.29 [–0.08 to +0.88] | 0.49 [0.09 to 1.25] | 0.61 [–0.09 to +1.05] | 0.92 [0.14 to 1.83] |
P–E | 4.8 [3.19 to 6.63] | 0.22 [0.03 to 0.47] | 0.13 [–0.23 to +0.42] | 0.2 [–0.16 to +0.7] | 0.2 [–0.14 to +0.62] | 0.27 [–0.09 to +0.61] | 0.12 [–0.1 to +0.31] | 0.16 [–0.31 to +0.54] | 0.38 [–0.05 to +0.75] | 0.54 [–0.08 to +1.13] | 0.69 [0.09 to 1.27] |
West African Monsoon (June–July–August–September, JJAS) | |||||||||||
Precipitation | 5.14 [3.62 to 7.18] | 0.16 [–0.19 to +0.4] | 0.14 [–0.22 to +0.56] | 0.24 [–0.14 to +0.72] | 0.3 [–0.1 to +0.85] | 0.38 [–0.12 to +1.24] | 0.06 [–0.25 to +0.52] | 0.1 [–0.25 to +0.57] | 0.25 [–0.32 to +0.91] | 0.38 [–0.49 to +1.14] | 0.49 [–0.55 to +1.56] |
Runoff | 1.43 [0.34 to 2.57] | 0.06 [–0.07 to +0.22] | 0.05 [–0.18 to +0.27] | 0.14 [–0.13 to +0.54] | 0.2 [–0.05 to +0.7] | 0.24 [–0.1 to +0.8] | –0.01 [–0.2 to +0.21] | 0.03 [–0.25 to +0.35] | 0.1 [–0.25 to +0.51] | 0.25 [–0.28 to +0.85] | 0.3 [–0.33 to +0.93] |
P–E | 2.41 [1.05 to 4.07] | 0.08 [–0.2 to +0.35] | 0.1 [–0.2 to +0.4] | 0.2 [–0.11 to +0.63] | 0.23 [–0.11 to +0.74] | 0.36 [–0.06 to +1.11] | –0.01 [–0.27 to +0.35] | 0.07 [–0.2 to +0.44] | 0.18 [–0.21 to +0.6] | 0.28 [–0.38 to +0.95] | 0.46 [–0.44 to +1.4] |
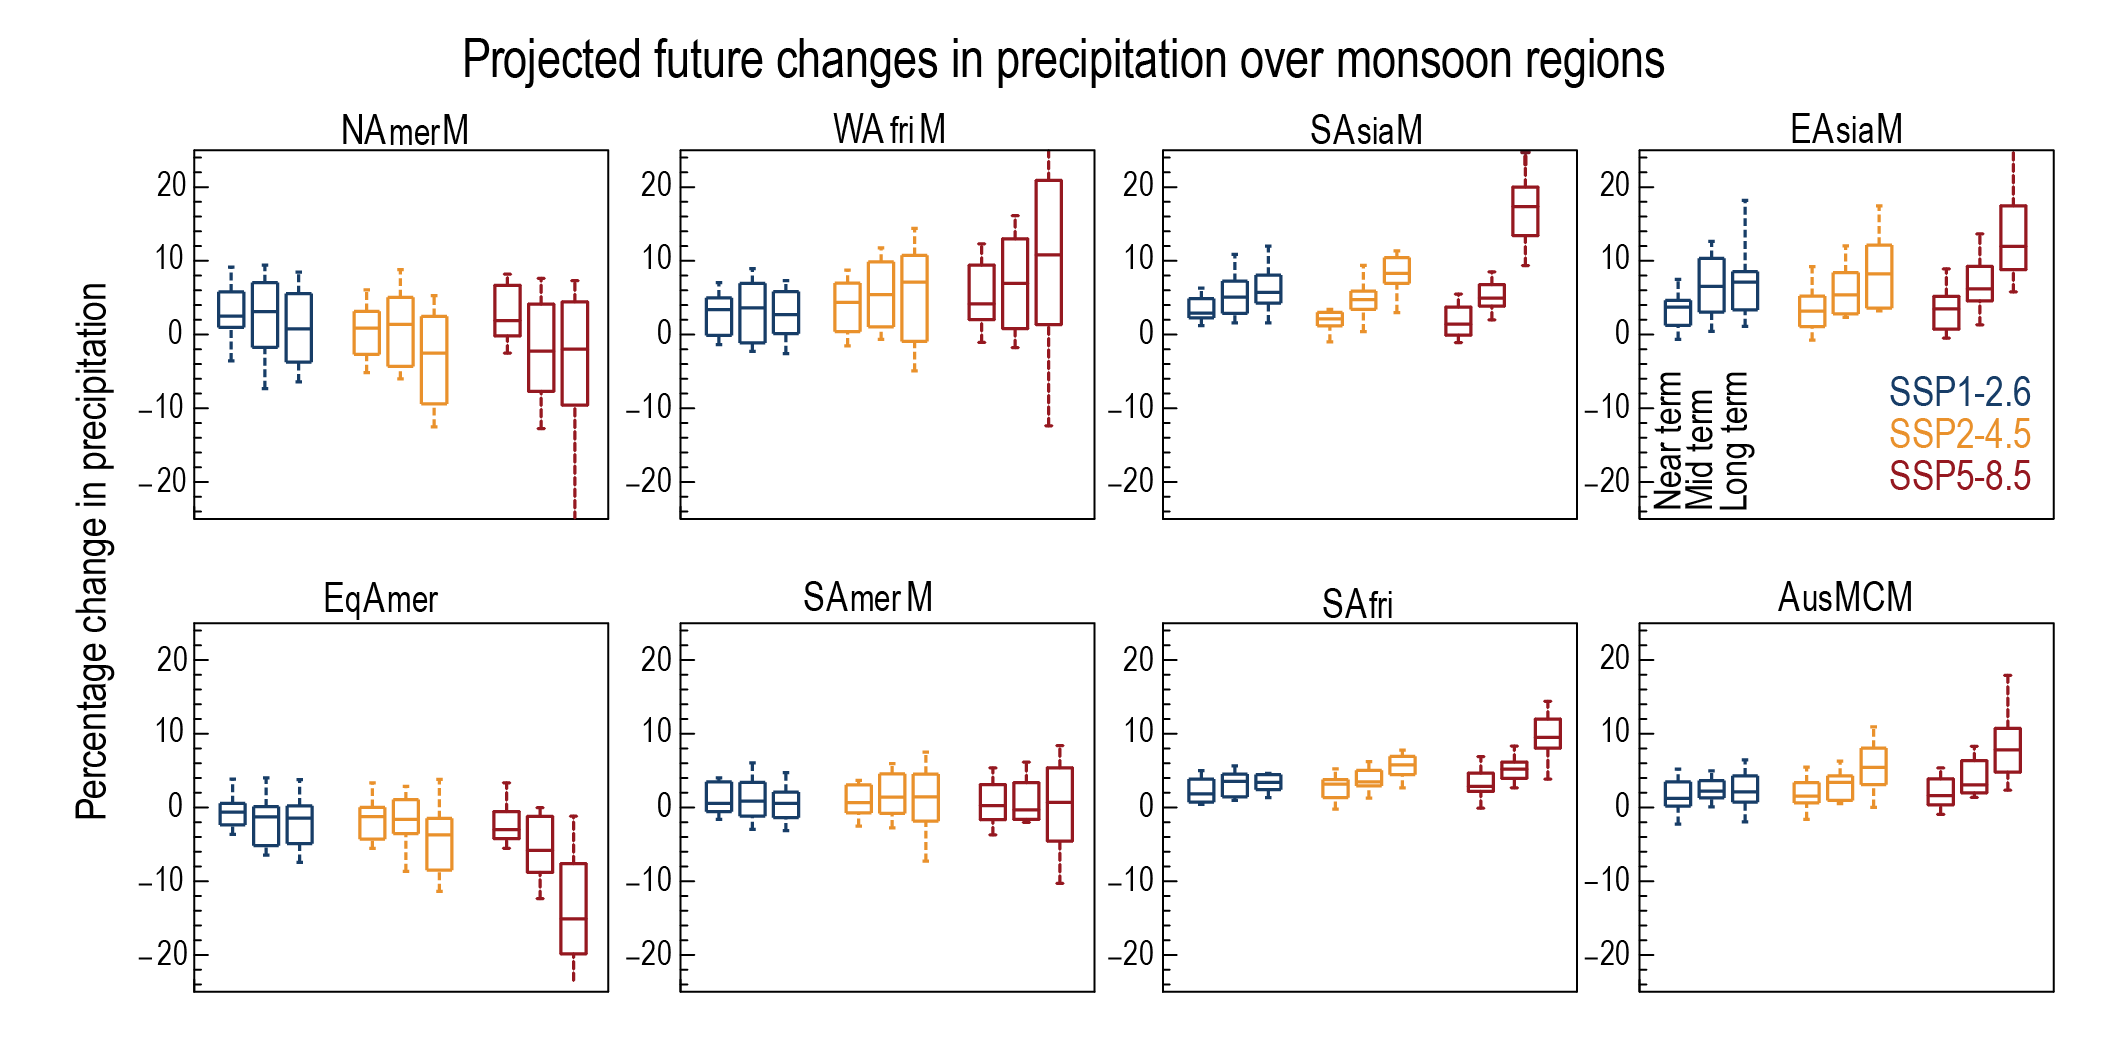 Figure 8.22 | Projected regional monsoons precipitation changes. Percentage change in projected seasonal mean precipitation over regional monsoon domains (as defined in Figure 8.11, Section 8.3.2.4 and Annex V) for near term (2021–2040), mid-term (2041–2060), and long term (2081–2100) periods based on 24 CMIP6 models and three SSP scenarios (SSP1-2.6, SSP2-4.5 and SSP5-8.5). Further details on data sources and processing are available in the chapter data table (Table 8.SM.1).
 8.4.2.4.1 South and South East Asian Monsoon
In AR5, South and South East Asian monsoon (SAsiaM) precipitation was projected to increase by the end of the 21st century but with a weakening of the circulation, withhigh agreement across the CMIP5 models (Kitoh et al. , 2013; Menon et al. , 2013; Sharmila et al. , 2015; Sooraj et al. , 2015; Kitoh, 2017; Kulkarni et al. , 2020). Since AR5, most studies have confirmed projected increases in South Asian monsoon precipitation (high confidence), while one high-resolution model (35 km in latitude/longitude) projects monsoon precipitation decreases during the 21st century following the RCP4.5 scenario (Krishnan et al., 2016).
Over South Asia, the moisture-bearing monsoon low-level jet is projected to shift northward in CMIP3 and CMIP5 models (Sandeep and Ajayamohan, 2015). Greater warming over the Asian land region compared to the ocean contributes to intensification of the monsoon low-level south-westerly winds and precipitation (Endo et al., 2018), even though the combined effect of upper and lower tropospheric warming makes the Asian monsoon circulation response rather complicated. A high resolution model projection, based on the RCP8.5 scenario, indicates that a northward shift of the low-level jet and associated weakening of the large-scale monsoon circulation can induce a large reduction in the genesis of monsoon low pressure systems by the late 21st century (Sandeep et al., 2018). Experiments with constant forcing indicate that at 1.5°C and 2°C global warming levels, mean precipitation and monsoon extremes are projected to intensify in summer over India and South Asia (Chevuturi et al., 2018; D. Lee et al., 2018) and that a 0.5°C difference would imply a 3% increase of precipitation (Chevuturi et al., 2018). CMIP5 models project an increase in short intense active days and decrease in long active days, with no significant change in the number of break spells for India (Sudeepkumar et al., 2018).
Future monsoon projections from CMIP6 models show an increase of SAsiaM precipitation across all the scenarios and across all the time frames (Figure 8.22) with the maximum increase at the end of the 21st century in SSP5-8.5 (Almazroui et al. , 2020c; Z. Chen et al. , 2020b; Ha et al. , 2020; Wang et al. , 2021). Table 8.2 confirms that changes in runoff and P–E over SAsiaM region are positive and largest in the higher emissions scenarios considered, as in precipitation. On the other hand, changes in the ensemble mean for all the variables considered in the SSP1-1.9 scenario are negative for both mid and long-term periods (Table 8.2). This is also consistently reflected in the spatial map of future precipitation changes (Figure 8.15). Different near-term projections of the SAsiaM may result given the diversity in the future aerosol emissions pathways and policies for regulating air pollution (Wilcox et al., 2020). Additionally, near-term projections of SAsiaM precipitation are expected to be constrained by internal variability associated with the PDV (X. Huang et al., 2020a). CMIP6 models also indicate a lengthening of the summer monsoon over India by the end of the 21st century, at least in SSP2-4.5, with considerable inter-model spread in the projected late retreat (Ha et al., 2020).
In summary, consistent with AR5, there is high confidence that SAsiaM precipitation is projected to increase during the 21st century in response to continued global warming across the CMIP6 higher emissions scenarios, mostly in the mid- and long terms.
8.4.2.4.2 East Asian Monsoon
In AR5, the East Asian monsoon (EAsiaM) was projected to intensify in terms of precipitation, with an earlier onset and longer duration of the summer season. Since AR5, there has been improved understanding of future projected changes in the EAsiaM.
CMIP5 projections indicated a possible intensification of the EAsiaM circulation during the 21st century, in addition to precipitation increase, although there is a lack of consensus on changes in the western North Pacific subtropical high, this is an important feature of the EAsiaM circulation (Kitoh, 2017). Furthermore, the EAsiaM precipitation enhancements in the CMIP5 projections are prominent over the southern part of the Baiu rainband by the late 21st century, with no significant changes in the Meiyu precipitation over central-eastern China (Horinouchi et al., 2019). It was also shown that the Baiu precipitation response in CMIP5 projections is accompanied by a southward retreat of the western North Pacific subtropical high and a southward shift of the East Asian subtropical jet (Horinouchi et al., 2019). According to the high-resolution MRI-AGCM global warming experiments, future summer precipitation could potentially increase on the southern side and decrease on the northern side of the present-day Baiu location in response to downward-motion tendencies which can offset the ‘wet-gets-wetter’ effect, but is subject to large model uncertainties (Ose, 2019). Future projections of land warming over the Eurasian continent (Endo et al., 2018) and intensified land –sea thermal contrast (Z. Wang et al., 2016; Tian et al., 2019) can potentially intensify the EAsiaM circulation during the 21st century. However, there are large uncertainties in projected water cycle changes over the region (Endo et al., 2018), mostly in the near-term because of uncertainties in future aerosol emissions scenarios (Wilcox et al., 2020), as well as due to the interplay between internal variability and anthropogenic external forcing (Wang et al., 2021).
Inter-hemispheric mass exchange can act as a bridge connecting SH circulation with EAsiaM rainfall, however this inter-hemispheric link is projected to weaken in a future warmer climate as seen from a CCSM4 projection using the RCP8.5 scenario (Yu et al., 2018). A comparison of 1.5°C and 2°C global warming levels reveals how a 0.5°C difference could result in precipitation enhancement over large areas of East Asia (D. Lee et al. , 2018; J. Liu et al. , 2018; Chen et al. , 2019), with substantial increases in the frequency and intensity of extremes (Chevuturi et al., 2018; D. Li et al., 2019). Future monsoon projections from the CMIP6 models show increase of EAsiaM precipitation across all the scenarios (Z. Chen et al., 2020b), though with a large model spread mostly on the long-term and in the higher emissions scenarios (Figure 8.22). Considering all the five scenarios used across the report, changes in precipitation, runoff and P–E over the EAsiaM are positive and become larger for highest emissions scenarios and for the long-term mean, except for the mid-term SSP1-1.9 scenario where the changes are close to zero or even negative (Table 8.2). Additionally, CMIP6 models confirm a projected increased length of the EAsiaM season due to early onset and late retreat (Ha et al., 2020).
In summary, despite the uncertainties in the monsoon circulation response in CMIP5 and CMIP6 models, there is high confidence that summer monsoon precipitation over East Asia will increase in the 21st century and medium confidence that the monsoon season will be longer.
8.4.2.4.3 West African Monsoon
The AR5 concluded that projections of West African monsoon (WAfriM) rainfall are highly uncertain in CMIP3 and CMIP5 models, but still suggest a small delay and intensification in late wet season rains. Studies published since AR5 are broadly consistent with this assessment. CMIP6 models agree on statistically significant projected increases in rainfall in eastern-central Sahel and a decrease in the west for the end of the 21st century (Roehrig et al., 2013; Biasutti, 2019; Monerie et al., 2020). However, the magnitude of WAfriM projected precipitation depends on the convective parametrization used (Hill et al., 2017), and large uncertainties remain in WAfriM projections because of large inter-model spread, particularly over the western Sahel (Roehrig et al., 2013; Biasutti, 2019; Monerie et al., 2020). CMIP6 models show a general increase of WAfriM precipitation across all future scenarios but with a substantial model spread for the SSP5-8.5 scenario (Figure 8.22). This sensitivity arises from the combined and contrasting influences of anthropogenic greenhouse gas and aerosol forcing that affect WAfriM precipitation (particularly over the Sahel) directly and also indirectly through subtropical North Atlantic SST changes (Giannini and Kaplan, 2019). The large model spread and associated uncertainties in projected precipitation changes is reflected also in runoff and P–E changes (Table 8.2). Regional climate models (RCMs) ensembles (e.g., Klutse et al., 2018) agree with CMIP5 projected rainfall trends but some individual models show rainfall declines (e.g., Sylla et al., 2015; Akinsanola et al., 2018), highlighting the existing large uncertainties in RCMs WAfriM rainfall projections.
Changes in seasonality (Box 8.2) are projected with a later monsoon onset (high confidence) over the Sahel and a late cessation (medium confidence), suggesting a delayed wet season as a regional response to global GHG forcing (Biasutti, 2013; Dunning et al., 2018; Akinsanola and Zhou, 2019). Rainfall distribution is projected to be highly variable with a decrease in the number of rainy days in the western Sahel, consistent with an increase in consecutive dry days and a reduction in the number of growing season days (Cook and Vizy, 2012; Diallo et al., 2016). A decrease in the frequency but an increase in the intensity of very wet events is projected to be more pronounced over the Sahel than over Guinean coast, and also under higher emissions scenarios (i.e., RCP8.5; Sylla et al., 2015; Akinsanola et al., 2018).
In summary, post-AR5 studies and newly available CMIP6 results indicate projected rainfall increases in the eastern-central WAfriM region but decreases in the west (high confidence), with a delayed wet season (medium confidence). Overall, WAfriM summer precipitation is projected to increase during the 21st century but with larger uncertainty noted under high-emissions scenarios (medium confidence).
8.4.2.4.4 North American Monsoon
The AR5 concluded that the North American monsoon (NAmerM) will likely intensify in the future, even though there is low agreement among models. The AR5 reported medium confidence that precipitation associated with the NAmerM will arrive later in the annual cycle and persist longer.
Since AR5, analyses of CMIP5 projections suggest little change in the overall amount of NAmerM precipitation in response to rising global surface temperature. However, significant declines are projected in the early monsoon season and increases in the late monsoon season, suggesting a shift in seasonality toward a delayed monsoon onset and demise (Cook et al., 2013). It is recognized that CMIP5 models are generally too coarsely-resolved to simulate the Gulf of California and the moisture surges associated with the NAmerM (Pascale et al., 2017). Under different RCPs, CMIP5 models tend to project a reduction in NAmerM precipitation but an increase in extreme precipitation events (Torres-Alavez et al. , 2014; Bukovsky et al. , 2015; Pascale et al. , 2019). The almost unchanged or slight decrease in NAmerM total precipitation amount under global warming projections is at odds with paleoclimate records that suggest increased monsoon precipitation under past warm conditions (D’Agostino et al., 2019; Seth et al., 2019). However, there is low agreement on how those changes and the mechanisms that drive them are affected under different RCPs since most simulations are model-dependant (Cook and Seager, 2013; Geil et al., 2013; Pascale et al., 2019). Projections from six CMIP6 models show a shortening of the NAmerM under the SSP5-8.5 scenario due to earlier demises (Moon and Ha, 2020). In addition, CMIP6 projections show a decrease in NAmerM precipitation under SSP2-4.5 and SSP5-8.5 scenarios by the end of the 21st century with large inter-model spread (Figure 8.22). This result is also supported by the analysis of 31 CMIP6 models under the SSTP5-8.5 scenario for the 2080–2099 period (Almazroui et al., 2021). Non-linearities and uncertainties in the NAmerM projected changes are valid for many water cycle variables, like precipitation, runoff and P–E (Table 8.2).
In summary, there is low agreement on a projected decrease of NAmerM precipitation, however there is high confidence in delayed onsets and demises of the summer monsoon.
8.4.2.4.5 South American Monsoon
The AR5 reported medium confidence that the South American monsoon (SAmerM) overall precipitation will remain unchanged, and medium confidence in projections of extreme precipitation. The AR5 also stated high confidence in the spatial expansion of the SAmerM, resulting from increased temperature and humidity.
Since AR5, some studies indicate that the SAmerM would experience changes in its seasonal cycle, with delayed monsoon onsets under increasing GHG emissions associated to different RCPs (Fu et al. , 2013; Reboita et al. , 2014; Boisier et al. , 2015; Pascale et al. , 2016; Seth et al. , 2019; Sena and Magnusdottir, 2020). In contrast, other studies indicate projected earlier onsets and delayed retreats of the SAmerM under the RCP8.5 scenario based on six CMIP5 models (Jones and Carvalho, 2013). These differences have been linked to the methodology used to determine monsoon timing, and sensitivity to the monsoon domain considered (Section 8.3.2.4.5; Correa et al., 2021). Recent studies provide further evidence for the projection of delayed SAmerM onsets by the late 21st century (Sena and Magnusdottir, 2020). An analysis of six CMIP6 models under the SSP5-8.5 scenario confirm the projections of delayed SAmerM onsets by the end of the 21st century (Moon and Ha, 2020). In addition, projected changes in the intensity and length of the SAmerM season have been found to be model-dependent (Pascale et al., 2019). The analysis of CMIP5 projections of total monsoon rainfall indicate mixed signals in the Amazon and SAmerM regions (Jones and Carvalho, 2013; Marengo et al., 2014), with some studies suggesting increased summer precipitation in the core SAmerM region (Kitoh et al., 2013; Seth et al., 2013). Dynamical downscaling of CMIP5 projections under the RCP4.5 and RCP8.5 scenarios with the Eta RCM suggests reductions of austral summer precipitation over the SAmerM region throughout the 21st century (Chou et al., 2014). Further analysis using 15 different CMIP6 models for the SSP2-4.5 scenario suggest reductions in total SAmerM rainfall (B. Wang et al., 2020). However, other analyses of CMIP6 projections under different SSP scenarios do not report clear changes in the SAmerM precipitation throughout the 21st century (Figure 8.22; Z. Chen et al., 2020b; Jin et al., 2020). Similar uncertainties for all the SSP scenarios used across the report are found for other water cycle variables, including runoff and P–E (Table 8.2). Furthermore, there is disagreement in projected extreme precipitation in the region, with some CMIP5-based studies suggest reductions (Marengo et al., 2014), while others indicate increases based on CMIP5 and CMIP6 models (Kitoh et al., 2013; Sena and Magnusdottir, 2020).
In summary, there is high confidence that the SAmerM will experience delayed onsets in association with increases in GHG. However, there is low agreement on the projected changes in terms of total precipitation of the South American summer monsoon season.
8.4.2.4.6 Australian and Maritime Continent Monsoon
The AR5 concluded that projected changes in Australian and Maritime Continent monsoon (AusMCM) rainfall and seasonality are uncertain in the CMIP5 models, with some projecting increases and others projecting decreases for the range of emissions scenarios. Models that perform better at simulating present day regional climate project little change or an increase in Australian monsoon rainfall (Jourdain et al., 2013; CSIRO and BoM, 2015; Brown et al., 2016b). CMIP6 models project increased AusMCM precipitation in the 21st century but with a more robust signal in SSP2-4.5 and SSP5-8.5 rather than in lower emissions scenarios (Figure 8.22). A reduced range of CMIP6 rainfall projections but continued disagreement on the sign of change is reported over Australia (Narsey et al., 2020).
The northern and eastern parts of the Maritime Continent have projected increases in rainfall in CMIP5 models (Siew et al., 2014), while there are projected decreases over Java, Sulawesi and southern parts of Borneo and Sumatra. Rainfall changes are correlated with the extent of warming in the western tropical Pacific in CMIP5 models (Brown et al., 2016b) but inter-model differences are also related to modelled large-scale zonal mean precipitation response in both CMIP5 and CMIP6 model ensembles (Narsey et al., 2020). Decomposition of projected rainfall changes indicates that the largest source of model uncertainty is associated with shifts in the spatial pattern of convection (Chadwick et al., 2013; Brown et al., 2016b). Uncertainties in capturing the spatial and temporal features of the Maritime Continent monsoon depend also on the horizontal resolution of coupled climate models (e.g., Jourdain et al., 2013).
The role of anthropogenic aerosol forcing in future projections of the Australian monsoon has been investigated for CMIP5 models (Dey et al., 2019a); decreases in anthropogenic aerosol concentrations over the 21st century are expected to produce relatively greater warming in the NH than SH, favouring a northward shift of the tropical rain belt (e.g., Rotstayn et al., 2015).
There are some clear projected changes in the rainfall variability and extremes of the Australian monsoon. Rainfall variability in the Australian monsoon domain increases on time scales from daily to decadal in CMIP5 models (Brown et al., 2017), indicating either more intense wet days or more dry days or both. There is also a projected increase in the intensity of extreme rainfall but a reduction in the frequency of heavy rainfall days for the Australian monsoon (Dey et al. , 2019a). This is consistent with Moise et al. (2020), who found an increase in Australian monsoon active phase or ‘burst’ rainfall intensity but a reduction in the number of burst days and events.
H. Zhang et al. (2013) examined changes in Australian monsoon onset and duration in CMIP3 models and found model agreement on a delay in onset and shortened duration to the north of Australia, but less agreement over the interior of the continent. An updated study of CMIP5 models found similar mean changes with delayed onset and shortened duration, but substantial model disagreement (H. Zhang et al., 2016).
In summary, CMIP6 projections show an increase of AusMCM precipitation across all emissions scenarios. There is strong model agreement on an increase in monsoon precipitation over the Maritime Continent while there is low agreement on the direction of change over northern Australia. There is a projected increase in rainfall variability over northern Australia, with increased intensity of rainfall during the active or ‘burst’ phase (medium confidence).
8.4.2.5 Tropical Cyclones
Tropical cyclones (TCs) projections are primarily assessed in Section 11.7.1.5. Here, we extend this analysis by assessing the implications of projected changes in tropical cyclones on the water cycle.
The AR5 concluded that TC rainfall rate was likely to increase through the 21st century. Section 11.7.1.5 assesses that the average tropical cyclone rain-rate is projected to increase with warming (high confidence), and peak rain rates are projected to increase at greater than the Clausius–Clapeyron scaling rate of 7%°C–1 warming in some regions due to increased low-level moisture convergence (medium confidence). The increase in TC rainfall rate is explained by increased TC intensity resulting from increasing SSTs, and increased environmental water vapour (Chauvin et al., 2017; M. Liu et al., 2019).
Consistent with the observed poleward migration of tropical cyclone activity (Kossin et al., 2014), in the SH a larger proportion of storms are projected to decay south of 25°S at the end of the 21st century but with negligible changes in genesis latitude and storm duration for the Australian region (CSIRO and BoM, 2015; Sharmila and Walsh, 2018). An analysis of projections for North Pacific islands indicate that the maximum intensity of storms will increase but the number of tropical cyclones will decrease in some places, such as Guam and Kwajalein Atoll in the tropical north-western Pacific, or remain the same in other regions like near Okinawa (Japan) or Oahu (Hawaii) (Widlansky et al., 2019). TC-induced storm tides affecting landfall in the Pearl River delta over South China are projected to increase by the end of the 21st century (J. Chen et al., 2020b)
In summary, there is high confidence that heavy precipitation associated with tropical cyclones is projected to increase, in response to well-understood processes related to increased low-level moisture convergence and environmental water vapour.
8.4.2.6 Stationary Waves
The AR5 did not provide an assessment of stationary wave projections as distinct from other related aspects of circulation, such as blocking, modes of variability, and storm tracks. Here we provide a brief assessment of stationary wave projections from the water cycle perspective, with the related circulation aspects considered separately in the following sections.
Several studies based on CMIP5 projections show changes in NH winter stationary waves that increase precipitation over the west coast of North America and decrease it over the eastern Mediterranean and parts of south-western North America (Neelin et al. , 2013; Seager et al. , 2014a, b, 2019b; Simpson et al. , 2016; Wills et al. , 2019), although the underlying dynamics are not yet fully understood (Seager et al., 2019b; Wills et al., 2019). For the NH winter global teleconnection pattern, the majority of the models analyzed in (Sandler and Harnik, 2020) project the development of a preferred longitudinal phasing for the pattern, but with strong disagreement among models over the details of the phasing and therefore the associated regional hydrologic impacts.
While the potential role of increasing hydrologic extremes with quasi-resonant stationary waves during NH summer has received considerable attention (see Section 8.3.2.6), as yet there is no clear evidence in model projections that this variability will increase (Teng and Branstator, 2019). The influence of the Arctic on mid-latitude circulation is assessed in Cross-Chapter Box 10.1, which reports that there is low confidence in the dominant contribution of Arctic warming compared to other drivers in future projections. Potential changes to the stratospheric polar vortex in CMIP5 models have a substantial influence on tropospheric stationary waves and associated hydrologic impacts in both the NH (Zappa and Shepherd, 2017) and SH (Mindlin et al., 2020). CMIP5 models have some important limitations in their representation of stationary waves (Lee and Black, 2013; Simpson et al., 2016; Garfinkel et al., 2020) and this aspect of CMIP6 models has not yet been comprehensively evaluated.
In summary, future changes in stationary waves may have an important influence on both the mean state and variability of the water cycle. Limitations in model representation, dynamical understanding, and the number of targeted studies on the topic currently constrain the assessment of future changes in stationary waves. Based on current knowledge, there is low confidence that projected changes in stationary wave activity will contribute to decreases of cold season precipitation over the eastern Mediterranean and increases over the west coast of North America.
8.4.2.7 Atmospheric Blocking
In AR5, the increased ability of models to simulate blocking and higher agreement on projections led to an assessment with medium confidence that the frequency of NH and SH blocking will not increase, but future changes in blocking intensity and persistence were deemed uncertain (AR5 Chapter 14, ES and Box 14.2). Blocking influences precipitation (e.g., Trigo et al., 2004), flooding (e.g., Yamada et al. , 2016), drought (e.g., Dong et al. , 2018b), snow (e.g., García-Herrera and Barriopedro, 2006), and glacier melt (e.g., Hanna et al., 2013), and so is of broad importance to the water cycle in areas of blocking activity.
Blocking projections are assessed in this Report in Chapter 4 (Section 4.5.1.6), and model performance in simulating blocking is also discussed in Chapter 3 (Section 3.3.3.3). CMIP5 projections suggest a complex response in blocking frequencies with an eastward shift in NH winter blocking, mid-latitude decreases in boreal summer except in eastern Europe– western Russia, and SH decreases in the Pacific sector during austral spring and summer. CMIP6 projections (Figure. 4.28) show a notable decrease in blocking activity over Greenland and the North Pacific for the SSP3-7.0 and SSP5-8.5 scenarios. However, the continued large differences among current models as well as the sensitivity to blocking detection methods limits confidence in projected regional changes in blocking (see also Section 10.3.3.3.1). The influence of blocking on multiple elements of the water cycle means that the uncertainty in blocking projections adds a corresponding layer of uncertainty to water cycle projections.
In summary, and despite recent improvements in the simulation of blocking, there is limited evidence in model projections of future changes, except for boreal winter over Greenland and the North Pacific where there is high confidence that blocking events are not expected to increase in the SSP3-7.0 and SSP5-8.5 scenarios. As with stationary waves, this adds uncertainty to mid-latitude water cycle projections at the regional scale.
8.4.2.8 Extratropical Cyclones, Storm Tracks and Atmospheric Rivers
8.4.2.8.1 Extratropical cyclones and storm tracks
The AR5 found that extratropical storms were expected to decrease in the Northern Hemisphere (NH), but only by a few percent. Meanwhile, precipitation associated with extratropical storms was projected to increase due to thermodynamic increases in moisture but potentially also due to intensification from increased latent heat release. Latent heating is a strong influence on extratropical storms, so it is plausible that changes in precipitation and associated latent heating could affect extratropical storm intensity and thus precipitation (Z. Zhang et al., 2019).
There is increased evidence that precipitation associated with individual extratropical storms is projected to increase, following thermodynamic drivers with negligible dynamic change (Yettella and Kay, 2017). Comparisons with reanalyses also support the projected increase in thermodynamic precipitation with little dynamic response for precipitation associated with extratropical storms (Li et al., 2014). There is high confidence that projected increases inprecipitation associated with extratropical storms in the NH (Marciano et al. , 2015; Pepler et al. , 2016; Michaelis et al. , 2017; Yettella and Kay, 2017; Zhang and Colle, 2017; Hawcroft et al. , 2018; Kodama et al. , 2019). A projected decrease in the number of extratropical cyclones over the NH during the boreal summer in CMIP5 models was reported by Chang et al. (2016) who related this decrease with a decrease in cloudiness and thus accentuating increased maximum temperatures. However, model spread was quite large, especially over North America, thus there is onlylow confidence in this seasonal signal.
In AR5, the Southern Hemisphere (SH) storm track was deemed likely to shift poleward, the North Pacific storm track more likely than not to shift poleward, while the North Atlantic storm track was unlikely to display any discernible changes. There was low confidence in regional storm track changes and the associated surface climate impacts, although a weakening of the Mediterranean storm track was a robust response of the models. Since AR5, the SH mid-latitude storm track is projected to shift poleward and the westerlies are projected to strengthen over Australia (CSIRO and BoM, 2015). Although thermodynamic effects were considered to be the most important factor in overall projections of increased mid-latitude precipitation, the general poleward shift in cyclogenesis and an enhanced latitudinal displacement of individual cyclones may play a role (Tamarin-Brodsky and Kaspi, 2017).
In AR5, several factors were identified as relevant to the uncertainties in projections of cyclone intensity, frequency, location of storm tracks and precipitation associated with ETCs. These include horizontal resolution, resolution of the stratosphere, and how changes in the Atlantic meridional overturning circulation (AMOC) were simulated. Since AR5, projections of extratropical cyclones and storm tracks have been examined further, largely confirming previous assessments. In particular, extratropical cyclone precipitation scales with the product of cyclone intensity (as measured by near-surface wind speed) and atmospheric moisture content (Pfahl and Sprenger, 2016). Booth et al. (2018) showed that the fraction of rainfall generated by the convection scheme in simulated extratropical cyclones is highly model- and resolution-dependent, which may be a source of uncertainty regarding their precipitation response to anthropogenic forcings. Also, increased moisture availability may increase the maximum intensity of individual storms while reducing the overall frequency as poleward energy transport becomes more efficient.
The role of temperature trends in influencing storm tracks has been further investigated, both in terms of upper tropospheric tropical warming (Zappa and Shepherd, 2017) and lower tropospheric Arctic amplification (J. Wang et al., 2017), including the direct role of Arctic sea ice loss (Zappa et al., 2018), and the competition between their influences (Shaw et al. , 2016). Physical linkages between Arctic amplification and changes in the mid-latitudes are uncertain, as discussed in Chapter 10 (Cross-Chapter Box 10.1). The remote and local SST influence has been further examined by Ciasto et al. (2016), who confirmed sensitivity of the storm tracks to the SST trends generated by the models and suggested that the primary greenhouse gas influence on storm track changes was indirect, acting through the greenhouse gas influence on SSTs. The importance of the stratospheric polar vortex in storm track changes has received more attention (Zappa and Shepherd, 2017; Mindlin et al. , 2020) and the anticipated recovery of the ozone layer further complicates the role of the stratosphere (Shaw et al., 2016; Bracegirdle et al., 2020b).
Biases remain in cyclone locations, intensities, cloud features, and precipitation (Catto, 2016, Chang et al., 2016). Uncertainties in projected precipitation changes in many mid-latitude regions can be explained to a large degree by uncertainties in projected storm track or ETC changes. Multiple studies (Chang et al., 2013; Zappa et al., 2015; Chang, 2018) have shown strong relationships between model-projected precipitation change in many regions and model-projected change in storm track activity near that regions. While front frequency is well represented, frontal precipitation frequency is too high and the intensity is too low (Catto et al., 2015). Some of the bias in storm tracks appears to be related to limitations in model realization of blocking (Zappa et al., 2014). The CMIP6 generation of models has improved representation of storm tracks in both hemispheres (Bracegirdle et al., 2020a; Harvey et al., 2020). Simulation of storm tracks and their associated precipitation generally improve with increasing resolution beyond that used in most current climate models (Jung et al. , 2006; Michaelis et al. , 2017; Barcikowska et al. , 2018). In terms of projections, the decreases in cyclone occurrence over the Mediterranean were replicated in a higher resolution model (Raible et al., 2018).
The projected changes in storm tracks and the associated mechanisms have several important implications for water cycle projections. P–E changes in the Mediterranean, California and Chile are directly linked to storm track changes (Zappa et al. , 2020). Where the storm tracks are robustly projected to shift (SH, North Pacific) or weaken (Mediterranean), understanding the physical causes of the related changes in precipitation helps increase confidence in the projections. Understanding the competing influences provides context for why other regions do not exhibit a consistent signal and cautions against regional projections based on individual models. However, model bias and the need for relatively high resolution to reproduce the relevant dynamics is an important overall limit on confidence in current CMIP6 projections.
In summary, there is the high confidence that precipitation associated with extratropical storms will increase with global warming in most regions. The SH storm track will likely shift poleward, the North Pacific storm track more likely than not will shift poleward, and the North Atlantic storm track is unlikely to have a simple poleward shift/ display any discernible changes. There is low confidence in regional storm track changes, although a weakening of the Mediterranean storm track is a robust response of the models.
8.4.2.8.2 Atmospheric rivers
Atmospheric rivers were not assessed in AR5 but are important in the water cycle as they are linked to extreme rainfall, flooding, and changes in terrestrial water storage including melt and ablation of glaciers and snowpack (Sections 8.2.3). In a warming world, there is high confidence that thermodynamical increases in atmospheric water vapour ensure that atmospheric rivers will become wetter, hence stronger, and longer-lasting (Payne et al., 2020). This is clearly observed in several regional (Ralph and Dettinger, 2011; Lavers et al., 2013; Gao et al., 2015; Payne and Magnusdottir, 2015; Warner et al., 2015; Hagos et al., 2016; Gershunov et al., 2019) and in one global study (V. Espinoza et al., 2018) of atmospheric river activity in CMIP5 model projections. Lavers et al. (2015) indicate that integrated vapour transport under RCP 8.5 and 4.5 could increase, and consequently this thermodynamic response (O’Gorman, 2015) could affect mid-latitude regions where orographic precipitation is important (Gershunov et al., 2019).
Under continued global warming, more intense moisture transport within atmospheric river events is projected to increase the magnitude of heavy precipitation events on the west coast of the USA (Ralph and Dettinger, 2011; Lavers et al., 2015; Warner and Mass, 2017), in Western Europe (Lavers et al., 2015; Ralph et al., 2016; Ramos et al., 2016), and in East Asia (very likely) (Kamae et al., 2019). All CMIP5 models analysed agreed under a range of scenarios, except over the Iberian Peninsula (Ramos et al., 2016) where there is onlylow confidence in projected changes. Kamae et al. (2019) reported a 1% increase per °C warming in the frequency of atmospheric rivers affecting East Asia, but this is strongly affected by SST changes. Emerging evidence of possible regional changes due to dynamical factors are uncertain (Lavers et al., 2013; Gao et al., 2015; Payne and Magnusdottir, 2015). The frequency, magnitude and duration of atmospheric rivers making landfall along the North American west coast are projected to increase (Gershunov et al., 2019). In contrast, V. Espinoza et al. (2018) suggest that the number of atmospheric river events is projected to slightly decrease globally.
In semi-arid regions where atmospheric rivers have historically been important and precipitation is mainly confined to the cold season, the contribution of atmospheric rivers to annual total precipitation may be expected to grow disproportionately. For example, in California decreases in precipitation frequency are projected as a result of fewer non-atmospheric river storms, while the projected increase in heavy and extreme precipitation events are almost entirely a result of increased atmospheric river activity (Gershunov et al., 2019). Interannual variability in precipitation amounts is projected to increase because of the overall decrease in the frequency of storms but a stronger dependence on extremes (Polade et al., 2014), particularly due to atmospheric rivers (Gershunov et al., 2019), especially where interaction with topography are important (Polade et al. , 2014; Gershunov et al., 2019).
In summary, there is high confidence that the magnitude and duration of atmospheric rivers are projected to increase in future, leading to increased precipitation. This is projected to increase the intensity of heavy precipitation events on the west coast of the USA and in western Europe (high confidence).
8.4.2.9 Modes of Climate Variability and Regional Teleconnections
Following on from the assessment of projected changes in modes of climate variability (MoVs) and regional teleconnections (Section 4.5.3), here we assess their consequences for projected water cycle changes.
8.4.2.9.1 Tropical modes
CMIP6 projections indicate that the amplitude of ENSO (Annex IV.2.3) variability will not substantially change during the 21st century (high confidence) (Section 4.4.3.2). However, rainfall variability related to ENSO is projected to increase significantly by the second half of the 21st century, regardless of ENSO amplitude (Section 4.5.3.2). Regional precipitation variability associated with ENSO increases due to increases in atmospheric moisture, regardless of changes in ENSO variability itself (Pendergrass et al., 2017). In many regions, the magnitude of the projected changes related to ENSO is small compared with historical interannual variability (Bonfils et al., 2015; Power and Delage, 2018; Perry et al., 2020). Uncertainties in precipitation projections related to ENSO depend on internal variability associated with the mode (Section 8.5.2), hence the need to have relatively large ensembles (about 15 members) to adequately estimate uncertainty (Deser et al. , 2018; N. Maher et al. , 2018; C. Sun et al. , 2018; Zheng et al., 2018).
Even over regions with statistically significant simulated rainfall teleconnections during the historical period, CMIP5 models do not project clear changes (Perry et al., 2020). Nonetheless, CMIP5 models that realistically reproduce Indian summer monsoon rainfall indicate a strengthening of its relationship with ENSO in RCP8.5 projections, though the response is not consistent for different varieties of ENSO events (Roy et al., 2019). Inconsistent changes in the ENSO–Indian summer monsoon relationship in response to global warming in CMIP5 and CMIP6 models may be related to statistical issues rather than dynamical changes (Bódai et al., 2020; Haszpra et al., 2020). Over East Africa during the boreal spring and summer, ENSO teleconnections are projected to become stronger in the future (Endris et al., 2019). Meteorological drought consequences of each strong El Niño are projected to become more severe in the region (Rifai et al., 2019).
Indian Ocean Dipole (IOD, Annex IV.2.4) and Indian Ocean Basin (IOB, Annex IV.2.4) interactions with ENSO are expected to persist in the future (Section 4.5.3.3) but projected changes in the frequency and intensity of events remain uncertain (Hui and Zheng, 2018; Endris et al., 2019; McKenna et al., 2020). Climate extremes such as those associated with the extreme positive IOD event of 2019 are expected to occur more frequently under continued global warming (Cai et al., 2021). Projected changes in IOD teleconnections are linked to model performance in representing the IOD and its remote influence in the present climate, apparently dominated by a positive IOD event-like mean state (G. Wang et al., 2017; Huang et al., 2019). Interactions between the IOD and the Indian Ocean mean state, via atmosphere–ocean feedbacks, can affect the behaviour of the IOD (Ng et al., 2018). In the eastern Horn of Africa, OND rainfall is projected to increase because of IOD-ENSO related SST changes in the Indo-Pacific region and associated Walker circulation changes (Endris et al., 2019).
Sensitivity studies generally project increases in Madden Julian Oscillation (MJO, Annex IV.2.8) precipitation amplitude in a warmer climate, with increases of up to 14%°C–1of warming (Arnold et al., 2013, 2015; Caballero and Huber, 2013; Liu and Allan, 2013; Maloney and Xie, 2013; Schubert et al., 2013; Subramanian et al., 2014; Carlson and Caballero, 2016; Pritchard and Yang, 2016; Adames et al., 2017a; Wolding et al., 2017; Haertel, 2018). However, in CMIP5 models with realistic historical MJO behaviour, the precipitation amplitude over the Indo-Pacific warm pool region changes from–4% to +8%°C–1 in the RCP8.5 scenario relative to the end of the 20th century (Bui and Maloney, 2018; Maloney et al., 2019). When simulated MJO precipitation amplitude increases with warming, the leading factor for such change is the intensification of the lower tropospheric vertical moisture gradient, that supports stronger vertical moisture advection per unit diabatic heating (Arnold et al. , 2015; Adames et al. , 2017a, b; Wolding et al. , 2017). In idealized simulations with constant CO2 forcing with El Niño-like patterns, the MJO activity penetrates farther east into the central and east Pacific with increased warming (Subramanian et al., 2014; Adames et al., 2017a). Increased MJO convective variability in a warmer climate does not reflect into increased ability of the MJO to force the extratropics (Wolding et al., 2017).
In summary, even though there is low confidence in how the tropical MoVs will change in the future (Sections 4.3.3.2 and 4.5.3.3), their regional hydrological consequences, in terms of precipitation, are projected to intensify (medium confidence). For example, the ENSO influence on precipitation over the Indo–Pacific sector is projected to strengthen and shift eastward (medium confidence). The MJO is projected to intensify in a warmer climate, with increased associated precipitation (medium confidence).
8.4.2.9.2 Extratropical modes
CMIP6 projections indicate that the Northern Annular Mode (NAM; Annex IV.2.1) is expected to become more positive in winter throughout the 21st century in the SSP3-7.0 and SSP5-8.5 scenarios (Section 4.5.1). In the near term, the Southern Annular Mode (SAM, Annex IV.2.2) is projected to become less positive than observed during the end of the 20th century during the austral summer in all SSPs scenarios (Section 4.3.3.1).
In the CMIP5 RCP8.5 scenario, increased amplitude and frequency of the North Atlantic Oscillation (NAO, Annex IV.2) during boreal winter (December–January–February, DJF) is associated with higher precipitation in northern Europe and lower precipitation in southern Europe (Tsanis and Tapoglou, 2019). However, large-ensemble analyses show how the NAO leads to significant uncertainty in future changes of regional climate (Section 8.5.2). For example, more than a 85% increase in precipitation is projected over northern Europe, western Russia and much of eastern North America, with similar decreasing resulting in drying over north-western Africa and regions adjacent to the Mediterranean Sea (Deser et al., 2017).
In the SH, the positive trend projected for the SAM in the CMIP5 RCP8.5 scenario appears to mitigate the wetting in the mid- to high latitudes and the drying over the subtropics, but with strong seasonal dependence (Lim et al., 2016). Regional precipitation changes in South America, South Africa, Southern Australia and New Zealand are not well explained by changes in the SAM, but are related to broad-scale changes in north–south temperature gradients associated with enhanced warming of the tropical upper troposphere and strengthening of the stratospheric polar vortex (Mindlin et al., 2020).
In summary, projected changes in the intensity, frequency and phase of extratropical MoVs (see also Sections 4.3 and 4.5) may amplify regional changes in precipitation and contribute to an increase in their intra-seasonal and interannual variability (medium confidence). Regionally, there are potentially significant precipitation and atmospheric circulation changes associated with changes in extratropical dynamics (low confidence).
8.5 What Are the Limits for Projecting Water Cycle Changes?
Understanding the limits to projecting water cycle changes are fundamental for refining climate and hydrological models needed to develop successful climate change adaptation strategies. Regional water cycle projections depend on a range of model-dependent responses (Section 8.5.1) and are also strongly influenced by internal variability, especially in the near term (Section 8.5.2; Hawkins and Sutton, 2012; Rowell, 2012; Orlowsky and Seneviratne, 2013; Kent et al., 2015; Fatichi et al., 2016; Greve et al., 2018; Chegwidden et al., 2019). CMIP6 models show that different model responses to the same forcing scenario remain the main source of uncertainty for projected changes in regional precipitation (Figure 8.23; Lehner et al., 2020). Section 8.5.3 assesses the potential for non-linear responses when shifting from low- to high-global warming levels (Section 8.4.2.4; James et al., 2017). While regional uncertainties related to downscaling methods (Section 10.3.3) and impact models (WGII Chapter 4) are not covered here, the added value of regional climate models is briefly discussed (Section 8.5.1.2.2) with a focus on water cycle changes.
 Figure 8.23 | Geographical and zonal mean distribution of the percentage of variance explained by the three sources of uncertainty in CMIP6 projections of 20-year mean precipitation changes in2021–2040 (top), 2041–2060 (middle) and2081–2100 (bottom) relative to the 1995–2014base period: Internal climate variability (left), model response uncertainty (middle) and scenario uncertainty (right, considering four plausible concentration scenarios: SSP1-2.6, SSP2-4.5, SSP3-7.0 and SSP5-8.5). Percentage numbers give the area-weighted global average value for each map. Right panels show the zonal mean fractions over both land and sea (solid lines) and over land only (dashed line). The figure was adapted from Figure 4a in Lehner et al. (2020), https://creativecommons.org/licenses/by/4.0/. The relative contributions of internal variability, models and emissions scenarios to the total uncertainty depend on both region and time horizon. The scenario uncertainty is relatively low in near and mid-term time horizons while it increases in the long term mostly over the high latitudes. The model response uncertainty is the most influential factor across all time horizons. Internal variability also plays a key role in the near term, especially in the subtropics. Further details on data sources and processing are available in the chapter data table (Table 8.SM.1).
 8.5.1 Model Uncertainties of Relevance for the Water Cycle
Model response uncertainty is typically estimated as the inter-model spread (range) projected by a set of climate models for a given emissions scenario. It is best estimated at the end of a high-emissions scenario when internal variability has a limited contribution to total uncertainty (Figure 8.23). Even for aggregated quantities, like decadal-mean precipitation averaged over relatively large domains, model response uncertainty is substantial and can exceed scenario uncertainty (Hawkins and Sutton, 2011; Lehner et al., 2020, 1.5.4, 4.4.1.3). This can also be true for other water cycle variables such as soil moisture, runoff and streamflow at the regional scale, either derived directly from global climate models (GCMs) or produced by ‘offline’ using global hydrological models (GHMs) driven by the same GCMs (Orlowsky and Seneviratne, 2013; Giuntoli et al., 2015, 2018; Chegwidden et al., 2019). Although some of the model response uncertainty is related to climatological biases (Grose et al., 2017; G. Li et al., 2017; Lehner et al., 2019; Samanta et al., 2019), model biases are not the only way to assess the reliability of climate projections (compare with Box 4.1). Therefore, our focus here is on the representation of key processes that are not completely resolved in current-generation GCMs (Section 8.5.1.1) and on the model improvements associated with increased horizontal resolution (Section 8.5.1.2).
8.5.1.1 Fitness-for-purpose and Poorly Constrained Key Processes
The AR5 (Chapter 7 recognized that the simulation of clouds and precipitation remains challenging for state-of-the-art GCMs. Model development and evaluation have continued since AR5, with a particular emphasis on the representation of new model components, like interactive vegetation, aerosols and biogeochemical cycles. For example, the comparison of simulated tropical precipitation across three successive generations of CMIP models (including CMIP6) indicates overall little improvement for the summer monsoons, the double-ITCZ bias, the diurnal cycle and the frequency of precipitation (Fiedler et al., 2020). Some of these issues are related to inherent model limitations in three specific areas: atmospheric convection, cloud–aerosol interactions and land surface processes (ocean and cryosphere-related processes are addressed in Chapter 9). These limitations do not weaken the overall progress made in the large-scale simulation of present-day climate (FAQ 3.3 and Section 3.3.2.3), even though the improvement of CMIP6 compared with CMIP5 models is limited (Figure 3.12) and is generally less systematic or obvious at the regional scale (e.g., Gusain et al. , 2020; Monerie et al. , 2020; Oudar et al. , 2020a). Instead, they call for a careful interpretation of hydrological projections with the full range of plausible outcomes, rather than only considering the most likely scenarios (Sutton, 2018, 2019).
8.5.1.1.1 Atmospheric convection
Moist convection is fundamental to the water cycle through its vertical transport of momentum, heat, and moisture across the atmosphere. It is particularly active in the tropics where it contributes to more than half of annual precipitation and to the development of severe weather events. Given limitations in computing resources, the current-generation GCMs cannot yet represent small-scale cloud processes and consequently shallow and deep convection is determined by sub-grid-scale parametrizations. While such parametrizations can be evaluated against field observations (e.g., Abdel-Lathif et al., 2018), it remains challenging to estimate convective entrainment that is valid for both shallow and deep convection (G.J. Zhang et al., 2016). Comparisons between regional projections with explicit compared with parametrized convection also highlight the limitations of parametrized convection for assessing climate change (Kendon et al., 2019; Jackson et al., 2020).
Atmospheric convection is particularly important for a realistic simulation of tropical precipitation intensities (Pendergrass and Hartmann, 2014a; Kendon et al., 2019). Many CMIP5 models produce rainfall at water vapour amounts lower than in observations (Takahashi, 2018), as well as too light and too frequent precipitation events (Sun et al., 2015; Trenberth et al., 2017). Such biases can be explained by a lack of convective inhibition (Rochetin et al., 2014a, b) and by too much convective and too little non-convective precipitation (Chen and Dai, 2019). Tropical convection controls the amount of precipitable water simulated over the equatorial Indian Ocean, which has been identified as a key metric for differentiating model skill in simulating South Asian monsoon precipitation (Hagos et al., 2019). Many models have difficulty in adequately simulating the diurnal cycle of precipitation over land (Couvreux et al., 2015), the rainfall intensity distribution associated with the West African monsoon (Roehrig et al., 2013), and the intensity of tropical cyclones (Sections 10.3.3.4 and 11.7.1.3), phenomena for which atmospheric convection also plays a key role.
Since AR5, there have been improvements in the representation of convective clouds and related precipitation in GCMs. For instance, the drizzle issue (too light and too frequent rainfall events) has led to modifications in the deep convection triggering scheme (Rochetin et al. , 2014b; Han et al. , 2017; Xie et al. , 2018; Wu et al. , 2019). Although high-resolution studies have highlighted these limitations, most GCMs still rely on a convective available potential energy (CAPE) closure which has been adapted to various cloud regimes (Bechtold et al., 2014; Han et al., 2017; Walters et al., 2019) or evaluated against convection-permitting models (CPMs; J. Chen et al., 2020a). To increase the sensitivity of convection to tropospheric humidity, several models now include a representation of deep convective entrainment dependent on relative humidity (Bechtold et al. , 2008; Han et al. , 2017; M. Zhao et al. , 2018; Walters et al. , 2019). Other efforts have focused on the improvement of shallow convection and low-level cloudiness due to their major contribution to uncertainty in climate sensitivity (Section 7.4.2.4). A cloud-regime-based study however highlights an apparent disconnection between cloud and precipitation processes in GCMs (Tan et al., 2018), suggesting that a good representation of clouds does not lead to systematic improvement in simulated precipitation. A global simulation in which the parametrized convection is switched off shows a strong influence of parametrized convection on daily precipitation extremes(P. Maher et al., 2018). Regional simulations at a 25km resolution suggest that an explicit deep convection can be beneficial even at such a relatively coarse resolution (Vergara-Temprado et al., 2020). Perturbed physics ensembles (PPE, Section 1.4.4) make it possible to identify parameters in the convection scheme that are most important in determining future precipitation changes (Bernstein and Neelin, 2016).
Since AR5, spatial aggregation of tropical convection has also received growing attention in both observational (Holloway et al., 2017) and modelling studies (Muller and Bony, 2015; Wing et al., 2017; Tan et al., 2018). The changing degree of convective organization was highlighted as a key mechanism for dynamic changes in extreme precipitation (Pendergrass, 2020a). Yet, convective parametrizations do not represent all aspects of mesoscale convective systems (Hourdin et al., 2013; Park et al., 2019). This is related to the complexity of mechanisms involved from synoptic to mesoscale dynamics, which are only partially resolved by models. Cloud-resolving models (CRMs, Section 8.5.1.2.2) represent a useful benchmark for improving the parametrization of mesoscale convective systems. Machine learning can also be used to parametrize moist convection after training the model with a conventional or a super parametrization scheme (Gentine et al., 2018; O’Gorman and Dwyer, 2018), but has not yet been used in the CMIP framework.
While some global modelling centres have reported progress in their parametrization of convection and in their simulation of seasonal, daily and sub-daily precipitation (e.g., Danabasoglu et al., 2020; Roehrig et al., 2020), CMIP6 models as a whole only show limited improvements in their simulation of the tropical precipitation climatology compared to CMIP5 (Figure 3.10; Fiedler et al., 2020). For instance, the double-ITCZ syndrome is still prominent (Tian and Dong, 2020) despite being reduced in some models (e.g., Qin and Lin, 2018). This systematic bias was shown to arise from atmospheric processes including cloud feedbacks (Tian, 2015; Dixit et al., 2018; Talib et al., 2018) and the SST threshold at which deep convection occurs in the tropics (Oueslati and Bellon, 2015; Xiang et al., 2017; Adam et al., 2018). Such biases can also arise from a too weak sensitivity of seasonal tropical precipitation to local SSTs compared with observations (Good et al., 2021). These biases are large enough to alter forced precipitation changes, and consequently limit our confidence in projected precipitation changes (Samanta et al., 2019; Aadhar and Mishra, 2020). Observational constraints can be used to narrow model response uncertainties (DeAngelis et al., 2015; G. Li et al., 2017; Ham et al., 2018; Watanabe et al., 2018), although there is still no consensus that model selection or weighting is a reliable alternative to the ‘one-model-one-vote’ approach used in Section 8.4 (Box 4.1). The detrimental influence of model errors can also be mitigated by focusing on phenomena or events (Polson and Hegerl, 2017; Weller et al., 2017), implementing bias adjustment techniques (Section 10.2.3.2), or adopting a non-probabilistic storyline approach (Zappa and Shepherd, 2017).
In summary, since AR5 empirical convective parametrization schemes and associated precipitation biases have improved in some but not all global climate models. There is still low confidence in their ability to accurately simulate the spatio-temporal features of present-day precipitation, especially in the tropics where a double-ITCZ bias is still apparent in many models. While such biases limit the reliability of precipitation projections in some cases, there is currently only medium confidence that model selection or weighting is a better alternative to the one-model-one-vote approach (Box 4.1). Improved water cycle projections can be achieved by focusing on phenomena or weather events, such as a thermodynamic intensification of convective events (high confidence, Section 8.2.2.1), however accurate quantitative estimates are currently hampered by complex, model-dependent dynamical responses (Section 8.2.2.2).
8.5.1.1.2 Aerosol microphysical effects on clouds and precipitation
In AR5 Chapter 7, there was low confidence in the representation of cloud–aerosol interactions in climate models. Despite progresses in this field since AR5, cloud–aerosol interactions remain a major obstacle to understanding climate and severe weather (Varble, 2018). High aerosol concentrations have been observed to suppress rain in water clouds (Campos Braga et al., 2017; Fan et al., 2020). However, such aerosol effects are muted in GCMs, which tend to produce precipitation from shallow clouds too frequently at the expense of rain intensity (Suzuki et al., 2015; Jing et al., 2017). This arises from incomplete knowledge of how clouds adjust to aerosol primary effects such as cloud condensation nuclei (CCN). The adjustment occurs mainly as a dynamic response to the impacts of CCN on cloud droplet size and number concentrations on precipitation-forming processes (Rosenfeld et al., 2008; Goren and Rosenfeld, 2014; Koren et al., 2014; Camponogara et al., 2018). Uncertainties are large for deep clouds, as their processes are much more complex and include also the impacts of aerosols on ice-precipitation processes. Aerosols can substantially invigorate (Rosenfeld et al., 2008; Koren et al., 2014; Fan et al., 2018) and electrify (Thornton et al., 2017; Q. Wang et al., 2018) deep tropical convective clouds. High-resolution atmospheric simulations suggest that high aerosol concentrations can increase environmental humidity by producing clouds that mix more condensed water into the surrounding air, which in turn favours large-scale ascent and strong convective events (Abbott and Cronin, 2021). Further assessment of uncertainties in aerosol–cloud interactions for shallow water clouds is provided in Section 7.3.3.2.
A major challenge in representing convective clouds and related precipitation events in GCMs is a lack of sophisticated cloud microphysics in convective parametrization schemes (e.g., Fan et al., 2016). Most of these schemes only include simple microphysical treatments, such as direct partition between cloud condensation and precipitation, and do not include advanced treatment of conversion among different types of hydrometeors. As such these schemes are unable to simulate microphysical cloud and precipitation responses to aerosol-related perturbations in cloud droplet concentration and ice crystals (see Box 8.1), or perturbations in thermodynamical states from global warming. Efforts have been made to include more advanced cloud microphysical treatment in cumulus parametrizations (Song and Zhang, 2011; Grell and Freitas, 2014; Berg et al., 2015) or to use explicit cloud microphysics schemes in climate models with a ‘super parametrization’ (Wang et al., 2015), which have been shown to improve the performance in simulating cloud properties and precipitation. However, few of these improvements have been incorporated into CMIP6 climate models so the projected precipitation response to anthropogenic perturbation may still be hindered by the inadequate microphysical treatment in cumulus parametrization (Smith et al., 2020).
In summary, there is still low confidence in the simulated influence of the aerosol microphysical effects on future precipitation changes.
8.5.1.1.3 Land surface processes
Land surface processes determine the partitioning of net surface radiation into sensible, latent and ground heat fluxes, the partitioning of precipitation into evapotranspiration and runoff, and the net terrestrial carbon flux at the Earth’s surface. They are relevant for simulating the terrestrial water cycle responses to climate change, as well as the response to land use change (FAQ 8.1). Even basic land surface properties such as albedo (Terray et al., 2018) or the ratio of transpiration to total evaporation (Chang et al., 2018) still need to be improved in state-of-the-art coupled GCMs. Runoff sensitivities are also not well constrained in these models, which display a large spread for the present-day climate, influencing simulated changes under global warming (Lehner et al., 2019). Earth System Models (ESMs) incorporate some combined biophysical and biogeochemical processes to a limited extent, and many relevant processes about how plants and soils interactively respond to climate changes are yet to be considered (e.g., Y. Liu et al., 2020). Consequently, land surface processes and their atmospheric coupling contribute to the range in water cycle projections (Jia et al., 2019).
Since AR5, development of new and existing processes in land surface models (LSMs) have been evaluated. These include soil freezing and permafrost (Vergnes et al. , 2014; Chadburn et al. , 2015; K. Yang et al. , 2018; Gao et al. , 2019), soil and snow hydrology (Brunke et al., 2016; Decharme et al., 2016), glaciers (Shannon et al., 2019), surface waters and rivers (Decharme et al., 2012), as well as vegetation (Bartlett and Verseghy, 2015; Betts et al., 2015; Knauer et al., 2015; Tang et al., 2015) and the representation of hydraulic gradients throughout the soil–plant–atmosphere continuum (Bonan et al., 2014). Such land surface model developments have led to significant improvements in global offline hydrological simulations driven by observed atmospheric forcings (e.g., C. Li et al., 2017; Decharme et al., 2019).
Progress in the representation of land surface heterogeneity has been made, in the form of improved mapping of root zone storage capacity (Wang-Erlandsson et al., 2016), improved vegetation stand, disturbance and fire dynamics (F. Li et al., 2013; Fisher et al., 2018; Haverd et al., 2018; Yue et al., 2018; Zou et al., 2019), better representation of urban surfaces (Box 10.3), and the explicit representation of inland water bodies (Gu et al., 2015; Verseghy and MacKay, 2017). The representation of realistic snow and vegetation cover significantly affects the simulation of the land surface energy and water budgets at multiple time scales (Loranty et al., 2014; Bartlett and Verseghy, 2015; Thackeray et al., 2015; Qiu et al., 2016; Thackeray and Fletcher, 2016; L. Wang et al., 2016; Alessandri et al., 2017). Groundwater remains inadequately represented in many models, which limits our current understanding of the two-way interactions between groundwater and the rest of the hydrologic cycle (R.G. Taylor et al. , 2013a; Leng et al. , 2014; Vergnes et al. , 2014; Pokhrel et al. , 2015; Maxwell and Condon, 2016; Collins, 2017; Scanlon et al. , 2018; Condon et al. , 2020). Land management exerts an increasing influence on the water cycle (Abbott et al., 2019) whose representation in the current-generation climate models is generally incomplete (Section 10.3.3.7.2).
Aside from land surface models (LSMs), global hydrological models (GHMs) have been further developed for off-line simulations of the hydrological impacts of both climate change and water management (Jiménez Cisneros et al. , 2014; Schewe et al. , 2014; Döll et al. , 2016, 2018; Pokhrel et al. , 2016, 2017; Veldkamp et al. , 2018). GHMs can equal or outweigh the contribution of GCMs to uncertainties in hydrological projections at the regional scale (Giuntoli et al., 2015). Historical GHM simulations are currently not sufficient to improve regional water cycle projections, due to modelling uncertainties in both the driving GCMs and land surface hydrology (Pechlivanidis et al. , 2017; Samaniego et al. , 2017; Hattermann et al. , 2018; Krysanova et al. , 2018). Biophysical vegetation processes are still not accounted for in many GHMs, which may lead to inadequate projections of terrestrial runoff and water resources. However, hydrological models that do simulate these effects often disagree (Prudhomme et al., 2014), so do not necessarily provide the added value of a more sophisticated representation of vegetation processes and land surface conditions (Döll et al., 2016).
Since AR5, there has been increasing recognition of the need to better understand the role of land–atmosphere coupling and related feedbacks (Joetzjer et al. , 2014; Berg et al. , 2016; Catalano et al. , 2016; Berg and Sheffield, 2018a; Santanello et al. , 2018). This has led to the development of dedicated field campaigns (Song et al., 2016; Phillips et al., 2017; Dirmeyer et al., 2018), remotely sensed observations (Ferguson and Wood, 2011; Roundy and Santanello, 2017), and tailored diagnostics (Tawfik et al., 2015a, b; Miralles et al., 2016, 2019; Dirmeyer and Halder, 2017). Dynamic vegetation models have been introduced in global ESMs but they need further evaluation (Medlyn et al., 2015; Prentice et al., 2015; Cantú et al., 2018; Franks et al., 2018) to provide valuable information on potential vegetation feedbacks. Plant migration and mortality, increased disturbances from wild fires, insects and extreme events, interactive nitrogen cycle, or the impact of increased levels of tropospheric ozone are often ignored or poorly represented in the current-generation of ESMs (Bonan and Doney, 2018; Fisher et al., 2018).
The physiological response of plants to increasing atmospheric CO2 is generally accounted for, but only using empirical models of stomatal conductance that are characterized by a single critical parameter of intrinsic water-use efficiency (Franks et al., 2017, 2018). This reflects a lack of structural diversity and caution about the consensus of the photosynthesis response to increasing CO2 (Knauer et al., 2015; Huang et al., 2016), which has implications for the ability of the current-generation models to account for uncertainty in future evapotranspiration changes. Most CMIP5 models underestimate the ratio of plant transpiration to total terrestrial evapotranspiration, which may suggest that they also underestimate the impact of plant physiology on the water cycle (Lian et al., 2018). Plant hydraulics are not explicitly considered in many land surface models, which may lead to an underestimation of the influence of the increasing atmospheric moisture stress on plant transpiration under climate change (Massmann et al. , 2019; Grossiord et al. , 2020; Y. Liu et al. , 2020). Most ESMs underestimate the water use efficiency measured at many sites and, consequently overestimate the ratio of evapotranspiration to precipitation (J. Li et al., 2018).
In summary, since AR5 substantial advances have been made in the representation of land surface processes in current-generation Earth System Models (ESMs). Offline hydrological models allow the application of bias-adjusted atmospheric forcings, but there is low confidence of an improved response compared to coupled climate models, given their inherent limitations (Box 10.2). While improvements in the representation of complex land surface feedbacks relevant to the water cycle are needed, there is currentlylow confidence that they will systematically improve the reliability of water cycle projections.
8.5.1.2 Added Value of Increased Horizontal Model Resolution
Coarse spatial resolution of climate models has often been considered a key limitation in global climate projections (Di Luca et al., 2015; Roberts et al., 2018). Proposed and tested solutions include a uniform or regional increase in the resolution of GCMs, or the use of regional climate models (RCMs). The increase in computing resources has also led to the development of convection-permitting models (Prein et al., 2015), which have been integrated over larger domains, but are still unsuitable for CMIP simulations. Statistical downscaling tools are also widely used to generate fine-scale regional climate information necessary for climate impacts and adaptation studies. A comprehensive assessment of the added value of increased spatial resolution and of the benefits and shortcomings of statistical downscaling tools are addressed in Chapter 10 (Section 10.3.3).
8.5.1.2.1 High-resolution global climate models
Since AR5, horizontal resolution has increased in most global climate models, which has led to several improvements in the simulation of the water cycle (see also Section 10.3.1.1), not only in areas with steep or complex orography, but also over the tropical oceans and within the North Pacific and North Atlantic storm tracks (Piazza et al. , 2016; Roberts et al. , 2018; Bui et al. , 2019; Chen and Dai, 2019; Vannière et al. , 2019). Yet, the added value of higher resolution global climate models is not systematic (Johnson et al. , 2016; Ogata et al. , 2017; D. Huang et al. , 2018; Mahajan et al. , 2018; Vannière et al. , 2019) and needs careful assessment (Haarsma et al., 2016; Caldwell et al., 2019). Several AGCM studies suggest that increased spatial resolution leads to better simulation of the atmospheric moisture transport from ocean to land, the geographical distribution of annual mean precipitation (Demory et al., 2014), and the frequency distribution of daily precipitation intensities (L. Zhang et al., 2016; Chen and Dai, 2019) including extremes in many(Jacob et al., 2014; Westra et al., 2014), but not all cases (Bador et al., 2020).
Part of the improvement in simulated precipitation accuracy is related to improved simulation of the frequency and/or mean intensity of tropical (Roberts et al., 2015; Walsh et al., 2015) and extratropical (Hawcroft et al., 2016) cyclones. Idealized regional experiments also show that the North Atlantic storm track response to global warming can be amplified in higher resolution models (Willison et al., 2015). Increased atmospheric horizontal resolution can be also important for simulating Northern Hemisphere (NH) blockings (Davini et al., 2017; Schiemann et al., 2017) and synoptic features of the East Asian summer monsoon (Yao et al., 2017; Kusunoki, 2018). Variable resolution based on grid stretching may be a valuable alternative for simulating regional phenomena like monsoons (Sabin et al. , 2013; Krishnan et al. , 2016) or tropical cyclones (Harris et al., 2016; Chauvin et al., 2017), while avoiding inconsistencies in the forcings or physics that can be found in RCMs driven by GCMs (Boé et al., 2020; Tapiador et al., 2020).
Increasing horizontal model resolution in CMIP5 and CMIP6 models leads to a systematic increase in global mean precipitation, enhanced moisture advection to land in close connection with increased orographic precipitation, and a partial reduction of the long-standing double ITCZ bias (Demory et al., 2014; Caldwell et al., 2019; Vannière et al., 2019). Recent studies based on HighResMIP simulations (Haarsma et al., 2016) confirm the added value of increased horizontal resolution (at least 50 km in the atmosphere and 25 km in the ocean) for the simulation of tropical (Roberts et al., 2020) and extratropical cyclones (Priestley et al., 2020b). CMIP6 model biases in annual mean precipitation are only slightly reduced at higher resolution (Figure 3.10).
High resolution representation of the land surface is also important for simulating many features of the terrestrial water cycle, such as orographic precipitation, snow, runoff and streamflow in complex topography areas (Zhao and Li, 2015). However, the added value may be easier to assess in offline rather than online land surface simulations (Döll et al., 2016) given the possible use of bias-corrected atmospheric forcings. Offline high-resolution GHMs are routinely used to monitor water resources or to assess the hydrological impacts of bias-adjusted global climate projections (Davie et al., 2013; S. Huang et al., 2017, 2018). Yet, the development and calibration of ‘hyper-resolution’ hydrological models, with gridcells of typically 100 m to 1 km, raises a number of issues given the lack of comprehensive surface or subsurface information (Bierkens et al., 2015) and the lack of coupling with the atmosphere (Berg and Sheffield, 2018a).
In summary, there is high confidence that increasing horizontal resolution in GCMs can reduce a number of systematic model errors of relevance for the water cycle, including synoptic circulation and the statistics of daily precipitation. High-resolution GCMs and GHMs provide improved representation of land surfaces, including topography, vegetation and land use change, which are required to accurately simulate changes in the terrestrial water cycle. However, there is low confidence that the higher horizontal resolution simulations currently available provide more accurate projections of the large-scale features of the water cycle.
8.5.1.2.2 Regional climate models and convective-permitting models
Regional Climate Models (RCMs) are used to dynamically downscale global model simulations for a particular region (usually at a spatial resolution of the order of 10 to 50 km; see Section 10.3.3). The AR5 reported that RCMs are useful for regions with variable topography and for small-scale phenomena. However, they inherit biases from their driving GCMs and thus may lack physical consistency with them. Since AR5, the application of RCMs has largely increased due to international model intercomparison projects such as CLARIS-LPB (Sánchez et al., 2015). Many studies have focused on present-day climatological precipitation, showing with high confidence improvements in its monthly to seasonal accumulation and spatial distribution (Dosio et al., 2015; Giorgi et al., 2016; Bozkurt et al., 2019; Falco et al., 2019; Di Virgilio et al., 2020), although the modelling of precipitation remains the ‘Achilles heel’ of both GCMs and RCMs and should be considered cautiously when informing regional climate change adaptation strategies (Tapiador et al., 2019b).
Regional Convective Permitting Models (CPMs), typically run at a resolution less than 10 km, have been implemented over increasingly large domains. Compared to models with parametrized convection (Section 8.5.1.1.1), they generally show improved simulation of key features of the water cycle such as orographic precipitation, sea breeze dynamics, the diurnal cycle in precipitation, soil-moisture–precipitation feedbacks, daily precipitation persistence, sub-daily to daily precipitation intensities and related extremes (Section 8.2.3.2; Birch et al. , 2015; Prein et al. , 2015; Kendon et al. , 2017; Leutwyler et al. , 2017; Willetts et al. , 2017; Hohenegger and Stevens, 2018; Berthou et al. , 2019b; Takahashi and Polcher, 2019; Fumière et al. , 2020; Scaff et al. , 2020; Caillaud et al. , 2021). A growing number of studies have also assessed the potential added value of using CPMs for regional climate projections (Ban et al. , 2015; Giorgi et al. , 2016; Fosser et al. , 2017; Kendon et al. , 2017, 2019; C. Liu et al. , 2017; Lenderink et al. , 2019; Rasmussen et al. , 2020; see also Atlas 5.6.3). Although projected changes in rainfall occurrence in CPMs are broadly and qualitatively consistent with the results of GCMs and RCMs (Kendon et al., 2017), there is a tendency towards stronger changes in both wet and dry extremes (Berthou et al. , 2019a; Kendon et al. , 2019; Lenderink et al. , 2019; Finney et al. , 2020a). While both GCMs and RCMs project an overall decrease in summer precipitation over the Alps, RCMs simulate an increase over the high Alpine elevations that is not present in the global simulations (Giorgi et al., 2016).
Recent studies based on both GCMs and CPMs indicate that both CAPE and convective inhibition will increase in a warmer climate (Section 8.2.3.2; J. Chen et al., 2020a), consistent with a shift from moderate to less frequent but stronger convective events (Rasmussen et al., 2020). If underestimated by models with parametrized convection, such a mechanism could explain the underestimation of both projected increase in precipitation extremes (Borodina et al., 2017; Yin et al., 2018) and land surface drying (Douville and Plazzotta, 2017) in the extratropics. CMIP5 models with a larger increase in extreme precipitation also exhibit larger declines or smaller increases in light to moderate events (Thackeray et al., 2018).
In summary, there is high confidence that dynamical downscaling using limited area models adds value in simulating precipitation and related water cycle processes at the regional scale, especially in complex orography areas (Section 10.3.3.5.1). There is high confidence that the explicit simulation of atmospheric convection can improve the representation of weather phenomena, including the life cycle of convective storms and related precipitation extremes. Even with an improved simulation of small-scale processes, there is only medium confidence that there will be an improvement in RCM-based water cycle projections as they rely on GCM boundary conditions.
8.5.2 Role of Internal Variability and Volcanic Forcing
Beyond modelling uncertainties, internal variability and unpredictable natural forcings may also lower the degree of confidence in projected water cycle changes, especially in the near term (2021-2040) and regional-scale projections (Hawkins and Sutton, 2011; Kent et al. , 2015; Thompson et al. , 2015; Fatichi et al. , 2016; McKinnon and Deser, 2018; Chen and Brissette, 2019; Lehner et al. , 2020). Although there is low confidence that the main modes of climate variability (Annex IV) are altered in a warmer climate (Sections 4.4.3 and 4.5.3), increasing contrast between wet and dry weather regimes (Section 8.2.2.1) will amplify their influence on water cycle variability (Section 8.4.2.9) and therefore contribute to uncertainties in near-term precipitation changes (Figure 8.23). The role of internal variability as source of uncertainties in regional climate projections is assessed in Section 10.3.4.3. Here we assess the role of internal variability in influencing water cycle projections using paleoclimate reconstructions, pre-industrial model simulations, and large single model ensembles (Section 8.5.2.1). Implications for the predictability of near-term water cycle changes are specifically assessed, as they show significant but model-dependent regional hydrological fingerprints over land Section 8.5.2.2). The role of volcanic eruptions is also briefly assessed in terms of consequences and uncertainties in water cycle projections (Section 8.5.2.3).
8.5.2.1 Quantification of Water Cycle Internal Variability
Estimating internal variability is an important challenge in the assessment of human-induced changes in the water cycle since its magnitude and range of variability can exceed the anthropogenic signal, at least at the regional scale and for near-term projections or low-emissions scenarios (Sections 4.4.1.4 and 8.4.2.9; Deser et al. , 2012; Shepherd, 2014; Xie et al. , 2015; Sarojini et al. , 2016; Dai and Bloecker, 2019; Lehner et al. , 2020). Underestimating internal variability in models may result in the overestimation of anthropogenic climate change because the ‘noise’ in the signal-to-noise ratio is underestimated (Knutson and Zeng, 2018). There is medium confidence that this underestimation affects global water cycle projections, for instance, in terms of drought persistence and severity in the south-western USA, eastern Australia, southern Africa, the Mediterranean, the southern Amazonian basin and China (Ault et al., 2014; Cook et al., 2018; Gu et al., 2018). In CMIP6 models, the uncertainty in future projections of 20-year mean precipitation changes attributable to internal variability ranges from 41% in the near term (2021–2040) to 5% in the long term (2081–2100) (Figure 8.23). For decadal-mean precipitation changes, the relative contribution of internal variability is even larger when using large ensembles (Lehner et al., 2020).
Over the 20th century, CMIP5 models show a realistic magnitude of decadal precipitation variability, if not a slight overestimation in some regions (Knutson and Zeng, 2018). However, the relatively short and human-influenced instrumental record limits our ability to quantify the magnitude of internal variability in the water cycle, particularly over long time scales (decadal and beyond). Global extended reanalyses (Section 1.5.2) have been used to derive long-term variability in the regional water cycle components (Caillouet et al., 2017), merged with historical meteorological and hydrological local observations (Bonnet et al., 2017; Devers et al., 2020). Specific assessment of these types of methodology and related uncertainties is provided in Chapter 10 (Sections 10.2 and 10.3). Paleoclimate archives (tree rings, corals, ice core, speleothems, lake and ocean sediments) provide extended reconstructions of key water cycle metrics and large-scale circulation features. Some studies have suggested that CMIP5 models underestimate internal variability at decadal and longer time scales, and therefore may be missing important processes in the climate system (Ault et al. , 2012, 2013; Bunde et al. , 2013; Franke et al. , 2013; Cheung et al. , 2017; Hope et al. , 2017; Kravtsov, 2017; Cassou et al. , 2018). However, recent assessments using paleoclimate records have found that CMIP5 models are able to reproduce decadal-to-centennial variability, including the severity, persistence and spatial extent of megadroughts (Coats et al., 2015; Stevenson et al., 2015; PAGES Hydro2K Consortium, 2017), once signal reddening (autocorrelation) in proxy archives is accounted for (Deeet al., 2017; PAGES Hydro2K Consortium, 2017). Implementation of proxy system models, that is, functions that transform model variables into proxy units, has reduced model–proxy disagreement, although some differences in the magnitude of internal variability remain, particularly at centennial time scales (Deeet al., 2017; Parsons et al., 2017). It is unclear whether remaining discrepancies represent limitations of the climate models, or limitations of the proxy system models. Therefore, there is medium to high confidence (i.e., depending on the region) that climate models do not underestimate water cycle internal variability.
The mechanisms driving internal variability in the water cycle in climate model simulations varies. While models indicate that cool SSTs in the eastern tropical Pacific (La Niña or the cool phase of the PDO) are associated with drought in south-western North America, they also show that atmospheric internal variability may be a more prominent driver (Coats et al., 2015, 2016; Stevenson et al., 2015; Parsons et al., 2018). Simulations of the last millennium from CMIP5–PMIP3 reproduce the observed negative correlation between eastern Australian rainfall and the central equatorial Pacific SSTs with varying skill, and also display periods when the ENSO teleconnection weakens substantially for several decades (Brownet al., 2016a). Differences in simulated internal variability have been found to be responsible for the inter-model spread in predicted shifts in subtropical dry zones for a given shift in the Hadley cell (Seviour et al., 2018). CMIP5 models show that both internal variability and anthropogenic forcings are responsible for the drying over the South Atlantic Convergence Zone region, though with large uncertainties (Zilli and Carvalho, 2021). Moreover, the detection of the anthropogenic forcing on the South Atlantic Convergence Zone is strongly dependent on the characterization of model internal variability (Talento and Barreiro, 2012).
Beyond the tropics, North Pacific decadal variability (Annex IV.2.6, 2.4.5, 3.7.6) exerts a strong modulation of extratropical ENSO teleconnections, but also influences low-frequency variability of the Walker circulation, which is underestimated by most CMIP5 models (England et al., 2014). Atlantic Multi-decadal Variability (Annex IV.2.7, 2.4.6, 3.7.7) teleconnections show a high model spread among CMIP5 models, both in terms of persistence and spatial coherence (Qasmiet al., 2017), which has potential consequences for the water cycle variability simulated over Europe. For example, internal variability will continue to play an important role in the variability of river flows over France in coming decades (medium confidence) (Giuntoli et al., 2013; Boé and Habets, 2014; Bonnet et al., 2017).
Ensembles of atmosphere-only simulations driven by observed or reconstructed SST are useful for evaluating the ability of models to capture the circulation and/or precipitation variability observed over the historical period (Zhou et al., 2016; Deng et al., 2018; Douville et al., 2019). However, limitations of such AGCM-based attribution methods, that is, related to the lack of air–sea interactions in the response, may lead to erroneous attribution conclusions in some regions for local circulation and mean and extreme precipitation (Dong et al., 2017). Other methods to measure the portion of precipitation variability include the partitioning into dynamical as opposed to thermodynamical components (Saffioti et al., 2016; Fereday et al., 2018; Lehner et al., 2018), the analysis of variance (Dong et al., 2018a) and direct characterization of stochastic weather-noise (Short Gianotti et al., 2014).
Single-model initial condition large ensembles (SMILEs) are a powerful tool for estimating the magnitude of internal variability in historical and future climates (Section 1.4.4). Using SMILEs, it has been shown, for example, that internal NAO variability imparts substantial uncertainty to future changes in European precipitation (Figure 8.24; Deser et al., 2017). For the South Asian summer monsoon, internal variability can overshadow the forced monsoon rainfall trend, thereby increasing near-term projection uncertainties (X. Huang et al., 2020a). Specific regional applications of the use of large ensembles are further assessed in Sections 10.3.4.3 and 10.3.4.4.
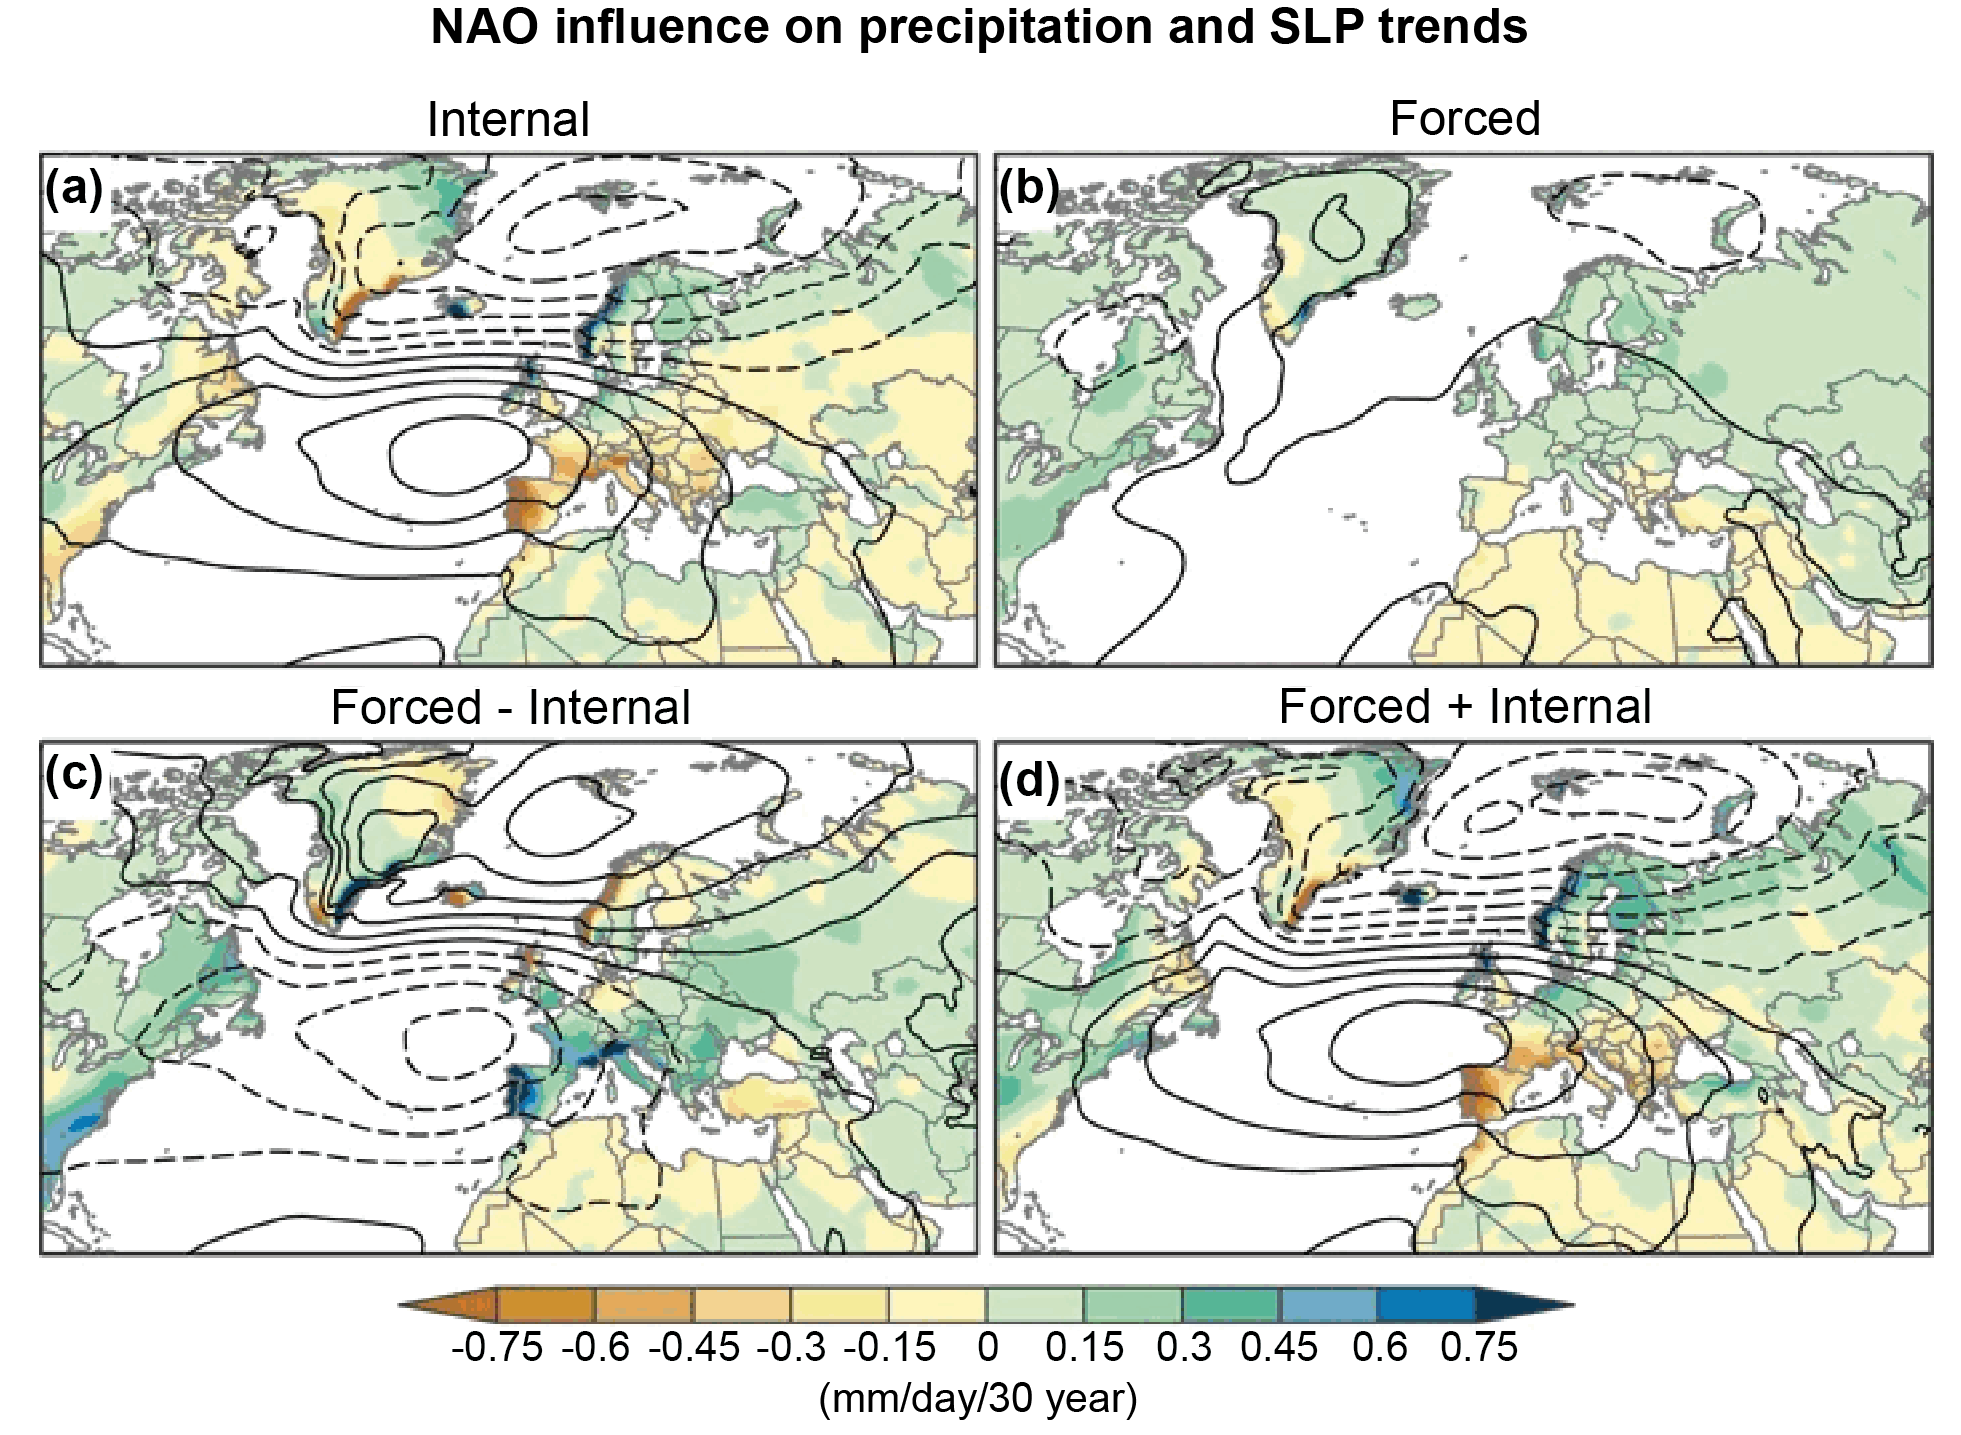 Figure 8.24 | Impact of the North Atlantic Oscillation (NAO) on2016–2045climate trends. (a) Regressions of winter sea level pressure (SLP) and precipitation trends upon the normalized leading principal component (PC) of winter SLP trends in the CESM1 Large Ensemble, multiplied by two to correspond to a two standard deviation anomaly of the PC (as internal climate variability component); (b) CESM1 ensemble-mean winter SLP and precipitation trends (as forced climate variability component); (c) b – a (forced minus internal climate variability component); (d) b + a (forced plus internal climate variability component). Precipitation in colour shading (mm day–1 per 30 years) and SLP in contours (interval = 1 hPa per 30 years with negative values dashed). Figure adapted from Deser et al. (2017), https://creativecommons.org/licenses/by/4.0/; further details on data sources and processing are available in the chapter data table (Table 8.SM.1).
 Since AR5, SMILEs have helped quantify the time of emergence of climate change signals (see Sections 1.4.2.2 and 10.4.3). Results from SMILEs indicate that by 2000–2009 (compared to 1950–1999), simulated anthropogenic shifts in mean annual precipitation already emerged over 36–41% of the globe including high latitudes (Frankcombe et al., 2018; Kumar and Ganguly, 2018), the eastern subtropical oceans, and the tropics (Zhang andDelworth, 2018). By 2050 (2100), more than 60% (85%) of the globe is projected to show detectable anthropogenic shifts in mean annual precipitation (Zhang andDelworth, 2018). Other SMILE results for the 1950–2100 period (Kay et al., 2015; Sigmond and Fyfe, 2016) indicate that internal variability can obscure the detection of the anthropogenic hydroclimatic signal until the middle to late 21st century in many parts of the world for both mean and extreme precipitation (Martel et al., 2018; Dai and Bloecker, 2019). A common finding is that changes in the characteristics of wet extreme events will emerge earlier than changes in average conditions (Gaetani et al., 2020; Hawkins et al., 2020; Kusunoki et al., 2020). An assessment of the methods used to estimate time of emergence is presented in Chapter 10 (Section 10.3.4.3). For specific regional examples of climate change attribution and emergence of anthropogenic signal, see Section 10.4.2.
In summary, there is medium confidence that climate models reproduce the general magnitude and character of internal variability that influences water cycle variables. There is high confidence that internal variability will continue to be a major source of uncertainty, at least for near-term water cycle projections at the regional scale. There is low confidence in the region-dependent time of emergence of water cycle changes (see also Section 10.4.3), but there is medium confidence that changes in wet extreme events will emerge earlier than changes in average conditions.
8.5.2.2 Implications for Near-Term Water Cycle Projections
Adapting water resource management in the face of climate change will greatly benefit from improved prediction of land surface hydrology at the decadal time scale. Climate predictions (Section 1.4.4) differ from climate projections by constraining the initial state of the slow components of the climate system (i.e., the ocean, the cryosphere and the terrestrial hydrology) as well as volcanic aerosols and ozone depleting substances with observations. Anthropogenic and natural radiative forcing and low-frequency modes of variability (e.g., AMV and PDV, Annex IV.2.7 and IV.2.6) suggest the possible predictability of climate in the first decade or so of the 21st century, in addition to the projected response to the anthropogenic forcing (Sections 4.2.3 and 4.4.1.3).
In AR5, decadal prediction of precipitation over some land areas showed improved skill due to specified radiative forcing, with almost no added value from ocean initialization. Since AR5, more studies have been devoted to understanding the potential or effective water cycle predictability related to ocean multi-decadal variability. Decadal hindcast experiments based on large ensembles highlight increasing skill scores in annual mean precipitation three to seven years ahead, at least over the Sahel and Europe (Yeager et al., 2018). There is relatively high predictability of the AMV impacts over the Mediterranean basin, Central Asia and the Americas (from the USA to northern South America) during boreal summer, but in boreal winter the signal-to-noise ratio shows only weak predictability over land (Yamamoto and Palter, 2016; Ruprich-Robert et al., 2017). The link between South Asian summer monsoon changes and the AMOC and the decadal variability in the Pacific Ocean open the possibility of increased predictability for the near future (Kushnir et al. , 2017; X. Huang et al. , 2020b; Sandeep et al., 2020).
The additional skill associated with the initialization of the cryosphere and the land surface has received limited attention. However, there is observational evidence that oceanic decadal variations can propagate into the atmosphere and, consequently accumulate into terrestrial land surface reservoirs(e.g., Bonnet et al., 2017) and vegetation (e.g., Zeng et al., 1999). This land surface memory, like in soil moisture (Alessandri and Navarra, 2008; Catalano et al., 2016) or snow(Loranty et al., 2014), may also contribute to the decadal predictability of the terrestrial component of the water cycle, but remains difficult to assess given the limitations of observational records. Vegetation initialization seems to generate as much noise as signal and does not necessarily translate into improved skill in early decadal predictions based on ESMs (Weiss et al., 2014).
Decadal hydrological predictability in an idealized setting has also been investigated through offline land surface hindcast experiments, driven by observed atmospheric forcing and/or initial conditions, suggesting the potential for skilful predictions for terrestrial water storage, deep soil moisture, and groundwater (Yuan and Zhu, 2018). Yet, a real-world assessment is hampered by the lack of observations and is only feasible when multi-decadal records of satellite estimates of terrestrial water storage, snow mass or soil moisture are available.
In summary, there is high confidence that the water cycle changes that have already emerged from internal variability will become more pronounced in near-term (2021–2040) projections. However, there is low confidence in decadal predictions of precipitation changes, particularly over most land areas, because internal variability remains difficult to predict and can offset or amplify the forced water cycle response.
8.5.2.3 Volcanic Forcing
Volcanic eruptions can affect climate projections in the near term (2021–2040; Section 4.4.4 and Cross-Chapter Box 4.1). In this chapter, they are of interest because they can trigger a transient departure from the water cycle response to anthropogenic radiative forcing. Major volcanic eruptions temporarily reduce total global and wet tropical region precipitation (high confidence) (Iles and Hegerl, 2014), can weaken or shift the ITCZ (Iles and Hegerl, 2014; Colose et al., 2016; Liu et al., 2016), and reduce summer monsoon rainfall (medium confidence) (Pausata et al. , 2015b; Zambri and Robock, 2016; Zambri et al. , 2017; Zuo et al. , 2019; M. Singh et al. , 2020). Monsoon precipitation in one hemisphere can be enhanced by the remote volcanic forcing occurring in the other hemisphere (medium confidence) (Pausata et al. , 2015a; Liu et al. , 2016; Zuo et al. , 2019). Over the Sahel, the sign of hydrological changes depend on the hemisphere where the volcanic eruptions occur (J.M. Haywood et al., 2013). Out of phase changes in the Sahel and the Amazonian basin are expected from the effect of volcanic aerosols on tropical Atlantic SST and the ITCZ (Hua et al., 2019). Over the last millennium, uncertainties remain in the symmetry/asymmetry of the monsoon response because it is difficult to estimate the exact latitude and season of past volcanic eruptions further back in time (Colose et al., 2016; Fasullo et al., 2019).
Data for six major eruptions over the last century along with CMIP5 historical experiments indicate that volcanic eruptions cause a detectable decrease in streamflow in northern South America, Central Africa, high-latitude Asia and in wet tropical–subtropical regions, and a detectable increase in south-western North America and southern South America (Iles and Hegerl, 2015). Attempts to include volcanic forcing in future projections show enhanced precipitation variability on annual to decadal time scales with small reductions in Asian monsoon rainfall (Bethke et al., 2017). The occurrence of volcanic eruptions in the coming century, either as single large events or clustered smaller ones, can alter the water cycle (see also Cross-Chapter Box 4.1), and regional drought events may be enhanced by co-occurring volcanic (Liu et al., 2016; Gao and Gao, 2017; Zambri et al., 2017) and GHG (e.g., Cook et al., 2018) forcing (low confidence). Volcanic eruptions may also lead to widespread precipitation anomalies up to several years following an eruption through their potential influence on the El Niño Southern Oscillation (low confidence) (Stevenson et al., 2016; Dee et al., 2020; McGregor et al., 2020).
In summary, large volcanic eruptions reduce global mean precipitation, as well as precipitation in tropical wet regions (high confidence). There is low confidence in specific regional and seasonal responses, primarily due to the limitations of the observational record.
8.5.3 Non-linearities Across Global Warming Levels
The AR5 concluded that annual and seasonal mean precipitation changes can be estimated by linear pattern-scaling techniques (Santer and Wigley, 1990; Arnell and Gosling, 2016; Greve et al., 2018), which represent regional changes in precipitation as a linear function of global mean temperature change. However, there are a number of caveats when pattern-scaling is applied to low-emissions scenarios or to scenarios where localized forcing (e.g., anthropogenic aerosols) are significant and vary in time (Collins et al., 2013). Here the focus is in on non-linear water cycle responses to increasing global warming levels, as estimated for instance fromthe difference between the first 2°C of global warming, and the next 2°C of warming (Figure 8.25), andtheir possible underlying mechanisms.
 Figure 8.25 | Effect of first versus second 2°C of global warming relative to the 1850–1900 base period on seasonal mean precipitation (mm day–1). CMIP6 multi-model ensemble mean December–January–February (left panels) and June–July–August (right panels) precipitation difference for (a, b) SSP5-8.5 at +2°C (c, d) SSP5-8.5 at +4°C minus SSP5-8.5 at +2°C (second 2°C warming); (e, f) second minus first 2°C fast warming (c–a and d–b). Only models reaching the +4°C warming levels in SSP5-8.5 are considered. Differences are computed based on 21-year time windows centred on the first year reaching or exceeding the selected global warming level using a 21-year running mean global surface atmospheric temperature criterion. Uncertainty is represented using the simple approach. No overlay indicates regions with high model agreement, where ≥80% of models agree on sign of change. Diagonal lines indicate regions with low model agreement, where <80% of models agree on sign of change. For more information on the simple approach, please refer to the Cross-Chapter Box Atlas.1. Further details on data sources and processing are available in the chapter data table (Table 8.SM.1).
 8.5.3.1 Non-linearities in Large-scale Atmospheric Circulation and Precipitation
Since AR5, there is further evidence that the pattern-scaling technique has limitations (Lopez et al., 2014; Wartenburger et al., 2017; Tachiiri et al., 2019), and that alternative approaches, such as multiple regressions using the land–sea warming contrast as an additional predictor, offer added value (Joshi et al., 2013). The simplest traditional pattern-scaling approach approximates future changes by the product of a time-evolving global surface temperature change and a pattern that varies spatially but is constant across time, scenarios, and models. This technique was shown to be more robust across scenarios rather than across models, with better results for temperature compared with precipitation (Tebaldi and Arblaster, 2014; see also Section 4.2.4). One approach which avoids scaling is to consider a period in a different scenario with the same global surface temperature change (Herger et al., 2015). It is attractive as it provides patterns of any temporal resolution that are consistent across variables. Nonetheless, this technique is still only based on global surface temperature and is not necessarily suitable for precipitation changes projected in stabilized versus transient scenarios (at the same global warming level) given the fast-atmospheric adjustment to GHG radiative forcing (Sections 8.2.1 and 8.4.1.1).
Even in a theoretical climate system governed by linear processes, pattern-scaling assumptions can fail because the different forcing time response of different parts of the Earth system cause evolving spatial warming patterns (Good et al., 2016a). This occurs primarily because different feedbacks occur at different time scales (Armour et al., 2013; Andrews et al., 2015), which in turn implies that the atmospheric circulation and water cycle is dependent both on the level of warming and the rate of change (Ceppi et al., 2018). The usual distinction between the fast adjustment to increased GHG concentrations and the slower response to SST warming (Section 8.2.2.2) may, however, not be sufficient to explain the time evolution of the hydroclimatic response at the regional scale, especially in subtropical land areas where this response critically depends on shifts in atmospheric circulation associated with distinct ‘fast’ (typically five to ten years, that is however much slower than the atmospheric adjustment assessed in Section 8.2.1) and slow SST warming patterns (Zappa et al., 2020). The changing balance between the water cycle response to anthropogenic GHG and aerosol forcings is another source of non-linearity across time and global warming levels (Ishizaki et al. , 2013; Rowell et al. , 2015; Y. Liu et al. , 2019b; Wilcox et al., 2020).
Non-linearities in the climate response are thought to arise from multiple factors. These include state-dependent ice-albedo feedback and its potential influence on Northern Hemisphere (NH) storm tracks (Peings and Magnusdottir, 2014; Semenov and Latif, 2015; see also Cross-Chapter Box 10.1 and Section 8.6.1.2); a state-dependent sensitivity of tropical precipitation to increased SST (Schewe and Levermann, 2017; He et al., 2018); a complex response of the Atlantic meridional overturning circulation (AMOC; Sections 9.2.4.1 and 8.6.1.1) and its model- and magnitude dependent teleconnections with regional temperature and precipitation (Kageyama et al., 2013; Jackson et al., 2015; Qasmi et al., 2017, 2020); and other atmospheric and terrestrial (Section 8.5.3.2) processes such as cloud and land surface feedbacks (Ceppi and Gregory, 2017; King, 2019). The response of convective precipitation may exhibit non-linearities because it is itself modulated by both dynamics and atmospheric water content, each responding independently to warming (Chadwick and Good, 2013; Neupane and Cook, 2013).
Based on a simple model, it was also suggested that the Indian summer monsoon may exhibit a moisture-advection feedback which allows multiple stable states as boundary conditions change (Zickfeld et al., 2005). However, limitations of this theory and comprehensive GCMs suggest a near-linear monsoon response to a broad range of radiative forcings (Boos and Storelvmo, 2016). Non-linear precipitation responses to global warming have been reported in the Indo-Pacific, where a linear increase in SSTs can trigger non-linear changes in precipitation and a shift in the ITCZ depending on the relative amplitudes of uniform and structured SST anomalies (C.T.Y. Chung et al., 2014; Toda and Watanabe, 2018).
Compared to atmospheric circulation and seasonal mean precipitation, extreme precipitation has been found to scale more accurately with local and global mean temperature (Chou et al., 2012; Pendergrass et al., 2015). The projected increase in the magnitude of extreme precipitation is generally proportional to the global warming level, with an increase of around 7% per 1°C warming (Section 11.4.5) although this rate shows seasonal and geographical variations and is slightly less for five-day than for one-day precipitation maxima. Projected changes in extreme precipitation are the result of both thermodynamical and more model-dependent and potentially less linear dynamical contributions (Pfahl et al., 2017). Projected changes in precipitation extremes are also potentially sensitive to a non-linear response of spatial convective organization (Pendergrass et al., 2016), and can exhibit a quadratic rather than linear response to global warming (Pendergrass et al., 2019).
Within CMIP6, the linearity to CO2 forcing can be assessed through the comparison of the model response to abrupt doubling compared with abrupt quadrupling of atmospheric CO2 (Webb et al., 2017). Preliminary analyses based on CMIP5 models showed that annual precipitation changes following a doubling step change in CO2 from pre-industrial levels are not necessarily consistent with the response to the step from doubling to quadrupling despite a similar change in radiative forcings (Good et al., 2016a; Ceppi and Shepherd, 2017). Beyond the visual comparison of the climate response at various global warming levels (e.g., Figure 4.35), the linearity across global warming levels can be assessed by using the highest emissions scenario and comparing seasonal mean relative precipitation changes at +2°C versus +4°C above pre-industrial (1850–1900) temperatures (Figure 8.25). The results support the previous finding (Good et al., 2016b) that a second 2°C warming does not necessarily lead to the same precipitation anomaly pattern as the first 2°C, especially in the tropics where regional differences can be large but not necessarily consistent among different models. They are also consistent with a recent analysis of CMIP5 models showing that the projected drying in the Mediterranean and in Chile is substantially faster than the increase in GSAT, and therefore does not scale linearly with global warming (Zappa et al., 2020).
In summary, there is high confidence that continued global warming will further amplify GHG-induced changes in large-scale atmospheric circulation and precipitation. Nonetheless, there are cases where regional water cycle changes are not linearly related to global warming due to the interaction of multiple forcings, feedbacks and time scales (medium confidence, see also Sections 4.2.4, 7.4.3 and 8.2.1). Aridity in subtropical regions is highly sensitive to fast shifts in large-scale atmospheric circulation so are particularly susceptible to such non-linearities.
8.5.3.2 Non-linearities in Land Surface Processes and Feedbacks
Land surface responses and feedbacks represent a potential source of non-linearity for the water cycle response, at least at regional and local scales. The forced response of soil moisture and freshwater resources not only depends on precipitation, but also on evaporation (Laîné et al., 2014), snowmelt (Thackeray et al., 2016), and runoff(X. Zhang et al., 2018) which are intrinsically non-linear processes depending on soil moisture or temperature thresholds. Bare ground evaporation is, for instance, usually estimated as a non-linear function of surface soil moisture (Jefferson and Maxwell, 2015). Plant transpiration requires more complex formulations with non-linear dependencies on multiple environmental factors including root-zone soil moisture and atmospheric CO2 concentration (Franks et al., 2017). Globally, land surface evaporation is both energy and soil-moisture limited, but one of these limitations can become dominant depending on regions and seasons. Non-linearities may be particularly strong in transitional regimes where and when soil moisture limitation plays a major role (Berg and Sheffield, 2018b).
Snowmelt is a nonl-inear process and projected changes in snowfall are also a non-linear combination of changes in total precipitation and in the fraction of solid precipitation. In cold regions, snowfall may first increase because of the increased water capacity of a warmer atmosphere and then decrease because snow falls as rain in an even warmer atmosphere. Such non-linearities can contribute to elevation, latitudinal and seasonal contrasts in the observed and projected retreat of the Northern Hemisphere (NH) snow cover (Shi and Wang, 2015; Thackeray et al., 2016). Mountain glaciers also represent source of non-linear runoff responses since the annual runoff can first increase due to additional melting and then decrease as the glaciers shrink (Kraaijenbrink et al., 2017; Shannon et al., 2019). Section 9.5.1.3 concludes with high confidence that the average annual runoff from glaciers will generally reach a peak at the latest by the end of the 21st century, and decline thereafter. This peak may have already occurred for small catchments with little ice cover, but tends to occur later in basins with large glaciers. Permafrost thawing is another mechanism which can trigger a non-linear hydrological response in the high latitudes of the NH(Walvoord and Kurylyk, 2016), whose magnitude and potential abruptness is assessed in Section 5.4.3.3.
Land surface runoff and groundwater recharge are highly non-linear process, depending for instance on rainfall intensity, soil infiltration capacity, vertical profile of soil moisture and water table depth. A non-linear relationship between rainfall and groundwater recharge was observed in the tropics where intense seasonal rainfalls associated with internal climate variability contribute disproportionately to recharge (R.G. Taylor et al. , 2013a; Cuthbert et al. , 2019a). Groundwater fluxes in arid regions are generally less responsive to climate variability than in humid regions, which can temporarily buffer climate change impacts on water resources or lead to a long, initially hidden, hydrological responses to global warming (Cuthbert et al., 2019a). Hydrological model simulations driven by individual and combined forcing show that decreased precipitation can cause larger deficits in soil moisture, streamflow and water table depth than other forcings, but also that these factors are not linearly cumulative when applied in combination (Hein et al., 2019). Surface runoff was found to scale only approximately with global warming (Tanaka et al., 2017). Significant non-linearities were found in the projected annual mean runoff response to global warming in CMIP5 projections, which could not be entirely explained by precipitation changes(X. Zhang et al., 2018). Similar non-linear behaviours are found in CMIP6 models over the Amazon, Yangtze, Niger, Euphrates and Mississippi river basins (Figure 8.26), highlighting the need to reassess the assumption of linearity when estimating regional water cycle changes.
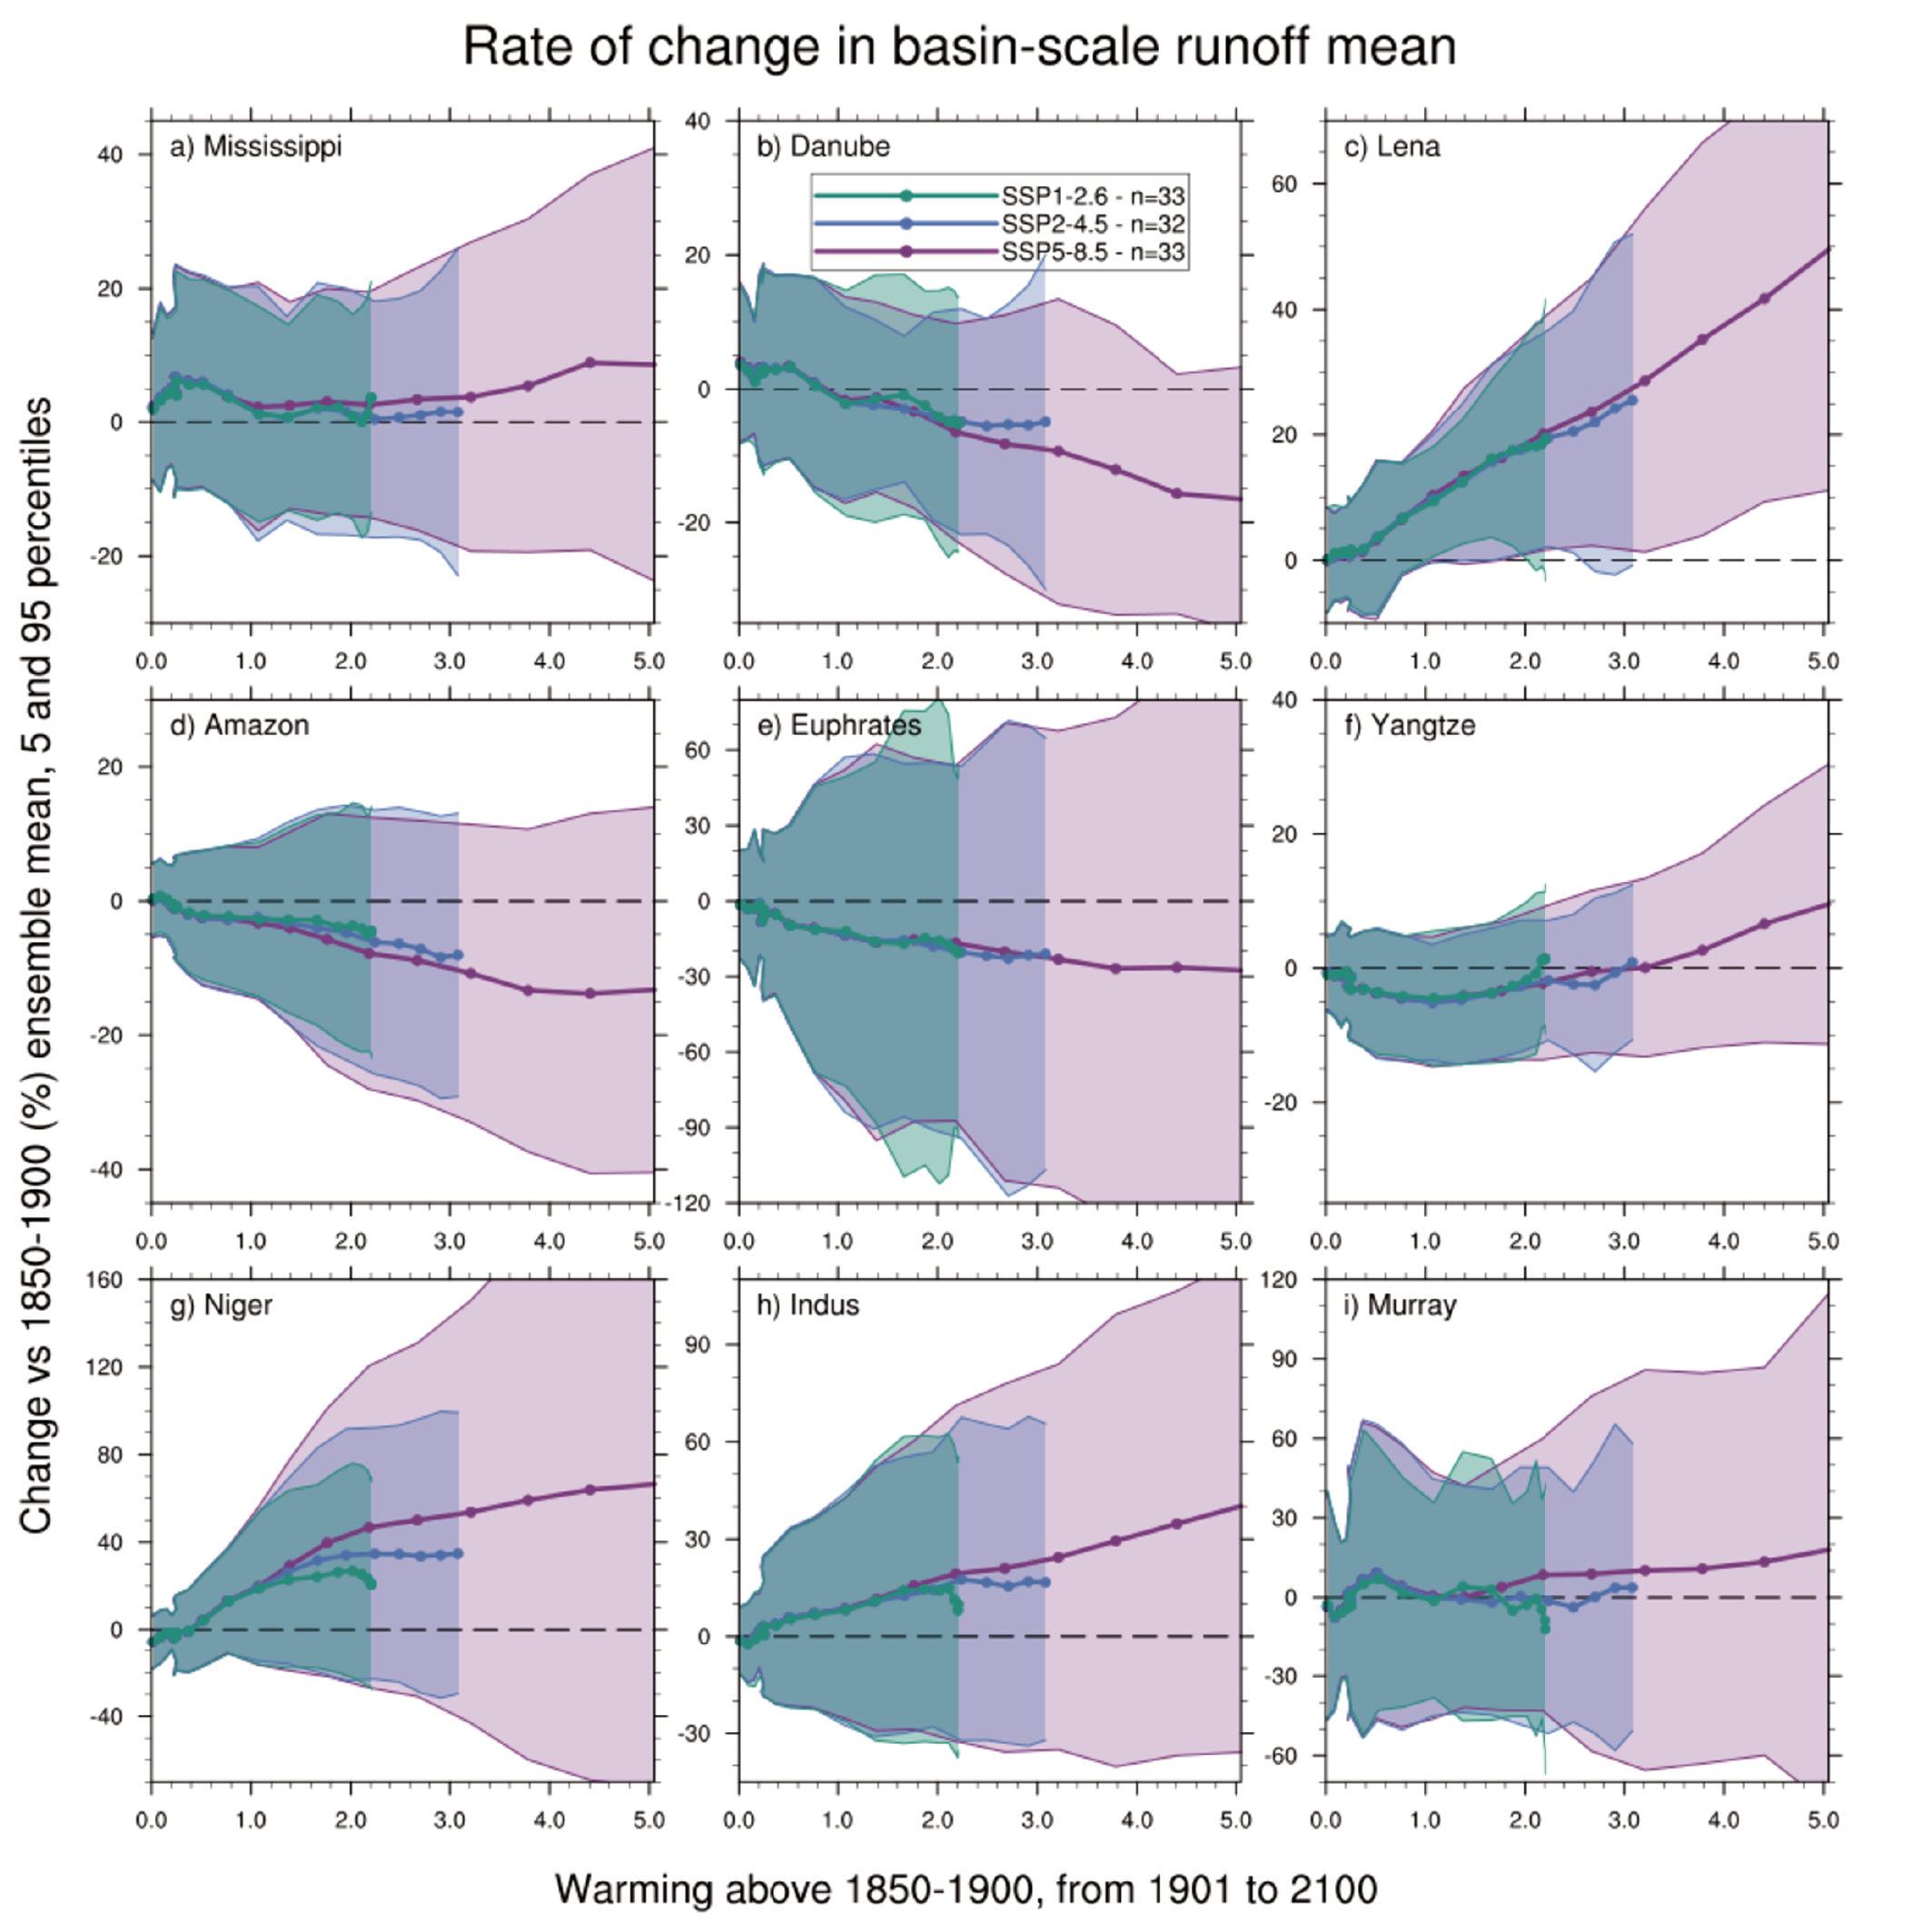 Figure 8.26 | Rate of change in basin-scale annual mean runoff with increasing global warming levels. Relative changes (%) in basin-averaged annual mean runoff estimated as multi-model ensemble median from a variable subset of CMIP6 models for each SSP over nine major river basins: (a) Mississippi, (b) Danube, (c) Lena, (d) Amazon, (e) Euphrates, (f) Yangtze, (g) Niger, (h) Indus, and (i) Murray. The basin averages have been estimated after a first-order conservative remapping of the model outputs on the 0.5° by 0.5° river network of Decharme et al. (2019). The shaded area indicates the 5–95% confidence interval of the ensemble values across all SSPs. Note that the y-axis range differs across basins and is particularly large for Niger and Murray (panels g and i). The number of models considered is specified for each scenario in the legend located inside panel b. Further details on data sources and processing are available in the chapter data table (Table 8.SM.1).
 Beyond changes in land surface water fluxes, non-linearities in the response of soil moisture and freshwater reservoirs have not been well documented in global climate projections but deserve further attention given the complex interactions between the water, energy and carbon cycles (Berg and Sheffield, 2018a), the growing direct human influence on rivers and groundwater (Abbott et al., 2019), and a possible offset between the linear components of changes in precipitation and evapotranspiration. Significant non-linearities were found in water scarcity projections, as seen by the stronger sensitivity to the first 2°C increase in global warming (Gosling and Arnell, 2016).
In summary, there is both numerical and process-based evidence that terrestrial water cycle changes can be non-linear at the regional scale (high confidence). Non-linear regional responses of runoff, groundwater recharge and water scarcity have been documented based on both CMIP5 and CMIP6 models, and highlight the limitations of simple pattern-scaling techniques (medium confidence). Water resources fed by melting glaciers are particularly exposed to such non-linearities (high confidence).
8.6 What Is the Potential for Abrupt Change?
In this Report, abrupt change is defined as a regional-to-global scale change in the climate system that occurs faster than the typical rate of changes in its history, implying non-linearity in the climate response (see Glossary). Often, abrupt change arises from positive feedbacks in the climate system that cause the current state to become unstable, and cross a ‘tipping point’ (Lenton et al., 2008); that is, a rapid shift from one climate state to another. The water cycle has several attributes with potential to produce abrupt change. Non-linear interactions between the ocean, atmosphere, and land surface can result in rapid shifts between wet and dry states (Sections 8.6.1 and 8.6.2). Cessation of solar radiation modification could also result in abrupt changes in the water cycle (Section 8.6.3). This section reviews these types of abrupt shifts and assesses the likelihood that they will occur by 2100.
8.6.1 Abrupt Water Cycle Responses to a Collapse of Atlantic Meridional Overturning Circulation
Multiple lines of evidence, including both paleoclimate reconstructions and simulations, suggest that a severe weakening or collapse of Atlantic Meridional Overturning Circulation (AMOC, see Glossary) causes abrupt and profound changes in the global hydrological cycle (Chiang and Bitz, 2005; Broccoli et al., 2006; Chiang and Friedman, 2012; Jackson et al., 2015; Renssen et al., 2018). Deep water formation in the North Atlantic is dependent on a delicate balance of heat and salt fluxes (Buckley and Marshall, 2016); disruption in either of these due to melting ice sheets, a change in precipitation and evaporation, or ocean circulation can force AMOC to cross a tipping point (SROCC; Drijfhout et al., 2015). During the last deglacial transition, one such slowdown in AMOC – during the Younger Dryas event (12,800–11,700 years ago)– caused worldwide changes in precipitation patterns. These included a southward migration of the tropical ITCZ (Peterson et al., 2000; McGee et al., 2014; Schneider et al., 2014; Mohtadi et al., 2016; Reimi and Marcantonio, 2016; P.X. Wang et al., 2017) and systematic weakening of the African and Asian monsoons (Tierney and DeMenocal, 2013; Otto-Bliesner et al. , 2014; Cheng et al. , 2016; Grandey et al. , 2016; Wurtzel et al. , 2018). Conversely, the Southern Hemisphere (SH) monsoon systems intensified (Cruz et al. , 2005; Ayliffe et al. , 2013; Stríkis et al. , 2015, 2018; Campos et al. , 2019). Drying occurred in Meso-America (Lachniet et al., 2013) while the North American monsoon system was largely unaffected (Bhattacharya et al., 2018). The mid-latitude region in North America was wetter (Polyak et al. , 2004; Grimm et al. , 2006; Wagner et al. , 2010; Voelker et al. , 2015), while Europe was drier (Genty et al., 2006; Rach et al., 2017; Naughton et al., 2019). A transient coupled climate model simulation was able to reproduce the large-scale precipitation response to such an event (Figure 8.27a; Liu et al., 2009).
 Figure 8.27 | Comparison of reconstructed past and idealized future annual mean precipitation responses to an Atlantic Meridional Overturning Circulation (AMOC) collapse. (a) Model simulation of precipitation response to the Younger Dryas event relative to the preceding warm Bølling-Allerød period (base colours, calculated as the difference between 12,600–11,700 years before the present (BP) and 14,500–12,900 BP from the Transient Climate Evolution (TraCE) paleoclimate simulation of Liu et al., 2009), with paleoclimate proxy evidence superimposed on top (dots). (b) Model simulation of precipitation response to an abrupt collapse in AMOC under a doubling of 1990 CO2 levels (after W. Liu et al., 2017). Regions with rainfall rates below 20 mm yr–1 are masked. Further details on data sources and processing are available in the chapter data table (Table 8.SM.1).
 These patterns of past hydroclimatic change are relevant for future projections because it is very likely that AMOC will weaken by 2100 in response to increased greenhouse gas emissions (Section 9.2.3.1; Weaver et al. , 2012; Drijfhout et al. , 2015; Bakker et al. , 2016; Reintges et al. , 2017). Furthermore, there is medium confidence that the decline in AMOC will not involve an abrupt collapse before 2100 (Section 9.2.3.1). The response of precipitation to hypothetical AMOC collapse under elevated greenhouse gases bears resemblance to the paleoclimate response during the Younger Dryas event, with some important differences due to effects of increased CO2 on global precipitation patterns (Figure 8.27b). As with the paleoclimate events, AMOC collapse results in a southward shift in the ITCZ that is most pronounced in the tropical Atlantic. This could cause drying in the Sahel region (Defrance et al., 2017) as well as Meso-America and northern Amazonia (Parsons et al., 2014; Y. Chen et al., 2018). AMOC collapse also causes the Asian monsoon systems to weaken (Figure 8.27b; W. Liu et al., 2017) counteracting the strengthening expected in response to elevated greenhouse gases (see Section 8.4.2). Europe is projected to experience moderate drying in response to AMOC collapse (Jackson et al., 2015).
In summary, given that there is medium confidence that the decline in AMOC will not involve an abrupt collapse before 2100, there is low confidence that an AMOC-driven abrupt change in the water cycle will occur by 2100. However, if AMOC collapse does occur, it is very likely that there would be large regional impacts on the water cycle.
8.6.2 Abrupt Water Cycle Responses to Changes in the Land Surface
Changes in the land surface, including vegetation cover and dust emissions, can trigger abrupt changes in the water cycle. Plants regulate the exchange of water and energy between the land surface and the atmosphere (Section 8.2.3.3), such that sudden shifts in plant functions, types, or biomes can trigger feedbacks that have the potential to cause abrupt changes in the regional water cycle. Dust emissions, from either climatic or land use changes, affect the radiation budget and can regionally exacerbate dry extremes. Below, we assess the likelihood of abrupt changes in the water cycle for the well-studied regions of the Amazon and the Sahel, and the potential for dust emissions to amplify drought and aridity.
8.6.2.1 Amazon Deforestation and Drying
The Amazon forest plays an active role in driving atmospheric moisture transport and generating precipitation in the South American region (SRCCL; Drumond et al. , 2014; Poveda et al. , 2014; Yin et al. , 2014; Staal et al. , 2018, 2020; Agudelo et al. , 2019; Espinoza et al. , 2019). This close association between the land surface and the water cycle makes the Amazon a potential hotspot for abrupt change (Torres and Marengo, 2014). Both deforestation and drying are projected to increase by 2100, resulting in a worst-case scenario of up to a 50% loss in forest cover by 2050 (Soares-Filho et al. , 2006; Boisier et al. , 2015; ter Steege et al. , 2015; Gomes et al. , 2019). Deforestation in the Amazon also raises the probability of catastrophic fires (Brando et al., 2014). The combination of deforestation, drier conditions, and increased fire can push the rainforest ecosystem past a tipping point, beyond which there is rapid land surface degradation, a sharp reduction in atmospheric moisture recycling, an increase in the fraction of precipitation that runs off, and a further shift towards a drier climate (Staal et al. , 2015; Boers et al. , 2017; Zemp et al. , 2017; Ruiz-Vásquez et al. , 2020). A rapid drop in precipitation has a direct impact on river flows, driving basin-scale shifts from a regulated to unregulated state (Salazar et al., 2018). Regional climate modeling experiments confirm that increased deforestation leads to a drier climate, although not all models show a true tipping point, at least under present-day climatic conditions (Lejeune et al., 2015; Spracklen and Garcia-Carreras, 2015).
In AR5, some simulations using a coupled climate–carbon cycle model exhibited an abrupt dieback of the Amazon forest in future climate scenarios (Oyama and Nobre, 2003; Cox et al., 2004; Malhi et al., 2008).However, subsequent work demonstrated that abrupt Amazon dieback does not occur consistently across, or even within, Earth system models (Lambert et al., 2013; Boulton et al., 2017). The occurrence of dieback is highly dependent on both how dry the simulated climate is in the present day (Malhi et al., 2009) as well as the representation of forest structure and competitive dynamics (Levine et al., 2016). Models with a low diversity of plant characteristics and types have a higher tendency for abrupt change (Sakschewski et al., 2016). Abrupt shifts and ecosystem disruptions can occur on the sub-regional level (Pires and Costa, 2013), highlighting the need for higher-resolution modelling studies. Since AR5, CMIP6 projections suggest that a tipping point in the Amazon system may be crossed on a local or regional scale (Staal et al., 2020) but continue to be highly dependent on model biases in precipitation and the simulation of the land surface. Consequently, the timing, and probability, of an abrupt shift remains difficult to ascertain.
In summary, while there is a strong theoretical expectation that Amazon drying and deforestation can cause a rapid change in the regional water cycle, currently there is limited model evidence to verify this response, hence there is low confidence that such a change will occur by 2100.
8.6.2.2 Greening of the Sahara and the Sahel
Greening of the Sahara and Sahel regions in North Africa, in response to an increase in precipitation, has long been considered an amplifying mechanism that can lead to abrupt change. Although the high surface albedo of the desert stabilizes the energy balance of the system (Charney, 1975), greening can induce strong, positive feedbacks between the land surface and precipitation that can shift the region into a ‘Green Sahara’ state. The fact that the transition phase between a Desert Sahara and Green Sahara is not theoretically stable (Brovkin et al., 1998) creates a tipping point and allows for the possibility of an abrupt shift between dry and wet climate regimes. Paleoclimate reconstructions provide evidence of past Green Sahara states (DeMenocal and Tierney, 2012), under which rainfall rates increased by an order of magnitude (Tierney et al., 2017), leading to a vegetated landscape (Jolly et al., 1998) with large lake basins (Gasse, 2000; Drake and Bristow, 2006). The underlying driver of the Green Sahara is the periodic increase in summer insolation associated with the orbital precession cycle (Kutzbach, 1981). In this sense, Green Saharas are not direct analogues for a response to anthropogenic greenhouse gas emissions (GHGs), as these past states were forced by natural, seasonal changes in solar radiation. However, the climate dynamics of Green Sahara periods (which have global impacts, Pausata et al., 2020), and the speed of the transitions between Desert Saharas and Green Saharas, are relevant for future projections.
Since AR5, paleoclimatic studies have improved our view of the timing, spatial extent, and speed of transitions associated with the early Holocene (11,000–5,000 years ago) Green Sahara. Observed transitions into and out of Green Sahara states are always faster than the underlying forcing, in agreement with theoretical considerations (high confidence) (Tierney and DeMenocal, 2013; Shanahan et al., 2015; Tierney et al., 2017). However, there is low confidence in the duration of the transition because sedimentary records cannot typically resolve changes on decadal to multi-decadal time scales (Tierney and DeMenocal, 2013). Both paleoclimate data and modelling experiments suggest that the timing and speed of the transition was spatially heterogeneous (high confidence), with northern Saharan locations becoming drier thousands of years before more equatorial locations (Shanahan et al., 2015; Tierney et al., 2017; Dallmeyer et al., 2020). These observations are consistent with theoretical studies suggesting that spatial heterogeneity and diversity in ecosystems can mitigate the probability of catastrophic change (Van Nes and Scheffer, 2005; Bathiany et al., 2013). Conversely, low ecosystem diversity can produce local or regional ‘hot spots’ of abrupt change such as those seen in some paleoclimate records (Claussen et al., 2013).
CMIP5 and CMIP6 models, some of which include dynamic vegetation schemes, cannot simulate the magnitude, nor the spatial extent, of greening and precipitation change associated with the last Green Sahara under standard mid-Holocene (6,000 years ago) boundary conditions (high confidence) (Figure 3.11; Harrison et al. , 2014; Tierney et al. , 2017; Brierley et al. , 2020). This result remains unchanged since AR4 (Jansen et al., 2007). This may be due to climatological biases in the models (Harrison et al., 2015) or could imply that the strength of the feedbacks between vegetation and the water cycle in the models is too weak (Hopcroft et al., 2017). To date, climate models still only produce the amount and spatial extent of rainfall that is needed to sustain a Green Sahara if they are given prescribed changes in the land surface, such as albedo, soil moisture, vegetation cover and/or dust emissions (Pausata et al., 2016; Skinner and Poulsen, 2016; Tierney et al., 2017).
Some climate model simulations suggest that under future high-emissions scenarios, CO2 radiative forcing causes rapid greening in the Sahel and Sahara regions via precipitation change (Claussen et al., 2003; Drijfhout et al., 2015). For example, in the BNU-ESM RCP8.5 simulation, the change is abrupt with the percentage of bare soil dropping from 45% to 15%, and percentage of tree cover rising from 50% to 75%, within 10 years (2050–2060; Drijfhout et al., 2015). However, other modelling results suggest that this may be a short-lived response to CO2 fertilization (Bathiany et al., 2014).
In summary, given outstanding uncertainties in how well the current generation of climate models capture land surface feedbacks in the Sahel and Sahara, there is low confidence that an abrupt change to a greener state will occur in these regions before 2100 or 2300.
8.6.2.3 Amplification of Drought by Dust
Mineral dust aerosols in the climate system originate from both semi-permanent and transient sources (Prospero et al., 2002; Ginoux et al., 2012). The former are typically arid regions where significant alluvial sediments have accumulated over time, while the latter are often associated with natural (e.g., droughts, wildfires) and anthropogenic (e.g., land use change, desertification) disturbances. Modern-day dust emissions are dominated by natural sources (Ginoux et al., 2012), although human emissions may contribute 10–60% of the global atmospheric dust load (Webb and Pierre, 2018). Paleo-dust records suggest that human factors (land use change and landscape disturbance) may have doubled global dust emissions between 1750 and the last quarter of the 20th century (Section 2.2.6; Hooper and Marx, 2018).
Dust aerosols influence the climate system and hydrologic cycle through both direct impacts on radiation (absorbing and scattering longwave and shortwave) and via indirect effects on cloud and precipitation processes (Box 8.1; Choobari et al., 2014; Kok et al., 2018; Schepanski, 2018). The capacity of dust aerosols to suppress precipitation by reducing humidity and energy availability, and increasing stability in the atmosphere (Cook et al., 2013; Huang et al., 2014) can drive positive feedbacks (see also Section 6.3.6). Thus there is strong potential for dust to contribute to abrupt changes in the water cycle, especially in semi-arid regions where wind erosion is highly sensitive to vegetation cover and drought variability (Yu et al., 2015). One such event occurred over the Central USA during the 1930s: the Dust Bowl drought, an iconic event characterized by widespread land degradation and historically unprecedented levels of dust storm activity (Hansen and Libecap, 2004; Lee and Gill, 2015). While initialized by warm sea surface temperatures in the North Atlantic, modeling work indicates that land cover changes and resulting dust emissions contributed to the severity and spatial extent of the drought by further suppressing precipitation (Cook et al., 2009; Hu et al., 2018; Cowan et al., 2020). There is also increasing evidence that dust aerosol feedbacks are necessary to explain the magnitude of rainfall increase during the mid-Holocene Green Sahara (Pausata et al., 2016; Tierney et al., 2017).
The importance of dust aerosol feedbacks in future abrupt climate events, like droughts or rapid aridification, is unclear. In part, this is because the response of dust aerosol emissions and loading levels in the atmosphere to climate change is highly uncertain (Tegen and Schepanski, 2018; Webb and Pierre, 2018). This difficulty in predicting future dust responses is rooted in the fact that emissions depend on both changes to the land surface (e.g., land use/land cover change, aridification, ecological responses to climate change) and the state of the atmosphere (Tegen and Schepanski, 2018). While there is some evidence that global dust aerosol concentrations in the future will increase (Allen et al., 2016; Tegen and Schepanski, 2018), it is highly dependent on changes in precipitation patterns and atmospheric circulation (see the SRCCL, Section 2.4.1), and it is not clear what the radiative impact will be (Allen et al., 2016; Kok et al., 2018).
In summary, due to limited evidence, there is low confidence regarding the role of dust in abrupt climate change events over the next century.
8.6.3 Abrupt Water Cycle Responses to Initiation or Termination of Solar Radiation Modification
Solar radiation modification (SRM) techniques seek to reduce the impacts of climate change by modifying the Earth’s radiation budget, either by reflecting incoming solar radiation or increasing the amount of heat lost to space. Note that, following SR1.5, the definition of SRM in this Report refers to changes in both solar and longwave radiation (Section 4.6.3.3 and Glossary). A variety of methods have been proposed, including injection of aerosols or their precursors into the stratosphere, cloud brightening, and cirrus cloud thinning (Table 4.8). Since SRM alters the planetary energy balance, changes in the hydrological cycle are theoretically expected (Section 8.2). These changes can be abrupt if the initial magnitude of SRM is large, rather than increased gradually. Since AR5, a diversity of SRM techniques have been tested using climate model simulations, with an increasing focus on consequences for regional water availability. Techniques targeting shortwave radiation (sulfate injection, surface albedo modification, cloud brightening) are likely to reduce global mean precipitation relative to future CO2 -emissions scenarios (Bala et al. , 2008; A. Jones et al. , 2013; Tilmes et al. , 2013; Ferraro et al. , 2014; Crook et al. , 2015). In contrast, cirrus cloud thinning, a longwave radiation technique, results in increased global precipitation as it causes enhanced radiative cooling in the troposphere (medium confidence) (Crook et al., 2015; Kristjánsson et al., 2015; Jackson et al., 2016).
The magnitude of hydrological disruption for both the initiation and termination of SRM depends on the method used, as well as the strength and duration of its implementation (Ekholm and Korhonen, 2016; Irvine et al., 2019). Under abrupt SRM implementation, hydrological shifts are rapid, occurring within the first decade (Crook et al., 2015). Artificial enhancement of albedo in Northern Hemisphere desert regions causes a southward shift in the Hadley Cell and ITCZ, and extreme drying in the northern tropics (Crook et al., 2015). Uniform or tropical stratospheric sulfate injection weakens the African and Asian summer monsoons and causes drying in the Amazon (Robock et al., 2008; Crook et al., 2015; Dagon and Schrag, 2016). Changes in evapotranspiration can produce large deficits or surpluses in soil moisture and runoff in different regions and seasons (Dagon and Schrag, 2016).
Rapid changes (years to decades) in the hydrological cycle are also expected if SRM is terminated abruptly, either purposefully or because of technical failure or political disagreement. We reiterate the AR5 conclusion that if SRM ‘were terminated for any reason, there is high confidence that surface temperatures would increase rapidly (within a decade or two) to values consistent with the GHG forcing’. The additional global warming caused by SRM termination mayresult in a rapid increase in global mean precipitation (medium confidence) (A. Jones et al., 2013). Heterogenous regional and seasonal changes are also expected, but are model-dependent (A. Jones et al., 2013). As with SRM initiation, the impact of SRM termination is expected to be dependent on the technique deployed.
In summary, it is very likely that abrupt water cycle changes will occur if SRM is abruptly initiated or halted, especially in tropical regions. Further assessment of the potential side-effects of SRM is found in Section 4.6.3.3.
8.7 Final Remarks
Despite the advances presented in this chapter, there are still many opportunities to improve the understanding and quantification of human influence on past, present and future water cycle changes:
- Extension and development of pre-instrumental data and paleoclimate records, particularly from the Southern Hemisphere, will improve estimates of the range of natural climate variability and extremes, and our knowledge of how the water cycle responded in past high CO2 climates.
- Development of longer observational time series that will improve our understanding of physical processes and the analysis and simulation of natural modes of weather and climate variability.
- The use of large model ensembles will help better understand the interactions between climate change and internal variability and in the detection and attribution of observed water cycle changes.
- An improvement of the general circulation model (GCM)-simulated precipitation, latent heating and radiative effects of deep convective clouds would benefit from an improved representation of their interactions with aerosols.
- Further research on land surface processes, including groundwater recharge, the role of plant physiological changes, land use change, dams and irrigation, will improve future projections of key aspects of the terrestrial water cycle such as aridity and drought.
- Ongoing efforts to develop higher-resolution ‘convection permitting’ regional or global climate models will lead to an improved simulation of clouds and precipitation, their coupling with boundary layer and surface processes, their diurnal cycle and high-frequency variability, and their response to climate change, including extreme precipitation events.
- Further analysis of past and current climate variability alongside future climate change projections will provide physically understood constraints for improving the accuracy of regional water cycle simulations, adding value to the results obtained from global climate models.
- Increased understanding of internal variability and interactions with human-induced change will improve efforts to attribute changes in the water cycle and to understand and anticipate future non-linear change.
Acknowledgements
The authors are extremely grateful to the WGI Bureau and Technical Support Unit for their outstanding support throughout the writing of the chapter. Special thanks to Sarah Connors for her exceptional contribution to the development of this chapter. Her help with chapter meetings and organizational support was invaluable. Thanks to Sophie Berger, Melissa Gomis, Nigel Hawtin and Tom Maycock for their contributions to figures and tables. We must also make a special acknowledgment of our chapter scientists, Sabin Thazhe Purayil and Stéphane Sénési, without whom we could not have completed our assessment nor could we have produced the excellent figures that appear in the chapter. We would also like to thank all reviewers for their useful comments. Finally, we are infinitely indebted to our families for their extended patience and support during this demanding process.
Frequently Asked Questions
FAQ 8.1 | How Does Land Use Change Alter the Water Cycle?
The ways in which humans use and change land cover, for example by converting fields to urban areas or clearing forests, can affect every aspect of the water cycle. Land-use changes can alter precipitation patterns and how water is absorbed into the ground, flows into streams and rivers, or floods the land surface, as well as how moisture evaporates back into the air. Changes in any of these aspects of the interconnected water cycle can affect the entire cycle and the availability of freshwaterresources.
Land use describes the combination of activities and ground cover defining each area of the Earth’s continental surface. Altering land use can modify the exchange of water between the atmosphere, soil and subsurface (FAQ 8.1, Figure 1).
For instance, changes in land cover can affect the ability of soils to soak up surface water (infiltration). When soil loses its capacity to soak up water, precipitation that would normally infiltrate and contribute to groundwater reserves will instead overflow, increasing surfacewater (runoff) and the likelihood of flooding. For example, changing from vegetation to urban cover can cause water to flow rapidly over buildings, roads and driveways and into drains rather than soaking into the ground. Deforestation over wide areas can also directly reduce soil moisture, evaporation and rainfall locally but can also cause regional temperature changes that affect rainfall patterns.
Extracting water from the ground and river systems for agriculture, industry and drinking water depletes groundwater and can increase surface evaporation because water that was previously in the ground is now in direct contact with the atmosphere, being available for evaporation.
Changing land use can also alter how wet the soil is, influencing how quickly the ground heats up and cools down and the local water cycle. Drier soils evaporate less water into the air but heat up more in the day. This can lead to warmer, more buoyant plumes of air that can promote cloud development and precipitation if there is enough moisture in the air.
Changes in land use can also modify the amount of tiny aerosol particles in the air. For instance, industrial and domestic activities can contribute to aerosol emissions, as do natural environments such as forests or salt lakes. Aerosols cool down global temperature by blocking out sunlight but can also affect the formation of clouds and therefore the occurrence of precipitation (see FAQ 7.2).
Vegetation plays an important role in soaking up soil moisture and evaporating water into the air (transpiration) through tiny holes (stomata) that allow the plants to take in carbon dioxide. Some plants are better at retaining water than others, so changes in vegetation can affect how much water infiltrates into the ground, flows into streams and rivers, or is evaporated.
More globally, land-use change is currently responsible for about 15% of the emissions of carbon dioxide from human activities, leading to global warming, which in turn affects precipitation, evaporation, and plant transpiration. In addition, higher atmospheric concentrations of carbon dioxide due to human activities can make plants more efficient at retaining water because the stomata do not need to open so widely. Improved land and water management (e.g., reforestation, sustainable irrigation) can also contribute to reducing climate change and adapting to some of its adverse consequences.
In summary, there is abundant evidence that changes in land use and land cover alter the water cycle globally, regionally and locally, by changing precipitation, evaporation, flooding, groundwater, and the availability of freshwater for a variety of uses. Since all the components of the water cycle are connected (and linked to the carbon cycle), changes in land use trickle down to many other components of the water cycle and climate system.

FAQ 8.1, Figure 1 | Land-use changes and their consequences on the water cycle. As all the components or the water cycle are tightly connected, changes in one aspect of the cycle affects almost all the cycle.
FAQ 8.2 | Will Floods Become More Severe or More Frequent as a Result of Climate Change?
A warmer climate increases the amount and intensity of rainfall during wet events, and this is expected to amplify the severity of flooding. However, the link between rainfall and flooding is complex, so while the most severe flooding events are expected to worsen, floods could become rarer in someregions.
Floods are a natural and important part of the water cycle but they can also threaten lives and safety, disrupt human activities, and damage infrastructure. Most inland floods occur when rivers overtop their banks (fluvialflooding) or when intense rainfall causes water to build up and overflow locally (pluvialflooding). Flooding is also caused by coastal inundation by the sea, rapid seasonal melting of snow, and the accumulation of debris, such as vegetation or ice, that stops water from draining away.
Climate change is already altering the location, frequency and severity of flooding. Close to the coasts, rising sea levels increasingly cause more frequent and severe coastal flooding, and the severity of these floods is exacerbated when combined with heavy rainfall. The heavy and sustained rainfall events responsible for most inland flooding are becoming more intense in many areas as the climate warms because air near Earth’s surface can carry around 7% more water in its gas phase (vapour) for each 1°C of warming. This extra moisture is drawn into weather systems, fueling heavier rainfall (FAQ 8.2, Figure 1).
A warming climate also affects wind patterns, how storms form and evolve, and the pathway those storms usually travel. Warming also increases condensation rates, which in turn releases extra heat that can energize storm systems and further intensify rainfall. On the other hand, this energy release can also inhibit the uplift required for cloud development, while increases in particle pollution can delay rainfall but invigorate storms. These changes mean that the character of precipitation events (how often, how long lasting and how heavy they are) will continue to change as the climate warms.
In addition to climate change, the location, frequency and timing of the heaviest rainfall events and worst flooding depend on natural fluctuations in wind patterns that make some regions unusually wet or dry for months, years, or even decades. These natural variations make it difficult to determine whether heavy rainfall events are changing locally as a result of global warming. However, when natural weather patterns bring heavy and prolonged rainfall in a warmer climate, the intensity is increased by the larger amount of moisture in the air.
An increased intensity and frequency of record-breaking daily rainfall has been detected for much of the land surface where good observational records exist, and this can only be explained by human-caused increases in atmospheric greenhouse gas concentrations. Heavy rainfall is also projected to become more intense in the future for most places. So, where unusually wet weather events or seasons occur, the rainfall amounts are expected to be greater in the future, contributing to more severe flooding.
However, heavier rainfall does not always lead to greater flooding. This is because flooding also depends upon the type of river basin, the surface landscape, the extent and duration of the rainfall, and how wet the ground is before the rainfall event (FAQ 8.2, Figure 1). Some regions will experience a drying in the soil as the climate warms, particularly in subtropical climates, which could make floods from a rainfall event less probable because the ground can potentially soak up more of the rain. On the other hand, less frequent but more intense downpours can lead to dry, hard ground that is less able to soak up heavy rainfall when it does occur, resulting in more runoff into lakes, rivers and hollows. Earlier spring snowmelt combined with more precipitation falling as rain rather than snow can trigger flood events in cold regions. Reduced winter snow cover can, in contrast, decrease the chance of flooding arising from the combination of rainfall and rapid snowmelt. Rapid melting of glaciers and snow in a warming climate is already increasing river flow in some regions, but as the volumes of ice diminish, flows will peak and then decline in the future. Flooding is also affected by changes in the management of the land and river systems. For example, clearing forests for agriculture or building cities can make rainwater flow more rapidly into rivers or low-lying areas. On the other hand, increased extraction of water from rivers can reduce water levels and the likelihood of flooding.
A mix of both increases and decreases in flooding have been observed in some regions and these changes have been attributed to multiple causes, including changes in snowmelt, soil moisture and rainfall. Although we know that a warming climate will intensify rainfall events, local and regional trends are expected to vary in both direction and magnitude as global warming results in multiple, and sometimes counteracting, influences. However, even accounting for the many factors that generate flooding, when weather patterns cause flood events in a warmer future, these floods will be more severe.
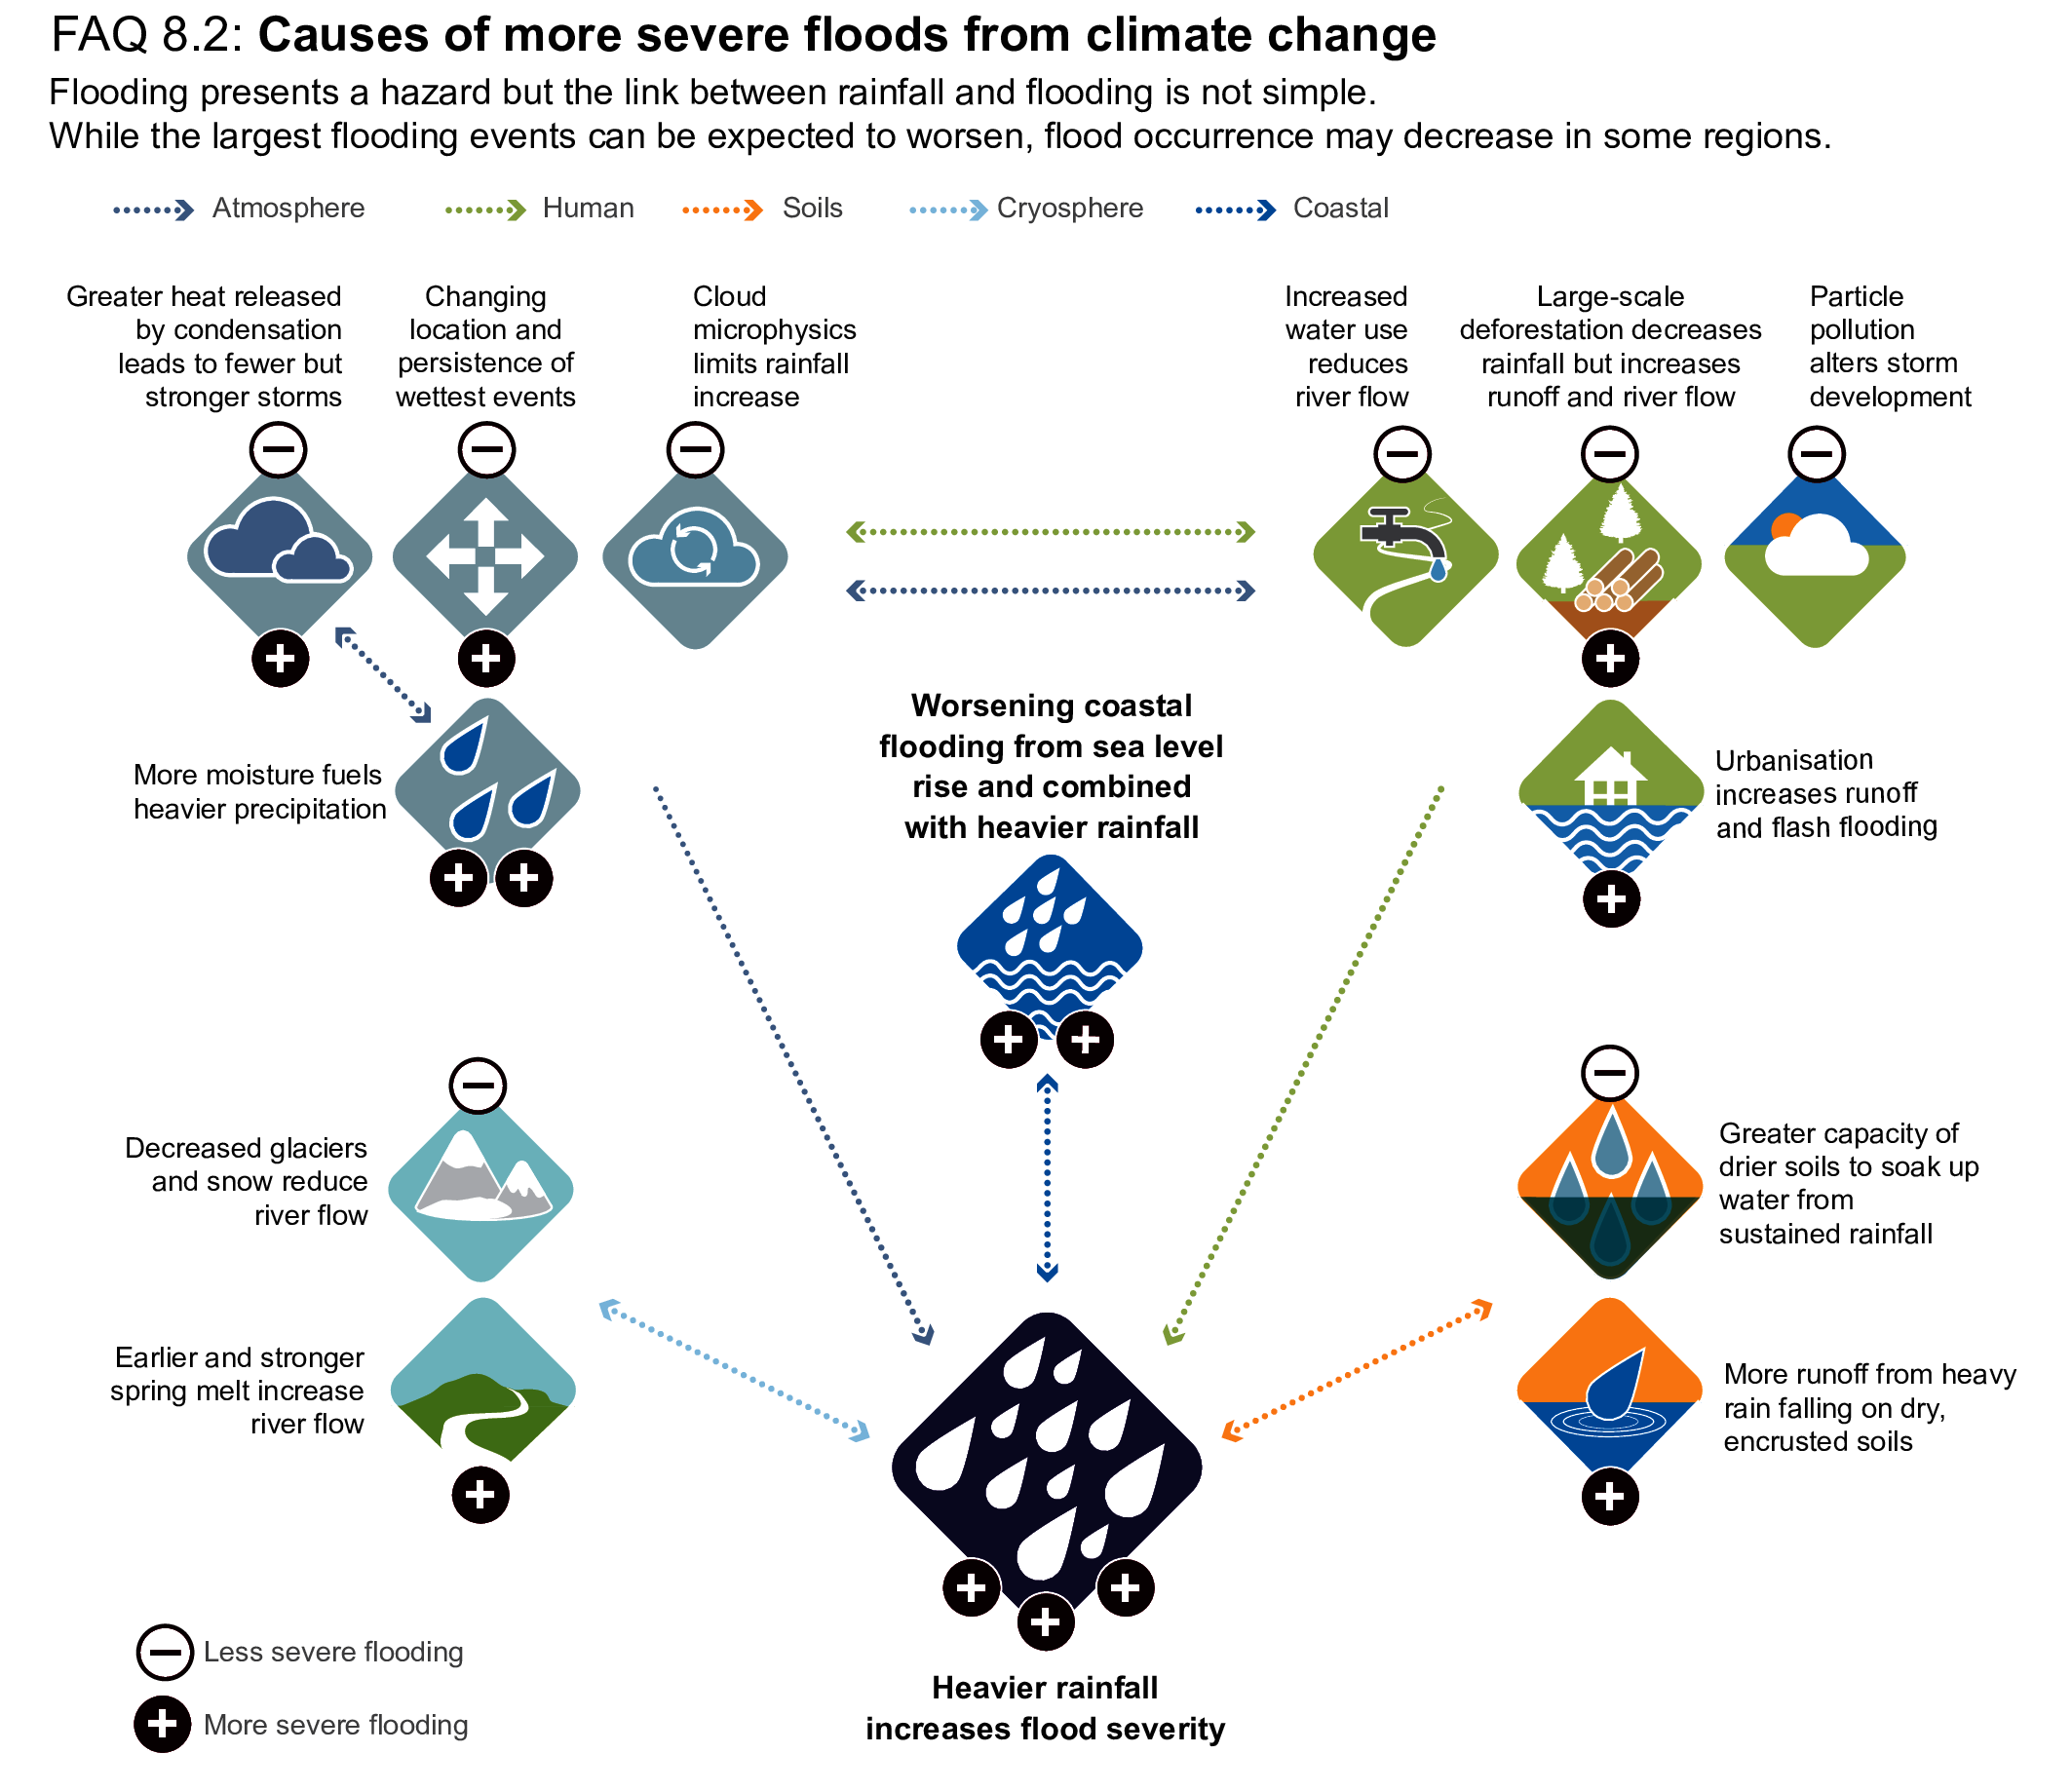
FAQ 8.2, Figure 1 | Schematic illustrating factors important in determining changes in heavy precipitation and flooding.
FAQ 8.3 | What Causes Droughts, and Will Climate Change Make Them Worse?
Droughts usually begin as a deficit of precipitation, but then propagate to other parts of the water cycle (soils, rivers, snow/ice and water reservoirs). They are also influenced by factors like temperature, vegetation and human land and water management. In a warmer world, evaporation increases, which can make even wet regions more susceptible to drought.
A drought is broadly defined as drier than normal conditions; that is, a moisture deficit relative to the average water availability at a given location and season. Since they are locally defined, a drought in a wet place will not have the same amount of water deficit as a drought in a dry region. Droughts are divided into different categories based on where in the water cycle the moisture deficit occurs: meteorological drought (precipitation), hydrological drought (runoff, streamflow, and reservoir storage), and agricultural or ecological drought (plant stress from a combination of evaporation and low soil moisture). Special categories of drought also exist. For example, a snow drought occurs when winter snowpack levels are below average, which can cause abnormally low streamflow in subsequent seasons. And while many drought events develop slowly over months or years, some events, called flash droughts, can intensify over the course of days or weeks. One such event occurred in 2012 in the Midwestern region of North America and had a severe impact on agricultural production, with losses exceeding $30 billion US dollars. Droughts typically only become a concern when they adversely affect people (reducing water available for municipal, industrial, agricultural, or navigational needs) and/or ecosystems (adverse effects on natural flora and fauna). When a drought lasts for a very long time (more than two decades) it is sometimes called a megadrought.
Most droughts begin when precipitation is below normal for an extended period of time (meteorological drought). This typically occurs when high pressure in the atmosphere sets up over a region, reducing cloud formation and precipitation over that area and deflecting away storms. The lack of rainfall then propagates across the water cycle to create agricultural drought in soils and hydrological drought in waterways. Other processes act to amplify or alleviate droughts. For example, if temperatures are abnormally high, evaporation increases, drying out soils and streams and stressing plants beyond what would have occurred from the lack of precipitation alone. Vegetation can play a critical role because it modulates many important hydrologic processes (soil water, evapotranspiration, runoff). Human activities can also determine how severe a drought is. For example, irrigating croplands can reduce the socio-economic impact of a drought; at the same time, depletion of groundwater in aquifers can make a drought worse.
The effect of climate change on drought varies across regions. In the subtropical regions like the Mediterranean, southern Africa, south-western Australia and south-western South America, as well as tropical Central America, western Africa and the Amazon basin, precipitation is expected to decline as the world warms, increasing the possibility that drought will occur throughout the year (FAQ 8.3, Figure 1). Warming will decrease snowpack, amplifying drought in regions where snowmelt is an important water resource (such as in south-western South America). Higher temperatures lead to increased evaporation, resulting in soil drying, increased plant stress, and impacts on agriculture, even in regions where large changes in precipitation are not expected (such as central and northern Europe). If emissions of greenhouse gases are not curtailed, about a third of global land areas are projected to suffer from at least moderate drought by 2100. On the other hand, some areas and seasons (such as high-latitude regions in North America and Asia, and the South Asian monsoon region) may experience increases in precipitation as a result of climate change, which will decrease the likelihood of droughts. FAQ 8.3, Figure 1 highlights the regions where climate change is expected to increase the severity of droughts.
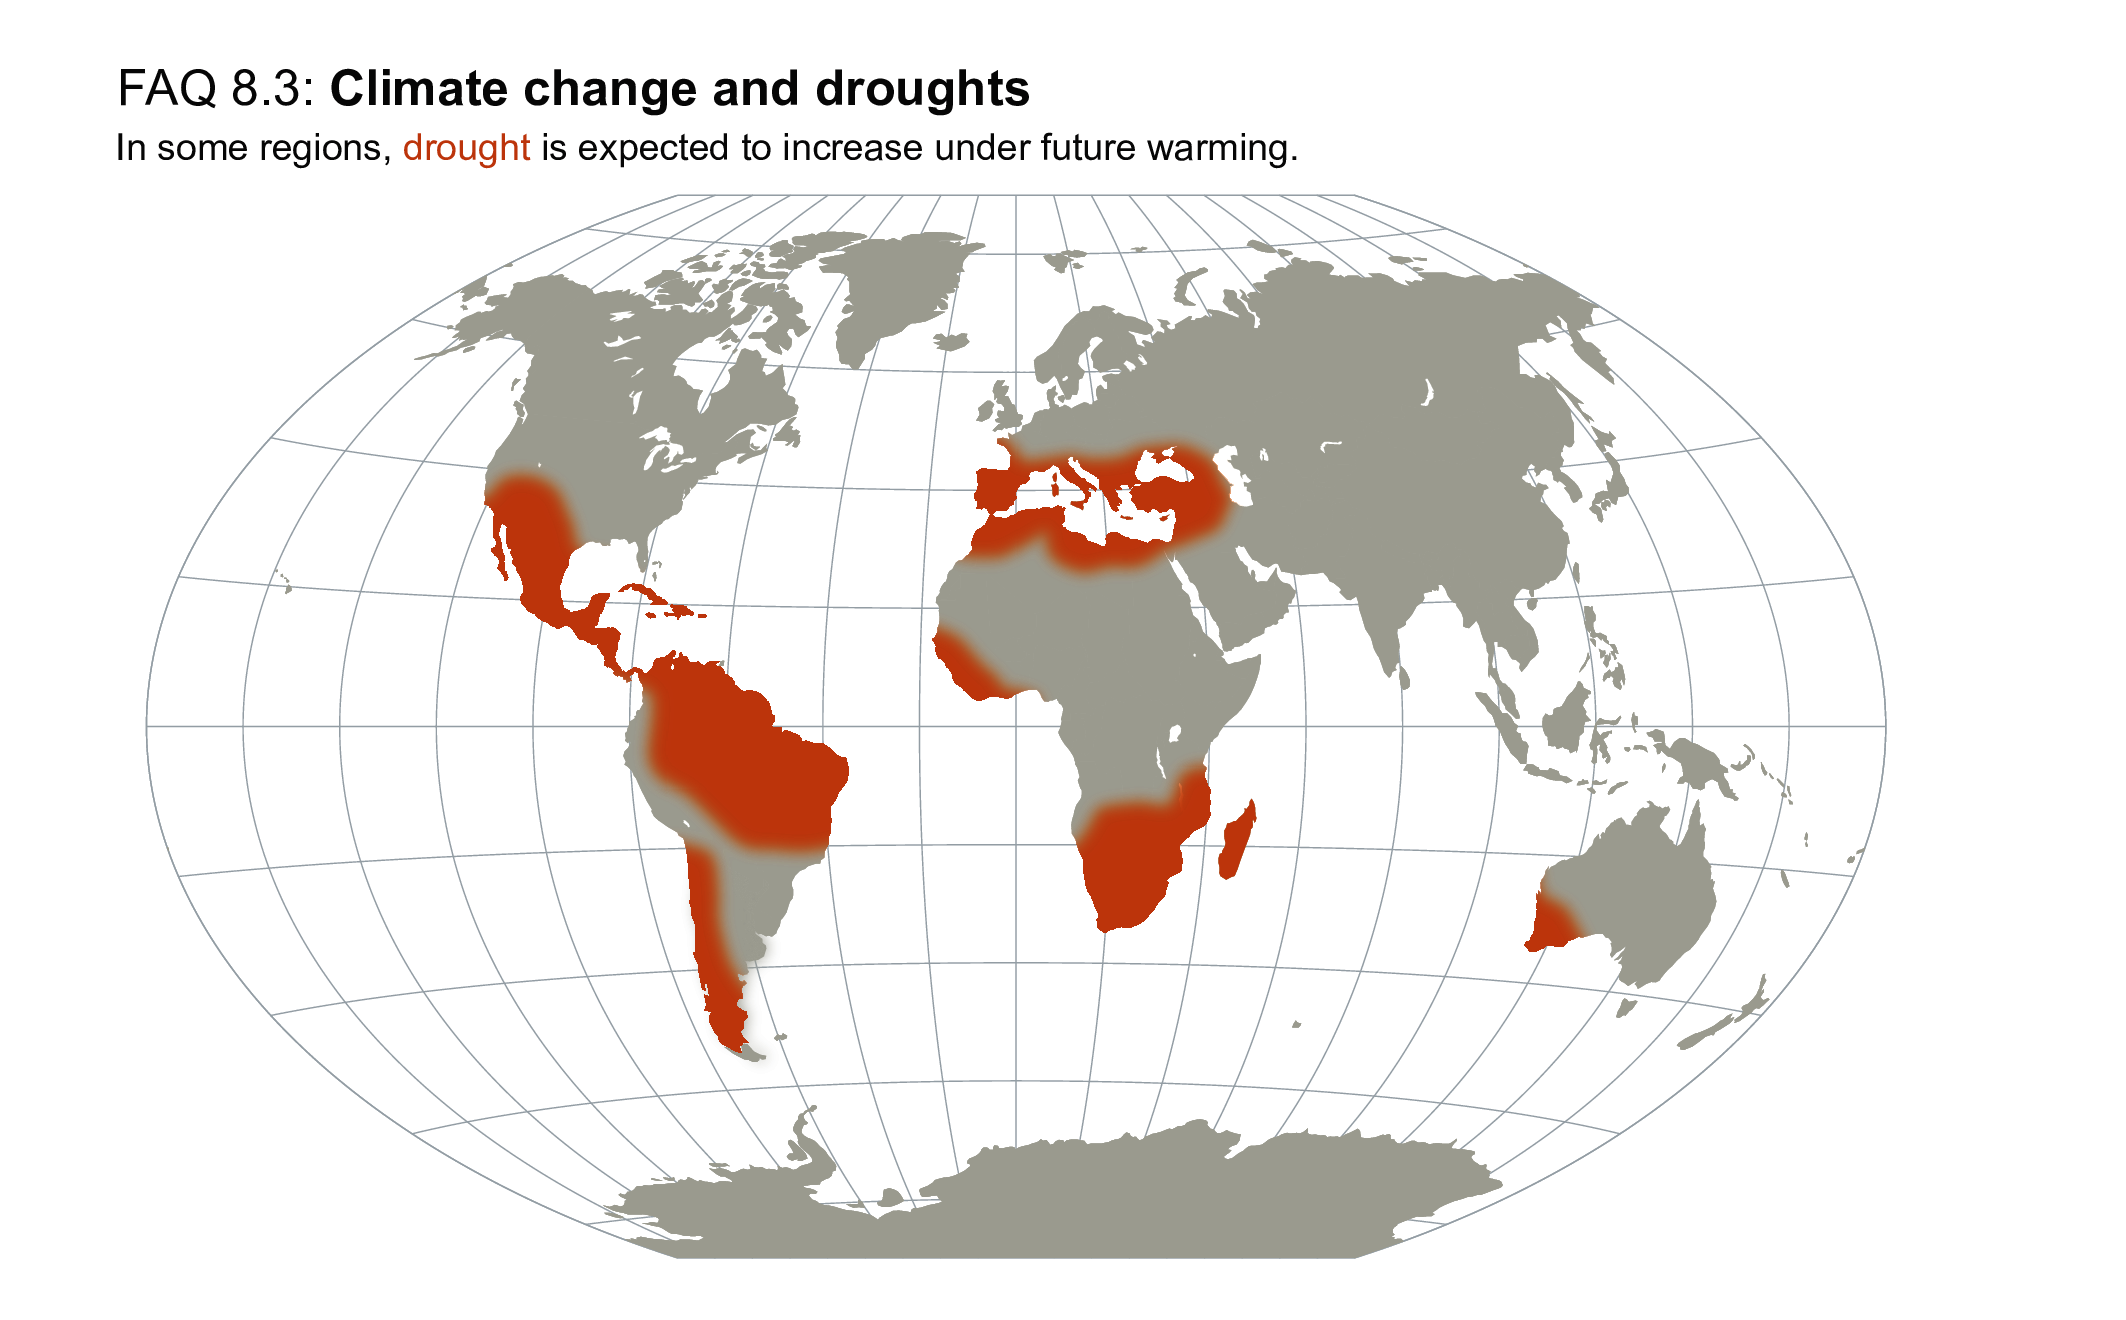
FAQ 8.3, Figure 1 | Schematic map highlighting in brown the regions where droughts are expected to become worse as a result of climate change. This pattern is similar regardless of the emissions scenario; however, the magnitude of change increases under higher emissions.
References
Aadhar, S. and V. Mishra, 2020: On the Projected Decline in Droughts Over South Asia in CMIP6 Multimodel Ensemble. Journal of Geophysical Research: Atmospheres, 125(20), e2020JD033587, doi: 10.1029/2020jd033587.
Abbott, B.W. et al., 2019: Human domination of the global water cycle absent from depictions and perceptions. Nature Geoscience, 12(7), 533–540, doi: 10.1038/s41561-019-0374-y.
Abbott, T. and T. Cronin, 2021: Aerosol invigoration of atmospheric convection through increases in humidity. Science, 371(6524), 83–85, doi: 10.1126/science.abc5181.
Abdel-Lathif, A.Y., R. Roehrig, I. Beau, and H. Douville, 2018: Single-Column Modeling of Convection During the CINDY2011/DYNAMO Field Campaign With the CNRM Climate Model Version 6. Journal of Advances in Modeling Earth Systems, 10(3), 578–602, doi: 10.1002/2017ms001077.
Abell, J.T., G. Winckler, R.F. Anderson, and T.D. Herbert, 2021: Poleward and weakend westerlies during Pliocene warmth. Nature, 589(7840), 70–75, doi: 10.1038/s41586-020-03062-1.
Aberson, S.D. and J. Kaplan, 2020: The Relationship between the Madden–Julian Oscillation and Tropical Cyclone Rapid Intensification. Weather and Forecasting, 35(5), 1865–1870, doi: 10.1175/waf-d-19-0209.1.
Abish, B., P. Joseph, and O.M. Johannessen, 2013: Weakening Trend of the Tropical Easterly Jet Stream of the Boreal Summer Monsoon Season 1950–2009. Journal of Climate, 26(23), 9408–9414, doi: 10.1175/jcli-d-13-00440.1.
Abram, N.J. et al., 2020: Coupling of Indo-Pacific climate variability over the last millennium. Nature, 579(7799), 385–392, doi: 10.1038/s41586-020-2084-4.
Adam, O., T. Schneider, and F. Brient, 2018: Regional and seasonal variations of the double-ITCZ bias in CMIP5 models. Climate Dynamics, 51(1–2), 101–117, doi: 10.1007/s00382-017-3909-1.
Adames, F., D. Kim, A.H. Sobel, A. Del Genio, and J. Wu, 2017a: Changes in the structure and propagation of the MJO with increasing CO2. Journal of Advances in Modeling Earth Systems, 9(2), 1251–1268, doi: 10.1002/2017ms000913.
Adames, F., D. Kim, A.H. Sobel, A. Del Genio, and J. Wu, 2017b: Characterization of Moist Processes Associated With Changes in the Propagation of the MJO With Increasing CO2. Journal of Advances in Modeling Earth Systems, 9(8), 2946–2967, doi: 10.1002/2017ms001040.
Adler, R.F., G. Gu, M. Sapiano, J.-J. Wang, and G.J. Huffman, 2017: Global Precipitation: Means, Variations and Trends During the Satellite Era (1979–2014). Surveys in Geophysics, 38(4), 679–699, doi: 10.1007/s10712-017-9416-4.
Adusumilli, S., M. Fish, H.A. Fricker, and B. Medley, 2021: Atmospheric River Precipitation Contributed to Rapid Increases in Surface Height of the West Antarctic Ice Sheet in 2019. Geophysical Research Letters, 48(5), e2020GL091076, doi: 10.1029/2020gl091076.
Adusumilli, S., A.A. Borsa, M.A. Fish, H.K. McMillan, and F. Silverii, 2019: A Decade of Water Storage Changes Across the Contiguous United States From GPS and Satellite Gravity. Geophysical Research Letters, 46(22), 13006–13015, doi: 10.1029/2019gl085370.
AghaKouchak, A., D. Feldman, M. Hoerling, T. Huxman, and J. Lund, 2015: Water and climate: Recognize anthropogenic drought. Nature, 524(7566), 409–411, doi: 10.1038/524409a.
Agudelo, J., P.A. Arias, S.C. Vieira, and J.A. Martínez, 2019: Influence of longer dry seasons in the Southern Amazon on patterns of water vapor transport over northern South America and the Caribbean. Climate Dynamics, 52(5–6), 2647–2665, doi: 10.1007/s00382-018-4285-1.
Ahn, M.-S., D. Kim, Y.-G. Ham, and S. Park, 2020a: Role of Maritime Continent Land Convection on the Mean State and MJO Propagation. Journal of Climate, 33(5), 1659–1675, doi: 10.1175/jcli-d-19-0342.1.
Ahn, M.-S. et al., 2017: MJO simulation in CMIP5 climate models: MJO skill metrics and process-oriented diagnosis. Climate Dynamics, 49(11–12), 4023–4045, doi: 10.1007/s00382-017-3558-4.
Ahn, M.-S. et al., 2020b: MJO Propagation Across the Maritime Continent: Are CMIP6 Models Better Than CMIP5 Models?Geophysical Research Letters, 47(11), e2020GL087250, doi: 10.1029/2020gl087250.
Aires, F. et al., 2018: Comparison of visible and multi-satellite global inundation datasets at high-spatial resolution. Remote sensing of environment. Remote Sensing of Environment, 216, 427–441, doi: 10.1016/j.rse.2018.06.015.
Akinsanola, A.A. and W. Zhou, 2019: Ensemble-based CMIP5 simulations of West African summer monsoon rainfall: current climate and future changes. Theoretical and Applied Climatology, 136(3–4), 1021–1031, doi: 10.1007/s00704-018-2516-3.
Akinsanola, A.A. and W. Zhou, 2020: Understanding the Variability of West African Summer Monsoon Rainfall: Contrasting Tropospheric Features and Monsoon Index. Atmosphere, 11(3), 309, doi: 10.3390/atmos11030309.
Akinsanola, A.A. et al., 2018: Evaluation of rainfall simulations over West Africa in dynamically downscaled CMIP5 global circulation models. Theoretical and Applied Climatology, 132(1–2), 437–450, doi: 10.1007/s00704-017-2087-8.
Akter, R. et al., 2019: The Dominant Climate Change Event for Salinity Intrusion in the GBM Delta. Climate, 7(5), 69, doi: 10.3390/cli7050069.
Alessandri, A. and A. Navarra, 2008: On the coupling between vegetation and rainfall inter-annual anomalies: Possible contributions to seasonal rainfall predictability over land areas. Geophysical Research Letters, 35(2), L02718, doi: 10.1029/2007gl032415.
Alessandri, A. et al., 2015: Robust assessment of the expansion and retreat of Mediterranean climate in the 21stcentury. Scientific Reports, 4(1), 7211, doi: 10.1038/srep07211.
Alessandri, A. et al., 2017: Multi-scale enhancement of climate prediction over land by increasing the model sensitivity to vegetation variability in EC-Earth. Climate Dynamics, 49(4), 1215–1237, doi: 10.1007/s00382-016-3372-4.
Alexander, L., 2016: Global observed long-term changes in temperature and precipitation extremes: A review of progress and limitations in IPCC assessments and beyond. Weather and Climate Extremes, 11, 4–16, doi: 10.1016/j.wace.2015.10.007.
Algarra, I. et al., 2020: Significant increase of global anomalous moisture uptake feeding landfalling Atmospheric Rivers. Nature Communications, 11(1), 5082, doi: 10.1038/s41467-020-18876-w.
Ali, A. and T. Lebel, 2009: The Sahelian standardized rainfall index revisited. International Journal of Climatology, 29(12), 1705–1714, doi: 10.1002/joc.1832.
Ali, H., H.J. Fowler, and V. Mishra, 2018: Global Observational Evidence of Strong Linkage Between Dew Point Temperature and Precipitation Extremes. Geophysical Research Letters, 45(22), 12320–12330, doi: 10.1029/2018gl080557.
Allan, R.P. et al., 2014: Physically Consistent Responses of the Global Atmospheric Hydrological Cycle in Models and Observations. Surveys in Geophysics, 35, 533–552, doi: 10.1007/s10712-012-9213-z.
Allan, R.P. et al., 2020: Advances in understanding large-scale responses of the water cycle to climate change. Annals of the New York Academy of Sciences, 1472(1), 49–75, doi: 10.1111/nyas.14337.
Allen, C.D., D.D. Breshears, and N.G. McDowell, 2015: On underestimation of global vulnerability to tree mortality and forest die-off from hotter drought in the Anthropocene. Ecosphere, 6(8), 1–55, doi: 10.1890/es15-00203.1.
Allen, D.M., P.H. Whitfield, and A. Werner, 2010: Groundwater level responses in temperate mountainous terrain: regime classification, and linkages to climate and streamflow. Hydrological Processes, 24(23), 3392–3412, doi: 10.1002/hyp.7757.
Allen, R.J. and W. Landuyt, 2014: The vertical distribution of black carbon in CMIP5 models: Comparison to observations and the importance of convective transport. Journal of Geophysical Research: Atmospheres, 119(8), 4808–4835, doi: 10.1002/2014jd021595.
Allen, R.J., J.R. Norris, and M. Kovilakam, 2014: Influence of anthropogenic aerosols and the Pacific Decadal Oscillation on tropical belt width. Nature Geoscience, 7(4), 270–274, doi: 10.1038/ngeo2091.
Allen, R.J., A.T. Evan, and B.B.B. Booth, 2015: Interhemispheric Aerosol Radiative Forcing and Tropical Precipitation Shifts during the Late Twentieth Century. Journal of Climate, 28(20), 8219–8246, doi: 10.1175/jcli-d-15-0148.1.
Allen, R.J., W. Landuyt, and S.T. Rumbold, 2016: An increase in aerosol burden and radiative effects in a warmer world. Nature Climate Change, 6(3), 269–274, doi: 10.1038/nclimate2827.
Almazroui, M., M.N. Islam, S. Saeed, F. Saeed, and M. Ismail, 2020a: Future Changes in Climate over the Arabian Peninsula based on CMIP6 Multimodel Simulations. Earth Systems and Environment, 4(4), 611–630, doi: 10.1007/s41748-020-00183-5.
Almazroui, M. et al., 2020b: Projected Change in Temperature and Precipitation Over Africa from CMIP6. Earth Systems and Environment, 4(3), 455–475, doi: 10.1007/s41748-020-00161-x.
Almazroui, M. et al., 2020c: Projections of Precipitation and Temperature over the South Asian Countries in CMIP6. Earth Systems and Environment, 4(2), 297–320, doi: 10.1007/s41748-020-00157-7.
Almazroui, M. et al., 2021: Projected Changes in Temperature and Precipitation Over the United States, Central America, and the Caribbean in CMIP6 GCMs. Earth Systems and Environment, 5(1), 1–24, doi: 10.1007/s41748-021-00199-5.
Almeida, C.T., J.F. Oliveira-Júnior, R.C. Delgado, P. Cubo, and M.C. Ramos, 2017: Spatiotemporal rainfall and temperature trends throughout the Brazilian Legal Amazon, 1973–2013. International Journal of Climatology, 37(4), 2013–2026, doi: 10.1002/joc.4831.
Alter, R.E., E.S. Im, and E.A.B. Eltahir, 2015: Rainfall consistently enhanced around the Gezira Scheme in East Africa due to irrigation. Nature Geoscience, 8(10), 763–767, doi: 10.1038/ngeo2514.
Alvarez, M., C. Vera, and G. Kiladis, 2017: MJO Modulating the Activity of the Leading Mode of Intraseasonal Variability in South America. Atmosphere, 8(12), 232, doi: 10.3390/atmos8120232.
Anderegg, W.R.L. et al., 2016: Meta-analysis reveals that hydraulic traits explain cross-species patterns of drought-induced tree mortality across the globe. Proceedings of the National Academy of Sciences, 113(18), 5024–5029, doi: 10.1073/pnas.1525678113.
Andreae, M.O. et al., 2004: Smoking Rain Clouds over the Amazon. Science, 303(5662), 1337–1342, doi: 10.1126/science.1092779.
Andrews, T., J.M. Gregory, and M.J. Webb, 2015: The dependence of radiative forcing and feedback on evolving patterns of surface temperature change in climate models. Journal of Climate, 28(4), 1630–1648, doi: 10.1175/jcli-d-14-00545.1.
Andrews, T., P.M. Forster, O. Boucher, N. Bellouin, and A. Jones, 2010: Precipitation, radiative forcing and global temperature change. Geophysical Research Letters, 37(14), L14701, doi: 10.1029/2010gl043991.
Annamalai, H., B. Taguchi, J.P. McCreary, M. Nagura, and T. Miyama, 2017: Systematic Errors in South Asian Monsoon Simulation: Importance of Equatorial Indian Ocean Processes. Journal of Climate, 30(20), 8159–8178, doi: 10.1175/jcli-d-16-0573.1.
Apaéstegui, J. et al., 2014: Hydroclimate variability of the northwestern Amazon Basin near the Andean foothills of Peru related to the South American Monsoon System during the last 1600 years. Climate of the Past, 10(6), 1967–1981, doi: 10.5194/cp-10-1967-2014.
Araya-Melo, P.A., M. Crucifix, and N. Bounceur, 2015: Global sensitivity analysis of the Indian monsoon during the Pleistocene. Climate of the Past, 11(1), 45–61, doi: 10.5194/cp-11-45-2015.
Arheimer, B., C. Donnelly, and G. Lindström, 2017: Regulation of snow-fed rivers affects flow regimes more than climate change. Nature Communications, 8(1), 1–8, doi: 10.1038/s41467-017-00092-8.
Arias, P.A., R. Fu, and K. Mo, 2012: Decadal Variation of Rainfall Seasonality in the North American Monsoon Region and Its Potential Causes. Journal of Climate, 25(12), 4258–4274, doi: 10.1175/jcli-d-11-00140.1.
Arias, P.A., R. Fu, C. Vera, and M. Rojas, 2015: A correlated shortening of the North and South American monsoon seasons in the past few decades. Climate Dynamics, 45(11), 3183–3203, doi: 10.1007/s00382-015-2533-1.
Armour, K.C., C.M. Bitz, and G.H. Roe, 2013: Time-Varying Climate Sensitivity from Regional Feedbacks. Journal of Climate, 26(13), 4518–4534, doi: 10.1175/jcli-d-12-00544.1.
Arnell, N.W. and S.N. Gosling, 2016: The impacts of climate change on river flood risk at the global scale. Climatic Change, 134(3), 387–401, doi: 10.1007/s10584-014-1084-5.
Arnold, N.P., Z. Kuang, and E. Tziperman, 2013: Enhanced MJO-like Variability at High SST. Journal of Climate, 26(3), 988–1001, doi: 10.1175/jcli-d-12-00272.1.
Arnold, N.P., M. Branson, Z. Kuang, D.A. Randall, and E. Tziperman, 2015: MJO Intensification with Warming in the Superparameterized CESM. Journal of Climate, 28(7), 2706–2724, doi: 10.1175/jcli-d-14-00494.1.
Arora, V.K. et al., 2020: Carbon–concentration and carbon–climate feedbacks in CMIP6 models and their comparison to CMIP5 models. Biogeosciences, 17(16), 4173–4222, doi: 10.5194/bg-17-4173-2020.
Arvor, D., B.M. Funatsu, V. Michot, and V. Dubreui, 2017: Monitoring rainfall patterns in the southern amazon with PERSIANN-CDR data: Long-term characteristics and trends. Remote Sensing, 9(9), 889, doi: 10.3390/rs9090889.
Asadieh, B. and N.Y. Krakauer, 2017: Global change in streamflow extremes under climate change over the 21st century. Hydrology and Earth System Sciences, 21(11), 5863–5874, doi: 10.5194/hess-21-5863-2017.
Ashfaq, M. et al., 2021: Robust late twenty-first century shift in the regional monsoons in RegCM-CORDEX simulations. Climate Dynamics, 57(5–6), 1463–1488, doi: 10.1007/s00382-020-05306-2.
Asoka, A., T. Gleeson, Y. Wada, and V. Mishra, 2017: Relative contribution of monsoon precipitation and pumping to changes in groundwater storage in India. Nature Geoscience, 10(2), 109–117, doi: 10.1038/ngeo2869.
Asoka, A., Y. Wada, R. Fishman, and V. Mishra, 2018: Strong Linkage Between Precipitation Intensity and Monsoon Season Groundwater Recharge in India. Geophysical Research Letters, 45(11), 5536–5544, doi: 10.1029/2018gl078466.
As-syakur, A.R. et al., 2014: Observation of spatial patterns on the rainfall response to ENSO and IOD over Indonesia using TRMM Multisatellite Precipitation Analysis (TMPA). International Journal of Climatology, 34(15), 3825–3839, doi: 10.1002/joc.3939.
Atwood, A.R., A. Donohoe, D.S. Battisti, X. Liu, and F.S.R. Pausata, 2020: Robust Longitudinally Variable Responses of the ITCZ to a Myriad of Climate Forcings. Geophysical Research Letters, 47(17), e2020GL088833, doi: 10.1029/2020gl088833.
Ault, T.R., J.E. Cole, and S. St. George, 2012: The amplitude of decadal to multidecadal variability in precipitation simulated by state-of-the-art climate models. Geophysical Research Letters, 39(21), L21705, doi: 10.1029/2012gl053424.
Ault, T.R., J.E. Cole, J.T. Overpeck, G.T. Pederson, and D.M. Meko, 2014: Assessing the Risk of Persistent Drought Using Climate Model Simulations and Paleoclimate Data. Journal of Climate, 27(20), 7529–7549, doi: 10.1175/jcli-d-12-00282.1.
Ault, T.R. et al., 2013: The Continuum of Hydroclimate Variability in Western North America during the Last Millennium. Journal of Climate, 26(16), 5863–5878, doi: 10.1175/jcli-d-11-00732.1.
Ayantika, D.C. et al., 2021: Understanding the combined effects of global warming and anthropogenic aerosol forcing on the South Asian monsoon. Climate Dynamics, 56(5–6), 1643–1662, doi: 10.1007/s00382-020-05551-5.
Aygün, O., C. Kinnard, and S. Campeau, 2019: Impacts of climate change on the hydrology of northern midlatitude cold regions. Progress in Physical Geography: Earth and Environment, 44(3), 338–375, doi: 10.1177/0309133319878123.
Ayliffe, L.K. et al., 2013: Rapid interhemispheric climate links via the Australasian monsoon during the last deglaciation. Nature Communications, 4, 2908, doi: 10.1038/ncomms3908.
Bador, M., M.G. Donat, O. Geoffroy, and L. Alexander, 2018: Assessing the Robustness of Future Extreme Precipitation Intensification in the CMIP5 Ensemble. Journal of Climate, 31(16), 6505–6525, doi: 10.1175/jcli-d-17-0683.1.
Bador, M. et al., 2020: Impact of higher spatial atmospheric resolution on precipitation extremes over land in global climate models. Journal of Geophysical Research: Atmospheres, 125(13), e2019JD032184, doi: 10.1029/2019jd032184.
Baker, H.S. et al., 2018: Higher CO2 concentrations increase extreme event risk in a 1.5°C world. Nature Climate Change, 8(7), 604–608, doi: 10.1038/s41558-018-0190-1.
Bakker, P. et al., 2016: Fate of the Atlantic Meridional Overturning Circulation: Strong decline under continued warming and Greenland melting. Geophysical Research Letters, 43(23), 12252–12260, doi: 10.1002/2016gl070457.
Bala, G., P.B. Duffy, and K.E. Taylor, 2008: Impact of geoengineering schemes on the global hydrological cycle. Proceedings of the National Academy of Sciences, 105(22), 7664–7669, doi: 10.1073/pnas.0711648105.
Bala, G., K. Caldeira, and R. Nemani, 2010: Fast versus slow response in climate change: implications for the global hydrological cycle. Climate Dynamics, 35(2–3), 423–434, doi: 10.1007/s00382-009-0583-y.
Balme, M., T. Lebel, and A. Amani, 2006: Années sèches et années humides au Sahel: quo vadimus?Hydrological Sciences Journal, 51(2), 254–271, doi: 10.1623/hysj.51.2.254.
Bamba, A. et al., 2015: Changes in Vegetation and Rainfall over West Africa during the Last Three Decades (1981–2010). Atmospheric and Climate Sciences, 5(4), 367–379, doi: 10.4236/acs.2015.54028.
Ban, N., J. Schmidli, and C. Schär, 2015: Heavy precipitation in a changing climate: Does short-term summer precipitation increase faster?Geophysical Research Letters, 42(4), 1165–1172, doi: 10.1002/2014gl062588.
Bao, J. and S.C. Sherwood, 2019: The Role of Convective Self-Aggregation in Extreme Instantaneous Versus Daily Precipitation. Journal of Advances in Modeling Earth Systems, 11(1), 19–33, doi: 10.1029/2018ms001503.
Bao, J., S.C. Sherwood, L. Alexander, and J.P. Evans, 2017: Future increases in extreme precipitation exceed observed scaling rates. Nature Climate Change, 7(2), 128–132, doi: 10.1038/nclimate3201.
Barbero, R., H.J. Fowler, G. Lenderink, and S. Blenkinsop, 2017: Is the intensification of precipitation extremes with global warming better detected at hourly than daily resolutions?Geophysical Research Letters, 44(2), 974–983, doi: 10.1002/2016gl071917.
Barbero, R. et al., 2019: A synthesis of hourly and daily precipitation extremes in different climatic regions. Weather and Climate Extremes, 26, 100219, doi: 10.1016/j.wace.2019.100219.
Barcikowska, M.J. et al., 2018: Euro-Atlantic winter storminess and precipitation extremes under 1.5°C vs. 2°C warming scenarios. Earth System Dynamics, 9(2), 679–699, doi: 10.5194/esd-9-679-2018.
Barichivich, J. et al., 2018: Recent intensification of Amazon flooding extremes driven by strengthened Walker circulation. Science Advances, 4(9), eaat8785, doi: 10.1126/sciadv.aat8785.
Barkhordarian, A. et al., 2018: Simultaneous Regional Detection of Land-Use Changes and Elevated GHG Levels: The Case of Spring Precipitation in Tropical South America. Geophysical Research Letters, 45(12), 6262–6271, doi: 10.1029/2018gl078041.
Barlow, M. et al., 2019: North American extreme precipitation events and related large-scale meteorological patterns: a review of statistical methods, dynamics, modeling, and trends. Climate Dynamics, 53(11), 6835–6875, doi: 10.1007/s00382-019-04958-z.
Barnes, E.A., 2013: Revisiting the evidence linking Arctic amplification to extreme weather in midlatitudes. Geophysical Research Letters, 40(17), 4734–4739, doi: 10.1002/grl.50880.
Barnes, E.A., E. Dunn-Sigouin, G. Masato, and T. Woollings, 2014: Exploring recent trends in Northern Hemisphere blocking. Geophysical Research Letters, 41(2), 638–644, doi: 10.1002/2013gl058745.
Barreiro, M., N. Díaz, and M. Renom, 2014: Role of the global oceans and land–atmosphere interaction on summertime interdecadal variability over northern Argentina. Climate Dynamics, 42(7), 1733–1753, doi: 10.1007/s00382-014-2088-6.
Barreiro, M. et al., 2019: Modelling the role of Atlantic air–sea interaction in the impact of Madden–Julian Oscillation on South American climate. International Journal of Climatology, 39(2), 1104–1116, doi: 10.1002/joc.5865.
Barry, R.G. and T.Y. Gan, 2020: The Global Cryosphere: Past, Present and Future (2nd edition). Cambridge University Press, Cambridge, United Kingdom and New York, NY, USA, 498 pp.
Bartlett, P.A. and D.L. Verseghy, 2015: Modified treatment of intercepted snow improves the simulated forest albedo in the Canadian Land Surface Scheme. Hydrological Processes, 29(14), 3208–3226, doi: 10.1002/hyp.10431.
Barton, E.J. et al., 2020: A case-study of land–atmosphere coupling during monsoon onset in northern India. Quarterly Journal of the Royal Meteorological Society, 146(731), 2891–2905, doi: 10.1002/qj.3538.
Bates, B.C., Z.W. Kundzewicz, S. Wu, and J.P. Palutikof (eds.), 2008: Climate Change and Water. Technical Paper of the Intergovernmental Panel on Climate Change. IPCC Secretariat, Geneva, Switzerland, 210 pp, www.ipcc.ch/publication/climate-change-and-water-2.
Bathiany, S., M. Claussen, and K. Fraedrich, 2013: Detecting hotspots of atmosphere–vegetation interaction via slowing down – Part 2: Application to a global climate model. Earth System Dynamics, 4, 79–93, doi: 10.5194/esd-4-79-2013.
Bathiany, S., M. Claussen, and V. Brovkin, 2014: CO2 -Induced Sahel Greening in Three CMIP5 Earth System Models. Journal of Climate, 27(18), 7163–7184, doi: 10.1175/jcli-d-13-00528.1.
Battisti, D.S., Q. Ding, and G.H. Roe, 2014: Coherent pan-Asian climatic and isotopic response to orbital forcing of tropical insolation. Journal of Geophysical Research: Atmospheres, 119(21), 11997–12020, doi: 10.1002/2014jd021960.
Bayr, T., D. Dommenget, T. Martin, and S.B. Power, 2014: The eastward shift of the Walker Circulation in response to global warming and its relationship to ENSO variability. Climate Dynamics, 43(9–10), 2747–2763, doi: 10.1007/s00382-014-2091-y.
Bechtold, P. et al., 2008: Advances in simulating atmospheric variability with the ECMWF model: From synoptic to decadal time-scales. Quarterly Journal of the Royal Meteorological Society, 134(634), 1337–1351, doi: 10.1002/qj.289.
Bechtold, P. et al., 2014: Representing equilibrium and nonequilibrium convection in large-scale models. Journal of the Atmospheric Sciences, 71(2), 734–753, doi: 10.1175/jas-d-13-0163.1.
Beck, H.E. et al., 2017: Global-scale evaluation of 22 precipitation datasets using gauge observations and hydrological modeling. Hydrology and Earth System Sciences, 21(12), 6201–6217, doi: 10.5194/hess-21-6201-2017.
Behera, S.K. et al., 2005: Paramount Impact of the Indian Ocean Dipole on the East African Short Rains: A CGCM Study. Journal of Climate, 18(21), 4514–4530, doi: 10.1175/jcli3541.1.
Behrangi, A., B. Guan, P.J. Neiman, M. Schreier, and B. Lambrigtsen, 2016: On the Quantification of Atmospheric Rivers Precipitation from Space: Composite Assessments and Case Studies over the Eastern North Pacific Ocean and the Western United States. Journal of Hydrometeorology, 17(1), 369–382, doi: 10.1175/jhm-d-15-0061.1.
Bell, M.A., P.J. Lamb, M.A. Bell, and P.J. Lamb, 2006: Integration of Weather System Variability to Multidecadal Regional Climate Change: The West African Sudan–Sahel Zone, 1951–98. Journal of Climate, 19(20), 5343–5365, doi: 10.1175/jcli4020.1.
Belmecheri, S., F. Babst, E.R. Wahl, D.W. Stahle, and V. Trouet, 2016: Multi-century evaluation of Sierra Nevada snowpack. Nature Climate Change, 6(1), 2–3, doi: 10.1038/nclimate2809.
Belyazid, S. and Z. Giuliana, 2019: Water limitation can negate the effect of higher temperatures on forest carbon sequestration. European Journal of Forest Research, 138(2), 287–297, doi: 10.1007/s10342-019-01168-4.
Bender, F.A.M., V. Ramanathan, and G. Tselioudis, 2012: Changes in extratropical storm track cloudiness 1983–2008: Observational support for a poleward shift. Climate Dynamics, 38(9–10), 2037–2053, doi: 10.1007/s00382-011-1065-6.
Benestad, R.E., K.M. Parding, H.B. Erlandsen, and A. Mezghani, 2019: A simple equation to study changes in rainfall statistics. Environmental Research Letters, 14(8), 084017, doi: 10.1088/1748-9326/ab2bb2.
Beniston, M. et al., 2018: The European mountain cryosphere: a review of its current state, trends, and future challenges. Cryosphere, 12(2), 759–794, doi: 10.5194/tc-12-759-2018.
Berg, A. and J. Sheffield, 2018a: Climate Change and Drought: the Soil Moisture Perspective. Current Climate Change Reports, 4(2), 180–191, doi: 10.1007/s40641-018-0095-0.
Berg, A. and J. Sheffield, 2018b: Soil moisture–evapotranspiration coupling in CMIP5 models: Relationship with simulated climate and projections. Journal of Climate, 31(12), 4865–4878, doi: 10.1175/jcli-d-17-0757.1.
Berg, A., J. Sheffield, and P.C.D. Milly, 2017: Divergent surface and total soil moisture projections under global warming. Geophysical Research Letters, 44(1), 236–244, doi: 10.1002/2016gl071921.
Berg, A. et al., 2016: Land–atmosphere feedbacks amplify aridity increase over land under global warming. Nature Climate Change, 6(9), 869–874, doi: 10.1038/nclimate3029.
Berg, L.K. et al., 2015: A new WRF-Chem treatment for studying regional-scale impacts of cloud processes on aerosol and trace gases in parameterized cumuli. Geoscientific Model Development, 8(2), 409–429, doi: 10.5194/gmd-8-409-2015.
Berg, N. and A. Hall, 2017: Anthropogenic warming impacts on California snowpack during drought. Geophysical Research Letters, 44(5), 2511–2518, doi: 10.1002/2016gl072104.
Berg, P., C. Moseley, and J.O. Haerter, 2013: Strong increase in convective precipitation in response to higher temperatures. Nature Geoscience, 6(3), 181–185, doi: 10.1038/ngeo1731.
Berghuijs, W.R., R.A. Woods, M. Hrachowitz, and R. Hrachowitz, 2014: A precipitation shift from snow towards rain leads to a decrease in streamflow. Nature Climate Change, 4(7), 583–586, doi: 10-1038/nclimate2246.
Berghuijs, W.R., S. Harrigan, P. Molnar, L.J. Slater, and J.W. Kirchner, 2019: The Relative Importance of Different Flood-Generating Mechanisms Across Europe. Water Resources Research, 55(6), 4582–4593, doi: 10.1029/2019wr024841.
Bernstein, D.N. and J.D. Neelin, 2016: Identifying sensitive ranges in global warming precipitation change dependence on convective parameters. Geophysical Research Letters, 43(11), 5841–5850, doi: 10.1002/2016gl069022.
Berthou, S. et al., 2019a: Larger Future Intensification of Rainfall in the West African Sahel in a Convection-Permitting Model. Geophysical Research Letters, 46(22), 13299–13307, doi: 10.1029/2019gl083544.
Berthou, S. et al., 2019b: Improved climatological precipitation characteristics over West Africa at convection-permitting scales. Climate Dynamics, 53(3–4), 1991–2011, doi: 10.1007/s00382-019-04759-4.
Bethke, I. et al., 2017: Potential volcanic impacts on future climate variability. Nature Climate Change, 7(11), 799–805, doi: 10.1038/nclimate3394.
Betts, R.A. et al., 2015: Climate and land use change impacts on global terrestrial ecosystems and river flows in the HadGEM2-ES Earth system model using the representative concentration pathways. Biogeosciences, 12(5), 1317–1338, doi: 10.5194/bg-12-1317-2015.
Bevacqua, E. et al., 2019: Higher probability of compound flooding from precipitation and storm surge in Europe under anthropogenic climate change. Science Advances, 5(9), eaaw5531, doi: 10.1126/sciadv.aaw5531.
Beven, K., 2018: A Century of Denial: Preferential and Nonequilibrium Water Flow in Soils, 1864–1984. Vadose Zone Journal, 17(1), 180153, doi: 10.2136/vzj2018.08.0153.
Bhattacharya, R., S. Bordoni, and J. Teixeira, 2017: Tropical precipitation extremes: Response to SST-induced warming in aquaplanet simulations. Geophysical Research Letters, 44(7), 3374–3383, doi: 10.1002/2017gl073121.
Bhattacharya, T., J.E. Tierney, and P. DiNezio, 2017: Glacial reduction of the North American Monsoon via surface cooling and atmospheric ventilation. Geophysical Research Letters, 44(10), 5113–5122, doi: 10.1002/2017gl073632.
Bhattacharya, T., J.E. Tierney, J.A. Addison, and J.W. Murray, 2018: Ice-sheet modulation of deglacial North American monsoon intensification. Nature Geoscience, 11(11), 848–852, doi: 10.1038/s41561-018-0220-7.
Biasutti, M., 2013: Forced Sahel rainfall trends in the CMIP5 archive. Journal of Geophysical Research: Atmospheres, 118(4), 1613–1623, doi: 10.1002/jgrd.50206.
Biasutti, M., 2019: Rainfall trends in the African Sahel: Characteristics, processes, and causes. WIREs Climate Change, 10(4), 1–22, doi: 10.1002/wcc.591.
Biasutti, M. and A. Voigt, 2019: Seasonal and CO2 -induced shifts of the ITCZ: testing energetic controls in idealized simulations with comprehensive models. Journal of Climate, 33(7), 2853–2870, doi: 10.1175/jcli-d-19-0602.1.
Biasutti, M. et al., 2018: Global energetics and local physics as drivers of past, present and future monsoons. Nature Geoscience, 11(6), 392–400, doi: 10.1038/s41561-018-0137-1.
Bierkens, M.F.P. and Y. Wada, 2019: Non-renewable groundwater use and groundwater depletion: a review. Environmental Research Letters, 14(6), 63002, doi: 10.1088/1748-9326/ab1a5f .
Bierkens, M.F.P. et al., 2015: Hyper-resolution global hydrological modelling: what is next?Hydrological Processes, 29(2), 310–320, doi: 10.1002/hyp.10391.
Bindoff, N.L. et al., 2013: Detection and Attribution of Climate Change: from Global to Regional. In: Climate Change 2013: The Physical Science Basis. Contribution of Working Group I to the Fifth Assessment Report of the Intergovernmental Panel on Climate Change[Stocker, T.F., D. Qin, G.-K. Plattner, M. Tignor, S.K. Allen, J. Boschung, A. Nauels, Y. Xia, V. Bex, and P.M. Midgley (eds.)]. Cambridge University Press, Cambridge, United Kingdom and New York, NY, USA, pp. 867–952, doi: 10.1017/cbo9781107415324.022.
Bintanja, R. and F.M. Selten, 2014: Future increases in Arctic precipitation linked to local evaporation and sea-ice retreat. Nature, 509(7501), 479–482, doi: 10.1038/nature13259.
Bintanja, R. and O. Andry, 2017: Towards a rain-dominated Arctic. Nature Climate Change, 7(4), 263–267, doi: 10.1038/nclimate3240.
Birch, C.E. et al., 2015: Sea-breeze dynamics and convection initiation: The influence of convective parameterization in weather and climate model biases. Journal of Climate, 28(20), 8093–8108, doi: 10.1175/jcli-d-14-00850.1.
Bird, B.W., M.B. Abbott, D.T. Rodbell, and M. Vuille, 2011a: Holocene tropical South American hydroclimate revealed from a decadally resolved lake sedimentδ18O record. Earth and Planetary Science Letters, 310(3–4), 192–202, doi: 10.1016/j.epsl.2011.08.040.
Bird, B.W. et al., 2011b: A 2,300-year-long annually resolved record of the South American summer monsoon from the Peruvian Andes. Proceedings of the National Academy of Sciences, 108(21), 8583–8588, doi: 10.1073/pnas.1003719108.
Bischoff, T. and T. Schneider, 2014: Energetic Constraints on the Position of the Intertropical Convergence Zone. Journal of Climate, 27(13), 4937–4951, doi: 10.1175/jcli-d-13-00650.1.
Blöschl, G. et al., 2019: Changing climate both increases and decreases European floods. Nature, 573(7772), 108–111, doi: 10.1038/s41586-019-1495-6.
Blunden, J. and D.S. Arndt, 2020: State of the climate in 2019. Bulletin of the American Meteorological Society, 100(9), Si–S429, doi: 10.1175/2019bamsstateofthe climate.1.
Bódai, T., G. Drótos, M. Herein, F. Lunkeit, and V. Lucarini, 2020: The Forced Response of the El Niño-Southern Oscillation–Indian Monsoon Teleconnection in Ensembles of Earth System Models. Journal of Climate, 33(6), 2163–2182, doi: 10.1175/jcli-d-19-0341.1.
Bodian, A., O. Ndiaye, and H. Dacosta, 2016: Evolution des caractéristiques des pluies journalières dans le bassin versant du fleuve Sénégal: Aavant et après rupture. Hydrological Sciences Journal, 61(5), 905–913, doi: 10.1080/02626667.2014.950584.
Boé, J. and F. Habets, 2014: Multi-decadal river flow variations in France. Hydrology and Earth System Sciences, 18(2), 691–708, doi: 10.5194/hess-18-691-2014.
Boé, J., S. Somot, L. Corre, and P. Nabat, 2020: Large discrepancies in summer climate change over Europe as projected by global and regional climate models: causes and consequences. Climate Dynamics, 54(5–6), 2981–3002, doi: 10.1007/s00382-020-05153-1.
Boers, N., N. Marwan, H.M.J. Barbosa, and J. Kurths, 2017: A deforestation-induced tipping point for the South American monsoon system. Scientific Reports, 7, 1–9, doi: 10.1038/srep41489.
Boisier, J.P., P. Ciais, A. Ducharne, and M. Guimberteau, 2015: Projected strengthening of Amazonian dry season by constrained climate model simulations. Nature Climate Change, 5(7), 656–660, doi: 10.1038/nclimate2658.
Boisier, J.P., R. Rondanelli, R.D. Garreaud, and F. Muñoz, 2016: Anthropogenic and natural contributions to the Southeast Pacific precipitation decline and recent megadrought in central Chile. Geophysical Research Letters, 43(1), 413–421, doi: 10.1002/2015gl067265.
Boisier, J.P. et al., 2018: Anthropogenic drying in central-southern Chile evidenced by long-term observations and climate model simulations. Elementa: Science of the Anthropocene, 6(1), 74, doi: 10.1525/elementa.328.
Bolch, T., B. Menounos, and R. Wheate, 2010: Landsat-based inventory of glaciers in western Canada, 1985–2005. Remote Sensing of Environment, 114(1), 127–137, doi: 10.1016/j.rse.2009.08.015.
Bollasina, M.A., Y. Ming, and V. Ramaswamy, 2011: Anthropogenic Aerosols and the Weakening of the South Asian Summer Monsoon. Science, 334(6055), 502–505, doi: 10.1126/science.1204994.
Bollasina, M.A., Y. Ming, V. Ramaswamy, M.D. Schwarzkopf, and V. Naik, 2014: Contribution of local and remote anthropogenic aerosols to the twentieth century weakening of the South Asian Monsoon. Geophysical Research Letters, 41(2), 680–687, doi: 10.1002/2013gl058183.
BoM and CSIRO, 2020: State of the Climate. Bureau of Meteorology (BoM) and Commonwealth Scientific and Industrial Research Organisation (CSIRO), 24 pp., www.bom.gov.au/state-of-the-climate/.
Bonan, G.B. and S.C. Doney, 2018: Climate, ecosystems, and planetary futures: The challenge to predict life in Earth system models. Science, 359(6375), eaam8328, doi: 10.1126/science.aam8328.
Bonan, G.B., M. Williams, R.A. Fisher, and K.W. Oleson, 2014: Modeling stomatal conductance in the earth system: Linking leaf water-use efficiency and water transport along the soil–plant–atmosphere continuum. Geoscientific Model Development, 7(5), 2193–2222, doi: 10.5194/gmd-7-2193-2014.
Bonfils, C. et al., 2017: Competing influences of anthropogenic warming, ENSO, and plant physiology on future terrestrial aridity. Journal of Climate, 30(17), 6883–6904, doi: 10.1175/jcli-d-17-0005.1.
Bonfils, C.J.W. et al., 2015: Relative Contributions of Mean-State Shifts and ENSO-Driven Variability to Precipitation Changes in a Warming Climate. Journal of Climate, 28(24), 9997–10013, doi: 10.1175/jcli-d-15-0341.1.
Bonfils, C.J.W. et al., 2020: Human influence on joint changes in temperature, rainfall and continental aridity. Nature Climate Change, 10(8), 1–6, doi: 10.1038/s41558-020-0821-1.
Bonini, I. et al., 2014: Rainfall and deforestation in the municipality of Colíder, Southern Amazon. Revista Brasileira de Meteorologia, 29, 483–493, doi: 10.1590/0102-778620130665.
Bonnet, R., J. Boé, G. Dayon, and E. Martin, 2017: Twentieth-Century Hydrometeorological Reconstructions to Study the Multidecadal Variations of the Water Cycle Over France. Water Resources Research, 53(10), 8366–8382, doi: 10.1002/2017wr020596.
Bony, S. et al., 2013: Robust direct effect of carbon dioxide on tropical circulation and regional precipitation. Nature Geoscience, 6(6), 447–451, doi: 10.1038/ngeo1799.
Boos, W.R. and R.L. Korty, 2016: Regional energy budget control of the intertropical convergence zone and application to mid-Holocene rainfall. Nature Geoscience, 9(12), 892–897, doi: 10.1038/ngeo2833.
Boos, W.R. and T. Storelvmo, 2016: Near-linear response of mean monsoon strength to a broad range of radiative forcings. Proceedings of the National Academy of Sciences, 113(6), 1510–1515, doi: 10.1073/pnas.1517143113.
Booth, J.F., C.M. Naud, and J. Willison, 2018: Evaluation of extratropical cyclone precipitation in the North Atlantic basin: An analysis of ERA-Interim, WRF, and two CMIP5 models. Journal of Climate, 31(6), 2345–2360, doi: 10.1175/jcli-d-17-0308.1.
Borodina, A., E.M. Fischer, and R. Knutti, 2017: Models are likely to underestimate increase in heavy rainfall in the extratropical regions with high rainfall intensity. Geophysical Research Letters, 44(14), 7401–7409, doi: 10.1002/2017gl074530.
Bosmans, J.H.C. et al., 2018: Response of the Asian summer monsoons to idealized precession and obliquity forcing in a set of GCMs. Quaternary Science Reviews, 188, 121–135, doi: 10.1016/j.quascirev.2018.03.025.
Bouchaou, L. et al., 2013: Isotopic Composition and Age of Surface Water as Indicators of Groundwater Sustainability in a Semiarid Area: Case of the Souss Basin (Morocco). In: Isotopes in Hydrology, Marine Ecosystems and Climate Change Studies, Vol. 2. Proceedings of the International Symposium. International Atomic Energy Agency (IAEA), Vienna, Austria, pp. 169–175, www-pub.iaea.org/MTCD/Publications/PDF/SupplementaryMaterials/Pub1580_vol2_web.pdf .
Boulton, C.A., B.B.B. Booth, and P. Good, 2017: Exploring uncertainty of Amazon dieback in a perturbed parameter Earth system ensemble. Global Change Biology, 23(12), 5032–5044, doi: 10.1111/gcb.13733.
Boyaj, A., H.P. Dasari, I. Hoteit, and K. Ashok, 2020: Increasing heavy rainfall events in south India due to changing land use and land cover. Quarterly Journal of the Royal Meteorological Society, 146(732), 3064–3085, doi: 10.1002/qj.3826.
Boysen, L.R. et al., 2020: Global climate response to idealized deforestation in CMIP6 models. Biogeosciences, 17(22), 5615–5638, doi: 10.5194/bg-17-5615-2020.
Bozkurt, D., R. Rondanelli, J.C. Marín, and R. Garreaud, 2018: Foehn Event Triggered by an Atmospheric River Underlies Record-Setting Temperature Along Continental Antarctica. Journal of Geophysical Research: Atmospheres, 123(8), 3871–3892, doi: 10.1002/2017jd027796.
Bozkurt, D. et al., 2019: Dynamical downscaling over the complex terrain of southwest South America: present climate conditions and added value analysis. Climate Dynamics, 53(11), 6745–6767, doi: 10.1007/s00382-019-04959-y.
Bracegirdle, T.J. et al., 2020a: Improvements in Circumpolar Southern Hemisphere Extratropical Atmospheric Circulation in CMIP6 Compared to CMIP5. Earth and Space Science, 7(6), e2019EA001065, doi: 10.1029/2019ea001065.
Bracegirdle, T.J. et al., 2020b: Twenty first century changes in Antarctic and Southern Ocean surface climate in CMIP6. Atmospheric Science Letters, 21(9), e984, doi: 10.1002/asl.984.
Braconnot, P., C. Marzin, L. Grégoire, E. Mosquet, and O. Marti, 2008: Monsoon response to changes in Earth’s orbital parameters: comparisons between simulations of the Eemian and of the Holocene. Climate of the Past, 4(4), 281–294, doi: 10.5194/cp-4-281-2008.
Braconnot, P. et al., 2019: Impact of multiscale variability on last 6000 years Indian and West African monsoon rain. Geophysical Research Letters, 46(23), 14021–14029, doi: 10.1029/2019gl084797.
Brando, P.M. et al., 2014: Abrupt increases in Amazonian tree mortality due to drought–fire interactions. Proceedings of the National Academy of Sciences, doi: 10.1073/pnas.1305499111.
Braun, M.H. et al., 2019: Constraining glacier elevation and mass changes in South America. Nature Climate Change, 9(2), 130–136, doi: 10.1038/s41558-018-0375-7.
Breshears, D.D. et al., 2013: The critical amplifying role of increasing atmospheric moisture demand on tree mortality and associated regional die-off. Frontiers in Plant Science, 4, doi: 10.3389/fpls.2013.00266.
Brierley, C.M. et al., 2020: Large-scale features and evaluation of the PMIP4-CMIP6midHolocene simulations. Climate of the Past, 16(5), 1847–1872, doi: 10.5194/cp-16-1847-2020.
Broccoli, A.J., K.A. Dahl, and R.J. Stouffer, 2006: Response of the ITCZ to Northern Hemisphere cooling. Geophysical Research Letters, 33(1), L01702, doi: 10.1029/2005gl024546.
Brogli, R., S.L. Sørland, N. Kröner, and C. Schär, 2019: Causes of future Mediterranean precipitation decline depend on the season. Environmental Research Letters, 14(11), 114017, doi: 10.1088/1748-9326/ab4438.
Brönnimann, S. et al., 2015: Southward shift of the northern tropical belt from 1945 to 1980. Nature Geoscience, 8(12), 969–974, doi: 10.1038/ngeo2568.
Brovkin, V., M. Claussen, V. Petoukhov, and A. Ganopolski, 1998: On the stability of the atmosphere-vegetation system in the Sahara/Sahel region. Journal of Geophysical Research: Atmospheres, 103(D24), 31613–31624, doi: 10.1029/1998jd200006.
Brown, J.R., A.F. Moise, and R.A. Colman, 2017: Projected increases in daily to decadal variability of Asian-Australian monsoon rainfall. Geophysical Research Letters, 44(11), 5683–5690, doi: 10.1002/2017gl073217.
Brown, J.R., P. Hope, J. Gergis, and B.J. Henley, 2016a: ENSO teleconnections with Australian rainfall in coupled model simulations of the last millennium. Climate Dynamics, 47(1), 79–93, doi: 10.1007/s00382-015-2824-6.
Brown, J.R., A.F. Moise, R. Colman, and H. Zhang, 2016b: Will a warmer world mean a wetter or drier Australian monsoon?Journal of Climate, 29, 4577–4596, doi: 10.1175/jcli-d-15-0695.1.
Brown, R.D. and D.A. Robinson, 2011: Northern Hemisphere spring snow cover variability and change over 1922–2010 including an assessment of uncertainty. The Cryosphere, 5(1), 219–229, doi: 10.5194/tc-5-219-2011.
Brun, F., E. Berthier, P. Wagnon, A. Kääb, and D. Treichler, 2017: A spatially resolved estimate of High Mountain Asia glacier mass balances from 2000 to 2016. Nature Geoscience, 10(9), 668–673, doi: 10.1038/ngeo2999.
Brunke, M.A. et al., 2016: Implementing and evaluating variable soil thickness in the Community Land Model, version 4.5 (CLM4.5). Journal of Climate, 29(9), 3441–3461, doi: 10.1175/jcli-d-15-0307.1.
Bucak, T. et al., 2017: Future water availability in the largest freshwater Mediterranean lake is at great risk as evidenced from simulations with the SWAT model. Science of the Total Environment, 581–582, 413–425, doi: 10.1016/j.scitotenv.2016.12.149.
Buckley, B.M. et al., 2010: Climate as a contributing factor in the demise of Angkor, Cambodia. Proceedings of the National Academy of Sciences, 107(15), 6748–6752, doi: 10.1073/pnas.0910827107.
Buckley, M.W. and J. Marshall, 2016: Observations, inferences, and mechanisms of the Atlantic Meridional Overturning Circulation: A review. Reviews of Geophysics, 54(1), 5–63, doi: 10.1002/2015rg000493.
Bui, H.X. and E.D. Maloney, 2018: Changes in Madden–Julian Oscillation Precipitation and Wind Variance Under Global Warming. Geophysical Research Letters, 45(14), 7148–7155, doi: 10.1029/2018gl078504.
Bui, H.X., J.Y. Yu, and C. Chou, 2019: Impacts of model spatial resolution on the vertical structure of convection in the tropics. Climate Dynamics, 52(1–2), 15–27, doi: 10.1007/s00382-018-4125-3.
Bukovsky, M.S. et al., 2015: Toward Assessing NARCCAP Regional Climate Model Credibility for the North American Monsoon: Future Climate Simulations. Journal of Climate, 28(17), 6707–6728, doi: 10.1175/jcli-d-14-00695.1.
Bunde, A., U. Büntgen, J. Ludescher, J. Luterbacher, and H. von Storch, 2013: Is there memory in precipitation?Nature Climate Change, 3(3), 174–175, doi: 10.1038/nclimate1830.
Burdanowitz, J., S.A. Buehler, S. Bakan, and C. Klepp, 2019: The sensitivity of oceanic precipitation to sea surface temperature. Atmospheric Chemistry and Physics, 19(14), 9241–9252, doi: 10.5194/acp-19-9241-2019.
Burls, N.J. and A. Fedorov, 2017: Wetter subtropics in a warmer world: Contrasting past and future hydrological cycles. Proceedings of the National Academy of Sciences, 114(49), 12888–12893, doi: 10.1073/pnas.1703421114.
Byrne, M.P. and P.A. O’Gorman, 2015: The response of precipitation minus evapotranspiration to climate warming: Why the “Wet-get-wetter, dry-get-drier” scaling does not hold over land. Journal of Climate, 28(20), 8078–8092, doi: 10.1175/jcli-d-15-0369.1.
Byrne, M.P. and P.A. O’Gorman, 2016: Understanding decreases in land relative humidity with global warming: Conceptual model and GCM simulations. Journal of Climate, 29(24), 9045–9061, doi: 10.1175/jcli-d-16-0351.1.
Byrne, M.P. and T. Schneider, 2016: Narrowing of the ITCZ in a warming climate: Physical mechanisms. Geophysical Research Letters, 43(21), 11350–11357, doi: 10.1002/2016gl070396.
Byrne, M.P. and P.A. O’Gorman, 2018: Trends in continental temperature and humidity directly linked to ocean warming. Proceedings of the National Academy of Sciences, 115(19), 4863–4868, doi: 10.1073/pnas.1722312115.
Byrne, M.P., A.G. Pendergrass, A.D. Rapp, and K.R. Wodzicki, 2018: Response of the Intertropical Convergence Zone to Climate Change: Location, Width, and Strength. Current Climate Change Reports, 4(4), 355–370, doi: 10.1007/s40641-018-0110-5.
Caballero, R. and M. Huber, 2013: State-dependent climate sensitivity in past warm climates and its implications for future climate projections. Proceedings of the National Academy of Sciences, 110(35), 14162–14167, doi: 10.1073/pnas.1303365110.
Cai, W., T. Cowan, and M. Thatcher, 2012: Rainfall reductions over Southern Hemisphere semi-arid regions: The role of subtropical dry zone expansion. Scientific Reports, 2(1), 702, doi: 10.1038/srep00702.
Cai, W., A. Purich, T. Cowan, P. van Rensch, and E. Weller, 2014: Did Climate Change–Induced Rainfall Trends Contribute to the Australian Millennium Drought?Journal of Climate, 27(9), 3145–3168, doi: 10.1175/jcli-d-13-00322.1.
Cai, W. et al., 2020: Climate impacts of the El Niño-Southern Oscillation on South America. Nature Reviews Earth & Environment, 1(4), 215–231, doi: 10.1038/s43017-020-0040-3.
Cai, W. et al., 2021: Opposite response of strong and moderate positive Indian Ocean Dipole to global warming. Nature Climate Change, 11(1), 27–32, doi: 10.1038/s41558-020-00943-1.
Caillaud, C. et al., 2021: Modelling Mediterranean heavy precipitation events at climate scale: an object-oriented evaluation of the CNRM-AROME convection-permitting regional climate model. Climate Dynamics, 56(5–6), 1717–1752, doi: 10.1007/s00382-020-05558-y.
Caillouet, L., J.-P. Vidal, E. Sauquet, A. Devers, and B. Graff, 2017: Ensemble reconstruction of spatio-temporal extreme low-flow events in France since 1871. Hydrology and Earth System Sciences, 21(6), 2923–2951, doi: 10.5194/hess-21-2923-2017.
Caldwell, P.M. et al., 2019: The DOE E3SM Coupled Model Version 1: Description and Results at High Resolution. Journal of Advances in Modeling Earth Systems, 11(12), 4095–4146, doi: 10.1029/2019ms001870.
Camponogara, G., M.A.F. da Silva Dias, and G.G. Carrió, 2018: Biomass burning CCN enhance the dynamics of a mesoscale convective system over the La Plata Basin: a numerical approach. Atmospheric Chemistry and Physics, 18(3), 2081–2096, doi: 10.5194/acp-18-2081-2018.
Campos, M.C. et al., 2019: A new mechanism for millennial scale positive precipitation anomalies over tropical South America. Quaternary Science Reviews, 225, 105990, doi: 10.1016/j.quascirev.2019.105990.
Campos Braga, R. et al., 2017: Further evidence for CCN aerosol concentrations determining the height of warm rain and ice initiation in convective clouds over the Amazon basin. Atmospheric Chemistry and Physics, 17(23), 14433–14456, doi: 10.5194/acp-17-14433-2017.
Cannon, F., L.M. Carvalho, C. Jones, and B. Bookhagen, 2015: Multi-annual variations in winter westerly disturbance activity affecting the Himalaya. Climate Dynamics, 44(1–2), 441–455, doi: 10.1007/s00382-014-2248-8.
Cantú, A.G. et al., 2018: Evaluating changes of biomass in global vegetation models: the role of turnover fluctuations and ENSO events. Environmental Research Letters, 13(7), 075002, doi: 10.1088/1748-9326/aac63c.
Cao, G., B.R. Scanlon, D. Han, and C. Zheng, 2016: Impacts of thickening unsaturated zone on groundwater recharge in the North China Plain. Journal of Hydrology, 537, 260–270, doi: 10.1016/j.jhydrol.2016.03.049.
Cao, J. et al., 2020: Sources of the inter-model spread in projected global monsoon hydrological sensitivity. Geophysical Research Letters, 47(18), e2020GL089560, doi: 10.1029/2020gl089560.
Cao, L., G. Bala, and K. Caldeira, 2012: Climate response to changes in atmospheric carbon dioxide and solar irradiance on the time scale of days to weeks. Environmental Research Letters, 7(3), 34015, doi: 10.1088/1748-9326/7/3/034015.
Carlson, H. and R. Caballero, 2016: Enhanced MJO and transition to superrotation in warm climates. Journal of Advances in Modeling Earth Systems, 8(1), 304–318, doi: 10.1002/2015ms000615.
Carmona, A.M. and G. Poveda, 2014: Detection of long-term trends in monthly hydro-climatic series of Colombia through Empirical Mode Decomposition. Climatic Change, 123(2), 301–313, doi: 10.1007/s10584-013-1046-3.
Carré, M. et al., 2019: Modern drought conditions in western Sahel unprecedented in the past 1600 years. Climate Dynamics, 52(3), 1949–1964, doi: 10.1007/s00382-018-4311-3.
Cassou, C. et al., 2018: Decadal Climate Variability and Predictability: Challenges and Opportunities. Bulletin of the American Meteorological Society, 99(3), 479–490, doi: 10.1175/bams-d-16-0286.1.
Catalano, F., A. Alessandri, M. De Felice, Z. Zhu, and R.B. Myneni, 2016: Observationally based analysis of land–atmosphere coupling. Earth System Dynamics, 7(1), 251–266, doi: 10.5194/esd-7-251-2016.
Cattiaux, J., Y. Peings, D. Saint-Martin, N. Trou-Kechout, and S.J. Vavrus, 2016: Sinuosity of midlatitude atmospheric flow in a warming world. Geophysical Research Letters, 43(15), 8259–8268, doi: 10.1002/2016gl070309.
Catto, J.L., 2016: Extratropical cyclone classification and its use in climate studies. Reviews of Geophysics, 54(2), 486–520, doi: 10.1002/2016rg000519.
Catto, J.L., C. Jakob, and N. Nicholls, 2012: The influence of changes in synoptic regimes on north Australian wet season rainfall trends. Journal of Geophysical Research: Atmospheres, 117(D10), D10102, doi: 10.1029/2012jd017472.
Catto, J.L., C. Jakob, and N. Nicholls, 2015: Can the CMIP5 models represent winter frontal precipitation?Geophysical Research Letters, 42(20), 8596–8604, doi: 10.1002/2015gl066015.
Cavalcante, R.B.L., P.R.M. Pontes, P.W.M. Souza-Filho, and E.B. de Souza, 2019: Opposite Effects of Climate and Land Use Changes on the Annual Water Balance in the Amazon Arc of Deforestation. Water Resources Research, 55(4), 3092–3106, doi: 10.1029/2019wr025083.
Cavazos, T. et al., 2020: Climatic trends and regional climate models intercomparison over the CORDEX-CAM (Central America, Caribbean, and Mexico) domain. International Journal of Climatology, 40(3), 1396–1420, doi: 10.1002/joc.6276.
Ceppi, P. and J.M. Gregory, 2017: Relationship of tropospheric stability to climate sensitivity and Earth’s observed radiation budget. Proceedings of the National Academy of Sciences, 114(50), 13126–13131, doi: 10.1073/pnas.1714308114.
Ceppi, P. and T.G. Shepherd, 2017: Contributions of climate feedbacks to changes in atmospheric circulation. Journal of Climate, 30(22), 9097–9118, doi: 10.1175/jcli-d-17-0189.1.
Ceppi, P., G. Zappa, T.G. Shepherd, and J.M. Gregory, 2018: Fast and Slow Components of the Extratropical Atmospheric Circulation Response to CO2 forcing. Journal of Climate, 31(3), 1091–1105, doi: 10.1175/jcli-d-17-0323.1.
Chadburn, S. et al., 2015: An improved representation of physical permafrost dynamics in the JULES land-surface model. Geoscientific Model Development, 8(5), 1493–1508, doi: 10.5194/gmd-8-1493-2015.
Chadwick, R. and P. Good, 2013: Understanding nonlinear tropical precipitation responses to CO2 forcing. Geophysical Research Letters, 40(18), 4911–4915, doi: 10.1002/grl.50932.
Chadwick, R., I. Boutle, and G. Martin, 2013: Spatial patterns of precipitation change in CMIP5: Why the rich do not get richer in the tropics. Journal of Climate, 26(11), 3803–3822, doi: 10.1175/jcli-d-12-00543.1.
Chadwick, R., P. Good, and K. Willett, 2016a: A simple moisture advection model of specific humidity change over land in response to SST warming. Journal of Climate, 29(21), 7613–7632, doi: 10.1175/jcli-d-16-0241.1.
Chadwick, R., H. Douville, and C.B. Skinner, 2017: Timeslice experiments for understanding regional climate projections: applications to the tropical hydrological cycle and European winter circulation. Climate Dynamics, 49(9–10), 3011–3029, doi: 10.1007/s00382-016-3488-6.
Chadwick, R., P. Good, T. Andrews, and G. Martin, 2014: Surface warming patterns drive tropical rainfall pattern responses to CO2 forcing on all timescales. Geophysical Research Letters, 41(2), 610–615, doi: 10.1002/2013gl058504.
Chadwick, R., P. Good, G. Martin, and D.P. Rowell, 2016b: Large rainfall changes consistently projected over substantial areas of tropical land. Nature Climate Change, 6(2), 177–181, doi: 10.1038/nclimate2805.
Chan, K.T.F., 2019: Are global tropical cyclones moving slower in a warming climate?Environmental Research Letters, 14(10), 104015, doi: 10.1088/1748-9326/ab4031.
Chan, S.C., E.J. Kendon, N.M. Roberts, H.J. Fowler, and S. Blenkinsop, 2016: The characteristics of summer sub-hourly rainfall over the southern UK in a high-resolution convective permitting model. Environmental Research Letters, 11(9), 94024, doi: 10.1088/1748-9326/11/9/094024.
Chan, S.C., E.J. Kendon, N. Roberts, S. Blenkinsop, and H.J. Fowler, 2018: Large-Scale Predictors for Extreme Hourly Precipitation Events in Convection-Permitting Climate Simulations. Journal of Climate, 31(6), 2115–2131, doi: 10.1175/jcli-d-17-0404.1.
Chandan, D. and W.R. Peltier, 2020: African Humid Period Precipitation Sustained by Robust Vegetation, Soil, and Lake Feedbacks. Geophysical Research Letters, 47(21), e2020GL088728, doi: 10.1029/2020gl088728.
Chandana, K.R., U.S. Banerji, and R. Bhushan, 2018: Review on Indian summer monsoon (ISM) reconstructions since LGM from Northern Indian Ocean. Earth Science India, 11(1), 71–84.
Chandran, A., G. Basha, and T.B.M.J. Ouarda, 2016: Influence of climate oscillations on temperature and precipitation over the United Arab Emirates. International Journal of Climatology, 36(1), 225–235, doi: 10.1002/joc.4339.
Chang, E.K.M., 2018: CMIP5 projected change in Northern Hemisphere winter cyclones with associated extreme winds. Journal of Climate, 31(16), 6527–6542, doi: 10.1175/jcli-d-17-0899.1.
Chang, E.K.M. and A.M.W. Yau, 2016: Northern Hemisphere winter storm track trends since 1959 derived from multiple reanalysis datasets. Climate Dynamics, 47(5–6), 1435–1454, doi: 10.1007/s00382-015-2911-8.
Chang, E.K.M., Y. Guo, X. Xia, and M. Zheng, 2013: Storm-track activity in IPCC AR4/CMIP3 model simulations. Journal of Climate, 26(1), 246–260, doi: 10.1175/jcli-d-11-00707.1.
Chang, E.K.M., C.-G. Ma, C. Zheng, and A.M.W. Yau, 2016: Observed and projected decrease in Northern Hemisphere extratropical cyclone activity in summer and its impacts on maximum temperature. Geophysical Research Letters, 43(5), 2200–2208, doi: 10.1002/2016gl068172.
Chang, L.L. et al., 2018: Why Do Large-Scale Land Surface Models Produce a Low Ratio of Transpiration to Evapotranspiration?Journal of Geophysical Research: Atmospheres, 123(17), 9109–9130, doi: 10.1029/2018jd029159.
Charney, J.G., 1975: Dynamics of deserts and drought in the Sahel. Quarterly Journal of the Royal Meteorological Society, 101(428), 193–202, doi: 10.1002/qj.49710142802.
Chauvin, F., H. Douville, and A. Ribes, 2017: Atlantic tropical cyclones water budget in observations and CNRM-CM5 model. Climate Dynamics, 49(11–12), 4009–4021, doi: 10.1007/s00382-017-3559-3.
Chegwidden, O.S. et al., 2019: How Do Modeling Decisions Affect the Spread Among Hydrologic Climate Change Projections? Exploring a Large Ensemble of Simulations Across a Diversity of Hydroclimates. Earth’s Future, 7(6), 623–637, doi: 10.1029/2018ef001047.
Chemke, R. and L.M. Polvani, 2019: Exploiting the abrupt 4 × CO2 scenario to elucidate tropical expansion mechanisms. Journal of Climate, 32(3), 859–875, doi: 10.1175/jcli-d-18-0330.1.
Chemke, R. and L.M. Polvani, 2020: Elucidating the mechanisms responsible for Hadley cell weakening under 4 × CO2 forcing. Geophysical Research Letters, 48(3), e2020GL090348, doi: 10.1029/2020gl090348.
Chen, D. and A. Dai, 2019: Precipitation Characteristics in the Community Atmosphere Model and Their Dependence on Model Physics and Resolution. Journal of Advances in Modeling Earth Systems, 11(7), 2352–2374, doi: 10.1029/2018ms001536.
Chen, F. and Y. Gao, 2018: Evaluation of precipitation trends from high-resolution satellite precipitation products over Mainland China. Climate Dynamics, 51(9–10), 3311–3331, doi: 10.1007/s00382-018-4080-z.
Chen, G. and I.M. Held, 2007: Phase speed spectra and the recent poleward shift of Southern Hemisphere surface westerlies. Geophysical Research Letters, 34(21), L21805, doi: 10.1029/2007gl031200.
Chen, G., J. Lu, and D.M.W. Frierson, 2008: Phase Speed Spectra and the Latitude of Surface Westerlies: Interannual Variability and Global Warming Trend. Journal of Climate, 21(22), 5942–5959, doi: 10.1175/2008jcli2306.1.
Chen, G., W.C. Wang, and J.P. Chen, 2018: Circulation responses to regional aerosol climate forcing in summer over East Asia. Climate Dynamics, 51(11–12), 3973–3984, doi: 10.1007/s00382-018-4267-3.
Chen, H. and J. Sun, 2017: Anthropogenic warming has caused hot droughts more frequently in China. Journal of Hydrology, 544, 306–318, doi: 10.1016/j.jhydrol.2016.11.044.
Chen, H. et al., 2020: Impacts of land use change and climatic effects on streamflow in the Chinese Loess Plateau: A meta-analysis. Science of the Total Environment, 703, 134989, doi: 10.1016/j.scitotenv.2019.134989.
Chen, J. and F.P. Brissette, 2019: Reliability of climate model multi-member ensembles in estimating internal precipitation and temperature variability at the multi-decadal scale. International Journal of Climatology, 39(2), 843–856, doi: 10.1002/joc.5846.
Chen, J., J. Li, Z. Zhang, and S. Ni, 2014: Long-term groundwater variations in Northwest India from satellite gravity measurements. Global and Planetary Change, 116, 130–138, doi: 10.1016/j.gloplacha.2014.02.007.
Chen, J., A. Dai, Y. Zhang, and K.L. Rasmussen, 2020a: Changes in Convective Available Potential Energy and Convective Inhibition under Global Warming. Journal of Climate, 33(6), 2025–2050, doi: 10.1175/jcli-d-19-0461.1.
Chen, J., L. Theller, M.W. Gitau, B.A. Engel, and J.M. Harbor, 2017: Urbanization impacts on surface runoff of the contiguous United States. Journal of Environmental Management, 187, 470–481, doi: 10.1016/j.jenvman.2016.11.017.
Chen, J. et al., 2020b: Impacts of climate change on tropical cyclones and induced storm surges in the Pearl River Delta region using pseudo-global-warming method. Scientific Reports, 10(1), 1965, doi: 10.1038/s41598-020-58824-8.
Chen, L., X. Qu, G. Huang, and Y. Gong, 2019: Projections of East Asian summer monsoon under 1.5°C and 2°C warming goals. Theoretical and Applied Climatology, 137(3–4), 2187–2201, doi: 10.1007/s00704-018-2720-1.
Chen, R., I.R. Simpson, C. Deser, and B. Wang, 2020: Model Biases in the Simulation of the Springtime North Pacific ENSO Teleconnection. Journal of Climate, 33(23), 9985–10002, doi: 10.1175/jcli-d-19-1004.1.
Chen, X., S. Wang, Z. Hu, Q. Zhou, and Q. Hu, 2018: Spatiotemporal characteristics of seasonal precipitation and their relationships with ENSO in Central Asia during 1901–2013. Journal of Geographical Sciences, 28(9), 1341–1368, doi: 10.1007/s11442-018-1529-2.
Chen, Y., B. Langenbrunner, and J.T. Randerson, 2018: Future Drying in Central America and Northern South America Linked With Atlantic Meridional Overturning Circulation. Geophysical Research Letters, 45(17), 9226–9235, doi: 10.1029/2018gl077953.
Chen, Z., T. Zhou, W. Zhang, P. Li, and S. Zhao, 2020a: Projected Changes in the Annual Range of Precipitation Under Stabilized 1.5°C and 2.0°C Warming Futures. Earth’s Future, 8(9), e2019EF001435, doi: 10.1029/2019ef001435.
Chen, Z. et al., 2020b: Global Land Monsoon Precipitation Changes in CMIP6 Projections. Geophysical Research Letters, 47(14), e2019GL086902, doi: 10.1029/2019gl086902.
Cheng, H., A. Sinha, X. Wang, F.W. Cruz, and R.L. Edwards, 2012: The Global Paleomonsoon as seen through speleothem records from Asia and the Americas. Climate Dynamics, 39(5), 1045–1062, doi: 10.1007/s00382-012-1363-7.
Cheng, H. et al., 2016: The Asian monsoon over the past 640,000 years and ice age terminations. Nature, 534(7609), 640–646, doi: 10.1038/nature18591.
Cheng, L. et al., 2017: Recent increases in terrestrial carbon uptake at little cost to the water cycle. Nature Communications, 8(1), 110, doi: 10.1038/s41467-017-00114-5.
Chernokulsky, A. et al., 2019: Observed changes in convective and stratiform precipitation in Northern Eurasia over the last five decades. Environmental Research Letters, 14(4), 45001, doi: 10.1088/1748-9326/aafb82.
Cheung, A.H. et al., 2017: Comparison of Low-Frequency Internal Climate Variability in CMIP5 Models and Observations. Journal of Climate, 30(12), 4763–4776, doi: 10.1175/jcli-d-16-0712.1.
Cheung, R.C.W. et al., 2018: Decadal- to Centennial-Scale East Asian Summer Monsoon Variability Over the Past Millennium: An Oceanic Perspective. Geophysical Research Letters, 45(15), 7711–7718, doi: 10.1029/2018gl077978.
Chevuturi, A., N.P. Klingaman, A.G. Turner, and S. Hannah, 2018: Projected Changes in the Asian–Australian Monsoon Region in 1.5°C and 2.0°C Global-Warming Scenarios. Earth’s Future, 6(3), 339–358, doi: 10.1002/2017ef000734.
Chiang, J.C.H. and C.M. Bitz, 2005: Influence of high latitude ice cover on the marine Intertropical Convergence Zone. Climate Dynamics, 25(5), 477–496, doi: 10.1007/s00382-005-0040-5.
Chiang, J.C.H. and A.R. Friedman, 2012: Extratropical Cooling, Interhemispheric Thermal Gradients, and Tropical Climate Change. Annual Review of Earth and Planetary Sciences, 40(1), 383–412, doi: 10.1146/annurev-earth-042711-105545.
Chiang, J.C.H., C.-Y. Chang, and M.F. Wehner, 2013: Long-Term Behavior of the Atlantic Interhemispheric SST Gradient in the CMIP5 Historical Simulations. Journal of Climate, 26(21), 8628–8640, doi: 10.1175/jcli-d-12-00487.1.
Choobari, O.A., P. Zawar-Reza, and A. Sturman, 2014: The global distribution of mineral dust and its impacts on the climate system: A review. Atmospheric Research, 138, 152–165, doi: 10.1016/j.atmosres.2013.11.007.
Chou, C., C.-A. Chen, P.-H. Tan, and K.T. Chen, 2012: Mechanisms for Global Warming Impacts on Precipitation Frequency and Intensity. Journal of Climate, 25(9), 3291–3306, doi: 10.1175/jcli-d-11-00239.1.
Chou, C. et al., 2013: Increase in the range between wet and dry season precipitation. Nature Geoscience, 6(4), 263–267, doi: 10.1038/ngeo1744.
Chou, S.C. et al., 2014: Assessment of Climate Change over South America under RCP 4.5 and 8.5 Downscaling Scenarios. American Journal of Climate Change, 3(5), 512–527, doi: 10.4236/ajcc.2014.35043.
Choudhury, A.D. et al., 2018: A Phenomenological Paradigm for Midtropospheric Cyclogenesis in the Indian Summer Monsoon. Journal of the Atmospheric Sciences, 75(9), 2931–2954, doi: 10.1175/jas-d-17-0356.1.
Christensen, J.H. et al., 2013: Climate Phenomena and their Relevance for Future Regional Climate Change. In: Climate Change 2013: The Physical Science Basis. Contribution of Working Group I to the Fifth Assessment Report of the Intergovernmental Panel on Climate Change[Stocker, T.F., D. Qin, G.-K. Plattner, M. Tignor, S.K. Allen, J. Boschung, A. Nauels, Y. Xia, V. Bex, and P.M. Midgley (eds.)]. Cambridge University Press, Cambridge, United Kingdom and New York, NY, USA, pp. 1217–1308, doi: 10.1017/cbo9781107415324.028.
Chua, X.R. and Y. Ming, 2020: Convective Invigoration Traced to Warm-Rain Microphysics. Geophysical Research Letters, 47(23), e2020GL089134, doi: 10.1029/2020gl089134.
Chung, C.T.Y., S.B. Power, J.M. Arblaster, H.A. Rashid, and G.L. Roff, 2014: Nonlinear precipitation response to El Niño and global warming in the Indo-Pacific. Climate Dynamics, 42(7–8), 1837–1856, doi: 10.1007/s00382-013-1892-8.
Chung, E.-S. and B.J. Soden, 2017: Hemispheric climate shifts driven by anthropogenic aerosol–cloud interactions. Nature Geoscience, 10(8), 566–571, doi: 10.1038/ngeo2988.
Chung, E.-S., B. Soden, B.J. Sohn, and L. Shi, 2014: Upper-tropospheric moistening in response to anthropogenic warming. Proceedings of the National Academy of Sciences, 111(32), 11636–11641, doi: 10.1073/pnas.1409659111.
Chung, E.-S. et al., 2019: Reconciling opposing Walker circulation trends in observations and model projections. Nature Climate Change, 9(5), 405–412, doi: 10.1038/s41558-019-0446-4.
Ciasto, L.M., C. Li, J.J. Wettstein, and N.G. Kvamstø, 2016: North Atlantic Storm-Track Sensitivity to Projected Sea Surface Temperature: Local versus Remote Influences. Journal of Climate, 29(19), 6973–6991, doi: 10.1175/jcli-d-15-0860.1.
Clark, S., M.J. Reeder, and C. Jakob, 2018: Rainfall regimes over northwestern Australia. Quarterly Journal of the Royal Meteorological Society, 144(711), 458–467, doi: 10.1002/qj.3217.
Clarke, G.K.C., A.H. Jarosch, F.S. Anslow, V. Radić, and B. Menounos, 2015: Projected deglaciation of western Canada in the twenty-first century. Nature Geoscience, 8, 372, doi: 10.1038/ngeo2407.
Claussen, M., S. Bathiany, V. Brovkin, and T. Kleinen, 2013: Simulated climate-vegetation interaction in semi-arid regions affected by plant diversity. Nature Geoscience, 6, 954–958, doi: 10.1038/ngeo1962.
Claussen, M., V. Brovkin, A. Ganopolski, C. Kubatzki, and V. Petoukhov, 2003: Climate change in northern Africa: The past is not the future. Climatic Change, 57, 99–118, doi: 10.1023/a:1022115604225.
Coats, S. and K.B. Karnauskas, 2017: Are Simulated and Observed Twentieth Century Tropical Pacific Sea Surface Temperature Trends Significant Relative to Internal Variability?Geophysical Research Letters, 44, 9928–9937, doi: 10.1002/2017gl074622.
Coats, S., J.E. Smerdon, B.I. Cook, and R. Seager, 2015: Are Simulated Megadroughts in the North American Southwest Forced?Journal of Climate, 28(1), 124–142, doi: 10.1175/jcli-d-14-00071.1.
Coats, S. et al., 2016: Internal ocean–atmosphere variability drives megadroughts in Western North America. Geophysical Research Letters, 43(18), 9886–9894, doi: 10.1002/2016gl070105.
Colle, B.A., J.F. Booth, and E.K.M. Chang, 2015: A Review of Historical and Future Changes of Extratropical Cyclones and Associated Impacts Along the US East Coast. Current Climate Change Reports, 1(3), 125–143, doi: 10.1007/s40641-015-0013-7.
Collins, M. et al., 2013: Long-term Climate Change: Projections, Commitments and Irreversibility. In: Climate Change 2013: The Physical Science Basis. Contribution of Working Group I to the Fifth Assessment Report of the Intergovernmental Panel on Climate Change[Stocker, T.F., D. Qin, G.-K. Plattner, M. Tignor, S.K. Allen, J. Boschung, A. Nauels, Y. Xia, V. Bex, and P.M. Midgley (eds.)]. Cambridge University Press, Cambridge, United Kingdom and New York, NY, USA, pp. 1029–1136, doi: 10.1017/cbo9781107415324.024.
Collins, S., 2017: Incorporating groundwater flow in land surface models: literature review and recommendations for further work. OR/17/068, British Geological Survey Open Report, 23 pp., http://nora.nerc.ac.uk/id/eprint/519389.
Colonia, D. et al., 2017: Compiling an Inventory of Glacier-Bed Overdeepenings and Potential New Lakes in De-Glaciating Areas of the Peruvian Andes: Approach, First Results, and Perspectives for Adaptation to Climate Change. Water, 9(5), 336, doi: 10.3390/w9050336.
Colose, C.M., A.N. LeGrande, and M. Vuille, 2016: Hemispherically asymmetric volcanic forcing of tropical hydroclimate during the last millennium. Earth System Dynamics, 7(3), 681–696, doi: 10.5194/esd-7-681-2016.
Comas-Bru, L. and F. McDermott, 2014: Impacts of the EA and SCA patterns on the European twentieth century NAO-winter climate relationship. Quarterly Journal of the Royal Meteorological Society, 140(679), 354–363, doi: 10.1002/qj.2158.
Comte, J.-C. et al., 2016: Challenges in groundwater resource management in coastal aquifers of East Africa: Investigations and lessons learnt in the Comoros Islands, Kenya and Tanzania. Journal of Hydrology: Regional Studies, 5, 179–199, doi: 10.1016/j.ejrh.2015.12.065.
Condon, L.E., A.L. Atchley, and R.M. Maxwell, 2020: Evapotranspiration depletes groundwater under warming over the contiguous United States. Nature Communications, 11(1), 873, doi: 10.1038/s41467-020-14688-0.
Conway, D., E. Allison, R. Felstead, and M. Goulden, 2005: Rainfall variability in East Africa: implications for natural resources management and livelihoods. Philosophical Transactions of the Royal Society A: Mathematical, Physical and Engineering Sciences, 363(1826), 49–54, doi: 10.1098/rsta. 2004.1475.
Cook, B.I. and R. Seager, 2013: The response of the North American Monsoon to increased greenhouse gas forcing. Journal of Geophysical Research: Atmospheres, 118(4), 1690–1699, doi: 10.1002/jgrd.50111.
Cook, B.I., R.L. Miller, and R. Seager, 2009: Amplification of the North American “Dust Bowl” drought through human-induced land degradation. Proceedings of the National Academy of Sciences, 106(13), 4997–5001, doi: 10.1073/pnas.0810200106.
Cook, B.I., T.R. Ault, and J.E. Smerdon, 2015: Unprecedented 21st century drought risk in the American Southwest and Central Plains. Science Advances, 1(1), e1400082, doi: 10.1126/sciadv.1400082.
Cook, B.I., J.S. Mankin, and K.J. Anchukaitis, 2018: Climate Change and Drought: From Past to Future. Current Climate Change Reports, 4(2), 164–179, doi: 10.1007/s40641-018-0093-2.
Cook, B.I., R. Seager, R.L. Miller, and J.A. Mason, 2013: Intensification of North American Megadroughts through Surface and Dust Aerosol Forcing. Journal of Climate, 26(13), 4414–4430, doi: 10.1175/jcli-d-12-00022.1.
Cook, B.I., J.E. Smerdon, R. Seager, and S. Coats, 2014: Global warming and 21st century drying. Climate Dynamics, 43(9–10), 2607–2627, doi: 10.1007/s00382-014-2075-y.
Cook, B.I., K.J. Anchukaitis, R. Touchan, D.M. Meko, and E.R. Cook, 2016a: Spatiotemporal drought variability in the Mediterranean over the last 900 years. Journal of Geophysical Research: Atmospheres, 121(5), 2060–2074, doi: 10.1002/2015jd023929.
Cook, B.I. et al., 2016b: North American megadroughts in the Common Era: reconstructions and simulations. WIREs Climate Change, 7(3), 411–432, doi: 10.1002/wcc.394.
Cook, B.I. et al., 2016c: The paleoclimate context and future trajectory of extreme summer hydroclimate in eastern Australia. Journal of Geophysical Research: Atmospheres, 121(21), 12820–12838, doi: 10.1002/2016jd024892.
Cook, B.I. et al., 2019: Climate Change Amplification of Natural Drought Variability: The Historic Mid-Twentieth Century North American Drought In a Warmer World. Journal of Climate, 32(17), 5417–5436, doi: 10.1175/jcli-d-18-0832.1.
Cook, B.I. et al., 2020: Twenty-First Century Drought Projections in the CMIP6 Forcing Scenarios. Earth’s Future, 8(6), e2019EF001461, doi: 10.1029/2019ef001461.
Cook, E.R., C.A. Woodhouse, C.M. Eakin, D.M. Meko, and D.W. Stahle, 2004: Long-Term Aridity Changes in the Western United States. Science, 306(5698), 1015–1018, doi: 10.1126/science.1102586.
Cook, E.R. et al., 2010: Megadroughts in North America: placing IPCC projections of hydroclimatic change in a long-term palaeoclimate context. Journal of Quaternary Science, 25(1), 48–61, doi: 10.1002/jqs.1303.
Cook, E.R. et al., 2015: Old World megadroughts and pluvials during the Common Era. Science Advances, 1(10), e1500561, doi: 10.1126/sciadv.1500561.
Cook, K.H. and E.K. Vizy, 2012: Impact of climate change on mid-twenty-first century growing seasons in Africa. Climate Dynamics, 39(12), 2937–2955, doi: 10.1007/s00382-012-1324-1.
Cook, K.H., E.K. Vizy, K.H. Cook, and E.K. Vizy, 2015: Detection and analysis of an amplified warming of the Sahara Desert. Journal of Climate, 28(16), 6560–6580, doi: 10.1175/jcli-d-14-00230.1.
Corona, R., N. Montaldo, and J.D. Albertson, 2018: On the Role of NAO-Driven Interannual Variability in Rainfall Seasonality on Water Resources and Hydrologic Design in a Typical Mediterranean Basin. Journal of Hydrometeorology, 19(3), 485–498, doi: 10.1175/jhm-d-17-0078.1.
Correa, I., P.A. Arias, and M. Rojas, 2021: Evaluation of multiple indices of the South American monsoon. International Journal of Climatology, 41, E2801–E2819, doi: 10.1002/joc.6880.
Corvec, S. and C.G. Fletcher, 2017: Changes to the tropical circulation in the mid-Pliocene and their implications for future climate. Climate of the Past, 13(2), 135–147, doi: 10.5194/cp-13-135-2017.
Costantino, L. and F.-M. Bréon, 2010: Analysis of aerosol–cloud interaction from multi-sensor satellite observations. Geophysical Research Letters, 37(11), L11801, doi: 10.1029/2009gl041828.
Coumou, D., J. Lehmann, and J. Beckmann, 2015: The weakening summer circulation in the Northern Hemisphere mid-latitudes. Science, 348(6232), 324–327, doi: 10.1126/science.1261768.
Coumou, D., V. Petoukhov, S. Rahmstorf, S. Petri, and H.J. Schellnhuber, 2014: Quasi-resonant circulation regimes and hemispheric synchronization of extreme weather in boreal summer. Proceedings of the National Academy of Sciences, 111(34), 12331–12336, doi: 10.1073/pnas.1412797111.
Couvreux, F. et al., 2015: Representation of daytime moist convection over the semi-arid Tropics by parametrizations used in climate and meteorological models. Quarterly Journal of the Royal Meteorological Society, 141(691), 2220–2236, doi: 10.1002/qj.2517.
Cowan, T. et al., 2020: Ocean and land forcing of the record-breaking Dust Bowl heatwaves across central United States. Nature Communications, 11(1), 2870, doi: 10.1038/s41467-020-16676-w.
Cox, P.M. et al., 2004: Amazonian forest dieback under climate–carbon cycle projections for the 21st century. Theoretical and Applied Climatology, 78(1–3), 137–156, doi: 10.1007/s00704-004-0049-4.
Creamean, J.M. et al., 2013: Dust and biological aerosols from the Sahara and Asia influence precipitation in the Western U.S. Science, 340(6127), 1572–1578, doi: 10.1126/science.1227279.
Crook, J.A., L.S. Jackson, S.M. Osprey, and P.M. Forster, 2015: A comparison of temperature and precipitation responses to different Earth radiation management geoengineering schemes. Journal of Geophysical Research: Atmospheres, 120(18), 9352–9373, doi: 10.1002/2015jd023269.
Cruz, F.W. et al., 2005: Insolation-driven changes in atmospheric circulation over the past 116,000 years in subtropical Brazil. Nature, 434(7029), 63–66, doi: 10.1038/nature03365.
CSIRO and BoM, 2015: Climate Change in Australia. Projections for Australia’s Natural Resource Management Regions: Technical Report. CSIRO and Bureau of Meteorology, Australia, 222 pp., doi: 10.4225/08/58518c08c4ce8.
Cui, J., L. Wang, T. Li, and B. Wu, 2020: Can reanalysis products with only surface variables assimilated capture Madden–Julian oscillation characteristics?International Journal of Climatology, 40(2), 1279–1293, doi: 10.1002/joc.6270.
Cui, W., X. Dong, B. Xi, and A. Kennedy, 2017: Evaluation of Reanalyzed Precipitation Variability and Trends Using the Gridded Gauge-Based Analysis over the CONUS. Journal of Hydrometeorology, 18(8), 2227–2248, doi: 10.1175/jhm-d-17-0029.1.
Cuthbert, M.O. et al., 2019a: Global patterns and dynamics of climate–groundwater interactions. Nature Climate Change, 9(2), 137–141, doi: 10.1038/s41558-018-0386-4.
Cuthbert, M.O. et al., 2019b: Observed controls on resilience of groundwater to climate variability in sub-Saharan Africa. Nature, 572(7768), 230–234, doi: 10.1038/s41586-019-1441-7.
D’Agostino, R. and P. Lionello, 2017: Evidence of global warming impact on the evolution of the Hadley Circulation in ECMWF centennial reanalyses. Climate Dynamics, 48(9–10), 3047–3060, doi: 10.1007/s00382-016-3250-0.
D’Agostino, R., P. Lionello, O. Adam, and T. Schneider, 2017: Factors controlling Hadley circulation changes from the Last Glacial Maximum to the end of the 21st century. Geophysical Research Letters, 44(16), 8585–8591, doi: 10.1002/2017gl074533.
D’Agostino, R., A.L. Scambiati, J. Jungclaus, and P. Lionello, 2020a: Poleward Shift of Northern Subtropics in Winter: Time of Emergence of Zonal Versus Regional Signals. Geophysical Research Letters, 47(19), e2020GL089325, doi: 10.1029/2020gl089325.
D’Agostino, R., J. Bader, S. Bordoni, D. Ferreira, and J. Jungclaus, 2019: Northern Hemisphere Monsoon Response to Mid-Holocene Orbital Forcing and Greenhouse Gas-Induced Global Warming. Geophysical Research Letters, 46(3), 1591–1601, doi: 10.1029/2018gl081589.
D’Agostino, R. et al., 2020b: Contrasting Southern Hemisphere Monsoon Response: MidHolocene Orbital Forcing versus Future Greenhouse Gas–Induced Global Warming. Journal of Climate, 33(22), 9595–9613, doi: 10.1175/jcli-d-19-0672.1.
D’Errico, M. et al., 2015: Indian monsoon and the elevated-heat-pump mechanism in a coupled aerosol–climate model. Journal of Geophysical Research: Atmospheres, 120(17), 8712–8723, doi: 10.1002/2015jd023346.
D’Odorico, P. et al., 2018: The Global Food–Energy–Water Nexus. Reviews of Geophysics, 56(3), 1–76, doi: 10.1029/2017rg000591.
Dacre, H.F., O. Martínez-Alvarado, and C.O. Mbengue, 2019: Linking Atmospheric Rivers and Warm Conveyor Belt Airflows. Journal of Hydrometeorology, 20(6), 1183–1196, doi: 10.1175/jhm-d-18-0175.1.
Dagan, G. and P. Stier, 2020: Constraint on precipitation response to climate change by combination of atmospheric energy and water budgets. npj Climate and Atmospheric Science, 3(1), 34, doi: 10.1038/s41612-020-00137-8.
Dagan, G., P. Stier, and D. Watson-Parris, 2019a: Analysis of the Atmospheric Water Budget for Elucidating the Spatial Scale of Precipitation Changes Under Climate Change. Geophysical Research Letters, 46(17–18), 10504–10511, doi: 10.1029/2019gl084173.
Dagan, G., P. Stier, and D. Watson-Parris, 2019b: Contrasting Response of Precipitation to Aerosol Perturbation in the Tropics and Extratropics Explained by Energy Budget Considerations. Geophysical Research Letters, 46(13), 7828–7837, doi: 10.1029/2019gl083479.
Dagan, G., I. Koren, O. Altaratz, and R.H. Heiblum, 2017: Time-dependent, non-monotonic response of warm convective cloud fields to changes in aerosol loading. Atmospheric Chemistry and Physics, 17(12), 7435–7444, doi: 10.5194/acp-17-7435-2017.
Dagon, K. and D.P. Schrag, 2016: Exploring the effects of solar radiation management on water cycling in a coupled land-atmosphere model. Journal of Climate, 29(7), 2635–2650, doi: 10.1175/jcli-d-15-0472.1.
Dai, A., 2016: Historical and Future Changes in Streamflow and Continental Runoff. In: Terrestrial Water Cycle and Climate Change[Tang, Q. and T. Oki (eds.)]. American Geophysical Union (AGU), pp. 17–37, doi: 10.1002/9781118971772.ch2.
Dai, A., 2021: Hydroclimatic trends during 1950–2018 over global land. Climate Dynamics, 56(11–12), 4027–4049, doi: 10.1007/s00382-021-05684-1.
Dai, A. and C.E. Bloecker, 2019: Impacts of internal variability on temperature and precipitation trends in large ensemble simulations by two climate models. Climate Dynamics, 52(1–2), 289–306, doi: 10.1007/s00382-018-4132-4.
Dai, A., T. Zhao, and J. Chen, 2018: Climate Change and Drought: a Precipitation and Evaporation Perspective. Current Climate Change Reports, 4(3), 301–312, doi: 10.1007/s40641-018-0101-6.
Dallmeyer, A., M. Claussen, S.J. Lorenz, and T. Shanahan, 2020: The end of the African humid period as seen by a transient comprehensive Earth system model simulation of the last 8000 years. Climate of the Past, 16(1), 117–140, doi: 10.5194/cp-16-117-2020.
Danabasoglu, G. et al., 2020: The Community Earth System Model Version 2 (CESM2). Journal of Advances in Modeling Earth Systems, 12(2), 1–35, doi: 10.1029/2019ms001916.
Davidson, N.C., 2014: How much wetland has the world lost? Long-term and recent trends in global wetland area. Marine and Freshwater Research, 65(10), 934, doi: 10.1071/mf14173.
Davidson, N.C., E. Fluet-Chouinard, and C.M. Finlayson, 2018: Global extent and distribution of wetlands: trends and issues. Marine and Freshwater Research. Marine and Freshwater Research, 69(4), 620–627, doi: 10.1071/mf17019.
Davie, J.C.S. et al., 2013: Comparing projections of future changes in runoff from hydrological and biome models in ISI-MIP. Earth System Dynamics, 4(2), 359–374, doi: 10.5194/esd-4-359-2013.
Davini, P. and F. D’Andrea, 2016: Northern Hemisphere atmospheric blocking representation in global climate models: Twenty years of improvements?Journal of Climate, 29(24), 8823–8840, doi: 10.1175/jcli-d-16-0242.1.
Davini, P. and F. D’Andrea, 2020: From CMIP3 to CMIP6: Northern Hemisphere Atmospheric Blocking Simulation in Present and Future Climate. Journal of Climate, 33(23), 10021–10038, doi: 10.1175/jcli-d-19-0862.1.
Davini, P., S. Corti, F. D’Andrea, G. Rivière, and J. von Hardenberg, 2017: Improved Winter European Atmospheric Blocking Frequencies in High-Resolution Global Climate Simulations. Journal of Advances in Modeling Earth Systems, 9(7), 2615–2634, doi: 10.1002/2017ms001082.
Davis, N.A., D.J. Seidel, T. Birner, S.M. Davis, and S. Tilmes, 2016: Changes in the width of the tropical belt due to simple radiative forcing changes in the GeoMIP simulations. Atmospheric Chemistry and Physics, 16(15), 10083–10095, doi: 10.5194/acp-16-10083-2016.
Day, J.A., I. Fung, and W. Liu, 2018: Changing character of rainfall in eastern China, 1951–2007. Proceedings of the National Academy of Sciences, 115(9), 2016–2021, doi: 10.1073/pnas.1715386115.
de Graaf, I.E.M., T. Gleeson, L.P.H. van Beek, E.H. Sutanudjaja, and M.F.P. Bierkens, 2019: Environmental flow limits to global groundwater pumping. Nature, 574(7776), 90–94, doi: 10.1038/s41586-019-1594-4.
de Graaf, I.E.M. et al., 2017: A global-scale two-layer transient groundwater model: Development and application to groundwater depletion. Advances in Water Resources, 102, 53–67, doi: 10.1016/j.advwatres.2017.01.011.
De Kauwe, M.G. et al., 2013: Forest water use and water use efficiency at elevated CO2: a model-data intercomparison at two contrasting temperate forest FACE sites. Global Change Biology, 19(6), 1759–1779, doi: 10.1111/gcb.12164.
De Vrese, P., S. Hagemann, and M. Claussen, 2016: Asian irrigation, African rain: Remote impacts of irrigation. Geophysical Research Letters, 43(8), 3737–3745, doi: 10.1002/2016gl068146.
DeAngelis, A.M., X. Qu, and A. Hall, 2016: Importance of vegetation processes for model spread in the fast precipitation response to CO2 forcing. Geophysical Research Letters, 43(24), 12550–12559, doi: 10.1002/2016gl071392.
DeAngelis, A.M., X. Qu, M.D. Zelinka, and A. Hall, 2015: An observational radiative constraint on hydrologic cycle intensification. Nature, 528(7581), 249–253, doi: 10.1038/nature15770.
DeBeer, C.M., H.S. Wheater, S.K. Carey, and K.P. Chun, 2016: Recent climatic, cryospheric, and hydrological changes over the interior of western Canada: a review and synthesis. Hydrology and Earth System Sciences, 20(4), 1573–1598, doi: 10.5194/hess-20-1573-2016.
Debortoli, N.S. et al., 2015: Rainfall patterns in the Southern Amazon: a chronological perspective (1971–2010). Climatic Change, 132(2), 251–264, doi: 10.1007/s10584-015-1415-1.
Debortoli, N.S. et al., 2016: Detecting deforestation impacts in Southern Amazonia rainfall using rain gauges. International Journal of Climatology, 37(6), 2889–2900, doi: 10.1002/joc.4886.
Decharme, B. et al., 2012: Global off-line evaluation of the ISBA-TRIP flood model. Climate Dynamics, 38(7–8), 1389–1412, doi: 10.1007/s00382-011-1054-9.
Decharme, B. et al., 2016: Impacts of snow and organic soils parameterization on northern Eurasian soil temperature profiles simulated by the ISBA land surface model. Cryosphere, 10(2), 853–877, doi: 10.5194/tc-10-853-2016.
Decharme, B. et al., 2019: Recent Changes in the ISBA-CTRIP Land Surface System for Use in the CNRM-CM6 Climate Model and in Global Off-Line Hydrological Applications. Journal of Advances in Modeling Earth Systems, 11(5), 1207–1252, doi: 10.1029/2018ms001545.
Dee, S.G. et al., 2017: Improved spectral comparisons of paleoclimate models and observations via proxy system modeling: Implications for multi-decadal variability. Earth and Planetary Science Letters, 476, 34–46, doi: 10.1016/j.epsl.2017.07.036.
Dee, S.G. et al., 2020: No consistent ENSO response to volcanic forcing over the last millennium. Science, 367(6485), 1477–1481, doi: 10.1126/science.aax2000.
Defrance, D. et al., 2017: Consequences of rapid ice sheet melting on the Sahelian population vulnerability. Proceedings of the National Academy of Sciences, 114(25), 6533–6538, doi: 10.1073/pnas.1619358114.
Deitch, M., M. Sapundjieff, and S. Feirer, 2017: Characterizing Precipitation Variability and Trends in the World’s Mediterranean-Climate Areas. Water, 9(4), 259, doi: 10.3390/w9040259.
Delworth, T.L. and F. Zeng, 2014: Regional rainfall decline in Australia attributed to anthropogenic greenhouse gases and ozone levels. Nature Geoscience, 7(8), 583–587, doi: 10.1038/ngeo2201.
Demaria, E.M.C. et al., 2019: Intensification of the North American Monsoon Rainfall as Observed From a Long-Term High-Density Gauge Network. Geophysical Research Letters, 46(12), 6839–6847, doi: 10.1029/2019gl082461.
DeMenocal, P.B. and J.E. Tierney, 2012: Green Sahara: African humid periods paced by Earth’s orbital changes. Nature Education Knowledge, 3(10), 12, www.nature.com/scitable/knowledge/library/green-sahara-african-humid-periods-paced-by-82884405/.
Demory, M.E. et al., 2014: The role of horizontal resolution in simulating drivers of the global hydrological cycle. Climate Dynamics, 42(7–8), 2201–2225, doi: 10.1007/s00382-013-1924-4.
DeMott, C.A. et al., 2019: The Convection Connection: How Ocean Feedbacks Affect Tropical Mean Moisture and MJO Propagation. Journal of Geophysical Research: Atmospheres, 124(22), 11910–11931, doi: 10.1029/2019jd031015.
DeMott, P.J. et al., 2010: Predicting global atmospheric ice nuclei distributions and their impacts on climate. Proceedings of the National Academy of Sciences, 107(25), 11217–22, doi: 10.1073/pnas.0910818107.
DeMott, P.J. et al., 2016: Sea spray aerosol as a unique source of ice nucleating particles. Proceedings of the National Academy of Sciences, 113(21), 5797–5803, doi: 10.1073/pnas.1514034112.
Deng, H., N.C. Pepin, and Y. Chen, 2017: Changes of snowfall under warming in the Tibetan Plateau. Journal of Geophysical Research: Atmospheres, 122(14), 7323–7341, doi: 10.1002/2017jd026524.
Deng, K., S. Yang, M. Ting, Y. Tan, and S. He, 2018: Global Monsoon Precipitation: Trends, Leading Modes, and Associated Drought and Heat Wave in the Northern Hemisphere. Journal of Climate, 31(17), 6947–6966, doi: 10.1175/jcli-d-17-0569.1.
Deng, S., C. Sheng, N. Yang, L. Song, and Q. Huang, 2020: Anthropogenic forcing enhances rainfall seasonality in global land monsoon regions. Environmental Research Letters, 15(10), 104057, doi: 10.1088/1748-9326/abafd3.
Deng, S. et al., 2019: Rainfall seasonality changes and its possible teleconnections with global climate events in China. Climate Dynamics, 53(5), 3529–3546, doi: 10.1007/s00382-019-04722-3.
Dennison, F.W., A. McDonald, and O. Morgenstern, 2016: The influence of ozone forcing on blocking in the Southern Hemisphere. Journal of Geophysical Research: Atmospheres, 121(24), 14358–14371, doi: 10.1002/2016jd025033.
Denniston, R.F. et al., 2016: Expansion and Contraction of the Indo-Pacific Tropical Rain Belt over the Last Three Millennia. Scientific Reports, 6, 34485, doi: 10.1038/srep34485.
Deryng, D. et al., 2016: Regional disparities in the beneficial effects of rising CO2 concentrations on crop water productivity. Nature Climate Change, 6(8), 786–790, doi: 10.1038/nclimate2995.
Descroix, L. et al., 2013: Évolution des pluies de cumul élevé et recrudescence des crues depuis 1951 dans le bassin du Niger moyen (Sahel). Climatologie, 10, 37–49, doi: 10.4267/climat ologie.78.
Descroix, L. et al., 2015: Évolution récente de la pluviométrie en Afrique de l’ouest à travers deux régions : la Sénégambie et le bassin du Niger moyen. Climatologie, 12, 25–43, doi: 10.4267/climatologie.1105.
Descroix, L. et al., 2018: Evolution of Surface Hydrology in the Sahelo-Sudanian Strip: An Updated Review. Water, 10(6), 748, doi: 10.3390/ w10060748.
Deser, C., J.W. Hurrell, and A.S. Phillips, 2017: The role of the North Atlantic Oscillation in European climate projections. Climate Dynamics, 49(9–10), 3141–3157, doi: 10.1007/s00382-016-3502-z.
Deser, C., A. Phillips, V. Bourdette, and H. Teng, 2012: Uncertainty in climate change projections: the role of internal variability. Climate Dynamics, 38(3–4), 527–546, doi: 10.1007/s00382-010-0977-x.
Deser, C., I.R. Simpson, A.S. Phillips, and K.A. McKinnon, 2018: How Well Do We Know ENSO’s Climate Impacts over North America, and How Do We Evaluate Models Accordingly?Journal of Climate, 31(13), 4991–5014, doi: 10.1175/jcli-d-17-0783.1.
Devers, A., J.-P. Vidal, C. Lauvernet, B. Graff, and O. Vannier, 2020: A framework for high-resolution meteorological surface reanalysis through offline data assimilation in an ensemble of downscaled reconstructions. Quarterly Journal of the Royal Meteorological Society, 146(726), 153–173, doi: 10.1002/qj.3663.
Dey, R., S.C. Lewis, and N.J. Abram, 2019a: Investigating observed northwest Australian rainfall trends in Coupled Model Intercomparison Project phase 5 detection and attribution experiments. International Journal of Climatology, 39(1), 112–127, doi: 10.1002/joc.5788.
Dey, R., S.C. Lewis, J.M. Arblaster, and N.J. Abram, 2019b: A review of past and projected changes in Australia’s rainfall. WIREs Climate Change, 10(3), e577, doi: 10.1002/wcc.577.
Di Baldassarre, G. et al., 2018: Water shortages worsened by reservoir effects. Nature Sustainability, 1(11), 617–622, doi: 10.1038/s41893-018-0159-0.
Di Capua, G. et al., 2020: Tropical and mid-latitude teleconnections interacting with the Indian summer monsoon rainfall: a theory-guided causal effect network approach. Earth System Dynamics, 11(1), 17–34, doi: 10.5194/esd-11-17-2020.
Di Luca, A., R. de Elía, and R. Laprise, 2015: Challenges in the Quest for Added Value of Regional Climate Dynamical Downscaling. Current Climate Change Reports, 1(1), 10–21, doi: 10.1007/s40641-015-0003-9.
Di Virgilio, G. et al., 2020: Realised added value in dynamical downscaling of Australian climate change. Climate Dynamics, 54(11–12), 4675–4692, doi: 10.1007/s00382-020-05250-1.
Diakhaté, M. et al., 2019: Oceanic Forcing on Interannual Variability of Sahel Heavy and Moderate Daily Rainfall. Journal of Hydrometeorology, 20(3), 397–410, doi: 10.1175/jhm-d-18-0035.1.
Diallo, I. et al., 2016: Projected changes of summer monsoon extremes and hydroclimatic regimes over West Africa for the twenty-first century. Climate Dynamics, 47(12), 3931–3954, doi: 10.1007/s00382-016-3052-4.
Diatta, S. and A.H. Fink, 2014: Statistical relationship between remote climate indices and West African monsoon variability. International Journal of Climatology, 34(12), 3348–3367, doi: 10.1002/joc.3912.
Díaz, L.B. and C.S. Vera, 2017: Austral summer precipitation interannual variability and trends over Southeastern South America in CMIP5 models. International Journal of Climatology, 37, 681–695, doi: 10.1002/joc.5031.
Díaz, L.B. and C.S. Vera, 2018: South American precipitation changes simulated by PMIP3/CMIP5 models during the Little Ice Age and the recent global warming period. International Journal of Climatology, 38(6), 2638–2650, doi: 10.1002/joc.5449.
Diem, J.E., 2013: Influences of the Bermuda High and atmospheric moistening on changes in summer rainfall in the Atlanta, Georgia region, USA. International Journal of Climatology, 33(1), 160–172, doi: 10.1002/joc.3421.
Diem, J.E., D.P. Brown, and J. McCann, 2013: Multi-decadal changes in the North American monsoon anticyclone. International Journal of Climatology, 33(9), 2274–2279, doi: 10.1002/joc.3576.
Dierauer, J.R., P.H. Whitfield, and D.M. Allen, 2018: Climate Controls on Runoff and Low Flows in Mountain Catchments of Western North America. Water Resources Research, 54(10), 7495–7510, doi: 10.1029/2018wr023087.
Dijk, J. et al., 2020: Spatial pattern of super-greenhouse warmth controlled by elevated specific humidity. Nature Geoscience, 13(11), 739–744, doi: 10.1038/s41561-020-00648-2.
DiNezio, P.N. and J.E. Tierney, 2013: The effect of sea level on glacial Indo-Pacific climate. Nature Geoscience, 6(6), 485–491, doi: 10.1038/ngeo1823.
DiNezio, P.N. et al., 2011: The response of the Walker circulation to Last Glacial Maximum forcing: Implications for detection in proxies. Paleoceanography, 26(3), PA3217, doi: 10.1029/2010pa002083.
DiNezio, P.N. et al., 2018: Glacial changes in tropical climate amplified by the Indian Ocean. Science Advances, 4(12), eaat9658, doi: 10.1126/sciadv.aat9658.
Dirmeyer, P.A. and S. Halder, 2017: Application of the Land–Atmosphere Coupling Paradigm to the Operational Coupled Forecast System, Version 2 (CFSv2). Journal of Hydrometeorology, 18, 85, doi: 10.1175/jhm-d-16-0064.1.
Dirmeyer, P.A. et al., 2018: Verification of Land–Atmosphere Coupling in Forecast Models, Reanalyses, and Land Surface Models Using Flux Site Observations. Journal of Hydrometeorology, 19(2), 375–392, doi: 10.1175/jhm-d-17-0152.1.
Dixit, V., O. Geoffroy, and S.C. Sherwood, 2018: Control of ITCZ Width by Low-Level Radiative Heating From Upper-Level Clouds in Aquaplanet Simulations. Geophysical Research Letters, 45(11), 5788–5797, doi: 10.1029/2018gl078292.
Djehdian, L.A., C.M. Chini, L. Marston, M. Konar, and A.S. Stillwell, 2019: Exposure of urban food–energy–water (FEW) systems to water scarcity. Sustainable Cities and Society, 50, 101621, doi: 10.1016/j.scs.2019.101621.
Döll, P., 2009: Vulnerability to the impact of climate change on renewable groundwater resources: A global-scale assessment. Environmental Research Letters, 4(3), 035006, doi: 10.1088/1748-9326/4/3/035006.
Döll, P. et al., 2012: Impact of water withdrawals from groundwater and surface water on continental water storage variations. Journal of Geodynamics, 59, 143–156, doi: 10.1016/j.jog.2011.05.001.
Döll, P. et al., 2014: Global-scale assessment of groundwater depletion and related groundwater abstractions: Combining hydrological modeling with information from well observations and GRACE satellites. Water Resources Research, 50(7), 5698–5720, doi: 10.1002/2014wr015595.
Döll, P. et al., 2016: Modelling Freshwater Resources at the Global Scale: Challenges and Prospects. Surveys in Geophysics, 37(2), 195–221, doi: 10.1007/s10712-015-9343-1.
Döll, P. et al., 2018: Risks for the global freshwater system at 1.5°C and 2°C global warming. Environmental Research Letters, 13(4), 044038, doi: 10.1088/1748-9326/aab792.
Donat, M.G., A.L. Lowry, L. Alexander, P.A. O’Gorman, and N. Maher, 2016: More extreme precipitation in the world’s dry and wet regions. Nature Climate Change, 6(5), 508–513, doi: 10.1038/nclimate2941.
Donchyts, G. et al., 2016: Earth’s surface water change over the past 30 years. Nature Climate Change, 6(9), 810–813, doi: 10.1038/nclimate3111.
Dong, B. and R. Sutton, 2015: Dominant role of greenhouse-gas forcing in the recovery of Sahel rainfall. Nature Climate Change, 5(8), 757–760, doi: 10.1038/nclimate2664.
Dong, B. and A. Dai, 2017: The uncertainties and causes of the recent changes in global evapotranspiration from 1982 to 2010. Climate Dynamics, 49(1–2), 279–296, doi: 10.1007/s00382-016-3342-x.
Dong, B., R.T. Sutton, E. Highwood, and L. Wilcox, 2014: The impacts of European and Asian anthropogenic sulfur dioxide emissions on Sahel rainfall. Journal of Climate, 27(18), 7000–7017, doi: 10.1175/jcli-d-13-00769.1.
Dong, B., R.T. Sutton, L. Shaffrey, and N.P. Klingaman, 2017: Attribution of Forced Decadal Climate Change in Coupled and Uncoupled Ocean–Atmosphere Model Experiments. Journal of Climate, 30(16), 6203–6223, doi: 10.1175/jcli-d-16-0578.1.
Dong, L., L.R. Leung, F. Song, and J. Lu, 2018a: Roles of SST versus Internal Atmospheric Variability in Winter Extreme Precipitation Variability along the U.S. West Coast. Journal of Climate, 31(19), 8039–8058, doi: 10.1175/jcli-d-18-0062.1.
Dong, L., C. Mitra, S. Greer, and E. Burt, 2018b: The dynamical linkage of atmospheric blocking to drought, heatwave and urban heat island in southeastern US: A multi-scale case study. Atmosphere, 9(1), 33, doi: 10.3390/atmos9010033.
Dong, L., L.R. Leung, J. Lu, and F. Song, 2019: Mechanisms for an amplified precipitation seasonal cycle in the u.s. west coast under global warming. Journal of Climate, 32(15), 4681–4698, doi: 10.1175/jcli-d-19-0093.1.
Donohoe, A. and A. Voigt, 2017: Why Future Shifts in Tropical Precipitation Will Likely Be Small: The Location of the Tropical Rain Belt and the Hemispheric Contrast of Energy Input to the Atmosphere. In: Climate Extremes: Patterns and Mechanisms[Wang, S.-Y.S., J.-H. Yoon, C.C. Funk, and R.R. Gillies (eds.)]. American Geophysical Union (AGU), Washington, DC, USA, pp. 115–137, doi: 10.1002/9781119068020.ch8.
Donohoe, A., J. Marshall, D. Ferreira, and D. Mcgee, 2013: The relationship between ITCZ location and cross-equatorial atmospheric heat transport: From the seasonal cycle to the last glacial maximum. Journal of Climate, 26(11), 3597–3618, doi: 10.1175/jcli-d-12-00467.1.
Donohue, R.J., M.L. Roderick, T.R. McVicar, and G.D. Farquhar, 2013: Impact of CO2 fertilization on maximum foliage cover across the globe’s warm, arid environments. Geophysical Research Letters, 40(12), 3031–3035, doi: 10.1002/grl.50563.
Dos Santos, V., F. Laurent, C. Abe, and F. Messner, 2018: Hydrologic Response to Land Use Change in a Large Basin in Eastern Amazon. Water, 10(4), 429, doi: 10.3390/ w10040429.
Dosio, A., H.-J. Panitz, M. Schubert-Frisius, and D. Lüthi, 2015: Dynamical downscaling of CMIP5 global circulation models over CORDEX-Africa with COSMO-CLM: evaluation over the present climate and analysis of the added value. Climate Dynamics, 44(9–10), 2637–2661, doi: 10.1007/s00382-014-2262-x.
Dou, J., Z. Wu, and Y. Zhou, 2017: Potential impact of the May Southern Hemisphere annular mode on the Indian summer monsoon rainfall. Climate Dynamics, 49(4), 1257–1269, doi: 10.1007/s00382-016-3380-4.
Douville, H. and M. Plazzotta, 2017: Midlatitude Summer Drying: An Underestimated Threat in CMIP5 Models?Geophysical Research Letters, 44(19), 9967–9975, doi: 10.1002/2017gl075353.
Douville, H. and A. John, 2021: Fast adjustment versus slow SST-mediated response of daily precipitation statistics to abrupt 4xCO2. Climate Dynamics, 56(3), 1083–1104, doi: 10.1007/s00382-020-05522-w.
Douville, H., A. Ribes, and S. Tyteca, 2019: Breakdown of NAO reproducibility into internal versus externally-forced components: a two-tier pilot study. Climate Dynamics, 52(1–2), 29–48, doi: 10.1007/s00382-018-4141-3.
Douville, H., A. Ribes, B. Decharme, R. Alkama, and J. Sheffield, 2013: Anthropogenic influence on multidecadal changes in reconstructed global evapotranspiration. Nature Climate Change, 3(1), 59–62, doi: 10.1038/nclimate1632.
Douville, H. et al., 2020: Drivers of the enhanced decline of land near-surface relative humidity to abrupt 4xCO2 in CNRM-CM6-1. Climate Dynamics, 55(0123456789), 1613–1629, doi: 10.1007/s00382-020-05351-x.
Dowdy, A.J., 2020: Climatology of thunderstorms, convective rainfall and dry lightning environments in Australia. Climate Dynamics, 54(5), 3041–3052, doi: 10.1007/s00382-020-05167-9.
Dowdy, A.J. et al., 2019: Review of Australian east coast low pressure systems and associated extremes. Climate Dynamics, 53(7), 4887–4910, doi: 10.1007/s00382-019-04836-8.
Drake, N. and C. Bristow, 2006: Shorelines in the Sahara: Geomorphological evidence for an enhanced monsoon from palaeolake Megachad. Holocene, 16, 901–911, doi: 10.1191/0959683606hol981rr.
Drijfhout, S. et al., 2015: Catalogue of abrupt shifts in Intergovernmental Panel on Climate Change climate models. Proceedings of the National Academy of Sciences, 112(43), E5777–E5786, doi: 10.1073/pnas.1511451112.
Driver, P. and C.J.C. Reason, 2017: Variability in the Botswana High and its relationships with rainfall and temperature characteristics over southern Africa. International Journal of Climatology, 37, 570–581, doi: 10.1002/joc.5022.
Drobinski, P. et al., 2018: Scaling precipitation extremes with temperature in the Mediterranean: past climate assessment and projection in anthropogenic scenarios. Climate Dynamics, 51(3), 1237–1257, doi: 10.1007/s00382-016-3083-x.
Drumond, A. et al., 2014: The role of the Amazon Basin moisture in the atmospheric branch of the hydrological cycle: a Lagrangian analysis. Hydrology and Earth System Sciences, 18(7), 2577–2598, doi: 10.5194/hess-18-2577-2014.
Dudley, R.W., G.A. Hodgkins, M.R. McHale, M.J. Kolian, and B. Renard, 2017: Trends in snowmelt-related streamflow timing in the conterminous United States. Journal of Hydrology, 547, 208–221, doi: 10.1016/j.jhydrol.2017.01.051.
Dufour, A., O. Zolina, and S.K. Gulev, 2016: Atmospheric Moisture Transport to the Arctic: Assessment of Reanalyses and Analysis of Transport Components. Journal of Climate, 29(14), 5061–5081, doi: 10.1175/jcli-d-15-0559.1.
Dunn, R.J.H., K.M. Willett, A. Ciavarella, and P.A. Stott, 2017: Comparison of land surface humidity between observations and CMIP5 models. Earth System Dynamics, 8(3), 719–747, doi: 10.5194/esd-8-719-2017.
Dunning, C.M., E. Black, and R.P. Allan, 2018: Later Wet Seasons with More Intense Rainfall over Africa under Future Climate Change. Journal of Climate, 31(23), 9719–9738, doi: 10.1175/jcli-d-18-0102.1.
Dunn-Sigouin, E. and S.W. Son, 2013: Northern Hemisphere blocking frequency and duration in the CMIP5 models. Journal of Geophysical Research: Atmospheres, 118(3), 1179–1188, doi: 10.1002/jgrd.50143.
Durack, P.J., 2015: Ocean salinity and the global water cycle. Oceanography, 28(1), 20–31, doi: 10.5670/oceanog.2015.03.
Durack, P.J. and S.E. Wijffels, 2010: Fifty-Year Trends in Global Ocean Salinities and Their Relationship to Broad-Scale Warming. Journal of Climate, 23(16), 4342–4362, doi: 10.1175/2010jcli3377.1.
Durack, P.J., S.E. Wijffels, and R.J. Matear, 2012: During 1950 to 2000. Science, 336, 455–458, doi: 10.1126/science.1212222.
Dussaillant, I. et al., 2019: Two decades of glacier mass loss along the Andes. Nature Geoscience, 12(10), 802–808, doi: 10.1038/s41561-019-0432-5.
Dutt, S. et al., 2015: Abrupt changes in Indian summer monsoon strength during 33,800 to 5500 years B.P. Geophysical Research Letters, 42(13), 5526–5532, doi: 10.1002/2015gl064015.
Dwyer, J.G. and P.A. O’Gorman, 2017: Changing duration and spatial extent of midlatitude precipitation extremes across different climates. Geophysical Research Letters, 44(11), 5863–5871, doi: 10.1002/2017gl072855.
Earman, S. and M. Dettinger, 2011: Potential impacts of climate change on groundwater resources – a global review. Journal of Water and Climate Change, 2(4), 213–229, doi: 10.2166/wcc.2011.034.
Easterling, D.R., K.E. Kunkel, M.F. Wehner, and L. Sun, 2016: Detection and attribution of climate extremes in the observed record. Weather and Climate Extremes, 11, 17–27, doi: 10.1016/j.wace.2016.01.001.
Eekhout, J.P.C., J.E. Hunink, W. Terink, and J. de Vente, 2018: Why increased extreme precipitation under climate change negatively affects water security. Hydrology and Earth System Sciences, 22(11), 5935–5946, doi: 10.5194/hess-22-5935-2018.
Eilander, D. et al., 2020: The effect of surge on riverine flood hazard and impact in deltas globally. Environmental Research Letters, 15(10), 104007, doi: 10.1088/1748-9326/ab8ca6.
Eisner, S. et al., 2017: An ensemble analysis of climate change impacts on streamflow seasonality across 11 large river basins. Climatic Change, 141(3), 401–417, doi: 10.1007/s10584-016-1844-5.
Ekholm, T. and H. Korhonen, 2016: Climate change mitigation strategy under an uncertain Solar Radiation Management possibility. Climatic Change, 139(3–4), 503–515, doi: 10.1007/s10584-016-1828-5.
Emanuel, K., 2017: Assessing the present and future probability of Hurricane Harvey’s rainfall. Proceedings of the National Academy of Sciences, 114(48), 12681–12684, doi: 10.1073/pnas.1716222114.
Emerton, R. et al., 2017: Complex picture for likelihood of ENSO-driven flood hazard. Nature Communications, 8, 14796, doi: 10.1038/ncomms14796.
Endo, H., A. Kitoh, and H. Ueda, 2018: A Unique Feature of the Asian Summer Monsoon Response to Global Warming: The Role of Different Land–Sea Thermal Contrast Change between the Lower and Upper Troposphere. SOLA, 14, 57–63, doi: 10.2151/sola.2018-010.
Endris, H.S. et al., 2019: Future changes in rainfall associated with ENSO, IOD and changes in the mean state over Eastern Africa. Climate Dynamics, 52(3–4), 2029–2053, doi: 10.1007/s00382-018-4239-7.
Engel, T. et al., 2017: Extreme Precipitation in the West African Cities of Dakar and Ouagadougou: Atmospheric Dynamics and Implications for Flood Risk Assessments. Journal of Hydrometeorology, 18(11), 2937–2957, doi: 10.1175/jhm-d-16-0218.1.
England, M.H. et al., 2014: Recent intensification of wind-driven circulation in the Pacific and the ongoing warming hiatus. Nature Climate Change, 4(3), 222–227, doi: 10.1038/nclimate2106.
Espinoza, J.C., J. Ronchail, J.A. Marengo, and H. Segura, 2018: Contrasting North–South changes in Amazon wet-day and dry-day frequency and related atmospheric features (1981–2017). Climate Dynamics, 52(9–10), 1–22, doi: 10.1007/s00382-018-4462-2.
Espinoza, J.C., H. Segura, J. Ronchail, G. Drapeau, and O. Gutierrez-Cori, 2016: Evolution of wet-day and dry-day frequency in the western Amazon basin: Relationship with atmospheric circulation and impacts on vegetation. Water Resources Research, 52(11), 8546–8560, doi: 10.1002/2016wr019305.
Espinoza, J.C. et al., 2019: Regional hydro-climatic changes in the Southern Amazon Basin (Upper Madeira Basin) during the 1982–2017 period. Journal of Hydrology: Regional Studies, 26, 100637, doi: 10.1016/j.ejrh.2019.100637.
Espinoza, V., D.E. Waliser, B. Guan, D.A. Lavers, and F.M. Ralph, 2018: Global Analysis of Climate Change Projection Effects on Atmospheric Rivers. Geophysical Research Letters, 45(9), 4299–4308, doi: 10.1029/2017gl076968.
Estilow, T.W., A.H. Young, and D.A. Robinson, 2015: A long-term Northern Hemisphere snow cover extent data record for climate studies and monitoring. Earth System Science Data, 7(1), 137–142, doi: 10.5194/essd-7-137-2015.
Evan, A.T., C. Flamant, C. Lavaysse, C. Kocha, and A. Saci, 2015: Water vapor-forced greenhouse warming over the Sahara desert and the recent recovery from the Sahelian drought. Journal of Climate, 28(1), 108–123, doi: 10.1175/jcli-d-14-00039.1.
Falco, M., A.F. Carril, C.G. Menéndez, P.G. Zaninelli, and Z.X.L. Laurent, 2019: Assessment of CORDEX simulations over South America: added value on seasonal climatology and resolution considerations. Climate Dynamics, 52(7–8), 4771–4786, doi: 10.1007/s00382-018-4412-z.
Fan, C. et al., 2020: Strong Precipitation Suppression by Aerosols in Marine Low Clouds. Geophysical Research Letters, 47(7), e2019GL086207, doi: 10.1029/2019gl086207.
Fan, J., Y. Wang, D. Rosenfeld, and X. Liu, 2016: Review of Aerosol–Cloud Interactions: Mechanisms, Significance, and Challenges. Journal of the Atmospheric Sciences, 73(11), 4221–4252, doi: 10.1175/jas-d-16-0037.1.
Fan, J. et al., 2014: Aerosol impacts on California winter clouds and precipitation during CalWater 2011: local pollution versus long-range transported dust. Atmospheric Chemistry and Physics, 14(1), 81–101, doi: 10.5194/acp-14-81-2014.
Fan, J. et al., 2015: Substantial contribution of anthropogenic air pollution to catastrophic floods in Southwest China. Geophysical Research Letters, 42(14), 6066–6075, doi: 10.1002/2015gl064479.
Fan, J. et al., 2018: Substantial convection and precipitation enhancements by ultrafine aerosol particles. Science, 359(6374), 411–418, doi: 10.1126/science.aan8461.
Fang, X. and H.G. Stefan, 1999: Projections of Climate Change Effects on Water Temperature Characteristics of Small Lakes in the Contiguous U.S. Climatic Change, 42(2), 377–412, doi: 10.1023/a:1005431523281.
Farinotti, D., W.W. Immerzeel, R.J. de Kok, D.J. Quincey, and A. Dehecq, 2020: Manifestations and mechanisms of the Karakoram glacier Anomaly. Nature Geoscience, 13(1), 8–16, doi: 10.1038/s41561-019-0513-5.
Fasullo, J.T., B.L. Otto-Bliesner, and S. Stevenson, 2019: The Influence of Volcanic Aerosol Meridional Structure on Monsoon Responses over the Last Millennium. Geophysical Research Letters, 46(21), 12350–12359, doi: 10.1029/2019gl084377.
Fatichi, S. et al., 2016: Uncertainty partition challenges the predictability of vital details of climate change. Earth’s Future, 4(5), 240–251, doi: 10.1002/2015ef000336.
Favreau, G. et al., 2009: Land clearing, climate variability, and water resources increase in semiarid southwest Niger: A review. Water Resources Research, 45(7), W00A16, doi: 10.1029/2007wr006785.
Feng, S. and Q. Fu, 2013: Expansion of global drylands under a warming climate. Atmospheric Chemistry and Physics, 13(19), 10081–10094, doi: 10.5194/acp-13-10081-2013.
Feng, W. et al., 2013: Evaluation of groundwater depletion in North China using the Gravity Recovery and Climate Experiment (GRACE) data and ground-based measurements. Water Resources Research, 49(4), 2110–2118, doi: 10.1002/wrcr.20192.
Fenta, A.A., H. Yasuda, K. Shimizu, and N. Haregeweyn, 2017: Response of streamflow to climate variability and changes in human activities in the semiarid highlands of northern Ethiopia. Regional Environmental Change, 17(4), 1229–1240, doi: 10.1007/s10113-017-1103-y.
Fereday, D., R. Chadwick, J. Knight, and A.A. Scaife, 2018: Atmospheric Dynamics is the Largest Source of Uncertainty in Future Winter European Rainfall. Journal of Climate, 31(3), 963–977, doi: 10.1175/jcli-d-17-0048.1.
Ferguson, C.R. and E.F. Wood, 2011: Observed Land–Atmosphere Coupling from Satellite Remote Sensing and Reanalysis. Journal of Hydrometeorology, 12, 1221, doi: 10.1175/2011jhm1380.1.
Ferguson, C.R., M. Pan, and T. Oki, 2018: The Effect of Global Warming on Future Water Availability: CMIP5 Synthesis. Water Resources Research, 54(10), 7791–7819, doi: 10.1029/2018wr022792.
Ferguson, G. and T. Gleeson, 2012: Vulnerability of coastal aquifers to groundwater use and climate change. Nature Climate Change, 2(5), 342–345, doi: 10.1038/nclimate1413.
Ferguson, G., J.C. McIntosh, D. Perrone, and S. Jasechko, 2018: Competition for shrinking window of low salinity groundwater. Environmental Research Letters, 13(11), 114013, doi: 10.1088/1748-9326/aae6d8.
Ferraro, A.J., E.J. Highwood, and A.J. Charlton-Perez, 2014: Weakened tropical circulation and reduced precipitation in response to geoengineering. Environmental Research Letters, 9(1), 014001, doi: 10.1088/1748-9326/9/1/014001.
Feser, F. et al., 2015: Storminess over the North Atlantic and northwestern Europe – A review. Quarterly Journal of the Royal Meteorological Society, 141(687), 350–382, doi: 10.1002/qj.2364.
Ficklin, D.L., J.T. Abatzoglou, and K.A. Novick, 2019: A New Perspective on Terrestrial Hydrologic Intensity That Incorporates Atmospheric Water Demand. Geophysical Research Letters, 46(14), 8114–8124, doi: 10.1029/2019gl084015.
Ficklin, D.L., J.T. Abatzoglou, S.M. Robeson, S.E. Null, and J.H. Knouft, 2018: Natural and managed watersheds show similar responses to recent climate change. Proceedings of the National Academy of Sciences, 115(34), 8553–8557, doi: 10.1073/pnas.1801026115.
Fiedler, S. et al., 2020: Simulated tropical precipitation assessed across three major phases of the coupled model intercomparison project (CMIP). Monthly Weather Review, 148(9), 3653–3680, doi: 10.1175/mwr-d-19-0404.1.
Finney, D.L. et al., 2020a: Effects of Explicit Convection on Future Projections of Mesoscale Circulations, Rainfall, and Rainfall Extremes over Eastern Africa. Journal of Climate, 33(7), 2701–2718, doi: 10.1175/jcli-d-19-0328.1.
Finney, D.L. et al., 2020b: The effect of westerlies on East African rainfall and the associated role of tropical cyclones and the Madden–Julian Oscillation. Quarterly Journal of the Royal Meteorological Society, 146(727), 647–664, doi: 10.1002/qj.3698.
Fischer, E.M. and R. Knutti, 2014: Detection of spatially aggregated changes in temperature and precipitation extremes. Geophysical Research Letters, 41(2), 547–554, doi: 10.1002/2013gl058499.
Fischer, E.M. and R. Knutti, 2015: Anthropogenic contribution to global occurrence of heavy-precipitation and high-temperature extremes. Nature Climate Change, 5(6), 560–564, doi: 10.1038/nclimate2617.
Fischer, E.M. and R. Knutti, 2016: Observed heavy precipitation increase confirms theory and early models. Nature Climate Change, 6(11), 986–991, doi: 10.1038/nclimate3110.
Fisher, R.A. et al., 2018: Vegetation demographics in Earth System Models: A review of progress and priorities. Global Change Biology, 24(1), 35–54, doi: 10.1111/gcb.13910.
Fläschner, D., T. Mauritsen, and B. Stevens, 2016: Understanding the intermodel spread in global-mean hydrological sensitivity. Journal of Climate, 29(2), 801–817, doi: 10.1175/jcli-d-15-0351.1.
Fletcher, M.-S. et al., 2018: Centennial-scale trends in the Southern Annular Mode revealed by hemisphere-wide fire and hydroclimatic trends over the past 2400 years. Geology, 46(4), 363–366, doi: 10.1130/g39661.1.
Fogt, R.L., D.H. Bromwich, and K.M. Hines, 2011: Understanding the SAM influence on the South Pacific ENSO teleconnection. Climate Dynamics, 36(7–8), 1555–1576, doi: 10.1007/s00382-010-0905-0.
Fontes, C.G. et al., 2018: Dry and hot: the hydraulic consequences of a climate change–type drought for Amazonian trees. Philosophical Transactions of the Royal Society B: Biological Sciences, 373(1760), 20180209, doi: 10.1098/rstb. 2018.0209.
Formayer, H. and A. Fritz, 2017: Temperature dependency of hourly precipitation intensities – surface versus cloud layer temperature. International Journal of Climatology, 37(1), 1–10, doi: 10.1002/joc.4678.
Forzieri, G. et al., 2020: Increased control of vegetation on global terrestrial energy fluxes. Nature Climate Change, 10(4), 356–362, doi: 10.1038/s41558-020-0717-0.
Fosser, G., S. Khodayar, and P. Berg, 2017: Climate change in the next 30 years: What can a convection-permitting model tell us that we did not already know?Climate Dynamics, 48(5–6), 1987–2003, doi: 10.1007/s00382-016-3186-4.
Fowler, H.J. et al., 2021: Anthropogenic intensification of short-duration rainfall extremes. Nature Reviews Earth & Environment, 2(2), 107–122, doi: 10.1038/s43017-020-00128-6.
Fowler, M.D. and M.S. Pritchard, 2020: Regional MJO Modulation of Northwest Pacific Tropical Cyclones Driven by Multiple Transient Controls. Geophysical Research Letters, 47(11), e2020GL087148, doi: 10.1029/2020gl087148.
Francis, J.A. and S.J. Vavrus, 2012: Evidence linking Arctic amplification to extreme weather in mid-latitudes. Geophysical Research Letters, 39(6), L06801, doi: 10.1029/2012gl051000.
Francis, J.A. and S.J. Vavrus, 2015: Evidence for a wavier jet stream in response to rapid Arctic warming. Environmental Research Letters, 10(1), 014005, doi: 10.1088/1748-9326/10/1/014005.
Frank, D.C. et al., 2015: Water-use efficiency and transpiration across European forests during the Anthropocene. Nature Climate Change, 5(6), 579–583, doi: 10.1038/nclimate2614.
Frankcombe, L.M., M.H. England, J.B. Kajtar, M.E. Mann, and B.A. Steinman, 2018: On the Choice of Ensemble Mean for Estimating the Forced Signal in the Presence of Internal Variability. Journal of Climate, 31(14), 5681–5693, doi: 10.1175/jcli-d-17-0662.1.
Franke, J., D. Frank, C.C. Raible, J. Esper, and S. Brönnimann, 2013: Spectral biases in tree-ring climate proxies. Nature Climate Change, 3(4), 360–364, doi: 10.1038/nclimate1816.
Franks, P.J., J.A. Berry, D.L. Lombardozzi, and G.B. Bonan, 2017: Stomatal Function across Temporal and Spatial Scales: Deep-Time Trends, Land-Atmosphere Coupling and Global Models. Plant Physiology, 174(2), 583–602, doi: 10.1104/pp.17.00287.
Franks, P.J. et al., 2018: Comparing optimal and empirical stomatal conductance models for application in Earth system models. Global Change Biology, 24(12), 5708–5723, doi: 10.1111/gcb.14445.
Frans, C. et al., 2015: Predicting glacio-hydrologic change in the headwaters of the Zongo River, Cordillera Real, Bolivia. Water Resources Research, 51(11), 9029–9052, doi: 10.1002/2014wr016728.
Frappart, F. et al., 2009: Rainfall regime across the Sahel band in the Gourma region, Mali. Journal of Hydrology, 375(1–2), 128–142, doi: 10.1016/j.jhydrol.2009.03.007.
Fredriksen, H.-B., J. Berner, A.C. Subramanian, and A. Capotondi, 2020: How Does El Niño-Southern Oscillation Change Under Global Warming – A First Look at CMIP6. Geophysical Research Letters, 47(22), e2020GL090640, doi: 10.1029/2020gl090640.
French, J.R. et al., 2018: Precipitation formation from orographic cloud seeding. Proceedings of the National Academy of Sciences, 115(6), 1168–1173, doi: 10.1073/pnas.1716995115.
Freud, E. and D. Rosenfeld, 2012: Linear relation between convective cloud drop number concentration and depth for rain initiation. Journal of Geophysical Research: Atmospheres, 117(D2), D02207, doi: 10.1029/2011jd016457.
Freund, M.B., B.J. Henley, D.J. Karoly, K.J. Allen, and P.J. Baker, 2017: Multi-century cool- and warm-season rainfall reconstructions for Australia’s major climatic regions. Climate of the Past, 13(12), 1751–1770, doi: 10.5194/cp-13-1751-2017.
Freund, M.B., J.R. Brown, B.J. Henley, D.J. Karoly, and J.N. Brown, 2020: Warming Patterns Affect El Niño Diversity in CMIP5 and CMIP6 Models. Journal of Climate, 33(19), 8237–8260, doi: 10.1175/jcli-d-19-0890.1.
Friedman, A.R., Y.-T. Hwang, J.C.H. Chiang, and D.M.W. Frierson, 2013: Interhemispheric Temperature Asymmetry over the Twentieth Century and in Future Projections. Journal of Climate, 26(15), 5419–5433, doi: 10.1175/jcli-d-12-00525.1.
Friedrich, K. et al., 2020: Quantifying snowfall from orographic cloud seeding. Proceedings of the National Academy of Sciences, 117(10), 5190–5195, doi: 10.1073/pnas.1917204117.
Frierson, D.M.W., J. Lu, and G. Chen, 2007: Width of the Hadley cell in simple and comprehensive general circulation models. Geophysical Research Letters, 34(18), L18804, doi: 10.1029/2007gl031115.
Frierson, D.M.W. et al., 2013: Contribution of ocean overturning circulation to tropical rainfall peak in the Northern Hemisphere. Nature Geoscience, 6(11), 940–944, doi: 10.1038/ngeo1987.
Froidevaux, P. and O. Martius, 2016: Exceptional integrated vapour transport toward orography: an important precursor to severe floods in Switzerland. Quarterly Journal of the Royal Meteorological Society, 142(698), 1997–2012, doi: 10.1002/qj.2793.
Fromang, S. and G. Rivière, 2020: The Effect of the Madden–Julian Oscillation on the North Atlantic Oscillation Using Idealized Numerical Experiments. Journal of the Atmospheric Sciences, 77(5), 1613–1635, doi: 10.1175/jas-d-19-0178.1.
Fu, Q. and S. Feng, 2014: Responses of terrestrial aridity to global warming. Journal of Geophysical Research: Atmospheres, 119(13), 7863–7875, doi: 10.1002/2014jd021608.
Fu, R. et al., 2013: Increased dry-season length over southern Amazonia in recent decades and its implication for future climate projection. Proceedings of the National Academy of Sciences, 110(45), 18110–18115, doi: 10.1073/pnas.1302584110.
Fujita, M. et al., 2019: Precipitation Changes in a Climate With 2-K Surface Warming From Large Ensemble Simulations Using 60-km Global and 20-km Regional Atmospheric Models. Geophysical Research Letters, 46(1), 435–442, doi: 10.1029/2018gl079885.
Fumière, Q. et al., 2020: Extreme rainfall in Mediterranean France during the fall: added value of the CNRM-AROME Convection-Permitting Regional Climate Model. Climate Dynamics, 55(1–2), 77–91, doi: 10.1007/s00382-019-04898-8.
Fuss, S. et al., 2018: Negative emissions – Part 2: Costs, potentials and side effects. Environmental Research Letters, 13(6), 063002, doi: 10.1088/1748-9326/aabf9f .
Gaetani, M., S. Janicot, M. Vrac, A.M. Famien, and B. Sultan, 2020: Robust assessment of the time of emergence of precipitation change in West Africa. Scientific Reports, 10(1), 7670, doi: 10.1038/s41598-020-63782-2.
Gallant, A.J.E., M.J. Reeder, J.S. Risbey, and K.J. Hennessy, 2013: The characteristics of seasonal-scale droughts in Australia, 1911–2009. International Journal of Climatology, 33(7), 1658–1672, doi: 10.1002/joc.3540.
Gallego, D., R. García-Herrera, C. Peña-Ortiz, and P. Ribera, 2017: The steady enhancement of the Australian Summer Monsoon in the last 200 years. Scientific Reports, 7(1), 1–7, doi: 10.1038/s41598-017-16414-1.
Gan, B. and L. Wu, 2014: Centennial trends in Northern Hemisphere winter storm tracks over the twentieth century. Quarterly Journal of the Royal Meteorological Society, 140(683), 1945–1957, doi: 10.1002/qj.2263.
Ganeshi, N.G., M. Mujumdar, R. Krishnan, and M. Goswami, 2020: Understanding the linkage between soil moisture variability and temperature extremes over the Indian region. Journal of Hydrology, 589, 125183, doi: 10.1016/j.jhydrol.2020.125183.
Ganguli, P. and B. Merz, 2019: Trends in Compound Flooding in Northwestern Europe During 1901–2014. Geophysical Research Letters, 46(19), 10810–10820, doi: 10.1029/2019gl084220.
Gao, J. et al., 2019: A New Frozen Soil Parameterization Including Frost and Thaw Fronts in the Community Land Model. Journal of Advances in Modeling Earth Systems, 11(3), 659–679, doi: 10.1029/2018ms001399.
Gao, Y. and C. Gao, 2017: European hydroclimate response to volcanic eruptions over the past nine centuries. International Journal of Climatology, 37(11), 4146–4157, doi: 10.1002/joc.5054.
Gao, Y. et al., 2015: Dynamical and thermodynamical modulations on future changes of landfalling atmospheric rivers over western North America. Geophysical Research Letters, 42(17), 7179–7186, doi: 10.1002/2015gl065435.
García-García, A., F.J. Cuesta-Valero, H. Beltrami, and J.E. Smerdon, 2019: Characterization of Air and Ground Temperature Relationships within the CMIP5 Historical and Future Climate Simulations. Journal of Geophysical Research: Atmospheres, 124(7), 3903–3929, doi: 10.1029/2018jd030117.
García-Herrera, R. and D. Barriopedro, 2006: Northern Hemisphere snow cover and atmospheric blocking variability. Journal of Geophysical Research: Atmospheres, 111(D21), D21104, doi: 10.1029/2005jd006975.
García-Martínez, I.M., M.A. Bollasina, and S. Undorf, 2020: Strong large-scale climate response to North American sulphate aerosols in CESM. Environmental Research Letters, 15(11), 114051, doi: 10.1088/1748-9326/abbe45.
Garfinkel, C.I., I. White, E.P. Gerber, and M. Jucker, 2020: The Impact of SST Biases in the Tropical East Pacific and Agulhas Current Region on Atmospheric Stationary Waves in the Southern Hemisphere. Journal of Climate, 33(21), 9351–9374, doi: 10.1175/jcli-d-20-0195.1.
Gariano, S.L. and F. Guzzetti, 2016: Landslides in a changing climate. Earth-Science Reviews, 162, 227–252, doi: 10.1016/j.earscirev.2016.08.011.
Garreaud, R.D. et al., 2020: The Central Chile Mega Drought (2010–2018): A climate dynamics perspective. International Journal of Climatology, 40(1), 421–439, doi: 10.1002/joc.6219.
Gasse, F., 2000: Hydrological changes in the African tropics since the Last Glacial Maximum. Quaternary Science Reviews, 19(1–5), 189–211, doi: 10.1016/s0277-3791(99)00061-x.
Gastineau, G., L. Li, and H. Le Treut, 2009: The Hadley and Walker Circulation Changes in Global Warming Conditions Described by Idealized Atmospheric Simulations. Journal of Climate, 22(14), 3993–4013, doi: 10.1175/2009jcli2794.1.
Gedney, N. et al., 2014: Detection of solar dimming and brightening effects on Northern Hemisphere river flow. Nature Geoscience, 7(11), 796-800, doi: 10.1038/ngeo2263.
Geil, K.L., Y.L. Serra, and X. Zeng, 2013: Assessment of CMIP5 Model Simulations of the North American Monsoon System. Journal of Climate, 26(22), 8787–8801, doi: 10.1175/jcli-d-13-00044.1.
Gentine, P., M. Pritchard, S. Rasp, G. Reinaudi, and G. Yacalis, 2018: Could Machine Learning Break the Convection Parameterization Deadlock?Geophysical Research Letters, 45(11), 5742–5751, doi: 10.1029/2018gl078202.
Gentine, P. et al., 2019: Coupling between the terrestrial carbon and water cycles – A review. Environmental Research Letters, 14(8), 83003, doi: 10.1088/1748-9326/ab22d6.
Genty, D. et al., 2006: Timing and dynamics of the last deglaciation from European and North Africanδ13C stalagmite profiles – comparison with Chinese and South Hemisphere stalagmites. Quaternary Science Reviews, 25(17–18), 2118–2142, doi: 10.1016/j.quascirev.2006.01.030.
Gergis, J. and B.J. Henley, 2017: Southern Hemisphere rainfall variability over the past 200 years. Climate Dynamics, 48(7–8), 2087–2105, doi: 10.1007/s00382-016-3191-7.
Gergis, J. et al., 2012: On the long-term context of the 1997–2009 ‘Big Dry’ in South-Eastern Australia: insights from a 206-year multi-proxy rainfall reconstruction. Climatic Change, 111(3–4), 923–944, doi: 10.1007/s10584-011-0263-x.
Gershunov, A., T. Shulgina, F.M. Ralph, D.A. Lavers, and J.J. Rutz, 2017: Assessing the climate-scale variability of atmospheric rivers affecting western North America. Geophysical Research Letters, 44(15), 7900–7908, doi: 10.1002/2017gl074175.
Gershunov, A. et al., 2019: Precipitation regime change in Western North America: The role of Atmospheric Rivers. Scientific Reports, 9(1), 9944, doi: 10.1038/s41598-019-46169-w.
Giannini, A., 2010: Mechanisms of Climate Change in the Semiarid African Sahel: The Local View. Journal of Climate, 23(3), 743–756, doi: 10.1175/2009jcli3123.1.
Giannini, A. and A. Kaplan, 2019: The role of aerosols and greenhouse gases in Sahel drought and recovery. Climatic Change, 152(3–4), 449–466, doi: 10.1007/s10584-018-2341-9.
Giannini, A. et al., 2013: A unifying view of climate change in the Sahel linking intra-seasonal, interannual and longer time scales. Environmental Research Letters, 8(2), 024010, doi: 10.1088/1748-9326/8/2/024010.
Gimeno, L., R. Nieto, and R. Sorí, 2020: The growing importance of oceanic moisture sources for continental precipitation. npj Climate and Atmospheric Science, 3(1), 27, doi: 10.1038/s41612-020-00133-y.
Gimeno, L., A. Drumond, R. Nieto, R.M. Trigo, and A. Stohl, 2010: On the origin of continental precipitation. Geophysical Research Letters, 37(13), L13804, doi: 10.1029/2010gl043712.
Gimeno, L. et al., 2012: Oceanic and terrestrial sources of continental precipitation. Reviews of Geophysics, 50(4), RG4003, doi: 10.1029/2012rg000389.
Ginoux, P., J.M. Prospero, T.E. Gill, N.C. Hsu, and M. Zhao, 2012: Global-scale attribution of anthropogenic and natural dust sources and their emission rates based on MODIS Deep Blue aerosol products. Reviews of Geophysics, 50(3), RG3005, doi: 10.1029/2012rg000388.
Giorgi, F. et al., 2016: Enhanced summer convective rainfall at Alpine high elevations in response to climate warming. Nature Geoscience, 9(8), 584–589, doi: 10.1038/ngeo2761.
Giráldez, L., Y. Silva, R. Zubieta, and J. Sulca, 2020: Change of the rainfall seasonality over central peruvian andes: Onset, end, duration and its relationship with large-scale atmospheric circulation. Climate, 8(2), 23, doi: 10.3390/cli8020023.
Giuntoli, I., B. Renard, J.-P. Vidal, and A. Bard, 2013: Low flows in France and their relationship to large-scale climate indices. Journal of Hydrology, 482, 105–118, doi: 10.1016/j.jhydrol.2012.12.038.
Giuntoli, I., J.-P. Vidal, C. Prudhomme, and D.M. Hannah, 2015: Future hydrological extremes: the uncertainty from multiple global climate and global hydrological models. Earth System Dynamics, 6(1), 267–285, doi: 10.5194/esd-6-267-2015.
Giuntoli, I., G. Villarini, C. Prudhomme, and D.M. Hannah, 2018: Uncertainties in projected runoff over the conterminous United States. Climatic Change, 150(3–4), 149–162, doi: 10.1007/s10584-018-2280-5.
Glas, R., D. Burns, and L. Lautz, 2019: Historical changes in New York State streamflow: Attribution of temporal shifts and spatial patterns from 1961 to 2016. Journal of Hydrology, 574, 308–323, doi: 10.1016/j.jhydrol.2019.04.060.
Gloor, M. et al., 2015: Recent Amazon climate as background for possible ongoing and future changes of Amazon humid forests. Global Biogeochemical Cycles, 29(9), 1384–1399, doi: 10.1002/2014gb005080.
Gomes, V.H.F., I.C.G. Vieira, R.P. Salomão, and H. ter Steege, 2019: Amazonian tree species threatened by deforestation and climate change. Nature Climate Change, 9(7), 547–553, doi: 10.1038/s41558-019-0500-2.
Gonzales, K.R., D.L. Swain, K.M. Nardi, E.A. Barnes, and N.S. Diffenbaugh, 2019: Recent warming of landfalling atmospheric rivers along the west coast of the United States. Journal of Geophysical Research: Atmospheres, 124(13), 2018JD029860, doi: 10.1029/2018jd029860.
Gonzalez, P.L.M., L.M. Polvani, R. Seager, and G.J.P. Correa, 2014: Stratospheric ozone depletion: A key driver of recent precipitation trends in South Eastern South America. Climate Dynamics, 42(7–8), 1775–1792, doi: 10.1007/s00382-013-1777-x.
Good, P. et al., 2015: Nonlinear regional warming with increasing CO2 concentrations. Nature Climate Change, 5(2), 138–142, doi: 10.1038/nclimate2498.
Good, P. et al., 2016a: nonlinMIP contribution to CMIP6: model intercomparison project for non-linear mechanisms: physical basis, experimental design and analysis principles (v1.0). Geoscientific Model Development, 9(11), 4019–4028, doi: 10.5194/gmd-9-4019-2016.
Good, P. et al., 2016b: Large differences in regional precipitation change between a first and second 2 K of global warming. Nature Communications, 7(1), 13667, doi: 10.1038/ncomms13667.
Good, P. et al., 2021: High sensitivity of tropical precipitation to local sea surface temperature. Nature, 589(7842), 408–414, doi: 10.1038/s41586-020-2887-3.
Goren, T. and D. Rosenfeld, 2014: Decomposing aerosol cloud radiative effects into cloud cover, liquid water path and Twomey components in marine stratocumulus. Atmospheric Research, 138, 378–393, doi: 10.1016/j.atmosres.2013.12.008.
Gorodetskaya, I. et al., 2014: The role of atmospheric rivers in anomalous snow accumulation in East Antarctica. Geophysical Research Letters, 41(17), 6199–6206, doi: 10.1002/2014gl060881.
Gosling, S.N. and N.W. Arnell, 2016: A global assessment of the impact of climate change on water scarcity. Climatic Change, 134(3), 371–385, doi: 10.1007/s10584-013-0853-x.
Goswami, B.N.B. and B.N.B. Goswami, 2017: A road map for improving dry-bias in simulating the South Asian monsoon precipitation by climate models. Climate Dynamics, 49(5), 2025–2034, doi: 10.1007/s00382-016-3439-2.
Grafton, R.Q. et al., 2018: The paradox of irrigation efficiency. Science, 361(6404), 748–750, doi: 10.1126/science.aat9314.
Grandey, B.S., H. Cheng, and C. Wang, 2016: Transient Climate Impacts for Scenarios of Aerosol Emissions from Asia: A Story of Coal versus Gas. Journal of Climate, 29(8), 2849–2867, doi: 10.1175/jcli-d-15-0555.1.
Grell, G.A. and S.R. Freitas, 2014: A scale and aerosol aware stochastic convective parameterization for weather and air quality modeling. Atmospheric Chemistry and Physics, 14(10), 5233–5250, doi: 10.5194/acp-14-5233-2014.
Gremaud, V., N. Goldscheider, L. Savoy, G. Favre, and H. Masson, 2009: Geological structure, recharge processes and underground drainage of a glacierised karst aquifer system, Tsanfleuron-Sanetsch, Swiss Alps. Hydrogeology Journal, 17(8), 1833–1848, doi: 10.1007/s10040-009-0485-4.
Greve, P. and S.I. Seneviratne, 2015: Assessment of future changes in water availability and aridity. Geophysical Research Letters, 42, 5493–5499, doi: 10.1002/2015gl064127.
Greve, P., L. Gudmundsson, and S.I. Seneviratne, 2018: Regional scaling of annual mean precipitation and water availability with global temperature change. Earth System Dynamics, 9(1), 227–240, doi: 10.5194/esd-9-227-2018.
Greve, P., M. Roderick, A.M. Ukkola, and Y. Wada, 2019: The Aridity Index under global warming. Environmental Research Letters, 14(12), 124006, doi: 10.1088/1748-9326/ab5046.
Greve, P. et al., 2014: Global assessment of trends in wetting and drying over land. Nature Geoscience, 7(10), 716–721, doi: 10.1038/ngeo2247.
Grieger, J., G.C. Leckebusch, C.C. Raible, I. Rudeva, and I. Simmonds, 2018: Subantarctic cyclones identified by 14 tracking methods, and their role for moisture transports into the continent. Tellus, Series A: Dynamic Meteorology and Oceanography, 70(1), 1–18, doi: 10.1080/16000870.2018.1454808.
Griffin, D. and K.J. Anchukaitis, 2014: How unusual is the 2012–2014 California drought?Geophysical Research Letters, 41(24), 9017–9023, doi: 10.1002/2014gl062433.
Grimm, E.C. et al., 2006: Evidence for warm wet Heinrich events in Florida. Quaternary Science Reviews, 25(17–18), 2197–2211, doi: 10.1016/j.quascirev.2006.04.008.
Grise, K.M. and L.M. Polvani, 2016: Is climate sensitivity related to dynamical sensitivity?Journal of Geophysical Research: Atmospheres, 121(10), 5159–5176, doi: 10.1002/2015jd024687.
Grise, K.M. and S.M. Davis, 2020: Hadley cell expansion in CMIP6 models. Atmospheric Chemistry and Physics, 20(9), 5249–5268, doi: 10.5194/acp-20-5249-2020.
Grise, K.M., S.W. Son, G.J.P.P. Correa, and L.M. Polvani, 2014: The response of extratropical cyclones in the Southern Hemisphere to stratospheric ozone depletion in the 20th century. Atmospheric Science Letters, 15(1), 29–36, doi: 10.1002/asl2.458.
Grise, K.M. et al., 2019: Recent Tropical Expansion: Natural Variability or Forced Response?Journal of Climate, 32(5), 1551–1571, doi: 10.1175/jcli-d-18-0444.1.
Grogan, D.S., E.A. Burakowski, and A.R. Contosta, 2020: Snowmelt control on spring hydrology declines as the vernal window lengthens. Environmental Research Letters, 15(11), 114040, doi: 10.1088/1748-9326/abbd00.
Grose, M.R., B. Timbal, L. Wilson, J. Bathols, and D. Kent, 2015: The subtropical ridge in CMIP5 models, and implications for projections of rainfall in southeast Australia. Australian Meteorological and Oceanographic Journal, 65(1), 90–106, www.bom.gov.au/jshess/papers.php?year=2015.
Grose, M.R. et al., 2017: Constraints on Southern Australian rainfall change based on atmospheric circulation in CMIP5 simulations. Journal of Climate, 30(1), 225–242, doi: 10.1175/jcli-d-16-0142.1.
Grossiord, C. et al., 2020: Plant responses to rising vapor pressure deficit. New Phytologist, 226(6), 1550–1566, doi: 10.1111/nph.16485.
Gu, G. and R.F. Adler, 2018: Precipitation Intensity Changes in the Tropics from Observations and Models. Journal of Climate, 31(12), 4775–4790, doi: 10.1175/jcli-d-17-0550.1.
Gu, G., R.F. Adler, and G.J. Huffman, 2016: Long-term changes/trends in surface temperature and precipitation during the satellite era (1979–2012). Climate Dynamics, 46(3–4), 1091–1105, doi: 10.1007/s00382-015-2634-x.
Gu, H., J. Jin, Y. Wu, M.B. Ek, and Z.M. Subin, 2015: Calibration and validation of lake surface temperature simulations with the coupled WRF-lake model. Climatic Change, 129(3–4), 471–483, doi: 10.1007/s10584-013-0978-y.
Gu, L., J. Chen, C.-Y. Xu, H.-M. Wang, and L.P. Zhang, 2018: Synthetic Impacts of Internal Climate Variability and Anthropogenic Change on Future Meteorological Droughts over China. Water, 10(11), 1702, doi: 10.3390/ w10111702.
Gu, X. et al., 2019: Attribution of Global Soil Moisture Drying to Human Activities: A Quantitative Viewpoint. Geophysical Research Letters, 46(5), 2573–2582, doi: 10.1029/2018gl080768.
Guan, B. and D.E. Waliser, 2015: Detection of atmospheric rivers: Evaluation and application of an algorithm for global studies. Journal of Geophysical Research: Atmospheres, 120(24), 12514–12535, doi: 10.1002/2015jd024257.
Guan, B., D.E. Waliser, N.P. Molotch, E.J. Fetzer, and P.J. Neiman, 2012: Does the Madden–Julian Oscillation Influence Wintertime Atmospheric Rivers and Snowpack in the Sierra Nevada?Monthly Weather Review, 140(2), 325–342, doi: 10.1175/mwr-d-11-00087.1.
Gudmundsson, L. and S.I. Seneviratne, 2016: Anthropogenic climate change affects meteorological drought risk in Europe. Environmental Research Letters, 11(4), 044005, doi: 10.1088/1748-9326/11/4/044005.
Gudmundsson, L., M. Leonard, H.X. Do, S. Westra, and S.I. Seneviratne, 2019: Observed Trends in Global Indicators of Mean and Extreme Streamflow. Geophysical Research Letters, 46, 756–766, doi: 10.1029/2018gl079725.
Gudmundsson, L. et al., 2021: Globally observed trends in mean and extreme river flow attributed to climate change. Science, 371(6534), 1159–1162, doi: 10.1126/science.aba3996.
Guerreiro, S.B. et al., 2018: Detection of continental-scale intensification of hourly rainfall extremes. Nature Climate Change, 8(9), 803–807, doi: 10.1038/s41558-018-0245-3.
Guerrieri, R. et al., 2019: Disentangling the role of photosynthesis and stomatal conductance on rising forest water-use efficiency. Proceedings of the National Academy of Sciences, 116(34), 16909–16914, doi: 10.1073/pnas.1905912116.
Guhathakurta, P., P. Menon, P.M. Inkane, U. Krishnan, and S.T. Sable, 2017: Trends and variability of meteorological drought over the districts of India using standardized precipitation index. Journal of Earth System Science, 126(8), 120, doi: 10.1007/s12040-017-0896-x.
Gulizia, C. and I. Camilloni, 2015: Comparative analysis of the ability of a set of CMIP3 and CMIP5 global climate models to represent precipitation in South America. International Journal of Climatology, 35(4), 583–595, doi: 10.1002/joc.4005.
Guo, J. et al., 2017: Declining frequency of summertime local-scale precipitation over eastern China from 1970 to 2010 and its potential link to aerosols. Geophysical Research Letters, 44(11), 5700–5708, doi: 10.1002/2017gl073533.
Guo, L., A.G. Turner, and E.J. Highwood, 2016: Local and Remote Impacts of Aerosol Species on Indian Summer Monsoon Rainfall in a GCM. Journal of Climate, 29(19), 6937–6955, doi: 10.1175/jcli-d-15-0728.1.
Guo, L. et al., 2017: Contribution of Tropical Cyclones to Atmospheric Moisture Transport and Rainfall over East Asia. Journal of Climate, 30(10), 3853–3865, doi: 10.1175/jcli-d-16-0308.1.
Guo, R., C. Deser, L. Terray, and F. Lehner, 2019: Human Influence on Winter Precipitation Trends (1921–2015) over North America and Eurasia Revealed by Dynamical Adjustment. Geophysical Research Letters, 46(6), 3426–3434, doi: 10.1029/2018gl081316.
Gusain, A., S. Ghosh, and S. Karmakar, 2020: Added value of CMIP6 over CMIP5 models in simulating Indian summer monsoon rainfall. Atmospheric Research, 232, 104680, doi: 10.1016/j.atmosres.2019.104680.
Gutenstein, M. et al., 2021: Intercomparison of freshwater fluxes over ocean and investigations into water budget closure. Hydrology and Earth System Sciences, 25(1), 121–146, doi: 10.5194/hess-25-121-2021.
Gutmann, E.D. et al., 2018: Changes in Hurricanes from a 13-Yr Convection-Permitting Pseudo–Global Warming Simulation. Journal of Climate, 31(9), 3643–3657, doi: 10.1175/jcli-d-17-0391.1.
Guzha, A.C., M.C. Rufino, S. Okoth, S. Jacobs, and R.L.B. Nóbrega, 2018: Impacts of land use and land cover change on surface runoff, discharge and low flows: Evidence from East Africa. Journal of Hydrology: Regional Studies, 15, 49–67, doi: 10.1016/j.ejrh.2017.11.005.
Ha, K.-J., S. Moon, A. Timmermann, and D. Kim, 2020: Future Changes of Summer Monsoon Characteristics and Evaporative Demand Over Asia in CMIP6 Simulations. Geophysical Research Letters, 47(8), 1–10, doi: 10.1029/2020gl087492.
Haarsma, R.J. et al., 2016: High Resolution Model Intercomparison Project (HighResMIP v1.0) for CMIP6. Geoscientific Model Development, 9(11), 4185–4208, doi: 10.5194/gmd-9-4185-2016.
Haertel, P., 2018: Sensitivity of the Madden Julian Oscillation to Ocean Warming in a Lagrangian Atmospheric Model. Climate, 6(2), 45, doi: 10.3390/cli6020045.
Haerter, J.O. and L. Schlemmer, 2018: Intensified Cold Pool Dynamics Under Stronger Surface Heating. Geophysical Research Letters, 45(12), 6299–6310, doi: 10.1029/2017gl076874.
Haghtalab, N., N. Moore, B.P. Heerspink, and D.W. Hyndman, 2020: Evaluating spatial patterns in precipitation trends across the Amazon basin driven by land cover and global scale forcings. Theoretical and Applied Climatology, 140(1–2), 411–427, doi: 10.1007/s00704-019-03085-3.
Hagos, S.M., L.R. Leung, M. Ashfaq, and K. Balaguru, 2019: South Asian monsoon precipitation in CMIP5: a link between inter-model spread and the representations of tropical convection. Climate Dynamics, 52(1–2), 1049–1061, doi: 10.1007/s00382-018-4177-4.
Hagos, S.M., L.R. Leung, J.-H. Yoon, J. Lu, and Y. Gao, 2016: A projection of changes in landfalling atmospheric river frequency and extreme precipitation over western North America from the Large Ensemble CESM simulations. Geophysical Research Letters, 43(3), 1357–1363, doi: 10.1002/2015gl067392.
Ham, Y.G., J.S. Kug, J.Y. Choi, F.F. Jin, and M. Watanabe, 2018: Inverse relationship between present-day tropical precipitation and its sensitivity to greenhouse warming. Nature Climate Change, 8(1), 64–69, doi: 10.1038/s41558-017-0033-5.
Hamada, A. and Y.N. Takayabu, 2018: Large-scale environmental conditions related to midsummer extreme rainfall events around Japan in the TRMM region. Journal of Climate, 31(17), 6933–6945, doi: 10.1175/jcli-d-17-0632.1.
Hamada, A., Y.N. Takayabu, C. Liu, and E.J. Zipser, 2015: Weak linkage between the heaviest rainfall and tallest storms. Nature Communications, 6(1), 6213, doi: 10.1038/ncomms7213.
Han, J. et al., 2017: Updates in the NCEP GFS Cumulus Convection Schemes with Scale and Aerosol Awareness. Weather and Forecasting, 32(5), 2005–2017, doi: 10.1175/waf-d-17-0046.1.
Han, J.Y., J.J. Baik, and H. Lee, 2014: Urban impacts on precipitation. Asia-Pacific Journal of Atmospheric Sciences, 50(1), 17–30, doi: 10.1007/s13143-014-0016-7.
Hanasaki, N., S. Yoshikawa, Y. Pokhrel, and S. Kanae, 2018: A global hydrological simulation to specify the sources of water used by humans. Hydrology and Earth System Sciences, 22(1), 789–817, doi: 10.5194/hess-22-789-2018.
Hanel, M. et al., 2018: Revisiting the recent European droughts from a long-term perspective. Scientific Reports, 8(1), 9499, doi: 10.1038/s41598-018-27464-4.
Hanna, E., X. Fettweis, and R.J. Hall, 2018: Brief communication: Recent changes in summer Greenland blocking captured by none of the CMIP5 models. Cryosphere, 12(10), 3287–3292, doi: 10.5194/tc-12-3287-2018.
Hanna, E. et al., 2013: The influence of North Atlantic atmospheric and oceanic forcing effects on 1900–2010 Greenland summer climate and ice melt/runoff. International Journal of Climatology, 33(4), 862–880, doi: 10.1002/joc.3475.
Hansen, Z.K. and G.D. Libecap, 2004: Small Farms, Externalities, and the Dust Bowl of the 1930s. Journal of Political Economy, 112(3), 665–694, doi: 10.1086/383102.
Hari, V., G. Villarini, S. Karmakar, L.J. Wilcox, and M. Collins, 2020: Northward Propagation of the Intertropical Convergence Zone and Strengthening of Indian Summer Monsoon Rainfall. Geophysical Research Letters, 47(23), e2020GL089823, doi: 10.1029/2020gl089823.
Harpold, A., M. Dettinger, and S. Rajagopal, 2017: Defining Snow Drought and Why It Matters. Eos, Transactions American Geophysical Union, 98, doi: 10.1029/2017eo068775.
Harris, L.M., S.-J. Lin, and C.Y. Tu, 2016: High-Resolution Climate Simulations Using GFDL HiRAM with a Stretched Global Grid. Journal of Climate, 29(11), 4293–4314, doi: 10.1175/jcli-d-15-0389.1.
Harrison, S.P. et al., 2014: Climate model benchmarking with glacial and mid-Holocene climates. Climate Dynamics, 43(3–4), 671–688, doi: 10.1007/s00382-013-1922-6.
Harrison, S.P. et al., 2015: Evaluation of CMIP5 palaeo-simulations to improve climate projections. Nature Climate Change, 5(8), 735–743, doi: 10.1038/nclimate2649.
Harrop, B.E. and D.L. Hartmann, 2016: The Role of Cloud Radiative Heating in Determining the Location of the ITCZ in Aquaplanet Simulations. Journal of Climate, 29(8), 2741–2763, doi: 10.1175/jcli-d-15-0521.1.
Hartmann, A., T. Gleeson, Y. Wada, and T. Wagener, 2017: Enhanced groundwater recharge rates and altered recharge sensitivity to climate variability through subsurface heterogeneity. Proceedings of the National Academy of Sciences, 114(11), 2842–2847, doi: 10.1073/pnas.1614941114.
Hartmann, D.L. et al., 2013: Observations: Atmosphere and Surface. In: Climate Change 2013: The Physical Science Basis. Contribution of Working Group I to the Fifth Assessment Report of the Intergovernmental Panel on Climate Change[Stocker, T.F. et al., (eds.)]. Cambridge University Press, Cambridge, United Kingdom and New York, NY, USA, pp. 159–254, doi: 10.1017/cbo9781107415324.008.
Hartmann, H., 2015: Carbon starvation during drought-induced tree mortality – are we chasing a myth?Journal of Plant Hydraulics, 2, e005, doi: 10.20870/jph. 2015.e005.
Harvey, B.J., P. Cook, L.C. Shaffrey, and R. Schiemann, 2020: The Response of the Northern Hemisphere Storm Tracks and Jet Streams to Climate Change in the CMIP3, CMIP5, and CMIP6 Climate Models. Journal of Geophysical Research: Atmospheres, 125(23), e2020JD032701, doi: 10.1029/2020jd032701.
Hassim, M.E.E. and B. Timbal, 2019: Observed Rainfall Trends over Singapore and the Maritime Continent from the Perspective of Regional-Scale Weather Regimes. Journal of Applied Meteorology and Climatology, 58(2), 365–384, doi: 10.1175/jamc-d-18-0136.1.
Hasson, S., V. Lucarini, S. Pascale, and J. Böhner, 2014: Seasonality of the hydrological cycle in major South and Southeast Asian river basins as simulated by PCMDI/CMIP3 experiments. Earth System Dynamics, 5(1), 67–87, doi: 10.5194/esd-5-67-2014.
Hasson, S. et al., 2016: Seasonal cycle of Precipitation over Major River Basins in South and Southeast Asia: A Review of the CMIP5 climate models data for present climate and future climate projections. Atmospheric Research, 180, 42–63, doi: 10.1016/j.atmosres.2016.05.008.
Haszpra, T., M. Herein, and T. Bódai, 2020: Investigating ENSO and its teleconnections under climate change in an ensemble view – a new perspective. Earth System Dynamics, 11(1), 267–280, doi: 10.5194/esd-11-267-2020.
Hattermann, F.F. et al., 2018: Sources of uncertainty in hydrological climate impact assessment: a cross-scale study. Environmental Research Letters, 13(1), 015006, doi: 10.1088/1748-9326/aa9938.
Haug, G.H. et al., 2003: Climate and the Collapse of Maya Civilization. Science, 299(5613), 1731–1735, doi: 10.1126/science.1080444.
Havel, A., A. Tasdighi, and M. Arabi, 2018: Assessing the hydrologic response to wildfires in mountainous regions. Hydrology and Earth System Sciences, 22(4), 2527–2550, doi: 10.5194/hess-22-2527-2018.
Haverd, V. et al., 2018: A new version of the CABLE land surface model (Subversion revision r4601) incorporating land use and land cover change, woody vegetation demography, and a novel optimisation-based approach to plant coordination of photosynthesis. Geoscientific Model Development, 11, 2995–3026, doi: 10.5194/gmd-11-2995-2018.
Hawcroft, M., E. Walsh, K. Hodges, and G. Zappa, 2018: Significantly increased extreme precipitation expected in Europe and North America from extratropical cyclones. Environmental Research Letters, 13(12), 124006, doi: 10.1088/1748-9326/aaed59.
Hawcroft, M.K., L.C. Shaffrey, K.I. Hodges, and H.F. Dacre, 2016: Can climate models represent the precipitation associated with extratropical cyclones?Climate Dynamics, 47(3–4), 679–695, doi: 10.1007/s00382-015-2863-z.
Hawkins, E. and R. Sutton, 2011: The potential to narrow uncertainty in projections of regional precipitation change. Climate Dynamics, 37(1), 407–418, doi: 10.1007/s00382-010-0810-6.
Hawkins, E. and R. Sutton, 2012: Time of emergence of climate signals. Geophysical Research Letters, 39(1), L01702, doi: 10.1029/2011gl050087.
Hawkins, E. et al., 2020: Observed Emergence of the Climate Change Signal: From the Familiar to the Unknown. Geophysical Research Letters, 47(6), e2019GL086259, doi: 10.1029/2019gl086259.
Hayashi, M., 2020: Alpine Hydrogeology: The Critical Role of Groundwater in Sourcing the Headwaters of the World. Groundwater, 58(4), 498–510, doi: 10.1111/g wat.12965.
Haywood, A.M. et al., 2013: Large-scale features of Pliocene climate: results from the Pliocene Model Intercomparison Project. Climate of the Past, 9(1), 191–209, doi: 10.5194/cp-9-191-2013.
Haywood, J.M., A. Jones, N. Bellouin, and D. Stephenson, 2013: Asymmetric forcing from stratospheric aerosols impacts Sahelian rainfall. Nature Climate Change, 3(7), 660–665, doi: 10.1038/nclimate1857.
He, C., B. Wu, L. Zou, and T. Zhou, 2017: Responses of the Summertime Subtropical Anticyclones to Global Warming. Journal of Climate, 30(16), 6465–6479, doi: 10.1175/jcli-d-16-0529.1.
He, J. and B.J. Soden, 2015: Anthropogenic weakening of the tropical circulation: The relative roles of direct CO2 forcing and sea surface temperature change. Journal of Climate, 28(22), 8728–8742, doi: 10.1175/jcli-d-15-0205.1.
He, J. and B.J. Soden, 2017: A re-examination of the projected subtropical precipitation decline. Nature Climate Change, 7(1), 53–57, doi: 10.1038/nclimate3157.
He, J. et al., 2018: Precipitation sensitivity to local variations in tropical sea surface temperature. Journal of Climate, 31(22), 9225–9238, doi: 10.1175/jcli-d-18-0262.1.
Heede, U.K., A. Fedorov, and N.J. Burls, 2020: Time Scales and Mechanisms for the Tropical Pacific Response to Global Warming: A Tug of War between the Ocean Thermostat and Weaker Walker. Journal of Climate, 33(14), 6101–6118, doi: 10.1175/jcli-d-19-0690.1.
Heerspink, B.P., A.D. Kendall, M.T. Coe, and D.W. Hyndman, 2020: Trends in streamflow, evapotranspiration, and groundwater storage across the Amazon Basin linked to changing precipitation and land cover. Journal of Hydrology: Regional Studies, 32, 100755, doi: 10.1016/j.ejrh.2020.100755.
Hegerl, G.C. et al., 2015: Challenges in quantifying changes in the global water cycle. Bulletin of the American Meteorological Society, 96(7), 1097–1115, doi: 10.1175/bams-d-13-00212.1.
Hein, A., L. Condon, and R. Maxwell, 2019: Evaluating the relative importance of precipitation, temperature and land-cover change in the hydrologic response to extreme meteorological drought conditions over the North American High Plains. Hydrology and Earth System Sciences, 23(4), 1931–1950, doi: 10.5194/hess-23-1931-2019.
Heinzeller, D., W. Junkermann, and H. Kunstmann, 2016: Anthropogenic Aerosol Emissions and Rainfall Decline in Southwestern Australia: Coincidence or Causality?Journal of Climate, 29(23), 8471–8493, doi: 10.1175/jcli-d-16-0082.1.
Held, I.M. and B.J. Soden, 2006: Robust Responses of the Hydrological Cycle to Global Warming. Journal of Climate, 19(21), 5686–5699, doi: 10.1175/jcli3990.1.
Herger, N., B.M. Sanderson, and R. Knutti, 2015: Improved pattern scaling approaches for the use in climate impact studies. Geophysical Research Letters, 42(9), 3486–3494, doi: 10.1002/2015gl063569.
Hernández-Henríquez, M.A., S.J. Déry, and C. Derksen, 2015: Polar amplification and elevation-dependence in trends of Northern Hemisphere snow cover extent, 1971–2014. Environmental Research Letters, 10(4), 044010, doi: 10.1088/1748-9326/10/4/044010.
Hessl, A.E. et al., 2018: Past and future drought in Mongolia. Science Advances, 4(3), e1701832, doi: 10.1126/sciadv.1701832.
Hewson, M., H. McGowan, S. Phinn, S. Peckham, and G. Grell, 2013: Exploring Aerosol Effects on Rainfall for Brisbane, Australia. Climate, 1(3), 120–147, doi: 10.3390/cli1030120.
Hill, S.A., Y. Ming, I.M. Held, and M. Zhao, 2017: A Moist Static Energy Budget–Based Analysis of the Sahel Rainfall Response to Uniform Oceanic Warming. Journal of Climate, 30(15), 5637–5660, doi: 10.1175/jcli-d-16-0785.1.
Hirasawa, H., P.J. Kushner, M.I. Sigmond, J. Fyfe, and C. Deser, 2020: Anthropogenic Aerosols Dominate Forced Multidecadal Sahel Precipitation Change through Distinct Atmospheric and Oceanic Drivers. Journal of Climate, 33(23), 10187–10204, doi: 10.1175/jcli-d-19-0829.1.
Hirons, L. and A. Turner, 2018: The Impact of Indian Ocean Mean-State Biases in Climate Models on the Representation of the East African Short Rains. Journal of Climate, 31(16), 6611–6631, doi: 10.1175/jcli-d-17-0804.1.
Hock, R. et al., 2019a: High Mountain Areas. In: IPCC Special Report on the Ocean and Cryosphere in a Changing Climate[Pörtner, H.-O., D.C. Roberts, V. Masson-Delmotte, P. Zhai, M. Tignor, E. Poloczanska, K. Mintenbeck, A. Alegría, M. Nicolai, A. Okem, J. Petzold, B. Rama, and N.M. Weyer (eds.)]. In Press, pp. 131–202, www.ipcc.ch/srocc/chapter/chapter-2.
Hock, R. et al., 2019b: GlacierMIP – A model intercomparison of global-scale glacier mass-balance models and projections. Journal of Glaciology, 65(251), 453–467, doi: 10.1017/jog.2019.22.
Hodges, K.I., R.W. Lee, and L. Bengtsson, 2011: A comparison of extratropical cyclones in recent reanalyses ERA-Interim, NASA MERRA, NCEP CFSR, and JRA-25. Journal of Climate, 24(18), 4888–4906, doi: 10.1175/2011jcli4097.1.
Hodnebrog, Ø. et al., 2019a: Intensification of summer precipitation with shorter time-scales in Europe. Environmental Research Letters, 14(12), 124050, doi: 10.1088/1748-9326/ab549c.
Hodnebrog, Ø. et al., 2019b: Water vapour adjustments and responses differ between climate drivers. Atmospheric Chemistry and Physics, 19(20), 12887–12899, doi: 10.5194/acp-19-12887-2019.
Hoegh-Guldberg, O. et al., 2018: Impacts of 1.5°C Global Warming on Natural and Human Systems. In: IPCC Special Report on the impacts of global warming of 1.5°C above pre-industrial levels and related global greenhouse gas emission pathways, in the context of strengthening the global response to the threat of climate change, sustainable development, and efforts to eradicate poverty. [Masson-Delmotte, V., P. Zhai, H.-O. Pörtner, D. Roberts, J. Skea, P.R. Shukla, A. Pirani, W. Moufouma-Okia, C. Péan, R. Pidcock, S. Connors, J.B.R. Matthews, Y. Chen, X. Zhou, M.I. Gomis, E. Lonnoy, T. Maycock, M. Tignor, and T. Waterfield (eds.)]. In Press, Cambridge, United Kingdom and New York, NY, USA, pp. 175–311, www.ipcc.ch/sr15/chapter/chapter-3.
Hoell, A. and L. Cheng, 2018: Austral summer Southern Africa precipitation extremes forced by the El Niño-Southern oscillation and the subtropical Indian Ocean dipole. Climate Dynamics, 50(9–10), 3219–3236, doi: 10.1007/s00382-017-3801-z.
Hoell, A., C. Funk, M. Barlow, and S. Shukla, 2016: Recent and Possible Future Variations in the North American Monsoon. In: The Monsoons and Climate Change[de Carvalho, L.M.V. and C. Jones (eds.)]. Springer, Cham, Switzerland, pp. 149–162, doi: 10.1007/978-3-319-21650-8_7.
Hoell, A., C. Funk, J. Zinke, and L. Harrison, 2017a: Modulation of the Southern Africa precipitation response to the El Niño Southern Oscillation by the subtropical Indian Ocean Dipole. Climate Dynamics, 48(7–8), 2529–2540, doi: 10.1007/s00382-016-3220-6.
Hoell, A., M. Hoerling, J. Eischeid, X.-W. Quan, and B. Liebmann, 2017b: Reconciling Theories for Human and Natural Attribution of Recent East Africa Drying. Journal of Climate, 30(6), 1939–1957, doi: 10.1175/jcli-d-16-0558.1.
Hoerling, M. et al., 2012: On the Increased Frequency of Mediterranean Drought. Journal of Climate, 25(6), 2146–2161, doi: 10.1175/jcli-d-11-00296.1.
Hohenegger, C. and B. Stevens, 2018: The role of the permanent wilting point in controlling the spatial distribution of precipitation. Proceedings of the National Academy of Sciences, 115(22), 5692–5697, doi: 10.1073/pnas.1718842115.
Holloway, C.E. et al., 2017: Observing Convective Aggregation. Surveys in Geophysics, 38(6), 1199–1236, doi: 10.1007/s10712-017-9419-1.
Holz, A. et al., 2017: Southern Annular Mode drives multicentury wildfire activity in southern South America. Proceedings of the National Academy of Sciences, 114(36), 9552–9557, doi: 10.1073/pnas.1705168114.
Hong, B. et al., 2018: The respective characteristics of millennial-scale changes of the India summer monsoon in the Holocene and the Last Glacial. Palaeogeography, Palaeoclimatology, Palaeoecology, 496, 155–165, doi: 10.1016/j.palaeo.2018.01.033.
Hooper, J. and S. Marx, 2018: A global doubling of dust emissions during the Anthropocene?Global and Planetary Change, 169, 70–91, doi: 10.1016/j.gloplacha.2018.07.003.
Hopcroft, P.O., P.J. Valdes, A.B. Harper, and D.J. Beerling, 2017: Multi vegetation model evaluation of the Green Sahara climate regime. Geophysical Research Letters, 44(13), 6804–6813, doi: 10.1002/2017gl073740.
Hope, P., B.J. Henley, J. Gergis, J. Brown, and H. Ye, 2017: Time-varying spectral characteristics of ENSO over the Last Millennium. Climate Dynamics, 49(5), 1705–1727, doi: 10.1007/s00382-016-3393-z.
Hope, P. et al., 2015: Seasonal and regional signature of the projected southern Australian rainfall reduction. Australian Meteorological and Oceanographic Journal, 65(1), 54–71, doi: 10.22499/2.6501.005.
Horinouchi, T., S. Matsumura, T. Ose, and Y.N. Takayabu, 2019: Jet–Precipitation Relation and Future Change of the Mei-Yu–Baiu Rainband and Subtropical Jet in CMIP5 Coupled GCM Simulations. Journal of Climate, 32(8), 2247–2259, doi: 10.1175/jcli-d-18-0426.1.
Horton, D.E. et al., 2015: Contribution of changes in atmospheric circulation patterns to extreme temperature trends. Nature, 522(7557), 465–469, doi: 10.1038/nature14550.
Hourdin, F. et al., 2013: LMDZ5B: the atmospheric component of the IPSL climate model with revisited parameterizations for clouds and convection. Climate Dynamics, 40(9–10), 2193–2222, doi: 10.1007/s00382-012-1343-y.
Hristova-Veleva, S.M. et al., 2020: An Eye on the Storm: Integrating a Wealth of Data for Quickly Advancing the Physical Understanding and Forecasting of Tropical Cyclones. Bulletin of the American Meteorological Society, 101(10), E1718–E1742, doi: 10.1175/bams-d-19-0020.1.
Hsu, H.-H., T. Zhou, and J. Matsumoto, 2014: East Asian, Indochina and Western North Pacific Summer Monsoon – An update. Asia-Pacific Journal of Atmospheric Sciences, 50(1), 45–68, doi: 10.1007/s13143-014-0027-4.
Hu, Q., J.A. Torres-Alavez, and M.S. Van Den Broeke, 2018: Land-Cover Change and the “Dust Bowl” Drought in the U.S. Great Plains. Journal of Climate, 31(12), 4657–4667, doi: 10.1175/jcli-d-17-0515.1.
Hu, Z. et al., 2019: Groundwater Depletion Estimated from GRACE: A Challenge of Sustainable Development in an Arid Region of Central Asia. Remote Sensing, 11(16), 1908, doi: 10.3390/rs11161908.
Hu, Z.-Z., 2003: Long-term climate variations in China and global warming signals. Journal of Geophysical Research: Atmospheres, 108(D19), 4614, doi: 10.1029/2003jd003651.
Hua, W., A. Dai, L. Zhou, M. Qin, and H. Chen, 2019: An Externally Forced Decadal Rainfall Seesaw Pattern Over the Sahel and Southeast Amazon. Geophysical Research Letters, 46(2), 923–932, doi: 10.1029/2018gl081406.
Hua, W. et al., 2016: Possible causes of the Central Equatorial African long-term drought. Environmental Research Letters, 11(12), 124002, doi: 10.1088/1748-9326/11/12/124002.
Hua, W. et al., 2018: Understanding the Central Equatorial African long-term drought using AMIP-type simulations. Climate Dynamics, 50(3–4), 1115–1128, doi: 10.1007/s00382-017-3665-2.
Huang, D. et al., 2018: Uncertainty of global summer precipitation in the CMIP5 models: a comparison between high-resolution and low-resolution models. Theoretical and Applied Climatology, 132(1–2), 55–69, doi: 10.1007/s00704-017-2078-9.
Huang, J., T. Wang, W. Wang, Z. Li, and H. Yan, 2014: Climate effects of dust aerosols over East Asian arid and semiarid regions. Journal of Geophysical Research: Atmospheres, 119(19), 11398–11416, doi: 10.1002/2014jd021796.
Huang, P., X.-T. Zheng, and J. Ying, 2019: Disentangling the Changes in the Indian Ocean Dipole–Related SST and Rainfall Variability under Global Warming in CMIP5 Models. Journal of Climate, 32(13), 3803–3818, doi: 10.1175/jcli-d-18-0847.1.
Huang, P., S.-P. Xie, K. Hu, G. Huang, and R. Huang, 2013: Patterns of the seasonal response of tropical rainfall to global warming. Nature Geoscience, 6(5), 357–361, doi: 10.1038/ngeo1792.
Huang, S., B. Wang, and Z. Wen, 2020: Dramatic Weakening of the Tropical Easterly Jet Projected by CMIP6 Models. Journal of Climate, 33(19), 8439–8455, doi: 10.1175/jcli-d-19-1002.1.
Huang, S. et al., 2017: Evaluation of an ensemble of regional hydrological models in 12 large-scale river basins worldwide. Climatic Change, 141(3), 381–397, doi: 10.1007/s10584-016-1841-8.
Huang, S. et al., 2018: Multimodel assessment of flood characteristics in four large river basins at global warming of 1.5, 2.0 and 3.0 K above the pre-industrial level. Environmental Research Letters, 13(12), 124005, doi: 10.1088/1748-9326/aae94b.
Huang, X. et al., 2020a: South Asian summer monsoon projections constrained by the interdecadal Pacific oscillation. Science Advances, 6(11), eaay6546, doi: 10.1126/sciadv.aay6546.
Huang, X. et al., 2020b: The Recent Decline and Recovery of Indian Summer Monsoon Rainfall: Relative Roles of External Forcing and Internal Variability. Journal of Climate, 33(12), 5035–5060, doi: 10.1175/jcli-d-19-0833.1.
Huang, Y., S. Gerber, T. Huang, and J.W. Lichstein, 2016: Evaluating the drought response of CMIP5 models using global gross primary productivity, leaf area, precipitation, and soil moisture data. Global Biogeochemical Cycles, 30(12), 1827–1846, doi: 10.1002/2016gb005480.
Hui, C. and X.-T. Zheng, 2018: Uncertainty in Indian Ocean Dipole response to global warming: the role of internal variability. Climate Dynamics, 51(9–10), 3597–3611, doi: 10.1007/s00382-018-4098-2.
Hung, M.-P. et al., 2013: MJO and Convectively Coupled Equatorial Waves Simulated by CMIP5 Climate Models. Journal of Climate, 26(17), 6185–6214, doi: 10.1175/jcli-d-12-00541.1.
Huntington, T.G., 2006: Evidence for intensification of the global water cycle: Review and synthesis. Journal of Hydrology, 319(1–4), 83–95, doi: 10.1016/j.jhydrol.2005.07.003.
Huss, M. and R. Hock, 2018: Global-scale hydrological response to future glacier mass loss. Nature Climate Change, 8(2), 135–140, doi: 10.1038/s41558-017-0049-x.
Hwang, Y.-T., D.M.W. Frierson, and S.M. Kang, 2013: Anthropogenic sulfate aerosol and the southward shift of tropical precipitation in the late 20th century. Geophysical Research Letters, 40(11), 2845–2850, doi: 10.1002/grl.50502.
Ibarra, D.E. et al., 2018: Warm and cold wet states in the western United States during the Pliocene–Pleistocene. Geology, 46(4), 355–358, doi: 10.1130/g39962.1.
Iles, C.E. and G.C. Hegerl, 2014: The global precipitation response to volcanic eruptions in the CMIP5 models. Environmental Research Letters, 9(10), 104012, doi: 10.1088/1748-9326/9/10/104012.
Iles, C.E. and G.C. Hegerl, 2015: Systematic change in global patterns of streamflow following volcanic eruptions. Nature Geoscience, 8(11), 838–842, doi: 10.1038/ngeo2545.
Imfeld, N. et al., 2020: A combined view on precipitation and temperature climatology and trends in the southern Andes of Peru. International Journal of Climatology, 41, 679–698, doi: 10.1002/joc.6645.
Immerzeel, W.W. et al., 2020: Importance and vulnerability of the world’s water towers. Nature, 577(7790), 364–369, doi: 10.1038/s41586-019-1822-y.
Ionita, M., V. Nagavciuc, and B. Guan, 2020: Rivers in the sky, flooding on the ground: the role of atmospheric rivers in inland flooding in central Europe. Hydrology and Earth System Sciences, 24(11), 5125–5147, doi: 10.5194/hess-24-5125-2020.
IPCC, 2013: Climate Change 2013: The Physical Science Basis. Contribution of Working Group I to the Fifth Assessment Report of the Intergovernmental Panel on Climate Change [Stocker, T.F. et al, (eds.)]. Cambridge University Press, Cambridge, United Kingdom and New York, NY, USA, 1535 pp., doi: 10.1017/cbo9781107415324.
IPCC, 2018: Summary for Policymakers. In: Global Warming of 1.5°C. An IPCC Special Report on the impacts of global warming of 1.5°C above pre-industrial levels and related global greenhouse gas emission pathways, in the context of strengthening the global response to the threat of climate change, [Masson-Delmotte, V. et al, (eds.)]. In Press, pp. 1–30, www.ipcc.ch/sr15/chapter/summary-for-policy-makers.
Irvine, P. et al., 2019: Halving warming with idealized solar geoengineering moderates key climate hazards. Nature Climate Change, 9(4), 295–299, doi: 10.1038/s41558-019-0398-8.
Ishizaki, Y. et al., 2013: Dependence of precipitation scaling patterns on emission scenarios for representative concentration pathways. Journal of Climate, 26(22), 8868–8879, doi: 10.1175/jcli-d-12-00540.1.
Jackson, L.C. et al., 2015: Global and European climate impacts of a slowdown of the AMOC in a high resolution GCM. Climate Dynamics, 45(11–12), 3299–3316, doi: 10.1007/s00382-015-2540-2.
Jackson, L.S., J.A. Crook, and P.M. Forster, 2016: An intensified hydrological cycle in the simulation of geoengineering by cirrus cloud thinning using ice crystal fall speed changes. Journal of Geophysical Research: Atmospheres, 121(12), 6822–6840, doi: 10.1002/2015jd024304.
Jackson, L.S. et al., 2020: The Effect of Explicit Convection on Couplings between Rainfall, Humidity, and Ascent over Africa under Climate Change. Journal of Climate, 33(19), 8315–8337, doi: 10.1175/jcli-d-19-0322.1.
Jacob, D. et al., 2014: EURO-CORDEX: New high-resolution climate change projections for European impact research. Regional Environmental Change, 14(2), 563–578, doi: 10.1007/s10113-013-0499-2.
Jakob, C., M.S. Singh, and L. Jungandreas, 2019: Radiative Convective Equilibrium and Organized Convection: An Observational Perspective. Journal of Geophysical Research: Atmospheres, 124(10), 5418–5430, doi: 10.1029/2018jd030092.
Jalihal, C., J. Srinivasan, and A. Chakraborty, 2019: Modulation of Indian monsoon by water vapor and cloud feedback over the past 22,000 years. Nature Communications, 10(1), 5701, doi: 10.1038/s41467-019-13754-6.
James, R., R. Washington, C.-F. Schleussner, J. Rogelj, and D. Conway, 2017: Characterizing half-a-degree difference: a review of methods for identifying regional climate responses to global warming targets. WIREs Climate Change, 8(2), e457, doi: 10.1002/wcc.457.
Jansen, E. et al., 2007: Palaeoclimate. In: Climate Change 2007: The Physical Science Basis. Contribution of Working Group I to the Fourth Assessment Report of the Intergovernmental Panel on Climate Change[Solomon, S., D. Qin, M. Manning, Z. Chen, M. Marquis, K.B. Averyt, M. Tignor, and H.L. Miller (eds.)]. Cambridge University Press, Cambridge, United Kingdom and New York, NY, USA, pp. 434–497, www.ipcc.ch/report/ar4/wg1.
Jasechko, S. and R.G. Taylor, 2015: Intensive rainfall recharges tropical groundwaters. Environmental Research Letters, 10(12401), 5, doi: 10.1088/1748-9326/10/12/124015.
Jeevanjee, N. and D.M. Romps, 2018: Mean precipitation change from a deepening troposphere. Proceedings of the National Academy of Sciences, 115(45), 11465–11470, doi: 10.1073/pnas.1720683115.
Jefferson, J.L. and R.M. Maxwell, 2015: Evaluation of simple to complex parameterizations of bare ground evaporation. Journal of Advances in Modeling Earth Systems, 7(3), 1075–1092, doi: 10.1002/2014ms000398.
Jemai, H., M. Ellouze, H. Abida, and B. Laignel, 2018: Spatial and temporal variability of rainfall: case of Bizerte-Ichkeul Basin (Northern Tunisia). Arabian Journal of Geosciences, 11(8), 177, doi: 10.1007/s12517-018-3482-x.
Jia, G. et al., 2019: Land–climate interactions. In: Climate Change and Land: an IPCC special report on climate change, desertification, land degradation, sustainable land management, food security, and greenhouse gas fluxes in terrestrial ecosystems[P.R. Shukla, J. Skea, E. Calvo Buendia, V. Masson-Delmotte, H.-O. Pörtner, D.C. Roberts, P. Zhai, R. Slade, S. Connors, R. van Diemen, M. Ferrat, E. Haughey, S. Luz, S. Neogi, M. Pathak, J. Petzold, J. Portugal Pereira, P. Vyas, E. Huntley, K. Kissick, M, Belkacemi, J. Malley (eds.)]. In press, pp.131-247, www.ipcc.ch/srccl/chapter/chapter-2.
Jiang, P., D. Wang, and Y. Cao, 2016: Spatiotemporal characteristics of precipitation concentration and their possible links to urban extent in China. Theoretical and Applied Climatology, 123(3–4), 757–768, doi: 10.1007/s00704-015-1393-2.
Jiang, X. et al., 2015: Vertical structure and physical processes of the Madden–Julian oscillation: Exploring key model physics in climate simulations. Journal of Geophysical Research: Atmospheres, 120(10), 4718–4748, doi: 10.1002/2014jd022375.
Jiang, X. et al., 2020: Fifty Years of Research on the Madden–Julian Oscillation: Recent Progress, Challenges, and Perspectives. Journal of Geophysical Research: Atmospheres, 125(17), e2019JD030911, doi: 10.1029/2019jd030911.
Jiménez Cisneros, B.E. et al., 2014: Freshwater resources. In: Climate Change 2014: Impacts, Adaptation, and Vulnerability. Part A: Global and Sectoral Aspects. Contribution of Working Group II to the Fifth Assessment Report of the Intergovernmental Panel on Climate Change[Field, C.B., V.R. Barros, D.J. Dokken, K.J. Mach, M.D. Mastrandrea, T.E. Bilir, M. Chatterjee, K.L. Ebi, Y.O. Estrada, R.C. Genova, B. Girma, E.S. Kissel, A.N. Levy, S. MacCracken, P.R. Mastrandrea, and L.L. White (eds.)]. Cambridge University Press, Cambridge, United Kingdom and New York, NY, USA, pp. 229–269, doi: 10.1017/cbo9781107415379.008.
Jin, C., B. Wang, and J. Liu, 2020: Future Changes and Controlling Factors of the Eight Regional Monsoons Projected by CMIP6 Models. Journal of Climate, 33(21), 9307–9326, doi: 10.1175/jcli-d-20-0236.1.
Jin, D. and Z. Guan, 2017: Summer Rainfall Seesaw between Hetao and the Middle and Lower Reaches of the Yangtze River and Its Relationship with the North Atlantic Oscillation. Journal of Climate, 30(17), 6629–6643, doi: 10.1175/jcli-d-16-0760.1.
Jin, Q. and C. Wang, 2017: A revival of Indian summer monsoon rainfall since 2002. Nature Climate Change, 7(8), 587–594, doi: 10.1038/nclimate3348.
Jing, X. et al., 2017: A Multimodel Study on Warm Precipitation Biases in Global Models Compared to Satellite Observations. Journal of Geophysical Research: Atmospheres, 122(21), 11806–11824, doi: 10.1002/2017jd027310.
Joetzjer, E. et al., 2014: Predicting the response of the Amazon rainforest to persistent drought conditions under current and future climates: A major challenge for global land surface models. Geoscientific Model Development, 7(6), 2933–2950, doi: 10.5194/gmd-7-2933-2014.
Johnson, S.J. et al., 2016: The resolution sensitivity of the South Asian monsoon and Indo-Pacific in a global 0.35° AGCM. Climate Dynamics, 46(3–4), 807–831, doi: 10.1007/s00382-015-2614-1.
Jolly, D. et al., 1998: Biome reconstruction from pollen and plant macrofossil data for Africa and the Arabian peninsula at 0 and 6000 years. Journal of Biogeography, 25(6), 1007–1027, doi: 10.1046/j.1365-2699.1998.00238.x.
Jones, A. et al., 2013: The impact of abrupt suspension of solar radiation management (termination effect) in experiment G2 of the Geoengineering Model Intercomparison Project (GeoMIP). Journal of Geophysical Research: Atmospheres, 118(17), 9743–9752, doi: 10.1002/jgrd.50762.
Jones, C. and L.M.V. Carvalho, 2013: Climate Change in the South American Monsoon System: Present Climate and CMIP5 Projections. Journal of Climate, 26(17), 6660–6678, doi: 10.1175/jcli-d-12-00412.1.
Jones, C.D. et al., 2013: Uncertainties in CMIP5 Climate Projections due to Carbon Cycle Feedbacks. Journal of Climate, 27(2), 511–526, doi: 10.1175/jcli-d-12-00579.1.
Joseph, G. et al., 2016: Stable isotopes in atmospheric water vapor and applications to the hydrologic cycle. Reviews of Geophysics, 54(4), 809–865, doi: 10.1002/2015rg000512.
Joshi, M.M., A.G. Turner, and C. Hope, 2013: The use of the land–sea warming contrast under climate change to improve impact metrics. Climatic Change, 117(4), 951–960, doi: 10.1007/s10584-013-0715-6.
Jourdain, N.C. et al., 2013: The Indo-Australian monsoon and its relationship to ENSO and IOD in reanalysis data and the CMIP3/CMIP5 simulations. Climate Dynamics, 41(11–12), 3073–3102, doi: 10.1007/s00382-013-1676-1.
Jung, T., S.K. Gulev, I. Rudeva, and V. Soloviov, 2006: Sensitivity of extratropical cyclone characteristics to horizontal resolution in the ECMWF model. Quarterly Journal of the Royal Meteorological Society, 132(619), 1839–1857, doi: 10.1256/qj.05.212.
Junk, W.J. et al., 2013: Current state of knowledge regarding the world’s wetlands and their future under global climate change: a synthesis. Aquatic Sciences, 75(1), 151–167, doi: 10.1007/s00027-012-0278-z.
Kageyama, M. et al., 2013: Climatic impacts of fresh water hosing under last glacial Maximum conditions: A multi-model study. Climate of the Past, 9(2), 935–953, doi: 10.5194/cp-9-935-2013.
Kageyama, M. et al., 2018: The PMIP4 contribution to CMIP6 – Part 1: Overview and over-arching analysis plan. Geoscientific Model Development, 11(3), 1033–1057, doi: 10.5194/gmd-11-1033-2018.
Kalimeris, A., E. Ranieri, D. Founda, and C. Norrant, 2017: Variability modes of precipitation along a Central Mediterranean area and their relations with ENSO, NAO, and other climatic patterns. Atmospheric Research, 198, 56–80, doi: 10.1016/j.atmosres.2017.07.031.
Kam, J., T.R. Knutson, and P.C.D. Milly, 2018: Climate model assessment of changes in winter-spring streamflow timing over North America. Journal of Climate, 31(14), 5581–5593, doi: 10.1175/jcli-d-17-0813.1.
Kamae, Y., W. Mei, and S.-P. Xie, 2019: Ocean warming pattern effects on future changes in East Asian atmospheric rivers. Environmental Research Letters, 14(5), 54019, doi: 10.1088/1748-9326/ab128a.
Kamae, Y., W. Mei, S.-P. Xie, M. Naoi, and H. Ueda, 2017: Atmospheric Rivers over the Northwestern Pacific: Climatology and Interannual Variability. Journal of Climate, 30(15), 5605–5619, doi: 10.1175/jcli-d-16-0875.1.
Kanemaru, K. et al., 2017: Development of a Precipitation Climate Record from Spaceborne Precipitation Radar Data. Part I: Mitigation of the Effects of Switching to Redundancy Electronics in the TRMM Precipitation Radar. Journal of Atmospheric and Oceanic Technology, 34(9), 2043–2057, doi: 10.1175/jtech-d-17-0026.1.
Kang, D.H., H. Gao, X. Shi, S.U. Islam, and S.J. Déry, 2016: Impacts of a Rapidly Declining Mountain Snowpack on Streamflow Timing in Canada’s Fraser River Basin. Scientific Reports, 6(1), 1–8, doi: 10.1038/srep19299.
Kang, S. et al., 2018: Late Holocene anti-phase change in the East Asian summer and winter monsoons. Quaternary Science Reviews, 188, 28–36, doi: 10.1016/j.quascirev.2018.03.028.
Kang, S.M. and L.M. Polvani, 2011: The Interannual Relationship between the Latitude of the Eddy-Driven Jet and the Edge of the Hadley Cell. Journal of Climate, 24(2), 563–568, doi: 10.1175/2010jcli4077.1.
Kang, S.M., C. Deser, and L.M. Polvani, 2013: Uncertainty in Climate Change Projections of the Hadley Circulation: The Role of Internal Variability. Journal of Climate, 26(19), 7541–7554, doi: 10.1175/jcli-d-12-00788.1.
Kang, S.M., I.M. Held, D.M.W. Frierson, and M. Zhao, 2008: The response of the ITCZ to extratropical thermal forcing: Idealized slab-ocean experiments with a GCM. Journal of Climate, 21(14), 3521–3532, doi: 10.1175/2007jcli2146.1.
Kanji, Z.A. et al., 2017: Overview of Ice Nucleating Particles. Meteorological Monographs, 58, 1.1–1.33, doi: 10.1175/amsmonographs-d-16-0006.1.
Kanner, L.C., S.J. Burns, H. Cheng, R.L. Edwards, and M. Vuille, 2013: High-resolution variability of the South American summer monsoon over the last seven millennia: Insights from a speleothem record from the central Peruvian Andes. Quaternary Science Reviews, 75, 1–10, doi: 10.1016/j.quascirev.2013.05.008.
Kapnick, S. and A. Hall, 2012: Causes of recent changes in western North American snowpack. Climate Dynamics, 38(9–10), 1885–1899, doi: 10.1007/s00382-011-1089-y.
Karim, F. et al., 2016: Impact of climate change on floodplain inundation and hydrological connectivity between wetlands and rivers in a tropical river catchment. Hydrological Processes, 30(10), 1574–1593, doi: 10.1002/hyp.10714.
Karmakar, N., A. Chakraborty, and R.S. Nanjundiah, 2017: Increased sporadic extremes decrease the intraseasonal variability in the Indian summer monsoon rainfall. Scientific Reports, 7(1), 7824, doi: 10.1038/s41598-017-07529-6.
Kasoar, M., D. Shawki, and A. Voulgarakis, 2018: Similar spatial patterns of global climate response to aerosols from different regions. npj Climate and Atmospheric Science, 1(1), 12, doi: 10.1038/s41612-018-0022-z.
Kay, J.E. et al., 2015: The Community Earth System Model (CESM) Large Ensemble Project: A Community Resource for Studying Climate Change in the Presence of Internal Climate Variability. Bulletin of the American Meteorological Society, 96(8), 1333–1349, doi: 10.1175/bams-d-13-00255.1.
Kelley, C.P., S. Mohtadi, M.A. Cane, R. Seager, and Y. Kushnir, 2015: Climate change in the Fertile Crescent and implications of the recent Syrian drought. Proceedings of the National Academy of Sciences, 112(11), 3241–3246, doi: 10.1073/pnas.1421533112.
Kendon, E.J. et al., 2017: Do Convection-Permitting Regional Climate Models Improve Projections of Future Precipitation Change?Bulletin of the American Meteorological Society, 98(1), 79–93, doi: 10.1175/bams-d-15-0004.1.
Kendon, E.J. et al., 2019: Enhanced future changes in wet and dry extremes over Africa at convection-permitting scale. Nature communications, 10(1), 1794, doi: 10.1038/s41467-019-09776-9.
Kent, C., R. Chadwick, and D.P. Rowell, 2015: Understanding Uncertainties in Future Projections of Seasonal Tropical Precipitation. Journal of Climate, 28(11), 4390–4413, doi: 10.1175/jcli-d-14-00613.1.
Keune, J. and D.G. Miralles, 2019: A Precipitation Recycling Network to Assess Freshwater Vulnerability: Challenging the Watershed Convention. Water Resources Research, 55(11), 9947–9961, doi: 10.1029/2019wr025310.
Kidston, J. et al., 2015: Stratospheric influence on tropospheric jet streams, storm tracks and surface weather. Nature Geoscience, 8(6), 433–440, doi: 10.1038/ngeo2424.
Kiem, A.S. et al., 2020: Learning from the past – Using palaeoclimate data to better understand and manage drought in South East Queensland (SEQ), Australia. Journal of Hydrology: Regional Studies, 29, 100686, doi: 10.1016/j.ejrh.2020.100686.
Kim, D. and E.D. Maloney, 2017: Simulation of the Madden–Julian Oscillation Using General Circulation Models. In: The Global Monsoon System: Research and Forecast (3rd Edition)[Chang, C.-P., H.-C. Kuo, N.-C. Lau, R.H. Johnson, B. Wang, and M.C. Wheeler (eds.)]. World Scientific, Singapore, pp. 119–130, doi: 10.1142/9789813200913_0009.
King, A.D., 2019: The drivers of nonlinear local temperature change under global warming. Environmental Research Letters, 14(6), 64005, doi: 10.1088/1748-9326/ab1976.
King, A.D., A.H. Butler, M. Jucker, N.O. Earl, and I. Rudeva, 2019: Observed Relationships Between Sudden Stratospheric Warmings and European Climate Extremes. Journal of Geophysical Research: Atmospheres, 124(24), 13943–13961, doi: 10.1029/2019jd030480.
Kingston, D.G. and J. McMecking, 2015: Precipitation delivery trajectories associated with extreme river flow for the Waitaki River, New Zealand. Proceedings of the International Association of Hydrological Sciences, 369, 19–24, doi: 10.5194/piahs-369-19-2015.
Kitoh, A., 2017: The Asian Monsoon and its Future Change in Climate Models: A Review. Journal of the Meteorological Society of Japan. Series II, 95(1), 7–33, doi: 10.2151/jmsj.2017-002.
Kitoh, A. et al., 2013: Monsoons in a changing world: A regional perspective in a global context. Journal of Geophysical Research: Atmospheres, 118(8), 3053–3065, doi: 10.1002/jgrd.50258.
Klein, C. and C.M. Taylor, 2020: Dry soils can intensify mesoscale convective systems. Proceedings of the National Academy of Sciences, 117(35), 21132–21137, doi: 10.1073/pnas.2007998117.
Klingaman, N.P. and C.A. Demott, 2020: Mean State Biases and Interannual Variability Affect Perceived Sensitivities of the Madden–Julian Oscillation to Air–Sea Coupling. Journal of Advances in Modeling Earth Systems, 12(2), e2019MS001799, doi: 10.1029/2019ms001799.
Klutse, N.A.B. et al., 2018: Potential impact of 1.5°C and 2°C global warming on consecutive dry and wet days over West Africa. Environmental Research Letters, 13(5), 055013, doi: 10.1088/1748-9326/aab37b.
Knauer, J., C. Werner, and S. Zaehle, 2015: Evaluating stomatal models and their atmospheric drought response in a land surface scheme: A multibiome analysis. Journal of Geophysical Research: Biogeosciences, 120(10), 1894–1911, doi: 10.1002/2015jg003114.
Knauer, J. et al., 2017: The response of ecosystem water-use efficiency to rising atmospheric CO2 concentrations: sensitivity and large-scale biogeochemical implications. New Phytologist, 213(4), 1654–1666, doi: 10.1111/nph.14288.
Knutson, T.R. and F. Zeng, 2018: Model Assessment of Observed Precipitation Trends over Land Regions: Detectable Human Influences and Possible Low Bias in Model Trends. Journal of Climate, 31(12), 4617–4637, doi: 10.1175/jcli-d-17-0672.1.
Knutson, T.R. et al., 2019: Tropical Cyclones and Climate Change Assessment: Part I: Detection and Attribution. Bulletin of the American Meteorological Society, 100(10), 1987–2007, doi: 10.1175/bams-d-18-0189.1.
Knutson, T.R. et al., 2020: Tropical Cyclones and Climate Change Assessment: Part II: Projected Response to Anthropogenic Warming. Bulletin of the American Meteorological Society, 101(3), E303–E322, doi: 10.1175/bams-d-18-0194.1.
Kociuba, G. and S.B. Power, 2015: Inability of CMIP5 Models to Simulate Recent Strengthening of the Walker Circulation: Implications for Projections. Journal of Climate, 28(1), 20–35, doi: 10.1175/jcli-d-13-00752.1.
Kodama, C., B. Stevens, T. Mauritsen, T. Seiki, and M. Satoh, 2019: A New Perspective for Future Precipitation Change from Intense Extratropical Cyclones. Geophysical Research Letters, 46(21), 12435–12444, doi: 10.1029/2019gl084001.
Kohyama, T., D.L. Hartmann, and D.S. Battisti, 2017: La Niña–like Mean-State Response to Global Warming and Potential Oceanic Roles. Journal of Climate, 30(11), 4207–4225, doi: 10.1175/jcli-d-16-0441.1.
Kok, J.F., D.S. Ward, N.M. Mahowald, and A.T. Evan, 2018: Global and regional importance of the direct dust–climate feedback. Nature Communications, 9(1), 241, doi: 10.1038/s41467-017-02620-y.
Kolusu, S.R. et al., 2019: The El Niño event of 2015–2016: climate anomalies and their impact on groundwater resources in East and Southern Africa. Hydrology and Earth System Sciences, 23(3), 1751–1762, doi: 10.5194/hess-23-1751-2019.
Konapala, G., A. Mishra, and L.R. Leung, 2017: Changes in temporal variability of precipitation over land due to anthropogenic forcings. Environmental Research Letters, 12(2), 024009, doi: 10.1088/1748-9326/aa568a.
Konapala, G., A.K. Mishra, Y. Wada, and M.E. Mann, 2020: Climate change will affect global water availability through compounding changes in seasonal precipitation and evaporation. Nature Communications, 11(1), 3044, doi: 10.1038/s41467-020-16757-w.
Konikow, L.F., 2011: Contribution of global groundwater depletion since 1900 to sea-level rise. Geophysical Research Letters, 38(17), L17401, doi: 10.1029/2011gl048604.
Konikow, L.F. and E. Kendy, 2005: Groundwater depletion: A global problem. Hydrogeology Journal, 13(1), 317–320, doi: 10.1007/s10040-004-0411-8.
Konwar, M. et al., 2012: Aerosol control on depth of warm rain in convective clouds. Journal of Geophysical Research: Atmospheres, 117(D13), D13204, doi: 10.1029/2012JD017585.
Kooperman, G.J. et al., 2018: Forest response to rising CO2 drives zonally asymmetric rainfall change over tropical land. Nature Climate Change, 8(5), 434–440, doi: 10.1038/s41558-018-0144-7.
Koren, I., G. Dagan, and O. Altaratz, 2014: From aerosol-limited to invigoration of warm convective clouds. Science, 344(6188), 1143–1146, doi: 10.1126/science.1252595.
Kornhuber, K., V. Petoukhov, S. Petri, S. Rahmstorf, and D. Coumou, 2017: Evidence for wave resonance as a key mechanism for generating high-amplitude quasi-stationary waves in boreal summer. Climate Dynamics, 49(5–6), 1961–1979, doi: 10.1007/s00382-016-3399-6.
Kornhuber, K. et al., 2019: Extreme weather events in early summer 2018 connected by a recurrent hemispheric wave-7 pattern. Environmental Research Letters, 14(5), 054002, doi: 10.1088/1748-9326/ab13bf .
Korolev, A. et al., 2020: A new look at the environmental conditions favorable to secondary ice production. Atmospheric Chemistry and Physics, 20(3), 1391–1429, doi: 10.5194/acp-20-1391-2020.
Kossin, J.P., 2018: A global slowdown of tropical-cyclone translation speed. Nature, 558(7708), 104–107, doi: 10.1038/s41586-018-0158-3.
Kossin, J.P., K.A. Emanuel, and G.A. Vecchi, 2014: The poleward migration of the location of tropical cyclone maximum intensity. Nature, 509(7500), 349–352, doi: 10.1038/nature13278.
Kotchoni, D.O.V. et al., 2019: Relationships between rainfall and groundwater recharge in seasonally humid Benin: a comparative analysis of long-term hydrographs in sedimentary and crystalline aquifers. Hydrogeology Journal, 27(2), 447–457, doi: 10.1007/s10040-018-1806-2.
Kraaijenbrink, P.D.A., M.F.P. Bierkens, A.F. Lutz, and W.W. Immerzeel, 2017: Impact of a global temperature rise of 1.5 degrees Celsius on Asia’s glaciers. Nature, 549(7671), 257–260, doi: 10.1038/nature23878.
Kravtsov, S., 2017: Pronounced differences between observed and CMIP5-simulated multidecadal climate variability in the twentieth century. Geophysical Research Letters, 44(11), 5749–5757, doi: 10.1002/2017gl074016.
Krishnan, R. et al., 2013: Will the South Asian monsoon overturning circulation stabilize any further?Climate Dynamics, 40(1–2), 187–211, doi: 10.1007/s00382-012-1317-0.
Krishnan, R. et al., 2016: Deciphering the desiccation trend of the South Asian monsoon hydroclimate in a warming world. Climate Dynamics, 47(3–4), 1007–1027, doi: 10.1007/s00382-015-2886-5.
Krishnan, R. et al., 2019: Non-monsoonal precipitation response over the Western Himalayas to climate change. Climate Dynamics, 52(7–8), 4091–4109, doi: 10.1007/s00382-018-4357-2.
Kristjánsson, J.E., H. Muri, and H. Schmidt, 2015: The hydrological cycle response to cirrus cloud thinning. Geophysical Research Letters, 42(24), 10807–10815, doi: 10.1002/2015gl066795.
Krueger, O., F. Feser, and R. Weisse, 2019: Northeast Atlantic storm activity and its uncertainty from the late nineteenth to the twenty-first century. Journal of Climate, 32(6), 1919–1931, doi: 10.1175/jcli-d-18-0505.1.
Krueger, O., F. Schenk, F. Feser, and R. Weisse, 2013: Inconsistencies between long-term trends in storminess derived from the 20CR reanalysis and observations. Journal of Climate, 26(3), 868–874, doi: 10.1175/jcli-d-12-00309.1.
Krysanova, V. et al., 2018: How the performance of hydrological models relates to credibility of projections under climate change. Hydrological Sciences Journal, 63(5), 696–720, doi: 10.1080/02626667.2018.1446214.
Kulkarni, A. et al., 2020: Precipitation Changes in India. In: Assessment of Climate Change over the Indian Region: A Report of the Ministry of Earth Sciences (MoES), Government of India[Krishnan, R., J. Sanjay, C. Gnanaseelan, M. Mujumdar, A. Kulkarni, and S. Chakraborty (eds.)]. Springer Singapore, Singapore, pp. 47–72, doi: 10.1007/978-981-15-4327-2_3.
Kumar, D. and A.R. Ganguly, 2018: Intercomparison of model response and internal variability across climate model ensembles. Climate Dynamics, 51(1–2), 207–219, doi: 10.1007/s00382-017-3914-4.
Kumar, S., V. Merwade, J.L. Kinter, and D. Niyogi, 2013: Evaluation of Temperature and Precipitation Trends and Long-Term Persistence in CMIP5 Twentieth-Century Climate Simulations. Journal of Climate, 26(12), 4168–4185, doi: 10.1175/jcli-d-12-00259.1.
Kumar, S., M. Newman, Y. Wang, and B. Livneh, 2019: Potential reemergence of seasonal soil moisture anomalies in North America. Journal of Climate, 32(10), 2707–2734, doi: 10.1175/jcli-d-18-0540.1.
Kumar, S., R.P. Allan, F. Zwiers, D.M. Lawrence, and P.A. Dirmeyer, 2015: Revisiting trends in wetness and dryness in the presence of internal climate variability and water limitations over land. Geophysical Research Letters, 42(24), 10867–10875, doi: 10.1002/2015gl066858.
Kumar, S. et al., 2016: Terrestrial contribution to the heterogeneity in hydrological changes under global warming. Water Resources Research, 52(4), 3127–3142, doi: 10.1002/2016wr018607.
Kunkel, K.E. et al., 2010: Recent increases in U.S. heavy precipitation associated with tropical cyclones. Geophysical Research Letters, 37(24), L24706, doi: 10.1029/2010gl045164.
Kunkel, K.E. et al., 2012: Meteorological causes of the secular variations in observed extreme precipitation events for the conterminous United States. Journal of Hydrometeorology, 13, 1131–1141, doi: 10.1175/jhm-d-11-0108.1.
Kunkel, K.E. et al., 2016: Trends and Extremes in Northern Hemisphere Snow Characteristics. Current Climate Change Reports, 2(2), 65–73, doi: 10.1007/s40641-016-0036-8.
Kushnir, Y., C. Cassou, and S. St George, 2017: Editorial: Decadal Climate Variability. Past Global Changes Magazine, 25(1), 1, doi: 10.22498/pages.25.1.1.
Kuss, A.J.M. and J.J. Gurdak, 2014: Groundwater level response in U.S. principal aquifers to ENSO, NAO, PDO, and AMO. Journal of Hydrology, 519, 1939–1952, doi: 10.1016/j.jhydrol.2014.09.069.
Kusunoki, S., 2018: Is the global atmospheric model MRI-AGCM3.2 better than the CMIP5 atmospheric models in simulating precipitation over East Asia?Climate Dynamics, 51(11–12), 4489–4510, doi: 10.1007/s00382-016-3335-9.
Kusunoki, S., T. Ose, and M. Hosaka, 2020: Emergence of unprecedented climate change in projected future precipitation. Scientific Reports, 10(1), 4802, doi: 10.1038/s41598-020-61792-8.
Kutzbach, J.E., 1981: Monsoon climate of the early Holocene: climate experiment with the Earth’s orbital parameters for 9000 years ago. Science, 214(4516), 59–61, www.jstor.org/stable/1687258.
L’Heureux, M.L. et al., 2013: Recent multidecadal strengthening of the Walker circulation across the tropical Pacific. Nature Climate Change, 3(6), 571–576, doi: 10.1038/nclimate1840.
Lachniet, M.S., Y. Asmerom, J.P. Bernal, V.J. Polyak, and L. Vazquez-Selem, 2013: Orbital pacing and ocean circulation-induced collapses of the Mesoamerican monsoon over the past 22,000 y. Proceedings of the National Academy of Sciences, 110(23), 9255–9260, doi: 10.1073/pnas.1222804110.
Lafore, J.-P. et al., 2017: A multi-scale analysis of the extreme rain event of Ouagadougou in 2009. Quarterly Journal of the Royal Meteorological Society, 143(709), 3094–3109, doi: 10.1002/qj.3165.
Laîné, A., H. Nakamura, K. Nishii, and T. Miyasaka, 2014: A diagnostic study of future evaporation changes projected in CMIP5 climate models. Climate Dynamics, 42(9–10), 2745–2761, doi: 10.1007/s00382-014-2087-7.
Lambert, F.H., A.J. Ferraro, and R. Chadwick, 2017: Land–ocean shifts in tropical precipitation linked to surface temperature and humidity change. Journal of Climate, 30(12), 4527–4545, doi: 10.1175/jcli-d-16-0649.1.
Lambert, F.H. et al., 2013: Interactions between perturbations to different Earth system components simulated by a fully-coupled climate model. Climate Dynamics, 41(11), 3055–3072, doi: 10.1007/s00382-012-1618-3.
Lamontagne-Hallé, P., J.M. McKenzie, B.L. Kurylyk, and S.C. Zipper, 2018: Changing groundwater discharge dynamics in permafrost regions. Environmental Research Letters, 13(8), 84017, doi: 10.1088/1748-9326/aad404.
Lan, C.-W., M.-H. Lo, C.-A. Chen, and J.-Y. Yu, 2019: The mechanisms behind changes in the seasonality of global precipitation found in reanalysis products and CMIP5 simulations. Climate Dynamics, 53(7–8), 4173–4187, doi: 10.1007/s00382-019-04781-6.
Lanzante, J.R., 2019: Uncertainties in tropical-cyclone translation speed. Nature, 570(7759), E6–E15, doi: 10.1038/s41586-019-1223-2.
Lau, W.K.-M. and K.-M. Kim, 2006: Observational relationships between aerosol and Asian monsoon rainfall, and circulation. Geophysical Research Letters, 33(21), L21810, doi: 10.1029/2006gl027546.
Lau, W.K.-M. and Y.P. Zhou, 2012: Observed recent trends in tropical cyclone rainfall over the North Atlantic and the North Pacific. Journal of Geophysical Research: Atmospheres, 117(D3), D03104, doi: 10.1029/2011jd016510.
Lau, W.K.-M. and K.-M. Kim, 2015: Robust Hadley Circulation changes and increasing global dryness due to CO2 warming from CMIP5 model projections. Proceedings of the National Academy of Sciences, 112(12), 3630–3635, doi: 10.1073/pnas.1418682112.
Lau, W.K.-M. and K.-M. Kim, 2017: Competing influences of greenhouse warming and aerosols on Asian summer monsoon circulation and rainfall. Asia-Pacific Journal of Atmospheric Sciences, 53(2), 181–194, doi: 10.1007/s13143-017-0033-4.
Lau, W.K.-M. and W. Tao, 2020: Precipitation–Radiation–Circulation Feedback Processes Associated with Structural Changes of the ITCZ in a Warming Climate during 1980–2014: An Observational Portrayal. Journal of Climate, 33(20), 8737–8749, doi: 10.1175/jcli-d-20-0068.1.
Lavado, W.S., D. Labat, J. Ronchail, J.C. Espinoza, and J.L. Guyot, 2013: Trends in rainfall and temperature in the Peruvian Amazon–Andes basin over the last 40 years (1965–2007). Hydrological Processes, 27(20), 2944–2957, doi: 10.1002/hyp.9418.
Lavers, D.A., F.M. Ralph, D.E. Waliser, A. Gershunov, and M.D. Dettinger, 2015: Climate change intensification of horizontal water vapor transport in CMIP5. Geophysical Research Letters, 42(13), 5617–5625, doi: 10.1002/2015gl064672.
Lavers, D.A. et al., 2013: Future changes in atmospheric rivers and their implications for winter flooding in Britain. Environmental Research Letters, 8(3), 034010, doi: 10.1088/1748-9326/8/3/034010.
Lawrence, D. and K. Vandecar, 2015: Effects of tropical deforestation on climate and agriculture. Nature Climate Change, 5(1), 27–36, doi: 10.1038/nclimate2430.
Lazenby, M.J., M.C. Todd, R. Chadwick, and Y. Wang, 2018: Future Precipitation Projections over Central and Southern Africa and the Adjacent Indian Ocean: What Causes the Changes and the Uncertainty?Journal of Climate, 31(12), 4807–4826, doi: 10.1175/jcli-d-17-0311.1.
Le Barbé, L. and T. Lebel, 1997: Rainfall climatology of the HAPEX-Sahel region during the years 1950–1990. Journal of Hydrology, 188–189, 43–73, doi: 10.1016/s0022-1694(96)03154-x.
Le Barbé, L., T. Lebel, and D. Tapsoba, 2002: Rainfall Variability in West Africa during the Years 1950–90. Journal of Climate, 15(2), 187–202, doi: 10.1175/1520-0442(2002)015<0187:rviwad>2.0.co;2.
Lebel, T., A. Diedhiou, and H. Laurent, 2003: Seasonal cycle and interannual variability of the Sahelian rainfall at hydrological scales. Journal of Geophysical Research: Atmospheres, 108(D8), 8389, doi: 10.1029/2001jd001580.
Ledru, M.-P. et al., 2013: The Medieval Climate Anomaly and the Little Ice Age in the eastern Ecuadorian Andes. Climate of the Past, 9(1), 307–321, doi: 10.5194/cp-9-307-2013.
Lee, D. et al., 2018: Impacts of half a degree additional warming on the Asian summer monsoon rainfall characteristics. Environmental Research Letters, 13(4), 044033, doi: 10.1088/1748-9326/aab55d.
Lee, J.A. and T.E. Gill, 2015: Multiple causes of wind erosion in the Dust Bowl. Aeolian Research, 19, 15–36, doi: 10.1016/j.aeolia.2015.09.002.
Lee, J.-Y. et al., 2013: Real-time multivariate indices for the boreal summer intraseasonal oscillation over the Asian summer monsoon region. Climate Dynamics, 40(1–2), 493–509, doi: 10.1007/s00382-012-1544-4.
Lee, S.S., J. Guo, and Z. Li, 2016: Delaying precipitation by air pollution over the Pearl River Delta: 2. Model simulations. Journal of Geophysical Research: Atmospheres, 121(19), 11739–11760, doi: 10.1002/2015jd024362.
Lee, S.S. et al., 2018: Aerosol as a potential factor to control the increasing torrential rain events in urban areas over the last decades. Atmospheric Chemistry and Physics, 18(16), 12531–12550, doi: 10.5194/acp-18-12531-2018.
Lee, S.-Y. et al., 2015: Projecting the Hydrologic Impacts of Climate Change on Montane Wetlands. PLOS ONE, 10(9), e0136385, doi: 10.1371/journal.pone.0136385.
Lee, Y.-Y. and R.X. Black, 2013: Boreal winter low-frequency variability in CMIP5 models. Journal of Geophysical Research: Atmospheres, 118(13), 6891–6904, doi: 10.1002/jgrd.50493.
Lehner, F., C. Deser, I.R. Simpson, and L. Terray, 2018: Attributing the U.S. Southwest’s Recent Shift Into Drier Conditions. Geophysical Research Letters, 45(12), 6251–6261, doi: 10.1029/2018gl078312.
Lehner, F. et al., 2017: Projected drought risk in 1.5°C and 2°C warmer climates. Geophysical Research Letters, 44(14), 7419–7428, doi: 10.1002/2017gl074117.
Lehner, F. et al., 2019: The potential to reduce uncertainty in regional runoff projections from climate models. Nature Climate Change, 9(12), 926–933, doi: 10.1038/s41558-019-0639-x.
Lehner, F. et al., 2020: Partitioning climate projection uncertainty with multiple Large Ensembles and CMIP5/6. Earth System Dynamics, 11(2), 1–28, doi: 10.5194/esd-11-491-2020.
Lei, Y. et al., 2017: Lake seasonality across the Tibetan Plateau and their varying relationship with regional mass changes and local hydrology. Geophysical Research Letters, 44(2), 892–900, doi: 10.1002/2016gl072062.
Leite-Filho, A.T., V.Y. Sousa Pontes, and M.H. Costa, 2019: Effects of Deforestation on the Onset of the Rainy Season and the Duration of Dry Spells in Southern Amazonia. Journal of Geophysical Research: Atmospheres, 124(10), 5268–5281, doi: 10.1029/2018jd029537.
Lejeune, Q., E.L. Davin, B.P. Guillod, and S.I. Seneviratne, 2015: Influence of Amazonian deforestation on the future evolution of regional surface fluxes, circulation, surface temperature and precipitation. Climate Dynamics, 44(9–10), 2769–2786, doi: 10.1007/s00382-014-2203-8.
Lemieux, J.-M. et al., 2020: Groundwater dynamics within a watershed in the discontinuous permafrost zone near Umiujaq (Nunavik, Canada). Hydrogeology Journal, 28(3), 833–851, doi: 10.1007/s10040-020-02110-4.
Lemordant, L., P. Gentine, A.S. Swann, B.I. Cook, and J. Scheff, 2018: Critical impact of vegetation physiology on the continental hydrologic cycle in response to increasing CO2. Proceedings of the National Academy of Sciences, 115(16), 4093–4098, doi: 10.1073/pnas.1720712115.
Lenderink, G., R. Barbero, J.M. Loriaux, and H.J. Fowler, 2017: Super-Clausius–Clapeyron scaling of extreme hourly convective precipitation and its relation to large-scale atmospheric conditions. Journal of Climate, 30(15), 6037–6052, doi: 10.1175/jcli-d-16-0808.1.
Lenderink, G. et al., 2019: Systematic increases in the thermodynamic response of hourly precipitation extremes in an idealized warming experiment with a convection-permitting climate model. Environmental Research Letters, 14(7), 074012, doi: 10.1088/1748-9326/ab214a.
Leng, G., M. Huang, Q. Tang, and L.R. Leung, 2015: A modeling study of irrigation effects on global surface water and groundwater resources under a changing climate. Journal of Advances in Modeling Earth Systems, 7(3), 1285–1304, doi: 10.1002/2015ms000437.
Leng, G., M. Huang, Q. Tang, H. Gao, and L. Leung, 2014: Modeling the Effects of Groundwater-Fed Irrigation on Terrestrial Hydrology over the Conterminous United States. Journal of Hydrometeorology, 15(957), 13–49, doi: 10.1175/jhm-d-13-049.1.
Lenggenhager, S., M. Croci-Maspoli, S. Brönnimann, and O. Martius, 2019: On the dynamical coupling between atmospheric blocks and heavy precipitation events: A discussion of the southern Alpine flood in October 2000. Quarterly Journal of the Royal Meteorological Society, 145(719), 530–545, doi: 10.1002/qj.3449.
Lenton, T.M. et al., 2008: Tipping elements in the Earth’s climate system. Proceedings of the National Academy of Sciences, 105(6), 1786–1793, doi: 10.1073/pnas.0705414105.
Leutwyler, D., D. Lüthi, N. Ban, O. Fuhrer, and C. Schär, 2017: Evaluation of the convection-resolving climate modeling approach on continental scales. Journal of Geophysical Research: Atmospheres, 122(10), 5237–5258, doi: 10.1002/2016jd026013.
Levang, S.J. and R.W. Schmitt, 2015: Centennial changes of the global water cycle in CMIP5 models. Journal of Climate, 28(16), 6489–6502, doi: 10.1175/jcli-d-15-0143.1.
Levine, N.M. et al., 2016: Ecosystem heterogeneity determines the ecological resilience of the Amazon to climate change. Proceedings of the National Academy of Sciences, 113(3), 793–797, doi: 10.1073/pnas.1511344112.
Levy, A.A.L. et al., 2013: Can correcting feature location in simulated mean climate improve agreement on projected changes?Geophysical Research Letters, 40(2), 354–358, doi: 10.1029/2012gl053964.
Levy, M.C., A. Lopes, A. Cohn, L.G. Larsen, and S.E. Thompson, 2018: Land Use Change Increases Streamflow Across the Arc of Deforestation in Brazil. Geophysical Research Letters, 45(8), 3520–3530, doi: 10.1002/2017gl076526.
Li, C. et al., 2017: Evaluation of the Common Land Model (CoLM) from the perspective of water and energy budget simulation: Towards inclusion in CMIP6. Atmosphere, 8(8), 141, doi: 10.3390/atmos8080141.
Li, D., T. Zhou, and W. Zhang, 2019: Extreme precipitation over East Asia under 1.5°C and 2°C global warming targets: a comparison of stabilized and overshoot projections. Environmental Research Communications, 1(8), 085002, doi: 10.1088/2515-7620/ab3971.
Li, F., S. Levis, and D.S. Ward, 2013: Quantifying the role of fire in the Earth system – Part 1: Improved global fire modeling in the Community Earth System Model (CESM1). Biogeosciences, 10, 2293–2314, doi: 10.5194/bg-10-2293-2013.
Li, G., S.P. Xie, C. He, and Z. Chen, 2017: Western Pacific emergent constraint lowers projected increase in Indian summer monsoon rainfall. Nature Climate Change, 7(10), 708–712, doi: 10.1038/nclimate3387.
Li, G., S.P. Harrison, P.J. Bartlein, K. Izumi, and I. Colin Prentice, 2013: Precipitation scaling with temperature in warm and cold climates: An analysis of CMIP5 simulations. Geophysical Research Letters, 40(15), 4018–4024, doi: 10.1002/grl.50730.
Li, J., J. Feng, and Y. Li, 2012: A possible cause of decreasing summer rainfall in northeast Australia. International Journal of Climatology, 32, 995–1005, doi: 10.1002/joc.2328.
Li, J. et al., 2018: Parameter optimization for carbon and water fluxes in two global land surface models based on surrogate modelling. International Journal of Climatology, 38, e1016–e1031, doi: 10.1002/joc.5428.
Li, L. and P. Chakraborty, 2020: Slower decay of landfalling hurricanes in a warming world. Nature, 587(7833), 230–234, doi: 10.1038/s41586-020-2867-7.
Li, M., T. Woollings, K. Hodges, and G. Masato, 2014: Extratropical cyclones in a warmer, moister climate: A recent Atlantic analogue. Geophysical Research Letters, 41(23), 8594–8601, doi: 10.1002/2014gl062186.
Li, N. and G.R. McGregor, 2017: Linking interannual river flow river variability across New Zealand to the Southern Annular Mode, 1979-2011. Hydrological Processes, 31(12), 2261–2276, doi: 10.1002/hyp.11184.
Li, W., L. Li, M. Ting, and Y. Liu, 2012: Intensification of Northern Hemisphere subtropical highs in a warming climate. Nature Geoscience, 5(11), 830–834, doi: 10.1038/ngeo1590.
Li, W., L. Li, R. Fu, Y. Deng, and H. Wang, 2011: Changes to the North Atlantic Subtropical High and Its Role in the Intensification of Summer Rainfall Variability in the Southeastern United States. Journal of Climate, 24(5), 1499–1506, doi: 10.1175/2010jcli3829.1.
Li, X. and M. Ting, 2015: Recent and future changes in the Asian monsoon-ENSO relationship: Natural or forced?Geophysical Research Letters, 42(9), 3502–3512, doi: 10.1002/2015gl063557.
Li, X., M. Ting, and D.E. Lee, 2018: Fast Adjustments of the Asian Summer Monsoon to Anthropogenic Aerosols. Geophysical Research Letters, 45(2), 1001–1010, doi: 10.1002/2017gl076667.
Li, X. et al., 2016: Trend and seasonality of land precipitation in observations and CMIP5 model simulations. International Journal of Climatology, 3793, 3781–3793, doi: 10.1002/joc.4592.
Li, Y., Y. Ding, and W. Li, 2017: Interdecadal variability of the Afro-Asian summer monsoon system. Advances in Atmospheric Sciences, 34(7), 833–846, doi: 10.1007/s00376-017-6247-7.
Li, Y., Q. Zhang, H. Tao, and J. Yao, 2021: Integrated model projections of climate change impacts on water-level dynamics in the large Poyang Lake (China). Hydrology Research, 52(1), 43–60, doi: 10.2166/nh.2019.064.
Li, Y., H. Tao, B. Su, Z.W. Kundzewicz, and T. Jiang, 2019: Impacts of 1.5°C and 2°C global warming on winter snow depth in Central Asia. Science of The Total Environment, 651, 2866–2873, doi: 10.1016/j.scitotenv.2018.10.126.
Li, Y. et al., 2018: Climate Model Shows Large-Scale Wind and Solar Farms in the Sahara Increase Rain and Vegetation. Science, 361(6406), 1019–1022, doi: 10.1126/science.aar5629.
Li, Z., Y. Chen, Y. Wang, and G. Fang, 2016a: Dynamic changes in terrestrial net primary production and their effects on evapotranspiration. Hydrology and Earth System Sciences, 20(6), 2169–2178, doi: 10.5194/hess-20-2169-2016.
Li, Z., Y. Chen, G. Fang, and Y. Li, 2017: Multivariate assessment and attribution of droughts in Central Asia. Scientific Reports, 7(1), 1316, doi: 10.1038/s41598-017-01473-1.
Li, Z. et al., 2016b: Aerosol and monsoon climate interactions over Asia. Reviews of Geophysics, 54(4), 866–929, doi: 10.1002/2015rg000500.
Lian, X. et al., 2018: Partitioning global land evapotranspiration using CMIP5 models constrained by observations. Nature Climate Change, 8(7), 640–646, doi: 10.1038/s41558-018-0207-9.
Liang, Y.C. et al., 2020: Amplified seasonal cycle in hydroclimate over the Amazon river basin and its plume region. Nature Communications, 11(1), 4390, doi: 10.1038/s41467-020-18187-0.
Liebmann, B. et al., 2014: Understanding Recent Eastern Horn of Africa Rainfall Variability and Change. Journal of Climate, 27, 8630–8645, doi: 10.1175/jcli-d-13-00714.1.
Lim, E.-P. et al., 2016: The impact of the Southern Annular Mode on future changes in Southern Hemisphere rainfall. Geophysical Research Letters, 43(13), 7160–7167, doi: 10.1002/2016gl069453.
Lin, L., Z. Wang, Y. Xu, Q. Fu, and W. Dong, 2018: Larger Sensitivity of Precipitation Extremes to Aerosol Than Greenhouse Gas Forcing in CMIP5 Models. Journal of Geophysical Research: Atmospheres, 123(15), 8062–8073, doi: 10.1029/2018jd028821.
Lin, R., T. Zhou, and Y. Qian, 2014: Evaluation of global monsoon precipitation changes based on five reanalysis datasets. Journal of Climate, 27(3), 1271–1289, doi: 10.1175/jcli-d-13-00215.1.
Linsbauer, A. et al., 2016: Modelling glacier-bed overdeepenings and possible future lakes for the glaciers in the Himalaya–Karakoram region. Annals of Glaciology, 57(71), 119–130, doi: 10.3189/2016aog71a627.
Little, K., D.G. Kingston, N.J. Cullen, and P.B. Gibson, 2019: The Role of Atmospheric Rivers for Extreme Ablation and Snowfall Events in the Southern Alps of New Zealand. Geophysical Research Letters, 46(5), 2761–2771, doi: 10.1029/2018gl081669.
Liu, C. and R.P. Allan, 2013: Observed and simulated precipitation responses in wet and dry regions 1850–2100. Environmental Research Letters, 8(3), 034002, doi: 10.1088/1748-9326/8/3/034002.
Liu, C. et al., 2017: Continental-scale convection-permitting modeling of the current and future climate of North America. Climate Dynamics, 49(1–2), 71–95, doi: 10.1007/s00382-016-3327-9.
Liu, F., T. Zhao, B. Wang, J. Liu, and W. Luo, 2018: Different Global Precipitation Responses to Solar, Volcanic, and Greenhouse Gas Forcings. Journal of Geophysical Research: Atmospheres, 123(8), 4060–4072, doi: 10.1029/2017jd027391.
Liu, F. et al., 2016: Global monsoon precipitation responses to large volcanic eruptions. Scientific Reports, 6(1), 24331, doi: 10.1038/srep24331.
Liu, H. et al., 2019: Non-Monotonic Aerosol Effect on Precipitation in Convective Clouds over Tropical Oceans. Scientific Reports, 9(1), 7809, doi: 10.1038/s41598-019-44284-2.
Liu, J., H. Xu, and J. Deng, 2018: Projections of East Asian summer monsoon change at global warming of 1.5 and 2°C. Earth System Dynamics, 9(2), 427–439, doi: 10.5194/esd-9-427-2018.
Liu, J., J.A. Curry, H. Wang, M. Song, and R.M. Horton, 2012: Impact of declining Arctic sea ice on winter snowfall. Proceedings of the National Academy of Sciences, 109(11), 4074–4079, doi: 10.1073/pnas.1114910109.
Liu, L. et al., 2018: A PDRMIP Multimodel study on the impacts of regional aerosol forcings on global and regional precipitation. Journal of Climate, 31(11), 4429–4447, doi: 10.1175/jcli-d-17-0439.1.
Liu, M., G.A. Vecchi, J.A. Smith, and T.R. Knutson, 2019: Causes of large projected increases in hurricane precipitation rates with global warming. npj Climate and Atmospheric Science, 2(1), 38, doi: 10.1038/s41612-019-0095-3.
Liu, N. et al., 2020: Drought can offset potential water use efficiency of forest ecosystems from rising atmospheric CO2. Journal of Environmental Sciences, 90, 262–274, doi: 10.1016/j.jes.2019.11.020.
Liu, T. et al., 2018: Influence of the May Southern annular mode on the South China Sea summer monsoon. Climate Dynamics, 51(11–12), 4095–4107, doi: 10.1007/s00382-017-3753-3.
Liu, W., S.-P. Xie, Z. Liu, and J. Zhu, 2017: Overlooked possibility of a collapsed Atlantic Meridional Overturning Circulation in warming climate. Science Advances, 3(1), e1601666, doi: 10.1126/sciadv.1601666.
Liu, X., C. Li, T. Zhao, and L. Han, 2020: Future changes of global potential evapotranspiration simulated from CMIP5 to CMIP6 models. Atmospheric and Oceanic Science Letters, 13(6), 568–575, doi: 10.1080/16742834.2020.1824983.
Liu, Y., Y. Liu, and W. Wang, 2019a: Inter-comparison of satellite-retrieved and Global Land Data Assimilation System-simulated soil moisture datasets for global drought analysis. Remote Sensing of Environment, 220, 1–18, doi: 10.1016/j.rse.2018.10.026.
Liu, Y., M. Kumar, G.G. Katul, X. Feng, and A.G. Konings, 2020: Plant hydraulics accentuates the effect of atmospheric moisture stress on transpiration. Nature Climate Change, 10(7), 691–695, doi: 10.1038/s41558-020-0781-5.
Liu, Y. et al., 2019b: Anthropogenic Aerosols Cause Recent Pronounced Weakening of Asian Summer Monsoon Relative to Last Four Centuries. Geophysical Research Letters, 46(10), 5469–5479, doi: 10.1029/ 2019gl082497.
Liu, Z. et al., 2009: Transient Simulation of Last Deglaciation with a New Mechanism for Bølling-Allerød Warming. Science, 325(5938), 310–314, doi: 10.1126/science.1171041.
Llopart, M. et al., 2018: Land Use Change over the Amazon Forest and Its Impact on the Local Climate. Water, 10(2), 149, doi: 10.3390/ w10020149.
Loeb, N.G. et al., 2016: Observational constraints on atmospheric and oceanic cross-equatorial heat transports: revisiting the precipitation asymmetry problem in climate models. Climate Dynamics, 46(9–10), 3239–3257, doi: 10.1007/s00382-015-2766-z.
Lopez, A., E.B. Suckling, and L.A. Smith, 2014: Robustness of pattern scaled climate change scenarios for adaptation decision support. Climatic Change, 122(4), 555–566, doi: 10.1007/s10584-013-1022-y.
Lora, J.M., 2018: Components and mechanisms of hydrologic cycle changes over North America at the Last Glacial Maximum. Journal of Climate, 31(17), 7035–7051, doi: 10.1175/jcli-d-17-0544.1.
Loranty, M.M., L.T. Berner, S.J. Goetz, Y. Jin, and J.T. Randerson, 2014: Vegetation controls on northern high latitude snow-albedo feedback: Observations and CMIP5 model simulations. Global Change Biology, 20(2), 594–606, doi: 10.1111/gcb.12391.
Loriaux, J.M., G. Lenderink, and A.P. Siebesma, 2017: Large-scale controls on extreme precipitation. Journal of Climate, 30(3), 955–968, doi: 10.1175/jcli-d-16-0381.1.
Louf, V., C. Jakob, A. Protat, M. Bergemann, and S. Narsey, 2019: The Relationship of Cloud Number and Size With Their Large-Scale Environment in Deep Tropical Convection. Geophysical Research Letters, 46(15), 9203–9212, doi: 10.1029/2019gl083964.
Lowry, D.P. and C. Morrill, 2019: Is the Last Glacial Maximum a reverse analog for future hydroclimate changes in the Americas?Climate Dynamics, 52(7), 4407–4427, doi: 10.1007/s00382-018-4385-y.
Lu, J., G.A. Vecchi, and T. Reichler, 2007: Expansion of the Hadley cell under global warming. Geophysical Research Letters, 34(6), L06805, doi: 10.1029/2006gl028443.
Lu, Q., D. Zhao, and S. Wu, 2017: Simulated responses of permafrost distribution to climate change on the Qinghai–Tibet Plateau. Scientific Reports, 7(1), 3845, doi: 10.1038/s41598-017-04140-7.
Lu, Z. et al., 2021: Impacts of Large-Scale Sahara Solar Farms on Global Climate and Vegetation Cover. Geophysical Research Letters, 48(2), e2020GL090789, doi: 10.1029/2020gl090789.
Luijendijk, E., T. Gleeson, and N. Moosdorf, 2020: Fresh groundwater discharge insignificant for the world’s oceans but important for coastal ecosystems. Nature Communications, 11(1), 1260, doi: 10.1038/s41467-020-15064-8.
Lund, M.T., G. Myhre, and B.H. Samset, 2019: Anthropogenic aerosol forcing under the Shared Socioeconomic Pathways. Atmospheric Chemistry and Physics, 19(22), 13827–13839, doi: 10.5194/acp-19-13827-2019.
Luo, D., W. Zhang, L. Zhong, and A. Dai, 2019: A nonlinear theory of atmospheric blocking: A potential vorticity gradient view. Journal of the Atmospheric Sciences, 76(8), 2399–2427, doi: 10.1175/jas-d-18-0324.1.
Luong, T.M. et al., 2017: The More Extreme Nature of North American Monsoon Precipitation in the Southwestern United States as Revealed by a Historical Climatology of Simulated Severe Weather Events. Journal of Applied Meteorology and Climatology, 56(9), 2509–2529, doi: 10.1175/jamc-d-16-0358.1.
Lutz, A.F., W.W. Immerzeel, A.B. Shrestha, and M.F.P. Bierkens, 2014: Consistent increase in High Asia’s runoff due to increasing glacier melt and precipitation. Nature Climate Change, 4(7), 587–592, doi: 10.1038/nclimate2237.
Lyon, B., 2014: Seasonal drought in the Greater Horn of Africa and its recent increase during the March–May long rains. Journal of Climate, 27(21), 7953–7975, doi: 10.1175/jcli-d-13-00459.1.
Lyon, B. and D.G. Dewitt, 2012: A recent and abrupt decline in the East African long rains. Geophysical Research Letters, 39, 1–5, doi: 10.1029/2011gl050337.
Ma, J., S.-P. Xie, and Y. Kosaka, 2012: Mechanisms for Tropical Tropospheric Circulation Change in Response to Global Warming. Journal of Climate, 25(8), 2979–2994, doi: 10.1175/jcli-d-11-00048.1.
Ma, J. et al., 2018: Responses of the Tropical Atmospheric Circulation to Climate Change and Connection to the Hydrological Cycle. Annual Review of Earth and Planetary Sciences, 46(1), 549–580, doi: 10.1146/annurev-earth-082517-010102.
Ma, S. et al., 2017: Detectable Anthropogenic Shift toward Heavy Precipitation over Eastern China. Journal of Climate, 30(4), 1381–1396, doi: 10.1175/jcli-d-16-0311.1.
MacDonald, A.M. et al., 2016: Groundwater quality and depletion in the Indo-Gangetic Basin mapped from in situ observations. Nature Geoscience, 9(10), 762–766, doi: 10.1038/ngeo2791.
MacIntosh, C.R. et al., 2016: Contrasting fast precipitation responses to tropospheric and stratospheric ozone forcing. Geophysical Research Letters, 43(3), 1263–1271, doi: 10.1002/2015gl067231.
Mackintosh, A.N. et al., 2017: Regional cooling caused recent New Zealand glacier advances in a period of global warming. Nature Communications, 8(1), 14202, doi: 10.1038/ncomms14202.
Madhura, R.K., R. Krishnan, J. Revadekar, M. Mujumdar, and B.N. Goswami, 2014: Changes in western disturbances over the Western Himalayas in a warming environment. Climate Dynamics, 44(3–4), 1157–1168, doi: 10.1007/s00382-014-2166-9.
Magnin, F., W. Haeberli, A. Linsbauer, P. Deline, and L. Ravanel, 2020: Estimating glacier-bed overdeepenings as possible sites of future lakes in the de-glaciating Mont Blanc massif (Western European Alps). Geomorphology, 350, 106913, doi: 10.1016/j.geomorph.2019.106913.
Mahajan, S., K.J. Evans, M.L. Branstetter, and Q. Tang, 2018: Model Resolution Sensitivity of the Simulation of North Atlantic Oscillation Teleconnections to Precipitation Extremes. Journal of Geophysical Research: Atmospheres, 123(20), 11392–11409, doi: 10.1029/2018jd028594.
Maher, N., D. Matei, S. Milinski, and J. Marotzke, 2018: ENSO Change in Climate Projections: Forced Response or Internal Variability?Geophysical Research Letters, 45(20), 11390–11398, doi: 10.1029/2018gl079764.
Maher, P., G.K. Vallis, S.C. Sherwood, M.J. Webb, and P.G. Sansom, 2018: The Impact of Parameterized Convection on Climatological Precipitation in Atmospheric Global Climate Models. Geophysical Research Letters, 45(8), 3728–3736, doi: 10.1002/2017gl076826.
Maidment, R.I., R.P. Allan, and E. Black, 2015: Recent observed and simulated changes in precipitation over Africa. Geophysical Research Letters, 42(19), 8155–8164, doi: 10.1002/2015gl065765.
Malavelle, F.F. et al., 2017: Strong constraints on aerosol–cloud interactions from volcanic eruptions. Nature, 546(7659), 485–491, doi: 10.1038/nature22974.
Malhi, Y. et al., 2008: Climate Change, Deforestation, and the Fate of the Amazon. Science, 319(5860), 169–172, doi: 10.1126/science.1146961.
Malhi, Y. et al., 2009: Exploring the likelihood and mechanism of a climate-change-induced dieback of the Amazon rainforest. Proceedings of the National Academy of Sciences, 106(49), 20610, doi: 10.1073/pnas.0804619106.
Mallakpour, I. and G. Villarini, 2017: Analysis of changes in the magnitude, frequency, and seasonality of heavy precipitation over the contiguous USA. Theoretical and Applied Climatology, 130(1–2), 345–363, doi: 10.1007/s00704-016-1881-z.
Maloney, E.D. and D.L. Hartmann, 2000: Modulation of Eastern North Pacific Hurricanes by the Madden–Julian Oscillation. Journal of Climate, 13(9), 1451–1460, doi: 10.1175/1520-0442(2000)013<1451:moenph>2.0.co;2.
Maloney, E.D. and S.-P. Xie, 2013: Sensitivity of tropical intraseasonal variability to the pattern of climate warming. Journal of Advances in Modeling Earth Systems, 5(1), 32–47, doi: 10.1029/2012ms000171.
Maloney, E.D., F. Adames, and H.X. Bui, 2019: Madden–Julian oscillation changes under anthropogenic warming. Nature Climate Change, 9(1), 26–33, doi: 10.1038/s41558-018-0331-6.
Maloney, E.D. et al., 2014: North American Climate in CMIP5 Experiments: Part III: Assessment of Twenty-First-Century Projections. Journal of Climate, 27(6), 2230–2270, doi: 10.1175/jcli-d-13-00273.1.
Mamalakis, A. et al., 2021: Zonally contrasting shifts of the tropical rain belt in response to climate change. Nature Climate Change, 11(2), 143–151, doi: 10.1038/s41558-020-00963-x.
Mankin, J.S., J.E. Smerdon, B.I. Cook, A.P. Williams, and R. Seager, 2017: The Curious Case of Projected Twenty-First-Century Drying but Greening in the American West. Journal of Climate, 30(21), 8689–8710, doi: 10.1175/jcli-d-17-0213.1.
Mankin, J.S., R. Seager, J.E. Smerdon, B.I. Cook, and A.P. Williams, 2019: Mid-latitude freshwater availability reduced by projected vegetation responses to climate change. Nature Geoscience, 12(12), 983–988, doi: 10.1038/s41561-019-0480-x.
Mankin, J.S. et al., 2018: Blue Water Trade-Offs With Vegetation in a CO2 -Enriched Climate. Geophysical Research Letters, 45(7), 3115–3125, doi: 10.1002/2018gl077051.
Mann, M.E. et al., 2017: Influence of Anthropogenic Climate Change on Planetary Wave Resonance and Extreme Weather Events. Scientific Reports, 7(1), 45242, doi: 10.1038/srep45242.
Marciano, C.G., G.M. Lackmann, and W.A. Robinson, 2015: Changes in U.S. East Coast cyclone dynamics with climate change. Journal of Climate, 28(2), 468–484, doi: 10.1175/jcli-d-14-00418.1.
Marengo, J.A., M.C. Valverde, and G.O. Obregon, 2013: Observed and projected changes in rainfall extremes in the Metropolitan Area of São Paulo. Climate Research, 57(1), 61–72, doi: 10.3354/cr01160.
Marengo, J.A. et al., 2014: Climate Change in Central and South America: Recent Trends, Future Projections, and Impacts on Regional Agriculture. CCAFS Working Paper no. 73, CGIAR Research Program on Climate Change, Agriculture and Food Security (CCAFS), Copenhagen, Denmark, 91 pp., https://hdl.handle.net/10568/41912.
Margulis, S.A., G. Cortés, M. Girotto, and M. Durand, 2016: A Landsat-Era Sierra Nevada Snow Reanalysis (1985–2015). Journal of Hydrometeorology, 17(4), 1203–1221, doi: 10.1175/jhm-d-15-0177.1.
Markonis, Y., M. Hanel, P. Máca, J. Kyselý, and E.R. Cook, 2018: Persistent multi-scale fluctuations shift European hydroclimate to its millennial boundaries. Nature Communications, 9(1), 1767, doi: 10.1038/s41467-018-04207-7.
Marlier, M.E. et al., 2017: The 2015 drought in Washington State: a harbinger of things to come?Environmental Research Letters, 12(11), 114008, doi: 10.1088/1748-9326/aa8fde.
Marshall, G.J. and T.J. Bracegirdle, 2015: An examination of the relationship between the Southern Annular Mode and Antarctic surface air temperatures in the CMIP5 historical runs. Climate Dynamics, 45(5–6), 1513–1535, doi: 10.1007/s00382-014-2406-z.
Marshall, G.J., D.W.J. Thompson, and M.R. van den Broeke, 2017: The Signature of Southern Hemisphere Atmospheric Circulation Patterns in Antarctic Precipitation. Geophysical Research Letters, 44(22), 11580–11589, doi: 10.1002/2017gl075998.
Martel, J.-L., A. Mailhot, F. Brissette, and D. Caya, 2018: Role of Natural Climate Variability in the Detection of Anthropogenic Climate Change Signal for Mean and Extreme Precipitation at Local and Regional Scales. Journal of Climate, 31(11), 4241–4263, doi: 10.1175/jcli-d-17-0282.1.
Martens, B., W. Waegeman, W.A. Dorigo, N.E.C. Verhoest, and D.G. Miralles, 2018: Terrestrial evaporation response to modes of climate variability. npj Climate and Atmospheric Science, 1(1), 43, doi: 10.1038/s41612-018-0053-5.
Martin, J.T. et al., 2020: Increased drought severity tracks warming in the United States’ largest river basin. Proceedings of the National Academy of Sciences, 117(21), 11328–11336, doi: 10.1073/pnas.1916208117.
Martín-Gómez, V. and M. Barreiro, 2016: Analysis of oceans’ influence on spring time rainfall variability over Southeastern South America during the 20th century. International Journal of Climatology, 36(3), 1344–1358, doi: 10.1002/joc.4428.
Martín-Gómez, V., E. Hernández-Garcia, M. Barreiro, and C. López, 2016: Interdecadal Variability of Southeastern South America Rainfall and Moisture Sources during the Austral Summertime. Journal of Climate, 29(18), 6751–6763, doi: 10.1175/jcli-d-15-0803.1.
Marty, C., A.-M. Tilg, and T. Jonas, 2017: Recent Evidence of Large-Scale Receding Snow Water Equivalents in the European Alps. Journal of Hydrometeorology, 18(4), 1021–1031, doi: 10.1175/jhm-d-16-0188.1.
Marvel, K. et al., 2017: Observed and Projected Changes to the Precipitation Annual Cycle. Journal of Climate, 30(13), 4983–4995, doi: 10.1175/jcli-d-16-0572.1.
Marvel, K. et al., 2019: Twentieth-century hydroclimate changes consistent with human influence. Nature, 569(7754), 59-65, doi: 10.1038/s41586-019-1149-8.
Marzeion, B., G. Kaser, F. Maussion, and N. Champollion, 2018: Limited influence of climate change mitigation on short-term glacier mass loss. Nature Climate Change, 8(4), 305–308, doi: 10.1038/s41558-018-0093-1.
Marzeion, B. et al., 2020: Partitioning the Uncertainty of Ensemble Projections of Global Glacier Mass Change. Earth’s Future, 8(7), e2019EF001470, doi: 10.1029/2019ef001470.
Massei, N. et al., 2017: Multi-time-scale hydroclimate dynamics of a regional watershed and links to large-scale atmospheric circulation: Application to the Seine river catchment, France. Journal of Hydrology, 546, 262–275, doi: 10.1016/j.jhydrol.2017.01.008.
Massmann, A., P. Gentine, and C. Lin, 2019: When Does Vapor Pressure Deficit Drive or Reduce Evapotranspiration?Journal of Advances in Modeling Earth Systems, 11(10), 3305–3320, doi: 10.1029/2019ms001790.
Masson-Delmotte, V. et al., 2013: Information from Paleoclimate Archives. In: Climate Change 2013: The Physical Science Basis. Contribution of Working Group I to the Fifth Assessment Report of the Intergovernmental Panel on Climate Change[Stocker, T.F., D. Qin, G.-K. Plattner, M. Tignor, S.K. Allen, J. Boschung, A. Nauels, Y. Xia, V. Bex, and P.M. Midgley (eds.)]. Cambridge University Press, Cambridge, United Kingdom and New York, NY, USA, pp. 383–464, doi: 10.1017/cbo9781107415324.013.
Matthews, T., C. Murphy, R.L. Wilby, and S. Harrigan, 2016: A cyclone climatology of the British-Irish Isles 1871–2012. International Journal of Climatology, 36(3), 1299–1312, doi: 10.1002/joc.4425.
Mattingly, K.S., T.L. Mote, and X. Fettweis, 2018: Atmospheric River Impacts on Greenland Ice Sheet Surface Mass Balance. Journal of Geophysical Research: Atmospheres, 123(16), 8538–8560, doi: 10.1029/2018jd028714.
Maurer, J.M., J.M. Schaefer, S. Rupper, and A. Corley, 2019: Acceleration of ice loss across the Himalayas over the past 40 years. Science Advances, 5(6), eaav7266, doi: 10.1126/sciadv.aav7266.
Maxwell, R.M. and L.E. Condon, 2016: Connections between groundwater flow and transpiration partitioning. Science, 353(6297), 377–380, doi: 10.1126/science.aaf7891.
Mayta, V.C., T. Ambrizzi, J.C. Espinoza, and P.L. Silva Dias, 2019: The role of the Madden–Julian oscillation on the Amazon Basin intraseasonal rainfall variability. International Journal of Climatology, 39(1), 343–360, doi: 10.1002/joc.5810.
McCabe, G.J., D.M. Wolock, G.T. Pederson, C.A. Woodhouse, and S. McAfee, 2017: Evidence that Recent Warming is Reducing Upper Colorado River Flows. Earth Interactions, 21(10), 1–14, doi: 10.1175/ei-d-17-0007.1.
McClymont, E.L. et al., 2020: Lessons from a high-CO2 world: an ocean view from ~3 million years ago. Climate of the Past, 16(4), 1599–1615, doi: 10.5194/cp-16-1599-2020.
McDowell, N.G. and C.D. Allen, 2015: Darcy’s law predicts widespread forest mortality under climate warming. Nature Climate Change, 5(7), 669–672, doi: 10.1038/nclimate2641.
McDowell, N.G. et al., 2016: Multi-scale predictions of massive conifer mortality due to chronic temperature rise. Nature Climate Change, 6(3), 295–300, doi: 10.1038/nclimate2873.
McGee, D., A. Donohoe, J. Marshall, and D. Ferreira, 2014: Changes in ITCZ location and cross-equatorial heat transport at the Last Glacial Maximum, Heinrich Stadial 1, and the mid-Holocene. Earth and Planetary Science Letters, 390, 69–79, doi: 10.1016/j.epsl.2013.12.043.
McGree, S. et al., 2019: Recent Changes in Mean and Extreme Temperature and Precipitation in the Western Pacific Islands. Journal of Climate, 32(16), 4919–4941, doi: 10.1175/jcli-d-18-0748.1.
McGregor, S. et al., 2014: Recent Walker circulation strengthening and Pacific cooling amplified by Atlantic warming. Nature Climate Change, 4(10), 888–892, doi: 10.1038/nclimate2330.
McGregor, S. et al., 2020: The Effect of Strong Volcanic Eruptions on ENSO. In: El Niño Southern Oscillation in a Changing Climate[McPhaden, M.J., A. Santoso, and W. Cai (eds.)]. American Geophysical Union (AGU), Washington, DC, USA, pp. 267–287, doi: 10.1002/9781119548164.ch12.
McKenna, S., A. Santoso, A. Gupta, A.S. Taschetto, and W. Cai, 2020: Indian Ocean Dipole in CMIP5 and CMIP6: characteristics, biases, and links to ENSO. Scientific Reports, 10(1), 11500, doi: 10.1038/s41598-020-68268-9.
McKinnon, K.A. and C. Deser, 2018: Internal Variability and Regional Climate Trends in an Observational Large Ensemble. Journal of Climate, 31(17), 6783–6802, doi: 10.1175/jcli-d-17-0901.1.
Medlyn, B.E. et al., 2015: Using ecosystem experiments to improve vegetation models. Nature Climate Change, 5(6), 528–534, doi: 10.1038/nclimate2621.
Meehl, G.A., A. Hu, B.D. Santer, and S.-P. Xie, 2016: Contribution of the Interdecadal Pacific Oscillation to twentieth-century global surface temperature trends. Nature Climate Change, 6(11), 1005–1008, doi: 10.1038/nclimate3107.
Meixner, T. et al., 2016: Implications of projected climate change for groundwater recharge in the western United States. Journal of Hydrology, 534, 124–138, doi: 10.1016/j.jhydrol.2015.12.027.
Mekonnen, M.M. and A.Y. Hoekstra, 2016: Four billion people facing severe water scarcity. Science Advances, 2(2), e1500323, doi: 10.1126/sciadv.1500323.
Menon, A., A. Levermann, J. Schewe, J. Lehmann, and K. Frieler, 2013: Consistent increase in Indian monsoon rainfall and its variability across CMIP-5 models. Earth System Dynamics, 4(2), 287–300, doi: 10.5194/esd-4-287-2013.
Meredith, E.P., U. Ulbrich, and H.W. Rust, 2019: The Diurnal Nature of Future Extreme Precipitation Intensification. Geophysical Research Letters, 46(13), 7680–7689, doi: 10.1029/2019gl082385.
Meredith, M. et al., 2019: Polar Regions. In: IPCC Special Report on the Ocean and Cryosphere in a Changing Climate[Pörtner, H.-O., D.C. Roberts, V. Masson-Delmotte, P. Zhai, M. Tignor, E. Poloczanska, K. Mintenbeck, A. Alegría, M. Nicolai, A. Okem, J. Petzold, B. Rama, and N.M. Weyer (eds.)]. In Press, pp. 203–320, www.ipcc.ch/srocc/chapter/chapter-3-2.
Merlis, T.M., 2015: Direct weakening of tropical circulations from masked CO2 radiative forcing. Proceedings of the National Academy of Sciences, 112(43), 13167–13171, doi: 10.1073/pnas.1508268112.
Metcalfe, S.E., J.A. Barron, and S.J. Davies, 2015: The Holocene history of the North American Monsoon: ‘known knowns’ and ‘known unknowns’ in understanding its spatial and temporal complexity. Quaternary Science Reviews, 120, 1–27, doi: 10.1016/j.quascirev.2015.04.004.
Michaelis, A.C., J. Willison, G.M. Lackmann, and W.A. Robinson, 2017: Changes in winter North Atlantic extratropical cyclones in high-resolution regional pseudo–global warming simulations. Journal of Climate, 30(17), 6905–6925, doi: 10.1175/jcli-d-16-0697.1.
Micklin, P., 2016: The future Aral Sea: hope and despair. Environmental Earth Sciences, 75(9), 1–15, doi: 10.1007/s12665-016-5614-5.
Mileham, L., R.G. Taylor, M. Tood, C. Tindimugaya, and J. Thompson, 2009: The impact of climate change on groundwater recharge and runoff in a humid, equatorial catchment: sensitivity of projections to rainfall intensity. Hydrological Sciences Journal, 54(4), 727–738, doi: 10.1623/hysj.54.4.727.
Milly, P.C.D. and K.A. Dunne, 2016: Potential evapotranspiration and continental drying. Nature Climate Change, 6(10), 946–949, doi: 10.1038/nclimate3046.
Milly, P.C.D. and K.A. Dunne, 2020: Colorado River flow dwindles as warming-driven loss of reflective snow energizes evaporation. Science, 367(6483), 1252–1255, doi: 10.1126/science.aay9187.
Milner, A.M. et al., 2017: Glacier shrinkage driving global changes in downstream systems. Proceedings of the National Academy of Sciences, 114(37), 9770–9778, doi: 10.1073/pnas.1619807114.
Mindlin, J. et al., 2020: Storyline description of Southern Hemisphere midlatitude circulation and precipitation response to greenhouse gas forcing. Climate Dynamics, 54(9–10), 4399–4421, doi: 10.1007/s00382-020-05234-1.
Miralles, D.G., A.J. Teuling, C.C. Van Heerwaarden, and J.V.G. De Arellano, 2014a: Mega-heatwave temperatures due to combined soil desiccation and atmospheric heat accumulation. Nature Geoscience, 7(5), 345–349, doi: 10.1038/ngeo2141.
Miralles, D.G., P. Gentine, S.I. Seneviratne, and A.J. Teuling, 2019: Land–atmospheric feedbacks during droughts and heatwaves: state of the science and current challenges. Annals of the New York Academy of Sciences, 1436(1), 19–35, doi: 10.1111/nyas.13912.
Miralles, D.G. et al., 2014b: El Niño–La Niña cycle and recent trends in continental evaporation. Nature Climate Change, 4(2), 122–126, doi: 10.1038/nclimate2068.
Miralles, D.G. et al., 2016: The WACMOS-ET project – Part 2: Evaluation of global terrestrial evaporation data sets. Hydrology and Earth System Sciences, 20(2), 823–842, doi: 10.5194/hess-20-823-2016.
Mishra, V., B. Smoliak, D.P. Lettenmaier, and J.M. Wallace, 2012: A prominent pattern of year-to-year variability in Indian Summer Monsoon Rainfall. Proceedings of the National Academy of Sciences, 109(19), 7213–7217, doi: 10.1073/pnas.1119150109.
Mishra, V. et al., 2020: Moist heat stress extremes in India enhanced by irrigation. Nature Geoscience, 13(11), 722–728, doi: 10.1038/s41561-020-00650-8.
Mohtadi, M., M. Prange, and S. Steinke, 2016: Palaeoclimatic insights into forcing and response of monsoon rainfall. Nature, 533(7602), 191–199, doi: 10.1038/nature17450.
Moise, A., I. Smith, J.R. Brown, R. Colman, and S. Narsey, 2020: Observed and projected intra-seasonal variability of Australian monsoon rainfall. International Journal of Climatology, 40(4), 2310–2327, doi: 10.1002/joc.6334.
Molina-Carpio, J. et al., 2017: Hydroclimatology of the Upper Madeira River basin: spatio-temporal variability and trends. Hydrological Sciences Journal, 62(6), 911–927, doi: 10.1080/02626667.2016.1267861.
Mollier-Vogel, E., G. Leduc, T. Böschen, P. Martinez, and R.R. Schneider, 2013: Rainfall response to orbital and millennial forcing in northern Peru over the last 18ka. Quaternary Science Reviews, 76, 29–38, doi: 10.1016/j.quascirev.2013.06.021.
Molnar, P., S. Fatichi, L. Gaál, J. Szolgay, and P. Burlando, 2015: Storm type effects on super Clausius–Clapeyron scaling of intense rainstorm properties with air temperature. Hydrology and Earth System Sciences, 19(4), 1753–1766, doi: 10.5194/hess-19-1753-2015.
Monerie, P.-A., C.M. Wainwright, M. Sidibe, and A.A. Akinsanola, 2020: Model uncertainties in climate change impacts on Sahel precipitation in ensembles of CMIP5 and CMIP6 simulations. Climate Dynamics, 55(5–6), 1385–1401, doi: 10.1007/s00382-020-05332-0.
Moomaw, W.R. et al., 2018: Wetlands In a Changing Climate: Science, Policy and Management. Wetlands, 38(2), 183–205, doi: 10.1007/s13157-018-1023-8.
Moon, H., B.P. Guillod, L. Gudmundsson, and S.I. Seneviratne, 2019: Soil Moisture Effects on Afternoon Precipitation Occurrence in Current Climate Models. Geophysical Research Letters, 46(3), 1861–1869, doi: 10.1029/2018gl080879.
Moon, I.J., S.H. Kim, and J.C.L. Chan, 2019: Climate change and tropical cyclone trend. Nature, 570(7759), E3–E5, doi: 10.1038/s41586-019-1222-3.
Moon, S. and K.-J. Ha, 2020: Future changes in monsoon duration and precipitation using CMIP6. Climate and Atmospheric Science, 3(45), 1–7, doi: 10.1038/s41612-020-00151-w.
Moore, G.W.K., I.A. Renfrew, and R.S. Pickart, 2013: Multidecadal Mobility of the North Atlantic Oscillation. Journal of Climate, 26(8), 2453–2466, doi: 10.1175/jcli-d-12-00023.1.
Morales, M.S. et al., 2012: Precipitation changes in the South American Altiplano since 1300 AD reconstructed by tree-rings. Climate of the Past, 8, 653–666, doi: 10.5194/cp-8-653-2012.
Morales, M.S. et al., 2020: Six hundred years of South American tree rings reveal an increase in severe hydroclimatic events since mid-20th century. Proceedings of the National Academy of Sciences, 117(29), 16816–16823, doi: 10.1073/pnas.2002411117.
Morrill, C., D.P. Lowry, and A. Hoell, 2018: Thermodynamic and Dynamic Causes of Pluvial Conditions During the Last Glacial Maximum in Western North America. Geophysical Research Letters, 45(1), 335–345, doi: 10.1002/2017gl075807.
Mote, P.W., S. Li, D.P. Lettenmaier, M. Xiao, and R. Engel, 2018: Dramatic declines in snowpack in the western US. npj Climate and Atmospheric Science, 1(1), 2, doi: 10.1038/s41612-018-0012-1.
Mote, P.W. et al., 2016: Perspectives on the causes of exceptionally low 2015 snowpack in the western United States. Geophysical Research Letters, 43(20), 10980–10988, doi: 10.1002/2016gl069965.
Muchan, K., M. Lewis, J. Hannaford, and S. Parry, 2015: The winter storms of 2013/2014 in the UK: hydrological responses and impacts. Weather, 70(2), 55–61, doi: 10.1002/wea.2469.
Mudryk, L.R., P.J. Kushner, C. Derksen, and C. Thackeray, 2017: Snow cover response to temperature in observational and climate model ensembles. Geophysical Research Letters, 44(2), 919–926, doi: 10.1002/2016gl071789.
Mudryk, L.R. et al., 2020: Historical Northern Hemisphere snow cover trends and projected changes in the CMIP6 multi-model ensemble. The Cryosphere, 14(7), 2495–2514, doi: 10.5194/tc-14-2495-2020.
Mueller, B. and X. Zhang, 2016: Causes of drying trends in northern hemispheric land areas in reconstructed soil moisture data. Climatic Change, 134(1–2), 255–267, doi: 10.1007/s10584-015-1499-7.
Mujumdar, M. et al., 2020: Droughts and Floods. In: Assessment of Climate Change over the Indian Region: A Report of the Ministry of Earth Sciences (MoES), Government of India[Krishnan, R., J. Sanjay, C. Gnanaseelan, M. Mujumdar, A. Kulkarni, and S. Chakraborty (eds.)]. Springer, Singapore, pp. 117–141, doi: 10.1007/978-981-15-4327-2_6.
Mukherjee, A., S.N. Bhanja, and Y. Wada, 2018: Groundwater depletion causing reduction of baseflow triggering Ganges river summer drying. Scientific Reports, 8(1), 12049, doi: 10.1038/s41598-018-30246-7.
Muller, C. and S. Bony, 2015: What favors convective aggregation and why?Geophysical Research Letters, 42(13), 5626–5634, doi: 10.1002/2015gl064260.
Mundhenk, B.D., E.A. Barnes, E.D. Maloney, and C.F. Baggett, 2018: Skillful empirical subseasonal prediction of landfalling atmospheric river activity using the Madden–Julian oscillation and quasi-biennial oscillation. npj Climate and Atmospheric Science, 1(1), 20177, doi: 10.1038/s41612-017-0008-2.
Murphy, T.R., M.E. Hanley, J.S. Ellis, and P.H. Lunt, 2021: Native woodland establishment improves soil hydrological functioning in UK upland pastoral catchments. Land Degradation & Development, 32(2), 1034–1045, doi: 10.1002/ldr.3762.
Murray, B.J., D. O’Sullivan, J.D. Atkinson, and M.E. Webb, 2012: Ice nucleation by particles immersed in supercooled cloud droplets. Chemical Society Reviews, 41(19), 6519–6554, doi: 10.1039/c2cs35200a.
Murray-Tortarolo, G., V.J. Jaramillo, M. Maass, P. Friedlingstein, and S. Sitch, 2017: The decreasing range between dry- and wet-season precipitation over land and its effect on vegetation primary productivity. PLOS ONE, 12(12), e0190304, doi: 10.1371/journal.pone.0190304.
Murray-Tortarolo, G. et al., 2016: The dry season intensity as a key driver of NPP trends. Geophysical Research Letters, 43(6), 2632–2639, doi: 10.1002/2016gl068240.
Musselman, K.N., M.P. Clark, C. Liu, K. Ikeda, and R. Rasmussen, 2017: Slower snowmelt in a warmer world. Nature Climate Change, 7(3), 214–219, doi: 10.1038/nclimate3225.
Musselman, K.N. et al., 2018: Projected increases and shifts in rain-on-snow flood risk over western North America. Nature Climate Change, 8(9), 808–812, doi: 10.1038/s41558-018-0236-4.
Myhre, G. et al., 2018a: Quantifying the Importance of Rapid Adjustments for Global Precipitation Changes. Geophysical Research Letters, 45(20), 11399–11405, doi: 10.1029/2018gl079474.
Myhre, G. et al., 2018b: Sensible heat has significantly affected the global hydrological cycle over the historical period. Nature Communications, 9(1), 1922, doi: 10.1038/s41467-018-04307-4.
Najafi, M., F. Zwiers, and N. Gillett, 2016: Attribution of the spring snow cover extent decline in the Northern Hemisphere, Eurasia and North America to anthropogenic influence. Climatic Change, 136(3–4), 571–586, doi: 10.1007/s10584-016-1632-2.
Nakano, M., M. Sawada, T. Nasuno, and M. Satoh, 2015: Intraseasonal variability and tropical cyclogenesis in the western North Pacific simulated by a global nonhydrostatic atmospheric model. Geophysical Research Letters, 42(2), 565–571, doi: 10.1002/2014gl062479.
Nangombe, S., T. Zhou, L. Zhang, and W. Zhang, 2020: Attribution Of The 2018 October–December Drought Over South Southern Africa. Bulletin of the American Meteorological Society, 101(1), S135–S140, doi: 10.1175/bams-d-19-0179.1.
Narsey, S.Y. et al., 2020: Climate Change Projections for the Australian Monsoon From CMIP6 Models. Geophysical Research Letters, 47(13), e2019GL086816, doi: 10.1029/2019gl086816.
Nash, D., 2017: Changes in Precipitation Over Southern Africa During Recent Centuries. In: Oxford Research Encyclopedia of Climate Science. Oxford University Press, Oxford, UK, doi: 10.1093/acrefore/9780190228620.013.539.
Naughton, F. et al., 2019: Coupled ocean and atmospheric changes during Greenland stadial 1 in southwestern Europe. Quaternary Science Reviews, 212, 108–120, doi: 10.1016/j.quascirev.2019.03.033.
Neelin, J.D., S. Sahany, S.N. Stechmann, and D.N. Bernstein, 2017: Global warming precipitation accumulation increases above the current-climate cutoff scale. Proceedings of the National Academy of Sciences, 114(6), 1258–1263, doi: 10.1073/pnas.1615333114.
Neelin, J.D., B. Langenbrunner, J.E. Meyerson, A. Hall, and N. Berg, 2013: California winter precipitation change under global warming in the coupled model intercomparison project phase 5 ensemble. Journal of Climate, 26(17), 6238–6256, doi: 10.1175/jcli-d-12-00514.1.
Neu, U. et al., 2013: IMILAST: A Community Effort to Intercompare Extratropical Cyclone Detection and Tracking Algorithms. Bulletin of the American Meteorological Society, 94(4), 529–547, doi: 10.1175/bams-d-11-00154.1.
Neukom, R. et al., 2015: Facing unprecedented drying of the Central Andes? Precipitation variability over the period AD 1000–2100. Environmental Research Letters, 10(8), 84017, doi: 10.1088/1748-9326/10/8/084017.
Neumann, R.B. et al., 2019: Warming Effects of Spring Rainfall Increase Methane Emissions From Thawing Permafrost. Geophysical Research Letters, 46(3), 1393–1401, doi: 10.1029/2018gl081274.
Neupane, N. and K.H. Cook, 2013: A Nonlinear Response of Sahel Rainfall to Atlantic Warming. Journal of Climate, 26(18), 7080–7096, doi: 10.1175/jcli-d-12-00475.1.
Neves, M.C., S. Jerez, and R.M. Trigo, 2019: The response of piezometric levels in Portugal to NAO, EA, and SCAND climate patterns. Journal of Hydrology, 568, 1105–1117, doi: 10.1016/j.jhydrol.2018.11.054.
Ng, B., W. Cai, T. Cowan, and D. Bi, 2018: Influence of internal climate variability on Indian Ocean Dipole properties. Scientific Reports, 8(1), 13500, doi: 10.1038/s41598-018-31842-3.
Nguyen, H., C. Lucas, A. Evans, B. Timbal, and L. Hanson, 2015: Expansion of the Southern Hemisphere Hadley Cell in Response to Greenhouse Gas Forcing. Journal of Climate, 28(20), 8067–8077, doi: 10.1175/jcli-d-15-0139.1.
Nguyen, H. et al., 2018: Variability of the extent of the Hadley circulation in the southern hemisphere: a regional perspective. Climate Dynamics, 50(1–2), 129–142, doi: 10.1007/s00382-017-3592-2.
Nguyen, P. et al., 2018: Global precipitation trends across spatial scales using satellite observations. Bulletin of the American Meteorological Society, 99(4), 689–697, doi: 10.1175/bams-d-17-0065.1.
Ni, S. et al., 2018: Global Terrestrial Water Storage Changes and Connections to ENSO Events. Surveys in Geophysics, 39(1), 1–22, doi: 10.1007/s10712-017-9421-7.
Nicholson, S.E., 2013: The West African Sahel: A Review of Recent Studies on the Rainfall Regime and Its Interannual Variability. ISRN Meteorology, 2013, 1–32, doi: 10.1155/2013/453521.
Nicholson, S.E., 2017: Climate and climatic variability of rainfall over eastern Africa. Reviews of Geophysics, 55(3), 590–635, doi: 10.1002/2016rg000544.
Nicholson, S.E., A.H. Fink, and C. Funk, 2018: Assessing recovery and change in West Africa’s rainfall regime from a 161-year record. International Journal of Climatology, 38(10), 3770–3786, doi: 10.1002/joc.5530.
Nie, J., A.H. Sobel, D.A. Shaevitz, and S. Wang, 2018: Dynamic amplification of extreme precipitation sensitivity. Proceedings of the National Academy of Sciences, 115(38), 201800357, doi: 10.1073/pnas.1800357115.
Nikumbh, A., A. Chakraborty, and G.S. Bhat, 2019: Recent spatial aggregation tendency of rainfall extremes over India. Scientific Reports, 9(1), 1–29, doi: 10.1038/s41598-019-46719-2.
Niranjan Kumar, K. et al., 2013: On the observed variability of monsoon droughts over India. Weather and Climate Extremes, 1, 42–50, doi: 10.1016/j.wace.2013.07.006.
Norris, J., G. Chen, and J.D. Neelin, 2019: Changes in Frequency of Large Precipitation Accumulations over Land in a Warming Climate from the CESM Large Ensemble: The Roles of Moisture, Circulation, and Duration. Journal of Climate, 32(17), 5397–5416, doi: 10.1175/jcli-d-18-0600.1.
Norris, J.R. et al., 2016: Evidence for climate change in the satellite cloud record. Nature, 536(7614), 72–75, doi: 10.1038/nature18273.
Notaro, M., V. Bennington, and B. Lofgren, 2015: Dynamical downscaling-based projections of great lakes water levels. Journal of Climate, 28(24), 9721–9745, doi: 10.1175/jcli-d-14-00847.1.
Novello, V.F. et al., 2016: Centennial-scale solar forcing of the South American Monsoon System recorded in stalagmites. Scientific Reports, 6(1), 1–8, doi: 10.1038/srep24762.
Novello, V.F. et al., 2017: A high-resolution history of the South American Monsoon from Last Glacial Maximum to the Holocene. Scientific Reports, 7(1), 1–8, doi: 10.1038/srep44267.
Nur’utami, M.N. and R. Hidayat, 2016: Influences of IOD and ENSO to Indonesian Rainfall Variability: Role of Atmosphere–ocean Interaction in the Indo-pacific Sector. Procedia Environmental Sciences, 33, 196–203, doi: 10.1016/j.proenv.2016.03.070.
Nusbaumer, J., P.M. Alexander, A.N. LeGrande, and M. Tedesco, 2019: Spatial Shift of Greenland Moisture Sources Related to Enhanced Arctic Warming. Geophysical Research Letters, 46(24), 14723–14731, doi: 10.1029/2019gl084633.
Nygård, T., T. Naakka, and T. Vihma, 2020: Horizontal Moisture Transport Dominates the Regional Moistening Patterns in the Arctic. Journal of Climate, 33(16), 6793–6807, doi: 10.1175/jcli-d-19-0891.1.
O’Gorman, P.A., 2012: Sensitivity of tropical precipitation extremes to climate change. Nature Geoscience, 5(10), 697–700, doi: 10.1038/ngeo1568.
O’Gorman, P.A., 2014: Contrasting responses of mean and extreme snowfall to climate change. Nature, 512(7515), 416–418, doi: 10.1038/nature13625.
O’Gorman, P.A., 2015: Precipitation Extremes Under Climate Change. Current Climate Change Reports, 1(2), 49–59, doi: 10.1007/s40641-015-0009-3.
O’Gorman, P.A. and T. Schneider, 2009: The physical basis for increases in precipitation extremes in simulations of 21st-century climate change. Proceedings of the National Academy of Sciences, 106(35), 14773–14777, doi: 10.1073/pnas.0907610106.
O’Gorman, P.A. and J.G. Dwyer, 2018: Using Machine Learning to Parameterize Moist Convection: Potential for Modeling of Climate, Climate Change, and Extreme Events. Journal of Advances in Modeling Earth Systems, 10(10), 2548–2563, doi: 10.1029/2018ms001351.
O’Gorman, P.A., R.P. Allan, M.P. Byrne, and M. Previdi, 2012: Energetic Constraints on Precipitation Under Climate Change. Surveys in Geophysics, 33(3–4), 585–608, doi: 10.1007/s10712-011-9159-6.
Ogata, T. et al., 2017: The resolution sensitivity of the Asian summer monsoon and its inter-model comparison between MRI-AGCM and MetUM. Climate Dynamics, 49(9–10), 3345–3361, doi: 10.1007/s00382-016-3517-5.
Oki, T. and S. Kanae, 2006: Global Hydrological Cycles and World Water Resources. Science, 313(5790), 1068–1072, doi: 10.1126/science.1128845.
Okkonen, J. and B. Kløve, 2011: A sequential modelling approach to assess groundwater–surface water resources in a snow dominated region of Finland. Journal of Hydrology, 411, 91–107, doi: 10.1016/j.jhydrol.2011.09.038.
Okumura, Y.M., P. DiNezio, and C. Deser, 2017: Evolving Impacts of Multiyear La Niña Events on Atmospheric Circulation and U.S. Drought. Geophysical Research Letters, 44(22), 11614–11623, doi: 10.1002/2017gl075034.
Oliver, E.C.J. and K.R. Thompson, 2012: A Reconstruction of Madden–Julian Oscillation Variability from 1905 to 2008. Journal of Climate, 25(6), 1996–2019, doi: 10.1175/jcli-d-11-00154.1.
Oltmanns, M., F. Straneo, and M. Tedesco, 2019: Increased Greenland melt triggered by large-scale, year-round cyclonic moisture intrusions. The Cryosphere, 13(3), 815–825, doi: 10.5194/tc-13-815-2019.
Orlowsky, B. and S.I. Seneviratne, 2013: Elusive drought: Uncertainty in observed trends and short-and long-term CMIP5 projections. Hydrology and Earth System Sciences, 17(5), 1765–1781, doi: 10.5194/hess-17-1765-2013.
Ose, T., 2019: Characteristics of Future Changes in Summertime East Asian Monthly Precipitation in MRI-AGCM Global Warming Experiments. Journal of the Meteorological Society of Japan. Series II, 97(2), 317–335, doi: 10.2151/jmsj.2019-018.
Oshima, K. and K. Yamazaki, 2017: Atmospheric hydrological cycles in the Arctic and Antarctic during the past four decades. Czech Polar Reports, 7(2), 169–180, doi: 10.5817/cpr2017-2-17.
Oster, J.L., D.E. Ibarra, M.J. Winnick, and K. Maher, 2015: Steering of westerly storms over western North America at the Last Glacial Maximum. Nature Geoscience, 8(3), 201–205, doi: 10.1038/ngeo2365.
Otkin, J.A. et al., 2016: Assessing the evolution of soil moisture and vegetation conditions during the 2012 United States flash drought. Agricultural and Forest Meteorology, 218–219, 230–242, doi: 10.1016/j.agrformet.2015.12.065.
Otkin, J.A. et al., 2018: Flash Droughts: A Review and Assessment of the Challenges Imposed by Rapid-Onset Droughts in the United States. Bulletin of the American Meteorological Society, 99(5), 911–919, doi: 10.1175/bams-d-17-0149.1.
Otto, F.E.L. et al., 2018: Anthropogenic influence on the drivers of the Western Cape drought 2015–2017. Environmental Research Letters, 13(12), 124010, doi: 10.1088/1748-9326/aae9f9.
Otto-Bliesner, B.L. et al., 2014: Coherent changes of southeastern equatorial and northern African rainfall during the last deglaciation. Science, 346(6214), 1223–1227, doi: 10.1126/science.1259531.
Otto-Bliesner, B.L. et al., 2016: Climate Variability and Change since 850 CE: An Ensemble Approach with the Community Earth System Model. Bulletin of the American Meteorological Society, 97(5), 735–754, doi: 10.1175/bams-d-14-00233.1.
Oudar, T., J. Cattiaux, and H. Douville, 2020a: Drivers of the Northern Extratropical Eddy-Driven Jet Change in CMIP5 and CMIP6 Models. Geophysical Research Letters, 47(8), 1–9, doi: 10.1029/2019gl086695.
Oudar, T. et al., 2020b: Robustness and drivers of the Northern Hemisphere extratropical atmospheric circulation response to a CO2 -induced warming in CNRM-CM6-1. Climate Dynamics, 54(3–4), 2267–2285, doi: 10.1007/s00382-019-05113-4.
Oueslati, B. and G. Bellon, 2015: The double ITCZ bias in CMIP5 models: interaction between SST, large-scale circulation and precipitation. Climate Dynamics, 44(3–4), 585–607, doi: 10.1007/s00382-015-2468-6.
Oueslati, B., S. Bony, C. Risi, and J.L. Dufresne, 2016: Interpreting the inter-model spread in regional precipitation projections in the tropics: role of surface evaporation and cloud radiative effects. Climate Dynamics, 47(9–10), 2801–2815, doi: 10.1007/s00382-016-2998-6.
Overland, J.E. et al., 2016: Nonlinear response of mid-latitude weather to the changing Arctic. Nature Climate Change, 6(11), 992–999, doi: 10.1038/nclimate3121.
Overpeck, J.T., 2013: The challenge of hot drought. Nature, 503(7476), 350–351, doi: 10.1038/503350a.
Oyama, M.D. and C.A. Nobre, 2003: A new climate–vegetation equilibrium state for Tropical South America. Geophysical Research Letters, 30(23), 2199, doi: 10.1029/2003gl018600.
Pabón-Caicedo, J.D. et al., 2020: Observed and Projected Hydroclimate Changes in the Andes. Frontiers in Earth Science, 8(61), 1–29, doi: 10.3389/feart.2020.00061.
Padrón, R.S. et al., 2020: Observed changes in dry-season water availability attributed to human-induced climate change. Nature Geoscience, 13(7), 477–481, doi: 10.1038/s41561-020-0594-1.
Page, T., N.A. Chappell, K.J. Beven, B. Hankin, and A. Kretzschmar, 2020: Assessing the significance of wet-canopy evaporation from forests during extreme rainfall events for flood mitigation in mountainous regions of the United Kingdom. Hydrological Processes, 34(24), 4740–4754, doi: 10.1002/hyp.13895.
PAGES Hydro2K Consortium, 2017: Comparing proxy and model estimates of hydroclimate variability and change over the Common Era. Climate of the Past, 13(12), 1851–1900, doi: 10.5194/cp-13-1851-2017.
Palerme, C. et al., 2017: Evaluation of current and projected Antarctic precipitation in CMIP5 models. Climate Dynamics, 48(1–2), 225–239, doi: 10.1007/s00382-016-3071-1.
Pall, P., L.M. Tallaksen, and F. Stordal, 2019: A Climatology of Rain-on-Snow Events for Norway. Journal of Climate, 32(20), 6995–7016, doi: 10.1175/jcli-d-18-0529.1.
Palmer, J.G. et al., 2015: Drought variability in the eastern Australia and New Zealand summer drought atlas (ANZDA, CE 1500–2012) modulated by the Interdecadal Pacific Oscillation. Environmental Research Letters, 10(12), 124002, doi: 10.1088/1748-9326/10/12/124002.
Paltan, H. et al., 2017: Global Floods and Water Availability Driven by Atmospheric Rivers. Geophysical Research Letters, 44(20), 10387–10395, doi: 10.1002/2017gl074882.
Pan, N., S. Wang, Y. Liu, W. Zhao, and B. Fu, 2019: Global Surface Soil Moisture Dynamics in 1979–2016 Observed from ESA CCI SM Dataset. Water, 11(5), 883, doi: 10.3390/ w11050883.
Pan, S. et al., 2015: Responses of global terrestrial evapotranspiration to climate change and increasing atmospheric CO2 in the 21st century. Earth’s Future, 3(1), 15–35, doi: 10.1002/2014ef000263.
Pan, X., M. Chin, C.M. Ichoku, and R.D. Field, 2018: Connecting Indonesian Fires and Drought With the Type of El Niño and Phase of the Indian Ocean Dipole During 1979–2016. Journal of Geophysical Research: Atmospheres, 123(15), 7974–7988, doi: 10.1029/2018jd028402.
Panthou, G., T. Vischel, and T. Lebel, 2014: Recent trends in the regime of extreme rainfall in the Central Sahel. International Journal of Climatology, 34(15), 3998–4006, doi: 10.1002/joc.3984.
Panthou, G. et al., 2018: Rainfall intensification in tropical semi-arid regions: the Sahelian case. Environmental Research Letters, 13(6), 064013, doi: 10.1088/1748-9326/aac334.
Park, H. et al., 2020: Increasing riverine heat influx triggers Arctic sea ice decline and oceanic and atmospheric warming. Science Advances, 6(45), 1–8, doi: 10.1126/sciadv.abc4699.
Park, S., J. Shin, S. Kim, E. Oh, and Y. Kim, 2019: Global climate simulated by the Seoul National University Atmosphere Model version 0 with a unified convection scheme (SAM0-UNICON). Journal of Climate, 32(10), 2917–2949, doi: 10.1175/jcli-d-18-0796.1.
Parracho, A.C., O. Bock, and S. Bastin, 2018: Global IWV trends and variability in atmospheric reanalyses and GPS observations. Atmospheric Chemistry and Physics, 18(22), 16213–16237, doi: 10.5194/acp-18-16213-2018.
Parsons, L.A., 2020: Implications of CMIP6 Projected Drying Trends for 21st Century Amazonian Drought Risk. Earth’s Future, 8(10), e2020EF001608, doi: 10.1029/2020ef001608.
Parsons, L.A., S. Coats, and J.T. Overpeck, 2018: The Continuum of Drought in Southwestern North America. Journal of Climate, 31(20), 8627–8643, doi: 10.1175/jcli-d-18-0010.1.
Parsons, L.A., J. Yin, J.T. Overpeck, R.J. Stouffer, and S. Malyshev, 2014: Influence of the Atlantic Meridional Overturning Circulation on the monsoon rainfall and carbon balance of the American tropics. Geophysical Research Letters, 41(1), 146–151, doi: 10.1002/2013gl058454.
Parsons, L.A. et al., 2017: Temperature and Precipitation Variance in CMIP5 Simulations and Paleoclimate Records of the Last Millennium. Journal of Climate, 30(22), 8885–8912, doi: 10.1175/jcli-d-16-0863.1.
Pascale, S., S.B. Kapnick, T.L. Delworth, and W.F. Cooke, 2020: Increasing risk of another Cape Town “Day Zero” drought in the 21st century. Proceedings of the National Academy of Sciences, 117(47), 29495–29503, doi: 10.1073/pnas.2009144117.
Pascale, S., V. Lucarini, X. Feng, A. Porporato, and S. ul Hasson, 2016: Projected changes of rainfall seasonality and dry spells in a high greenhouse gas emissions scenario. Climate Dynamics, 46(3–4), 1331–1350, doi: 10.1007/s00382-015-2648-4.
Pascale, S., L.M.V. Carvalho, D.K. Adams, C.L. Castro, and I.F.A. Cavalcanti, 2019: Current and Future Variations of the Monsoons of the Americas in a Warming Climate. Current Climate Change Reports, 5(3), 125–144, doi: 10.1007/s40641-019-00135-w.
Pascale, S. et al., 2017: Weakening of the North American monsoon with global warming. Nature Climate Change, 7(11), 806–812, doi: 10.1038/nclimate3412.
Pathirana, A., H.B. Denekew, W. Veerbeek, C. Zevenbergen, and A.T. Banda, 2014: Impact of urban growth-driven landuse change on microclimate and extreme precipitation – A sensitivity study. Atmospheric Research, 138, 59–72, doi: 10.1016/j.atmosres.2013.10.005.
Patil, N., C. Venkataraman, K. Muduchuru, S. Ghosh, and A. Mondal, 2019: Disentangling sea-surface temperature and anthropogenic aerosol influences on recent trends in South Asian monsoon rainfall. Climate Dynamics, 52(3–4), 2287–2302, doi: 10.1007/s00382-018-4251-y.
Patterson, M., T. Bracegirdle, and T. Woollings, 2019: Southern Hemisphere Atmospheric Blocking in CMIP5 and Future Changes in the Australia–New Zealand Sector. Geophysical Research Letters, 46(15), 9281–9290, doi: 10.1029/2019gl083264.
Paul, S. et al., 2016: Weakening of Indian Summer Monsoon Rainfall due to Changes in Land Use Land Cover. Scientific Reports, 6(1), 32177, doi: 10.1038/srep32177.
Pausata, F.S.R., G. Messori, and Q. Zhang, 2016: Impacts of dust reduction on the northward expansion of the African monsoon during the Green Sahara period. Earth and Planetary Science Letters, 434, 298–307, doi: 10.1016/j.epsl.2015.11.049.
Pausata, F.S.R., L. Chafik, R. Caballero, and D.S. Battisti, 2015a: Impacts of high-latitude volcanic eruptions on ENSO and AMOC. Proceedings of the National Academy of Sciences, 112(45), 13784–13788, doi: 10.1073/pnas.1509153112.
Pausata, F.S.R., A. Grini, R. Caballero, A. Hannachi, and Seland, 2015b: High-latitude volcanic eruptions in the Norwegian Earth System Model: the effect of different initial conditions and of the ensemble size. Tellus B: Chemical and Physical Meteorology, 67(1), 26728, doi: 10.3402/tellusb. v67.26728.
Pausata, F.S.R. et al., 2020: The Greening of the Sahara: Past Changes and Future Implications. One Earth, 2(3), 235–250, doi: 10.1016/j.oneear.2020.03.002.
Payne, A.E. and G. Magnusdottir, 2015: An evaluation of atmospheric rivers over the North Pacific in CMIP5 and their response to warming under RCP 8.5. Journal of Geophysical Research: Atmospheres, 120(21), 11173–11190, doi: 10.1002/2015jd023586.
Payne, A.E. et al., 2020: Responses and impacts of atmospheric rivers to climate change. Nature Reviews Earth & Environment, 1(3), 143–157, doi: 10.1038/s43017-020-0030-5.
Peano, D. et al., 2019: Global Variability of Simulated and Observed Vegetation Growing Season. Journal of Geophysical Research: Biogeosciences, 124(11), 3569–3587, doi: 10.1029/2018jg004881.
Pechlivanidis, I.G. et al., 2017: Analysis of hydrological extremes at different hydro-climatic regimes under present and future conditions. Climatic Change, 141(3), 467–481, doi: 10.1007/s10584-016-1723-0.
Pederson, N., A.E. Hessl, N. Baatarbileg, K.J. Anchukaitis, and N. Di Cosmo, 2014: Pluvials, droughts, the Mongol Empire, and modern Mongolia. Proceedings of the National Academy of Sciences, 111(12), 4375–4379, doi: 10.1073/pnas.1318677111.
Pedron, I.T., M.A.F. Silva Dias, S. de Paula Dias, L.M. Carvalho, and E.D. Freitas, 2017: Trends and variability in extremes of precipitation in Curitiba – Southern Brazil. International Journal of Climatology, 37(3), 1250–1264, doi: 10.1002/joc.4773.
Pei, L. et al., 2016: Effects of irrigation on summer precipitation over the United States. Journal of Climate, 29(10), 3541–3558, doi: 10.1175/jcli-d-15-0337.1.
Peings, Y. and G. Magnusdottir, 2014: Response of the Wintertime Northern Hemisphere Atmospheric Circulation to Current and Projected Arctic Sea Ice Decline: A Numerical Study with CAM5. Journal of Climate, 27(1), 244–264, doi: 10.1175/jcli-d-13-00272.1.
Pekel, J.-F., A. Cottam, N. Gorelick, and A.S. Belward, 2016: High-resolution mapping of global surface water and its long-term changes. Nature, 540(7633), 418–422, doi: 10.1038/nature20584.
Pendergrass, A.G., 2020a: Changing Degree of Convective Organization as a Mechanism for Dynamic Changes in Extreme Precipitation. Current Climate Change Reports, 6(2), 47–54, doi: 10.1007/s40641-020-00157-9.
Pendergrass, A.G., 2020b: The Global-Mean Precipitation Response to CO2 -Induced Warming in CMIP6 Models. Geophysical Research Letters, 47(17), e2020GL089964, doi: 10.1029/2020gl089964.
Pendergrass, A.G. and D.L. Hartmann, 2014a: Changes in the distribution of rain frequency and intensity in response to global warming. Journal of Climate, 27(22), 8372–8383, doi: 10.1175/jcli-d-14-00183.1.
Pendergrass, A.G. and D.L. Hartmann, 2014b: Two modes of change of the distribution of rain. Journal of Climate, 27(22), 8357–8371, doi: 10.1175/jcli-d-14-00182.1.
Pendergrass, A.G., K.A. Reed, and B. Medeiros, 2016: The link between extreme precipitation and convective organization in a warming climate: Global radiative–convective equilibrium simulations. Geophysical Research Letters, 43(21), 11445–11452, doi: 10.1002/2016gl071285.
Pendergrass, A.G., F. Lehner, B.M. Sanderson, and Y. Xu, 2015: Does extreme precipitation intensity depend on the emissions scenario?Geophysical Research Letters, 42(20), 8767–8774, doi: 10.1002/2015gl065854.
Pendergrass, A.G., R. Knutti, F. Lehner, C. Deser, and B.M. Sanderson, 2017: Precipitation variability increases in a warmer climate. Scientific Reports, 7(1), 1–9, doi: 10.1038/s41598-017-17966-y.
Pendergrass, A.G. et al., 2019: Nonlinear Response of Extreme Precipitation to Warming in CESM1. Geophysical Research Letters, 46(17–18), 10551–10560, doi: 10.1029/2019gl084826.
Pendergrass, A.G. et al., 2020: Flash droughts present a new challenge for subseasonal-to-seasonal prediction. Nature Climate Change, 10(3), 191–199, doi: 10.1038/s41558-020-0709-0.
Peng, S. et al., 2013: Change in snow phenology and its potential feedback to temperature in the Northern Hemisphere over the last three decades. Environmental Research Letters, 8(1), 014008, doi: 10.1088/1748-9326/8/1/014008.
Pepler, A.S. et al., 2016: Projected changes in east Australian midlatitude cyclones during the 21st century. Geophysical Research Letters, 43(1), 334–340, doi: 10.1002/2015gl067267.
Perry, S.J., S. McGregor, A. Sen Gupta, M.H. England, and N. Maher, 2020: Projected late 21st century changes to the regional impacts of the El Niño-Southern Oscillation. Climate Dynamics, 54(1–2), 395–412, doi: 10.1007/s00382-019-05006-6.
Pervez, M.S. and G.M. Henebry, 2015: Spatial and seasonal responses of precipitation in the Ganges and Brahmaputra river basins to ENSO and Indian Ocean dipole modes: implications for flooding and drought. Natural Hazards and Earth System Sciences, 15(1), 147–162, doi: 10.5194/nhess-15-147-2015.
Peters, W. et al., 2018: Increased water-use efficiency and reduced CO2 uptake by plants during droughts at a continental scale. Nature Geoscience, 11(10), 744–748, doi: 10.1038/s41561-018-0212-7.
Peterson, L.C., G.H. Haug, K.A. Hughen, and U. Röhl, 2000: Rapid Changes in the Hydrologic Cycle of the Tropical Atlantic During the Last Glacial. Science, 290(5498), 1947–1951, doi: 10.1126/science.290. 5498.1947.
Petoukhov, V., S. Rahmstorf, S. Petri, and H.J. Schellnhuber, 2013: Quasiresonant amplification of planetary waves and recent Northern Hemisphere weather extremes. Proceedings of the National Academy of Sciences, 110(14), 5336–5341, doi: 10.1073/pnas.1222000110.
Petoukhov, V. et al., 2016: Role of quasiresonant planetary wave dynamics in recent boreal spring-to-autumn extreme events. Proceedings of the National Academy of Sciences, 113(25), 6862–6867, doi: 10.1073/pnas.1606300113.
Petrie, M.D., S.L. Collins, D.S. Gutzler, and D.M. Moore, 2014: Regional trends and local variability in monsoon precipitation in the northern Chihuahuan Desert, USA. Journal of Arid Environments, 103, 63–70, doi: 10.1016/j.jaridenv.2014.01.005.
Petrova, I.Y., D.G. Miralles, C.C. Van Heerwaarden, and H. Wouters, 2018: Relation between Convective Rainfall Properties and Antecedent Soil Moisture Heterogeneity Conditions in North Africa. Remote Sensing, 10(6), 969, doi: 10.3390/rs10060969.
Pfahl, S. and M. Sprenger, 2016: On the relationship between extratropical cyclone precipitation and intensity. Geophysical Research Letters, 43(4), 1752–1758, doi: 10.1002/2016gl068018.
Pfahl, S., C. Schwierz, M. Croci-Maspoli, C.M. Grams, and H. Wernli, 2015: Importance of latent heat release in ascending air streams for atmospheric blocking. Nature Geoscience, 8(8), 610–614, doi: 10.1038/ngeo2487.
Pfahl, S. et al., 2017: Understanding the regional pattern of projected future changes in extreme precipitation. Nature Climate Change, 7(6), 423–427, doi: 10.1038/nclimate3287.
Pfleiderer, P., C.-F. Schleussner, and D. Coumou, 2018: Boreal summer weather becomes more persistent in a warmer world. Nature Climate Change, 9(9), 666–671, doi: 10.1038/s41558-019-0555-0.
Philip, S. et al., 2018: Attribution analysis of the Ethiopian drought of 2015. Journal of Climate, 31(6), 2465–2486, doi: 10.1175/jcli-d-17-0274.1.
Phillips, J.C. et al., 2015: The Potential for CO2 -Induced Acidification in Freshwater: A Great Lakes Case Study. Oceanography, 28(2), 136–145, doi: 10.5670/oceanog.2015.37.
Phillips, T.J. et al., 2017: Using ARM Observations to Evaluate Climate Model Simulations of Land–Atmosphere Coupling on the U.S. Southern Great Plains. Journal of Geophysical Research: Atmospheres, 122(21), 11524–11548, doi: 10.1002/2017jd027141.
Piazza, M., L. Terray, J. Boé, E. Maisonnave, and E. Sanchez-Gomez, 2016: Influence of small-scale North Atlantic sea surface temperature patterns on the marine boundary layer and free troposphere: a study using the atmospheric ARPEGE model. Climate Dynamics, 46(5–6), 1699–1717, doi: 10.1007/s00382-015-2669-z.
Pires, G.F. and M.H. Costa, 2013: Deforestation causes different subregional effects on the Amazon bioclimatic equilibrium. Geophysical Research Letters, 40(14), 3618–3623, doi: 10.1002/grl.50570.
Plesca, E., S.A. Buehler, and V. Grützun, 2018: The Fast Response of the Tropical Circulation to CO2 Forcing. Journal of Climate, 31(24), 9903–9920, doi: 10.1175/jcli-d-18-0086.1.
Pokhrel, Y.N., N. Hanasaki, Y. Wada, and H. Kim, 2016: Recent progresses in incorporating human land–water management into global land surface models toward their integration into Earth system models. WIREs Water, 3, 548–574, doi: 10.1002/ wat2.1150.
Pokhrel, Y.N., F. Felfelani, S. Shin, T.J. Yamada, and Y. Satoh, 2017: Modeling large-scale human alteration of land surface hydrology and climate. Geoscience Letters, 4(1), 10, doi: 10.1186/s40562-017-0076-5.
Pokhrel, Y.N. et al., 2015: Incorporation of groundwater pumping in a global Land Surface Model with the representation of human impacts. Water Resources Research, 51(1), 78–96, doi: 10.1002/2014wr015602.
Polade, S.D., D.W. Pierce, D.R. Cayan, A. Gershunov, and M.D. Dettinger, 2014: The key role of dry days in changing regional climate and precipitation regimes. Scientific Reports, 4, 1–8, doi: 10.1038/srep04364.
Polade, S.D., A. Gershunov, D.R. Cayan, M.D. Dettinger, and D.W. Pierce, 2017: Precipitation in a warming world: Assessing projected hydro-climate changes in California and other Mediterranean climate regions. Scientific Reports, 7(1), 10783, doi: 10.1038/s41598-017-11285-y.
Polk, M.H. et al., 2017: Exploring hydrologic connections between tropical mountain wetlands and glacier recession in Peru’s Cordillera Blanca. Applied Geography, 78, 94–103, doi: 10.1016/j.apgeog.2016.11.004.
Polson, D. and G.C. Hegerl, 2017: Strengthening contrast between precipitation in tropical wet and dry regions. Geophysical Research Letters, 44(1), 365–373, doi: 10.1002/2016gl071194.
Polson, D., G.C. Hegerl, and S. Solomon, 2016: Precipitation sensitivity to warming estimated from long island records. Environmental Research Letters, 11(7), 74024, doi: 10.1088/1748-9326/11/7/074024.
Polson, D., G.C. Hegerl, R.P. Allan, and B.B. Sarojini, 2013: Have greenhouse gases intensified the contrast between wet and dry regions?Geophysical Research Letters, 40(17), 4783–4787, doi: 10.1002/grl.50923.
Polson, D., M. Bollasina, G.C. Hegerl, and L.J. Wilcox, 2014: Decreased monsoon precipitation in the Northern Hemisphere due to anthropogenic aerosols. Geophysical Research Letters, 41(16), 6023–6029, doi: 10.1002/2014gl060811.
Polyak, V.J., J.B.T. Rasmussen, and Y. Asmerom, 2004: Prolonged wet period in the southwestern United States through the Younger Dryas. Geology, 32(1), 5, doi: 10.1130/g19957.1.
Pomposi, C., Y. Kushnir, A. Giannini, and M. Biasutti, 2020: Toward Understanding the Occurrence of Both Wet and Dry Sahel Seasons during El Niño: The Modulating Role of the Global Ocean. Journal of Climate, 33(4), 1193–1207, doi: 10.1175/jcli-d-19-0219.1.
Popp, M. and L.G. Silvers, 2017: Double and Single ITCZs with and without Clouds. Journal of Climate, 30(22), 9147–9166, doi: 10.1175/jcli-d-17-0062.1.
Portmann, F.T., P. Döll, S. Eisner, and M. Flörke, 2013: Impact of climate change on renewable groundwater resources: Assessing the benefits of avoided greenhouse gas emissions using selected CMIP5 climate projections. Environmental Research Letters, 8(2), 024023, doi: 10.1088/1748-9326/8/2/024023.
Potter, S.F., E.J. Dawson, and D.M.W. Frierson, 2017: Southern African orography impacts on low clouds and the Atlantic ITCZ in a coupled model. Geophysical Research Letters, 44(7), 3283–3289, doi: 10.1002/2017gl073098.
Pound, M.J. et al., 2014: Late Pliocene lakes and soils: a global data set for the analysis of climate feedbacks in a warmer world. Climate of the Past, 10, 167–180, doi: 10.5194/cp-10-167-2014.
Poveda, G., L. Jaramillo, and L.F. Vallejo, 2014: Seasonal precipitation patterns along pathways of South American low-level jets and aerial rivers. Water Resources Research, 50(3), 98–118, doi: 10.1002/2013wr014087.
Poveda, G. et al., 2020: High Impact Weather Events in the Andes. Frontiers in Earth Science, 8, 1–32, doi: 10.3389/feart.2020.00162.
Power, S.B. and F.P.D. Delage, 2018: El Niño-Southern Oscillation and Associated Climatic Conditions around the World during the Latter Half of the Twenty-First Century. Journal of Climate, 31(15), 6189–6207, doi: 10.1175/jcli-d-18-0138.1.
Prado, L.F., I. Wainer, and C.M. Chiessi, 2013a: Mid-Holocene PMIP3/CMIP5 model results: Intercomparison for the South American Monsoon System. Holocene, 23(12), 1915–1920, doi: 10.1177/0959683613505336.
Prado, L.F., I. Wainer, C.M. Chiessi, M.-P. Ledru, and B. Turcq, 2013b: A mid-Holocene climate reconstruction for eastern South America. Climate of the Past, 9(5), 2117–2133, doi: 10.5194/cp-9-2117-2013.
Prajeesh, A.G., K. Ashok, and D.V.B. Rao, 2013: Falling monsoon depression frequency: A Gray-Sikka conditions perspective. Scientific Reports, 3(1), 2989, doi: 10.1038/srep02989.
Preethi, B., M. Mujumdar, R.H. Kripalani, A. Prabhu, and R. Krishnan, 2017: Recent trends and tele-connections among South and East Asian summer monsoons in a warming environment. Climate Dynamics, 48(7–8), 2489–2505, doi: 10.1007/s00382-016-3218-0.
Prein, A.F. et al., 2015: A review on regional convection-permitting climate modeling: Demonstrations, prospects, and challenges. Reviews of Geophysics, 53(2), 323–361, doi: 10.1002/2014rg000475.
Prein, A.F. et al., 2017: The future intensification of hourly precipitation extremes. Nature Climate Change, 7(1), 48–52, doi: 10.1038/nclimate3168.
Prentice, I.C., X. Liang, B.E. Medlyn, and Y.-P. Wang, 2015: Reliable, robust and realistic: the three R’s of next-generation land-surface modelling. Atmospheric Chemistry and Physics, 15(10), 5987–6005, doi: 10.5194/acp-15-5987-2015.
Prestele, R. et al., 2016: Hotspots of uncertainty in land-use and land-cover change projections: a global-scale model comparison. Global Change Biology, 22(12), 3967–3983, doi: 10.1111/gcb.13337.
Priestley, M.D.K., H.F. Dacre, L.C. Shaffrey, S. Schemm, and J.G. Pinto, 2020a: The role of secondary cyclones and cyclone families for the North Atlantic storm track and clustering over western Europe. Quarterly Journal of the Royal Meteorological Society, 146(728), 1184–1205, doi: 10.1002/qj.3733.
Priestley, M.D.K. et al., 2020b: An Overview of the Extratropical Storm Tracks in CMIP6 Historical Simulations. Journal of Climate, 33(15), 6315–6343, doi: 10.1175/jcli-d-19-0928.1.
Prigent, C., C. Jimenez, and P. Bousquet, 2020: Satellite-Derived Global Surface Water Extent and Dynamics Over the Last 25 Years (GIEMS-2). Journal of Geophysical Research: Atmospheres, 125(3), e2019JD030711, doi: 10.1029/2019jd030711.
Prigent, C., D.P. Lettenmaier, F. Aires, and F. Papa, 2016: Toward a High-Resolution Monitoring of Continental Surface Water Extent and Dynamics, at Global Scale: from GIEMS (Global Inundation Extent from Multi-Satellites) to SWOT (Surface Water Ocean Topography). Surveys in Geophysics, 37(2), 339–355, doi: 10.1007/s10712-015-9339-x.
Pritchard, H.D., 2019: Asia’s shrinking glaciers protect large populations from drought stress. Nature, 569(7758), 649–654, doi: 10.1038/s41586-019-1240-1.
Pritchard, M.S. and D. Yang, 2016: Response of the Superparameterized Madden–Julian Oscillation to Extreme Climate and Basic-State Variation Challenges a Moisture Mode View. Journal of Climate, 29(13), 4995–5008, doi: 10.1175/jcli-d-15-0790.1.
Prospero, J.M., P. Ginoux, O. Torres, S.E. Nicholson, and T.E. Gill, 2002: Environmental characterization of global sources of atmospheric soil dust identified with the Nimbus 7 Total Ozone Mapping Spectrometer (TOMS) absorbing aerosol product. Reviews of Geophysics, 40(1), 2-1–2-31, doi: 10.1029/2000rg000095.
Prudhomme, C. et al., 2014: Hydrological droughts in the 21st century, hotspots and uncertainties from a global multimodel ensemble experiment. Proceedings of the National Academy of Sciences, 111(9), 3262–3267, doi: 10.1073/pnas.1222473110.
Pryor, S.C., R.J. Barthelmie, and T.J. Shepherd, 2020: 20% of US electricity from wind will have limited impacts on system efficiency and regional climate. Scientific Reports, 10(1), 541, doi: 10.1038/s41598-019-57371-1.
Pulliainen, J. et al., 2020: Patterns and trends of Northern Hemisphere snow mass from 1980 to 2018. Nature, 581(7808), 294–298, doi: 10.1038/s41586-020-2258-0.
Qasmi, S., C. Cassou, and J. Boé, 2017: Teleconnection Between Atlantic Multidecadal Variability and European Temperature: Diversity and Evaluation of the Coupled Model Intercomparison Project Phase 5 Models. Geophysical Research Letters, 44(21), 11140–11149, doi: 10.1002/2017gl074886.
Qasmi, S., C. Cassou, and J. Boé, 2020: Teleconnection Processes Linking the Intensity of the Atlantic Multidecadal Variability to the Climate Impacts Over Europe in Boreal Winter. Journal of Climate, 33(7), 2681–2700, doi: 10.1175/jcli-d-19-0428.1.
Qian, C. and T. Zhou, 2014: Multidecadal Variability of North China Aridity and Its Relationship to PDO during 1900–2010. Journal of Climate, 27(3), 1210–1222, doi: 10.1175/jcli-d-13-00235.1.
Qian, Y. et al., 2009: Heavy pollution suppresses light rain in China: Observations and modeling. Journal of Geophysical Research: Atmospheres, 114(D7), D00K02, doi: 10.1029/2008jd011575.
Qin, Y. and Y. Lin, 2018: Alleviated Double ITCZ Problem in the NCAR CESM1: A New Cloud Scheme and the Working Mechanisms. Journal of Advances in Modeling Earth Systems, 10(9), 2318–2332, doi: 10.1029/2018ms001343.
Qiu, B., W. Guo, Y. Xue, and Q. Dai, 2016: Implementation and evaluation of a generalized radiative transfer scheme within canopy in the soil–vegetation–atmosphere transfer (SVAT) model. Journal of Geophysical Research: Atmospheres, 121(20), 12145–12163, doi: 10.1002/2016jd025328.
Rach, O., A. Kahmen, A. Brauer, and D. Sachse, 2017: A dual-biomarker approach for quantification of changes in relative humidity from sedimentary lipid D/H ratios. Climate of the Past, 13(7), 741–757, doi: 10.5194/cp-13-741-2017.
Rachmayani, R., M. Prange, and M. Schulz, 2016: Intra-interglacial climate variability: model simulations of Marine Isotope Stages 1, 5, 11, 13, and 15. Climate of the Past, 12(3), 677–695, doi: 10.5194/cp-12-677-2016.
Radić, V. et al., 2014: Regional and global projections of twenty-first century glacier mass changes in response to climate scenarios from global climate models. Climate Dynamics, 42(1–2), 37–58, doi: 10.1007/s00382-013-1719-7.
Ragettli, S., W.W. Immerzeel, and F. Pellicciotti, 2016: Contrasting climate change impact on river flows from high-altitude catchments in the Himalayan and Andes Mountains. Proceedings of the National Academy of Sciences, 113(33), 9222–9227, doi: 10.1073/pnas.1606526113.
Raible, C.C., M. Messmer, F. Lehner, T.F. Stocker, and R. Blender, 2018: Extratropical cyclone statistics during the last millennium and the 21st century. Climate of the Past, 14(10), 1499–1514, doi: 10.5194/cp-14-1499-2018.
Ralph, F.M. and M.D. Dettinger, 2011: Storms, floods, and the science of atmospheric rivers. Eos, Transactions American Geophysical Union, 92(32), 265–266, doi: 10.1029/2011eo320001.
Ralph, F.M., M.C.L.D. Dettinger, M.M. Cairns, T.J. Galarneau, and J. Eylander, 2018: Defining “Atmospheric river”: How the glossary of meteorology helped resolve a debate. Bulletin of the American Meteorological Society, 99(4), 837–839, doi: 10.1175/bams-d-17-0157.1.
Ralph, F.M. et al., 2016: CalWater Field Studies Designed to Quantify the Roles of Atmospheric Rivers and Aerosols in Modulating U.S. West Coast Precipitation in a Changing Climate. Bulletin of the American Meteorological Society, 97(7), 1209–1228, doi: 10.1175/bams-d-14-00043.1.
Ramarao, M.V.S., R. Krishnan, J. Sanjay, and T.P. Sabin, 2015: Understanding land surface response to changing South Asian monsoon in a warming climate. Earth System Dynamics, 6(2), 569–582, doi: 10.5194/esd-6-569-2015.
Ramarao, M.V.S. et al., 2019: On observed aridity changes over the semiarid regions of India in a warming climate. Theoretical and Applied Climatology, 136(1–2), 693–702, doi: 10.1007/s00704-018-2513-6.
Ramos, A.M., R. Tomé, R.M. Trigo, M.L.R. Liberato, and J.G. Pinto, 2016: Projected changes in atmospheric rivers affecting Europe in CMIP5 models. Geophysical Research Letters, 43(17), 9315–9323, doi: 10.1002/2016gl070634.
Ramos, A.M. et al., 2019: From Amazonia to southern Africa: atmospheric moisture transport through low-level jets and atmospheric rivers. Annals of the New York Academy of Sciences, 1436(1), 217–230, doi: 10.1111/nyas.13960.
Ramsar Convention on Wetlands, 2018: Global Wetland Outlook: State of the World’s Wetlands and their Services to People. Ramsar Convention Secretariat, Gland, Switzerland, 84 pp, https://medwet.org/wp-content/uploads/2018/09/ramsar_gwo_english_web.pdf .
Rasmussen, K.L., A.F. Prein, R.M. Rasmussen, K. Ikeda, and C. Liu, 2020: Changes in the convective population and thermodynamic environments in convection-permitting regional climate simulations over the United States. Climate Dynamics, 55(1–2), 383–408, doi: 10.1007/s00382-017-4000-7.
Rathore, S., N.L. Bindoff, C.C. Ummenhofer, H.E. Phillips, and M. Feng, 2020: Near-Surface Salinity Reveals the Oceanic Sources of Moisture for Australian Precipitation through Atmospheric Moisture Transport. Journal of Climate, 33(15), 6707–6730, doi: 10.1175/jcli-d-19-0579.1.
Ratna, S.B., A. Cherchi, T.J. Osborn, M. Joshi, and U. Uppara, 2021: The Extreme Positive Indian Ocean Dipole of 2019 and Associated Indian Summer Monsoon Rainfall Response. Geophysical Research Letters, 48(2), e2020GL091497, doi: 10.1029/2020gl091497.
Rauber, R.M. et al., 2019: Wintertime Orographic Cloud Seeding – A Review. Journal of Applied Meteorology and Climatology, 58(10), 2117–2140, doi: 10.1175/jamc-d-18-0341.1.
Rauniyar, S.P. and S.B. Power, 2020: The Impact of Anthropogenic Forcing and Natural Processes on Past, Present, and Future Rainfall over Victoria, Australia. Journal of Climate, 33(18), 8087–8106, doi: 10.1175/jcli-d-19-0759.1.
Reboita, M.S., R.P. da Rocha, C.G. Dias, and R.Y. Ynoue, 2014: Climate Projections for South America: RegCM3 Driven by HadCM3 and ECHAM5. Advances in Meteorology, 2014, 376738, doi: 10.1155/2014/376738.
Reboita, M.S., R.P. da Rocha, T. Ambrizzi, and C.D. Gouveia, 2015: Trend and teleconnection patterns in the climatology of extratropical cyclones over the Southern Hemisphere. Climate Dynamics, 45(7–8), 1929–1944, doi: 10.1007/s00382-014-2447-3.
Rehfeld, K., R. Hébert, J.M. Lora, M. Lofverstrom, and C.M. Brierley, 2020: Variability of surface climate in simulations of past and future. Earth System Dynamics, 11(2), 447–468, doi: 10.5194/esd-11-447-2020.
Reimi, M.A. and F. Marcantonio, 2016: Constraints on the magnitude of the deglacial migration of the ITCZ in the Central Equatorial Pacific Ocean. Earth and Planetary Science Letters, 453, 1–8, doi: 10.1016/j.epsl.2016.07.058.
Reintges, A., T. Martin, M. Latif, and N.S. Keenlyside, 2017: Uncertainty in twenty-first century projections of the Atlantic Meridional Overturning Circulation in CMIP3 and CMIP5 models. Climate Dynamics, 49(5–6), 1495–1511, doi: 10.1007/s00382-016-3180-x.
Renssen, H., H. Goosse, D.M. Roche, and H. Seppä, 2018: The global hydroclimate response during the Younger Dryas event. Quaternary Science Reviews, 193, 84–97, doi: 10.1016/j.quascirev.2018.05.033.
Rhoades, A.M., A.D. Jones, and P.A. Ullrich, 2018: The Changing Character of the California Sierra Nevada as a Natural Reservoir. Geophysical Research Letters, 45(23), 13008–13019, doi: 10.1029/2018gl080308.
Richardson, D., H.J. Fowler, C.G. Kilsby, and R. Neal, 2018: A new precipitation and drought climatology based on weather patterns. International Journal of Climatology, 38(2), 630–648, doi: 10.1002/joc.5199.
Richardson, T.B., P.M. Forster, T. Andrews, and D.J. Parker, 2016: Understanding the rapid precipitation response to CO2 and aerosol forcing on a regional scale. Journal of Climate, 29(2), 583–594, doi: 10.1175/jcli-d-15-0174.1.
Richardson, T.B. et al., 2018a: Drivers of Precipitation Change: An Energetic Understanding. Journal of Climate, 31(23), 9641–9657, doi: 10.1175/jcli-d-17-0240.1.
Richardson, T.B. et al., 2018b: Carbon Dioxide Physiological Forcing Dominates Projected Eastern Amazonian Drying. Geophysical Research Letters, 45(6), 2815–2825, doi: 10.1002/2017gl076520.
Ridley, H.E. et al., 2015: Aerosol forcing of the position of the intertropical convergence zone since AD 1550. Nature Geoscience, 8(3), 195–200, doi: 10.1038/ngeo2353.
Rifai, S.W., S. Li, and Y. Malhi, 2019: Coupling of El Niño events and long-term warming leads to pervasive climate extremes in the terrestrial tropics. Environmental Research Letters, 14(10), 105002, doi: 10.1088/1748-9326/ab402f .
Rinke, A. et al., 2019: Trends of vertically integrated water vapor over the Arctic during 1979–2016: Consistent moistening all over?Journal of Climate, 32(18), 6097–6116, doi: 10.1175/jcli-d-19-0092.1.
Risser, M.D. and M.F. Wehner, 2017: Attributable Human-Induced Changes in the Likelihood and Magnitude of the Observed Extreme Precipitation during Hurricane Harvey. Geophysical Research Letters, 44(24), 412–457, doi: 10.1002/2017gl075888.
Rivera, J.A., D.C. Araneo, O.C. Penalba, and R. Villalba, 2018: Regional aspects of streamflow droughts in the Andean rivers of Patagonia, Argentina. Links with large-scale climatic oscillations. Hydrology Research, 49(1), 134–149, doi: 10.2166/nh.2017.207.
Roberts, M.J. et al., 2015: Tropical cyclones in the UPSCALE ensemble of high-resolution global climate models. Journal of Climate, 28(2), 574–596, doi: 10.1175/jcli-d-14-00131.1.
Roberts, M.J. et al., 2018: The Benefits of Global High Resolution for Climate Simulation: Process Understanding and the Enabling of Stakeholder Decisions at the Regional Scale. Bulletin of the American Meteorological Society, 99(11), 2341–2359, doi: 10.1175/bams-d-15-00320.1.
Roberts, M.J. et al., 2020: Projected Future Changes in Tropical Cyclones Using the CMIP6 HighResMIP Multimodel Ensemble. Geophysical Research Letters, 47(14), 1–12, doi: 10.1029/2020gl088662.
Robertson, A.W. et al., 2011: The Maritime Continent Monsoon. In: The Global Monsoon System: Research and Forecast (2nd Edition)[Chang, C.-P., Y. Ding, N.-C. Lau, R.H. Johnson, B. Wang, and T. Yasunari (eds.)]. World Scientific, Singapore, pp. 85–98, doi: 10.1142/9789814343411_0006.
Robertson, F.R., M.G. Bosilovich, and J.B. Roberts, 2016: Reconciling Land–Ocean Moisture Transport Variability in Reanalyses with P – ET in Observationally Driven Land Surface Models. Journal of Climate, 29(23), 8625–8646, doi: 10.1175/jcli-d-16-0379.1.
Robertson, F.R. et al., 2014: Consistency of Estimated Global Water Cycle Variations over the Satellite Era. Journal of Climate, 27(16), 6135–6154, doi: 10.1175/jcli-d-13-00384.1.
Robertson, F.R. et al., 2020: Uncertainties in ocean latent heat flux variations over recent decades in satellite-based estimates and reduced observation reanalyses. Journal of Climate, 33(19), 8415–8437, doi: 10.1175/jcli-d-19-0954.1.
Robeson, S.M., 2015: Revisiting the recent California drought as an extreme value. Geophysical Research Letters, 42(16), 6771–6779, doi: 10.1002/2015gl064593.
Robock, A., L. Oman, and G.L. Stenchikov, 2008: Regional climate responses to geoengineering with tropical and Arctic SO2 injections. Journal of Geophysical Research: Atmospheres, 113(D16), D16101, doi: 10.1029/2008jd010050.
Roca, R., 2019: Estimation of extreme daily precipitation thermodynamic scaling using gridded satellite precipitation products over tropical land. Environmental Research Letters, 14(9), 95009, doi: 10.1088/1748-9326/ab35c6.
Roca, R. and T. Fiolleau, 2020: Extreme precipitation in the tropics is closely associated with long-lived convective systems. Communications Earth & Environment, 1(1), 18, doi: 10.1038/s43247-020-00015-4.
Rochetin, N., F. Couvreux, J.Y. Grandpeix, and C. Rio, 2014a: Deep convection triggering by boundary layer thermals. Part I: LES analysis and stochastic triggering formulation. Journal of the Atmospheric Sciences, 71(2), 496–514, doi: 10.1175/jas-d-12-0336.1.
Rochetin, N., J.-Y. Grandpeix, C. Rio, and F. Couvreux, 2014b: Deep convection triggering by boundary layer thermals. Part II: Stochastic triggering parameterization for the LMDZ GCM. Journal of the Atmospheric Sciences, 71(2), 515–538.
Rodell, M., I. Velicogna, and J.S. Famiglietti, 2009: Satellite-based estimates of groundwater depletion in India. Nature, 460(7258), 999–1002, doi: 10.1038/nature08238.
Rodell, M. et al., 2015: The observed state of the water cycle in the early twenty-first century. Journal of Climate, 28(21), 8289–8318, doi: 10.1175/jcli-d-14-00555.1.
Rodell, M. et al., 2018: Emerging trends in global freshwater availability. Nature, 557(7707), 651–659, doi: 10.1038/s41586-018-0123-1.
Roderick, M.L., F. Sun, W.H. Lim, and G.D. Farquhar, 2014: A general framework for understanding the response of the water cycle to global warming over land and ocean. Hydrology and Earth System Sciences, 18(5), 1575–1589, doi: 10.5194/hess-18-1575-2014.
Rodríguez-Fonseca, B. et al., 2015: Variability and predictability of west African droughts: A review on the role of sea surface temperature anomalies. Journal of Climate, 28(10), 4034–4060, doi: 10.1175/jcli-d-14-00130.1.
Roehrig, R., D. Bouniol, F. Guichard, F. Hourdin, and J.-L. Redelsperger, 2013: The Present and Future of the West African Monsoon: A Process-Oriented Assessment of CMIP5 Simulations along the AMMA Transect. Journal of Climate, 26(17), 6471–6505, doi: 10.1175/jcli-d-12-00505.1.
Roehrig, R. et al., 2020: The CNRM Global Atmosphere Model ARPEGE-Climat 6.3: Description and Evaluation. Journal of Advances in Modeling Earth Systems, 12(7), 1–53, doi: 10.1029/2020ms002075.
Rojas, M., P.A. Arias, V. Flores-Aqueveque, A. Seth, and M. Vuille, 2016: The South American monsoon variability over the last millennium in climate models. Climate of the Past, 12(8), 1681–1691, doi: 10.5194/cp-12-1681-2016.
Romps, D.M., 2016: Clausius–Clapeyron Scaling of CAPE from Analytical Solutions to RCE. Journal of the Atmospheric Sciences, 73(9), 3719–3737, doi: 10.1175/jas-d-15-0327.1.
Ronchail, J. et al., 2018: The flood recession period in Western Amazonia and its variability during the 1985–2015 period. Journal of Hydrology: Regional Studies, 15, 16–30, doi: 10.1016/j.ejrh.2017.11.008.
Rosenfeld, D., 2000: Suppression of rain and snow by urban and industrial air pollution. Science, 287(5459), 1793–1796, doi: 10.1126/science.287. 5459.1793.
Rosenfeld, D. et al., 2008: Flood or Drought: How Do Aerosols Affect Precipitation?Science, 321(5894), 1309–1313, doi: 10.1126/science.1160606.
Rosenfeld, D. et al., 2019: Aerosol-driven droplet concentrations dominate coverage and water of oceanic low-level clouds. Science, 363(6427), eaav0566, doi: 10.1126/science.aav0566.
Rotstayn, L.D., M.A. Collier, and J.- Luo, 2015: Effects of declining aerosols on projections of zonally averaged tropical precipitation. Environmental Research Letters, 10(4), 044018, doi: 10.1088/1748-9326/10/4/044018.
Rotstayn, L.D., U. Lohmann, L.D. Rotstayn, and U. Lohmann, 2002: Tropical Rainfall Trends and the Indirect Aerosol Effect. Journal of Climate, 15(15), 2103–2116, doi: 10.1175/1520-0442(2002)015<2103:trtati>2.0.co;2.
Rotstayn, L.D., M.A. Collier, A. Chrastansky, S.J. Jeffrey, and J.-J. Luo, 2013: Projected effects of declining aerosols in RCP4.5: unmasking global warming?Atmospheric Chemistry and Physics, 13(21), 10883–10905, doi: 10.5194/acp-13-10883-2013.
Rotstayn, L.D. et al., 2012: Aerosol- and greenhouse gas-induced changes in summer rainfall and circulation in the Australasian region: a study using single-forcing climate simulations. Atmospheric Chemistry and Physics, 12(14), 6377–6404, doi: 10.5194/acp-12-6377-2012.
Roundy, J.K. and J.A. Santanello, 2017: Utility of Satellite Remote Sensing for Land–Atmosphere Coupling and Drought Metrics. Journal of Hydrometeorology, 18(3), 863–877, doi: 10.1175/jhm-d-16-0171.1.
Rowell, D.P., 2012: Sources of uncertainty in future changes in local precipitation. Climate Dynamics, 39(7–8), 1929–1950, doi: 10.1007/s00382-011-1210-2.
Rowell, D.P., B.B.B. Booth, S.E. Nicholson, and P. Good, 2015: Reconciling past and future rainfall trends over East Africa. Journal of Climate, 28(24), 9768–9788, doi: 10.1175/jcli-d-15-0140.1.
Roxy, M.K. et al., 2015: Drying of Indian subcontinent by rapid Indian ocean warming and a weakening land–sea thermal gradient. Nature Communications, 6(1), 7423, doi: 10.1038/ncomms8423.
Roxy, M.K. et al., 2017: A threefold rise in widespread extreme rain events over central India. Nature Communications, 8(1), 708, doi: 10.1038/s41467-017-00744-9.
Roxy, M.K. et al., 2019: Twofold expansion of the Indo-Pacific warm pool warps the MJO life cycle. Nature, 575(7784), 647–651, doi: 10.1038/s41586-019-1764-4.
Roy, I., R.G. Tedeschi, and M. Collins, 2019: ENSO teleconnections to the Indian summer monsoon under changing climate. International Journal of Climatology, 39(6), 3031–3042, doi: 10.1002/joc.5999.
Ruiz-Vásquez, M., P.A. Arias, J.A. Martínez, and J.C. Espinoza, 2020: Effects of Amazon basin deforestation on regional atmospheric circulation and water vapor transport towards tropical South America. Climate Dynamics, 54(9–10), 4169–4189, doi: 10.1007/s00382-020-05223-4.
Ruosteenoja, K., T. Markkanen, A. Venäläinen, P. Räisänen, and H. Peltola, 2018: Seasonal soil moisture and drought occurrence in Europe in CMIP5 projections for the 21st century. Climate Dynamics, 50(3–4), 1177–1192, doi: 10.1007/s00382-017-3671-4.
Rupp, D.E., J.T. Abatzoglou, K.C. Hegewisch, and P.W. Mote, 2013: Evaluation of CMIP5 20th century climate simulations for the Pacific Northwest USA. Journal of Geophysical Research: Atmospheres, 118(19), 10884–10906, doi: 10.1002/jgrd.50843.
Ruprich-Robert, Y. et al., 2017: Assessing the Climate Impacts of the Observed Atlantic Multidecadal Variability Using the GFDL CM2.1 and NCAR CESM1 Global Coupled Models. Journal of Climate, 30(8), 2785–2810, doi: 10.1175/jcli-d-16-0127.1.
Sabin, T.P. et al., 2013: High resolution simulation of the South Asian monsoon using a variable resolution global climate model. Climate Dynamics, 41(1), 173–194, doi: 10.1007/s00382-012-1658-8.
Saffioti, C., E.M. Fischer, S.C. Scherrer, and R. Knutti, 2016: Reconciling observed and modeled temperature and precipitation trends over Europe by adjusting for circulation variability. Geophysical Research Letters, 43(15), 8189–8198, doi: 10.1002/2016gl069802.
Saha, A., S. Ghosh, A.S. Sahana, and E.P. Rao, 2014: Failure of CMIP5 climate models in simulating post-1950 decreasing trend of Indian monsoon. Geophysical Research Letters, 41(20), 7323–7330, doi: 10.1002/2014gl061573.
Sahany, S., S.K. Mishra, R. Pathak, and B. Rajagopalan, 2018: Spatiotemporal Variability of Seasonality of Rainfall Over India. Geophysical Research Letters, 45(14), 7140–7147, doi: 10.1029/2018gl077932.
Sahoo, G.B. et al., 2016: Climate change impacts on lake thermal dynamics and ecosystem vulnerabilities. Limnology and Oceanography, 61(2), 496–507, doi: 10.1002/lno.10228.
Saide, P.E. et al., 2015: Central American biomass burning smoke can increase tornado severity in the U.S. Geophysical Research Letters, 42(3), 956–965, doi: 10.1002/2014gl062826.
Saint-Lu, M. et al., 2020: Influences of local and remote conditions on tropical precipitation and its response to climate change. Journal of Climate, 33(10), 4045–4063, doi: 10.1175/jcli-d-19-0450.1.
Sakschewski, B. et al., 2016: Resilience of Amazon forests emerges from plant trait diversity. Nature Climate Change, 6(11), 1032–1036, doi: 10.1038/nclimate3109.
Salazar, J.F. et al., 2018: Scaling properties reveal regulation of river flows in the Amazon through a “forest reservoir”. Hydrology and Earth System Sciences, 22(3), 1735–1748, doi: 10.5194/hess-22-1735-2018.
Salinger, M.J., S. McGree, F. Beucher, S.B. Power, and F. Delage, 2014: A new index for variations in the position of the South Pacific convergence zone 1910/11–2011/2012. Climate Dynamics, 43(3), 881–892, doi: 10.1007/s00382-013-2035-y.
Salzmann, M., 2016: Global warming without global mean precipitation increase’. Science Advances, 2(6), e1501572, doi: 10.1126/sciadv.1501572.
Salzmann, M., H. Weser, and R. Cherian, 2014: Robust response of Asian summer monsoon to anthropogenic aerosols in CMIP5 models. Journal of Geophysical Research: Atmospheres, 119(19), 11321–11337, doi: 10.1002/2014jd021783.
Samaniego, L. et al., 2017: Propagation of forcing and model uncertainties on to hydrological drought characteristics in a multi-model century-long experiment in large river basins. Climatic Change, 141(3), 435–449, doi: 10.1007/s10584-016-1778-y.
Samanta, D., K.B. Karnauskas, and N.F. Goodkin, 2019: Tropical Pacific SST and ITCZ Biases in Climate Models: Double Trouble for Future Rainfall Projections?Geophysical Research Letters, 46(4), 2242–2252, doi: 10.1029/2018gl081363.
Samanta, D., B. Rajagopalan, K.B. Karnauskas, L. Zhang, and N.F. Goodkin, 2020: La Niña’s Diminishing Fingerprint on the Central Indian Summer Monsoon. Geophysical Research Letters, 47(2), e2019GL086237, doi: 10.1029/2019gl086237.
Samset, B.H. et al., 2016: Fast and slow precipitation responses to individual climate forcers: A PDRMIP multimodel study. Geophysical Research Letters, 43(6), 2782–2791, doi: 10.1002/2016gl068064.
Samset, B.H. et al., 2018a: Weak hydrological sensitivity to temperature change over land, independent of climate forcing. npj Climate and Atmospheric Science, 1(1), 3, doi: 10.1038/s41612-017-0005-5.
Samset, B.H. et al., 2018b: Climate Impacts From a Removal of Anthropogenic Aerosol Emissions. Geophysical Research Letters, 45(2), 1020–1029, doi: 10.1002/2017gl076079.
Sanap, S.D., G. Pandithurai, and M.G. Manoj, 2015: On the response of Indian summer monsoon to aerosol forcing in CMIP5 model simulations. Climate Dynamics, 45(9–10), 2949–2961, doi: 10.1007/s00382-015-2516-2.
Sánchez, E. et al., 2015: Regional climate modelling in CLARIS-LPB: a concerted approach towards twentyfirst century projections of regional temperature and precipitation over South America. Climate Dynamics, 45(7), 2193–2212, doi: 10.1007/s00382-014-2466-0.
Sand, M., B.H. Samset, K. Tsigaridis, S.E. Bauer, and G. Myhre, 2020: Black Carbon and Precipitation: An Energetics Perspective. Journal of Geophysical Research: Atmospheres, 125(13), e2019JD032239, doi: 10.1029/2019jd032239.
Sandeep, N. et al., 2020: South Asian monsoon response to weakening of Atlantic meridional overturning circulation in a warming climate. Climate Dynamics, 54(7–8), 3507–3524, doi: 10.1007/s00382-020-05180-y.
Sandeep, S. and R.S. Ajayamohan, 2015: Poleward shift in Indian summer monsoon low level jetstream under global warming. Climate Dynamics, 45(1–2), 337–351, doi: 10.1007/s00382-014-2261-y.
Sandeep, S. and R.S. Ajayamohan, 2018: Modulation of Winter Precipitation Dynamics Over the Arabian Gulf by ENSO. Journal of Geophysical Research: Atmospheres, 123(1), 198–210, doi: 10.1002/2017jd027263.
Sandeep, S., F. Stordal, P.D. Sardeshmukh, and G.P. Compo, 2014: Pacific Walker Circulation variability in coupled and uncoupled climate models. Climate Dynamics, 43(1–2), 103–117, doi: 10.1007/s00382-014-2135-3.
Sandeep, S., R.S. Ajayamohan, W.R. Boos, T.P. Sabin, and V. Praveen, 2018: Decline and poleward shift in Indian summer monsoon synoptic activity in a warming climate. Proceedings of the National Academy of Sciences, 115(11), 2681–2686, doi: 10.1073/pnas.1709031115.
Sandler, D. and N. Harnik, 2020: Future wintertime meridional wind trends through the lens of subseasonal teleconnections. Weather and Climate Dynamics, 1(2), 427–443, doi: 10.5194/wcd-1-427-2020.
Sandvik, M.I., A. Sorteberg, and R. Rasmussen, 2018: Sensitivity of historical orographically enhanced extreme precipitation events to idealized temperature perturbations. Climate Dynamics, 50(1–2), 143–157, doi: 10.1007/s00382-017-3593-1.
Sanogo, S. et al., 2015: Spatio-temporal characteristics of the recent rainfall recovery in West Africa. International Journal of Climatology, 35(15), 4589–4605, doi: 10.1002/joc.4309.
Santanello, J.A. et al., 2018: Land–Atmosphere Interactions: The LoCo Perspective. Bulletin of the American Meteorological Society, 99(6), 1253–1272, doi: 10.1175/bams-d-17-0001.1.
Santer, B.D. and T.M.L. Wigley, 1990: Regional validation of means, variances, and spatial patterns in general circulation model control runs. Journal of Geophysical Research: Atmospheres, 95(D1), 829, doi: 10.1029/jd095id01p00829.
Santolaria-Otín, M. and O. Zolina, 2020: Evaluation of snow cover and snow water equivalent in the continental Arctic in CMIP5 models. Climate Dynamics, 55(11), 2993–3016, doi: 10.1007/s00382-020-05434-9.
Sarangi, C., S.N. Tripathi, V.P. Kanawade, I. Koren, and D.S. Pai, 2017: Investigation of the aerosol–cloud–rainfall association over the Indian summer monsoon region. Atmospheric Chemistry and Physics, 17(8), 5185–5204, doi: 10.5194/acp-17-5185-2017.
Sarangi, C., S.N. Tripathi, Y. Qian, S. Kumar, and L. Ruby Leung, 2018: Aerosol and Urban Land Use Effect on Rainfall Around Cities in Indo-Gangetic Basin From Observations and Cloud Resolving Model Simulations. Journal of Geophysical Research: Atmospheres, 123(7), 3645–3667, doi: 10.1002/2017jd028004.
Sarojini, B.B., P.A. Stott, and E. Black, 2016: Detection and attribution of human influence on regional precipitation. Nature Climate Change, 6(7), 669–675, doi: 10.1038/nclimate2976.
Saunois, M. et al., 2016: The global methane budget 2000–2012. Earth System Science Data, 8(2), 697–751, doi: 10.5194/essd-8-697-2016.
Saurral, R.I., I.I.A. Camilloni, and V.R. Barros, 2017: Low-frequency variability and trends in centennial precipitation stations in southern South America. International Journal of Climatology, 37, 1774–1793, doi: 10.1002/joc.4810.
Scaff, L. et al., 2020: Simulating the convective precipitation diurnal cycle in North America’s current and future climate. Climate Dynamics, 55(1), 369–382, doi: 10.1007/s00382-019-04754-9.
Scanlon, B.R. et al., 2012: Groundwater depletion and sustainability of irrigation in the US High Plains and Central Valley. Proceedings of the National Academy of Sciences, 109(24), 9320–9325, doi: 10.1073/pnas.1200311109.
Scanlon, B.R. et al., 2018: Global models underestimate large decadal declining and rising water storage trends relative to GRACE satellite data. Proceedings of the National Academy of Sciences, 115(6), E1080–E1089, doi: 10.1073/pnas.1704665115.
Scanlon, B.R. et al., 2019: Tracking Seasonal Fluctuations in Land Water Storage Using Global Models and GRACE Satellites. Geophysical Research Letters, 46(10), 5254–5264, doi: 10.1029/2018gl081836.
Scheff, J. and D.M.W. Frierson, 2012: Robust future precipitation declines in CMIP5 largely reflect the poleward expansion of model subtropical dry zones. Geophysical Research Letters, 39(17), L18704, doi: 10.1029/2012gl052910.
Scheff, J. and D.M.W. Frierson, 2014: Scaling potential evapotranspiration with greenhouse warming. Journal of Climate, 27(4), 1539–1558, doi: 10.1175/jcli-d-13-00233.1.
Scheff, J. and D.M.W. Frierson, 2015: Terrestrial aridity and its response to greenhouse warming across CMIP5 climate models. Journal of Climate, 28(14), 5583–5600, doi: 10.1175/jcli-d-14-00480.1.
Scheff, J., R. Seager, H. Liu, and S. Coats, 2017: Are glacials dry? Consequences for paleoclimatology and for greenhouse warming. Journal of Climate, 30(17), 6593–6609, doi: 10.1175/jcli-d-16-0854.1.
Schemm, S., 2018: Regional Trends in Weather Systems Help Explain Antarctic Sea Ice Trends. Geophysical Research Letters, 45(14), 7165–7175, doi: 10.1029/2018gl079109.
Schemm, S., M. Sprenger, and H. Wernli, 2018: When during Their Life Cycle Are Extratropical Cyclones Attended by Fronts?Bulletin of the American Meteorological Society, 99(1), 149–165, doi: 10.1175/bams-d-16-0261.1.
Schepanski, K., 2018: Transport of Mineral Dust and Its Impact on Climate. Geosciences, 8(5), 151, doi: 10.3390/geosciences8050151.
Schewe, J. and A. Levermann, 2017: Non-linear intensification of Sahel rainfall as a possible dynamic response to future warming. Earth System Dynamics, 8(3), 495–505, doi: 10.5194/esd-8-495-2017.
Schewe, J. et al., 2014: Multimodel assessment of water scarcity under climate change. Proceedings of the National Academy of Sciences, 111(9), 3245–3250, doi: 10.1073/pnas.1222460110.
Schiemann, R. et al., 2017: The resolution sensitivity of Northern Hemisphere blocking in four 25-km atmospheric global circulation models. Journal of Climate, 30(1), 337–358, doi: 10.1175/jcli-d-16-0100.1.
Schleussner, C.-F. et al., 2016: Differential climate impacts for policy-relevant limits to global warming: the case of 1.5°C and 2°C. Earth System Dynamics, 7(2), 327–351, doi: 10.5194/esd-7-327-2016.
Schmid, P.E. and D. Niyogi, 2017: Modeling urban precipitation modification by spatially heterogeneous aerosols. Journal of Applied Meteorology and Climatology, 56(8), 2141–2153, doi: 10.1175/jamc-d-16-0320.1.
Schmidt, D.F. and K.M. Grise, 2017: The Response of Local Precipitation and Sea Level Pressure to Hadley Cell Expansion. Geophysical Research Letters, 44(20), 10573–10582, doi: 10.1002/2017gl075380.
Schneider, T., P.A. O’Gorman, and X.J. Levine, 2010: Water vapor and the dynamics of climate changes. Reviews of Geophysics, 48(1), 1–22, doi: 10.1029/2009rg000302.
Schneider, T., T. Bischoff, and G.H. Haug, 2014: Migrations and dynamics of the intertropical convergence zone. Nature, 513(7516), 45–53, doi: 10.1038/nature13636.
Schröder, M. et al., 2019: The GEWEX Water Vapor Assessment: Overview and Introduction to Results and Recommendations. Remote Sensing, 11, 1–28, doi: 10.3390/rs11030251.
Schubert, J.J., B. Stevens, and T. Crueger, 2013: Madden–Julian oscillation as simulated by the MPI Earth System Model: Over the last and into the next millennium. Journal of Advances in Modeling Earth Systems, 5(1), 71–84, doi: 10.1029/2012ms000180.
Schubert, S.D., H. Wang, R.D. Koster, M.J. Suarez, and P.Y. Groisman, 2014: Northern Eurasian heat waves and droughts. Journal of Climate, 27, 3169–3207, doi: 10.1175/jcli-d-13-00360.1.
Schubert, S.D. et al., 2016: Global Meteorological Drought: A Synthesis of Current Understanding with a Focus on SST Drivers of Precipitation Deficits. Journal of Climate, 29(11), 3989–4019, doi: 10.1175/jcli-d-15-0452.1.
Schuerch, M. et al., 2018: Future response of global coastal wetlands to sea-level rise. Nature, 561(7722), 231–234, doi: 10.1038/s41586-018-0476-5.
Schurer, A.P., A.P. Ballinger, A.R. Friedman, and G.C. Hegerl, 2020: Human influence strengthens the contrast between tropical wet and dry regions. Environmental Research Letters, 15(10), 104026, doi: 10.1088/1748-9326/ab83ab.
Scoccimarro, E. et al., 2015: Projected changes in intense precipitation over Europe at the daily and subdaily time scales. Journal of Climate, 28(15), 6193–6203, doi: 10.1175/jcli-d-14-00779.1.
Screen, J.A. and I. Simmonds, 2013a: Caution needed when linking weather extremes to amplified planetary waves. Proceedings of the National Academy of Sciences, 110(26), E2327–E2327, doi: 10.1073/pnas.1304867110.
Screen, J.A. and I. Simmonds, 2013b: Exploring links between Arctic amplification and mid-latitude weather. Geophysical Research Letters, 40(5), 959–964, doi: 10.1002/grl.50174.
Screen, J.A. and I. Simmonds, 2014: Amplified mid-latitude planetary waves favour particular regional weather extremes. Nature Climate Change, 4(8), 704–709, doi: 10.1038/nclimate2271.
Screen, J.A., T.J. Bracegirdle, and I. Simmonds, 2018: Polar Climate Change as Manifest in Atmospheric Circulation. Current Climate Change Reports, 4(4), 383–395, doi: 10.1007/s40641-018-0111-4.
Seager, R. et al., 2014a: Causes of Increasing Aridification of the Mediterranean Region in Response to Rising Greenhouse Gases. Journal of Climate, 27(12), 4655–4676, doi: 10.1175/jcli-d-13-00446.1.
Seager, R. et al., 2014b: Dynamical and Thermodynamical Causes of Large-Scale Changes in the Hydrological Cycle over North America in Response to Global Warming. Journal of Climate, 27(20), 7921–7948, doi: 10.1175/jcli-d-14-00153.1.
Seager, R. et al., 2019a: Strengthening tropical Pacific zonal sea surface temperature gradient consistent with rising greenhouse gases. Nature Climate Change, 9(7), 517–522, doi: 10.1038/s41558-019-0505-x.
Seager, R. et al., 2019b: Climate Variability and Change of Mediterranean-Type Climates. Journal of Climate, 32(10), 2887–2915, doi: 10.1175/jcli-d-18-0472.1.
Segura, H. et al., 2020: Recent changes in the precipitation-driving processes over the southern tropical Andes/western Amazon. Climate Dynamics, 54(5–6), 2613–2631, doi: 10.1007/s00382-020-05132-6.
Seiler, C., R.W.A. Hutjes, and P. Kabat, 2013: Climate Variability and Trends in Bolivia. Journal of Applied Meteorology and Climatology, 52(1), 130–146, doi: 10.1175/jamc-d-12-0105.1.
Semenov, V.A. and M. Latif, 2015: Nonlinear winter atmospheric circulation response to Arctic sea ice concentration anomalies for different periods during 1966–2012. Environmental Research Letters, 10(5), 054020, doi: 10.1088/1748-9326/10/5/054020.
Sena, A.C.T. and G. Magnusdottir, 2020: Projected End-of-Century Changes in the South American Monsoon in the CESM Large Ensemble. Journal of Climate, 33(18), 7859–7874, doi: 10.1175/jcli-d-19-0645.1.
Seneviratne, S.I. et al., 2012: Changes in Climate Extremes and their Impacts on the Natural Physical Environment. In: Managing the Risks of Extreme Events and Disasters to Advance Climate Change Adaptation. A Special Report of Working Groups I and II of the Intergovernmental Panel on Climate Change[Field, C.B., V. Barros, T.F. Stocker, D. Qin, D.J. Dokken, K.L. Ebi, M.D. Mastrandrea, K.J. Mach, G.-K. Plattner, S.K. Allen, M. Tignor, and P.M. Midgley (eds.)]. Cambridge University Press, Cambridge, United Kingdom and New York, NY, USA, pp. 109–230, doi: 10.1017/cbo9781139177245.006.
Seo, K.-H., D.M.W. Frierson, and J.-H. Son, 2014: A mechanism for future changes in Hadley circulation strength in CMIP5 climate change simulations. Geophysical Research Letters, 41(14), 5251–5258, doi: 10.1002/2014gl060868.
Seth, A. et al., 2013: CMIP5 Projected Changes in the Annual Cycle of Precipitation in Monsoon Regions. Journal of Climate, 26(19), 7328–7351, doi: 10.1175/jcli-d-12-00726.1.
Seth, A. et al., 2019: Monsoon Responses to Climate Changes-Connecting Past, Present and Future. Current Climate Change Reports, 5(2), 63–79, doi: 10.1007/s40641-019-00125-y.
Seviour, W.J.M., S.M. Davis, K.M. Grise, and D.W. Waugh, 2018: Large Uncertainty in the Relative Rates of Dynamical and Hydrological Tropical Expansion. Geophysical Research Letters, 45(2), 1106–1113, doi: 10.1002/2017gl076335.
Shakun, J.D. et al., 2007: A high-resolution, absolute-dated deglacial speleothem record of Indian Ocean climate from Socotra Island, Yemen. Earth and Planetary Science Letters, 259(3–4), 442–456, doi: 10.1016/j.epsl.2007.05.004.
Shamsudduha, M. and R.G. Taylor, 2020: Groundwater storage dynamics in the world’s large aquifer systems from GRACE: uncertainty and role of extreme precipitation. Earth System Dynamics, 11(3), 755–774, doi: 10.5194/esd-11-755-2020.
Shanahan, T.M. et al., 2015: The time-transgressive termination of the African Humid Period. Nature Geoscience, 8(2), 140–144, doi: 10.1038/ngeo2329.
Shang, H.U.A., M. Xu, F.E.N. Zhao, and S.B. Tijjani, 2019: Spatial and Temporal Variations in Precipitation Amount, Frequency, Intensity, and Persistence in China, 1973–2016. Journal of Hydrometeorology, 20(11), 2215–2227, doi: 10.1175/jhm-d-19-0032.1.
Shannon, S. et al., 2019: Global glacier volume projections under high-end climate change scenarios. Cryosphere, 13(1), 325–350, doi: 10.5194/tc-13-325-2019.
Sharma, A., C. Wasko, and D.P. Lettenmaier, 2018: If Precipitation Extremes Are Increasing, Why Aren’t Floods?Water Resources Research, 54(11), 8545–8551, doi: 10.1029/2018wr023749.
Sharma, A.R. and S.J. Déry, 2020: Variability and trends of landfalling atmospheric rivers along the Pacific Coast of northwestern North America. International Journal of Climatology, 40(1), 544–558, doi: 10.1002/joc.6227.
Sharma, S. et al., 2019: Widespread loss of lake ice around the Northern Hemisphere in a warming world. Nature Climate Change, 9(3), 227–231, doi: 10.1038/s41558-018-0393-5.
Sharmila, S. and K.J.E. Walsh, 2018: Recent poleward shift of tropical cyclone formation linked to Hadley cell expansion. Nature Climate Change, 8(8), 730–736, doi: 10.1038/s41558-018-0227-5.
Sharmila, S., S. Joseph, A.K. Sahai, S. Abhilash, and R. Chattopadhyay, 2015: Future projection of Indian summer monsoon variability under climate change scenario: An assessment from CMIP5 climate models. Global and Planetary Change, 124, 62–78, doi: 10.1016/j.gloplacha.2014.11.004.
Shaw, T.A., 2019: Mechanisms of Future Predicted Changes in the Zonal Mean Mid-Latitude Circulation. Current Climate Change Reports, 5(4), 345–357, doi: 10.1007/s40641-019-00145-8.
Shaw, T.A. and A. Voigt, 2016: Land dominates the regional response to CO2 direct radiative forcing. Geophysical Research Letters, 43(21), 11383–11391, doi: 10.1002/2016gl071368.
Shaw, T.A. and Z. Tan, 2018: Testing Latitudinally Dependent Explanations of the Circulation Response to Increased CO2 Using Aquaplanet Models. Geophysical Research Letters, 45(18), 9861–9869, doi: 10.1029/2018gl078974.
Shaw, T.A. et al., 2016: Storm track processes and the opposing influences of climate change. Nature Geoscience, 9(9), 656–664, doi: 10.1038/ngeo2783.
Shean, D.E. et al., 2020: A Systematic, Regional Assessment of High Mountain Asia Glacier Mass Balance. Frontiers in Earth Science, 7, 363, doi: 10.3389/feart.2019.00363.
Sheffield, J. et al., 2013: North American Climate in CMIP5 Experiments. Part I: Evaluation of Historical Simulations of Continental and Regional Climatology. Journal of Climate, 26(23), 9209–9245, doi: 10.1175/jcli-d-12-00592.1.
Shepherd, T.G., 2014: Atmospheric circulation as a source of uncertainty in climate change projections. Nature Geoscience, 7(10), 703–708, doi: 10.1038/ngeo2253.
Sherwood, S.C. et al., 2015: Adjustments in the forcing-feedback framework for understanding climate change. Bulletin of the American Meteorological Society, 96(2), 217–228, doi: 10.1175/bams-d-13-00167.1.
Shi, F., K. Fang, C. Xu, Z. Guo, and H.P. Borgaonkar, 2017: Interannual to centennial variability of the South Asian summer monsoon over the past millennium. Climate Dynamics, 49(7), 2803–2814, doi: 10.1007/s00382-016-3493-9.
Shi, H.X. and C.H. Wang, 2015: Projected 21st century changes in snow water equivalent over Northern Hemisphere landmasses from the CMIP5 model ensemble. The Cryosphere, 9(5), 1943–1953, doi: 10.5194/tc-9-1943-2015.
Shige, S. et al., 2017: Role of orography, diurnal cycle, and intraseasonal oscillation in summer monsoon rainfall over Western Ghats and Myanmar coast. Journal of Climate, 30(23), 9365–9381, doi: 10.1175/jcli-d-16-0858.1.
Shimizu, M.H. and T. Ambrizzi, 2016: MJO influence on ENSO effects in precipitation and temperature over South America. Theoretical and Applied Climatology, 124(1–2), 291–301, doi: 10.1007/s00704-015-1421-2.
Shine, K.P., R.P. Allan, W.J. Collins, and J.S. Fuglestvedt, 2015: Metrics for linking emissions of gases and aerosols to global precipitation changes. Earth System Dynamics, 6(2), 525–540, doi: 10.5194/esd-6-525-2015.
Short Gianotti, D.J., B.T. Anderson, and G.D. Salvucci, 2014: The Potential Predictability of Precipitation Occurrence, Intensity, and Seasonal Totals over the Continental United States. Journal of Climate, 27(18), 6904–6918, doi: 10.1175/jcli-d-13-00695.1.
Short Gianotti, D.J., R. Akbar, A.F. Feldman, G.D. Salvucci, and D. Entekhabi, 2020: Terrestrial Evaporation and Moisture Drainage in a Warmer Climate. Geophysical Research Letters, 47(5), e2019GL086498, doi: 10.1029/2019gl086498.
Shrestha, S., N.A.T. Hoang, P.K. Shrestha, and B. Bhatta, 2018: Climate change impact on groundwater recharge and suggested adaptation strategies for selected Asian cities. APN Science Bulletin, 8(1), 41–51, doi: 10.30852/sb.2018.499.
Shugar, D.H. et al., 2020: Rapid worldwide growth of glacial lakes since 1990. Nature Climate Change, 10(10), 939–945, doi: 10.1038/s41558-020-0855-4.
Siew, J.H., F.T. Tangang, and L. Juneng, 2014: Evaluation of CMIP5 coupled atmosphere–ocean general circulation models and projection of the Southeast Asian winter monsoon in the 21st century. International Journal of Climatology, 34(9), 2872–2884, doi: 10.1002/joc.3880.
Sigmond, M. and J.C. Fyfe, 2016: Tropical Pacific impacts on cooling North American winters. Nature Climate Change, 6(10), 970–974, doi: 10.1038/nclimate3069.
Siler, N., G.H. Roe, and K.C. Armour, 2018: Insights into the Zonal-Mean Response of the Hydrologic Cycle to Global Warming from a Diffusive Energy Balance Model. Journal of Climate, 31(18), 7481–7493, doi: 10.1175/jcli-d-18-0081.1.
Siler, N., G.H. Roe, K.C. Armour, and N. Feldl, 2019: Revisiting the surface-energy-flux perspective on the sensitivity of global precipitation to climate change. Climate Dynamics, 52(7–8), 3983–3995, doi: 10.1007/s00382-018-4359-0.
Sillmann, J., C.W. Stjern, G. Myhre, and P.M. Forster, 2017: Slow and fast responses of mean and extreme precipitation to different forcing in CMIP5 simulations. Geophysical Research Letters, 44(12), 6383–6390, doi: 10.1002/2017gl073229.
Simpson, I.R., R. Seager, M. Ting, and T.A. Shaw, 2016: Causes of change in Northern Hemisphere winter meridional winds and regional hydroclimate. Nature Climate Change, 6(1), 65–70, doi: 10.1038/nclimate2783.
Singarayer, J.S., P.J. Valdes, and W.H.G. Roberts, 2017: Ocean dominated expansion and contraction of the late Quaternary tropical rainbelt. Scientific Reports, 7(1), 9382, doi: 10.1038/s41598-017-09816-8.
Singh, A., S. Kumar, S. Akula, D.M. Lawrence, and D.L. Lombardozzi, 2020: Plant Growth Nullifies the Effect of Increased Water-Use Efficiency on Streamflow Under Elevated CO2 in the Southeastern United States. Geophysical Research Letters, 47(4), e2019GL086940, doi: 10.1029/2019gl086940.
Singh, D., 2016: South Asian monsoon: Tug of war on rainfall changes. Nature Climate Change, 6(1), 20–22, doi: 10.1038/nclimate2901.
Singh, D., S. Ghosh, M.K. Roxy, and S. McDermid, 2019: Indian summer monsoon: Extreme events, historical changes, and role of anthropogenic forcings. WIREs Climate Change, 10(2), e571, doi: 10.1002/wcc.571.
Singh, D., M. Tsiang, B. Rajaratnam, N.S. Diffenbaugh, and Singh et al., 2014: Observed changes in extreme wet and dry spells during the south Asian summer monsoon season. Nature Climate Change, 4(6), 456–461, doi: 10.1038/nclimate2208.
Singh, M. et al., 2020: Fingerprint of volcanic forcing on the ENSO–Indian monsoon coupling. Science Advances, 6(38), eaba8164, doi: 10.1126/sciadv.aba8164.
Singh, M.S. and P.A. O’Gorman, 2013: Influence of entrainment on the thermal stratification in simulations of radiative–convective equilibrium. Geophysical Research Letters, 40(16), 4398–4403, doi: 10.1002/grl.50796.
Singh, M.S. and P.A. O’Gorman, 2014: Influence of microphysics on the scaling of precipitation extremes with temperature. Geophysical Research Letters, 41(16), 6037–6044, doi: 10.1002/2014gl061222.
Sinha, A. et al., 2015: Trends and oscillations in the Indian summer monsoon rainfall over the last two millennia. Nature Communications, 6(1), 6309, doi: 10.1038/ncomms7309.
Skinner, C.B. and C.J. Poulsen, 2016: The role of fall season tropical plumes in enhancing Saharan rainfall during the African Humid Period. Geophysical Research Letters, 43(1), 349–358, doi: 10.1002/2015gl066318.
Skliris, N., J.D. Zika, G. Nurser, S.A. Josey, and R. Marsh, 2016: Global water cycle amplifying at less than the Clausius–Clapeyron rate. Scientific Reports, 6(1), 38752, doi: 10.1038/srep38752.
Skliris, N. et al., 2014: Salinity changes in the World Ocean since 1950 in relation to changing surface freshwater fluxes. Climate Dynamics, 43(3–4), 709–736, doi: 10.1007/s00382-014-2131-7.
Smerdon, B.D., 2017: A synopsis of climate change effects on groundwater recharge. Journal of Hydrology, 555, 125–128, doi: 10.1016/j.jhydrol.2017.09.047.
Smith, C.J. et al., 2020: Effective radiative forcing and adjustments in CMIP6 models. Atmospheric Chemistry and Physics, 20(16), 9591–9618, doi: 10.5194/acp-20-9591-2020.
Smith, R.J. and F.E. Mayle, 2018: Impact of mid- to late Holocene precipitation changes on vegetation across lowland tropical South America: a paleo-data synthesis. Quaternary Research, 89(1), 134–155, doi: 10.1017/qua.2017.89.
Sniderman, J.M.K. et al., 2019: Southern Hemisphere subtropical drying as a transient response to warming. Nature Climate Change, 9(3), 232–236, doi: 10.1038/s41558-019-0397-9.
Soares-Filho, B.S. et al., 2006: Modelling conservation in the Amazon basin. Nature, 440(7083), 520–523, doi: 10.1038/nature04389.
Sobel, A.H., S.J. Camargo, and M. Previdi, 2019: Aerosol vs. Greenhouse Gas Effects on Tropical Cyclone Potential Intensity and the Hydrologic Cycle. Journal of Climate, 32(17), 5511–5527, doi: 10.1175/jcli-d-18-0357.1.
Sofaer, H.R. et al., 2016: Projected wetland densities under climate change: habitat loss but little geographic shift in conservation strategy. Ecological Applications, 26(6), 1677–1692, doi: 10.1890/15-0750.1.
Sohn, B.J., S.W. Yeh, A. Lee, and W.K.M. Lau, 2019: Regulation of atmospheric circulation controlling the tropical Pacific precipitation change in response to CO2 increases. Nature Communications, 10(1), 1108, doi: 10.1038/s41467-019-08913-8.
Solander, K.C. et al., 2018: Interactions between Climate Change and Complex Topography Drive Observed Streamflow Changes in the Colorado River Basin. Journal of Hydrometeorology, 19(10), 1637–1650, doi: 10.1175/jhm-d-18-0012.1.
Solman, S.A. and I. Orlanski, 2014: Poleward Shift and Change of Frontal Activity in the Southern Hemisphere over the Last 40 Years. Journal of the Atmospheric Sciences, 71(2), 539–552, doi: 10.1175/jas-d-13-0105.1.
Solman, S.A. and I. Orlanski, 2016: Climate change over the extratropical Southern Hemisphere: The tale from an ensemble of reanalysis datasets. Journal of Climate, 29(5), 1673–1687, doi: 10.1175/jcli-d-15-0588.1.
Song, F., T. Zhou, and Y. Qian, 2014: Responses of East Asian summer monsoon to natural and anthropogenic forcings in the 17 latest CMIP5 models. Geophysical Research Letters, 41(2), 596–603, doi: 10.1002/2013gl058705.
Song, H.-J., C.R. Ferguson, and J.K. Roundy, 2016: Land–Atmosphere Coupling at the Southern Great Plains Atmospheric Radiation Measurement (ARM) Field Site and Its Role in Anomalous Afternoon Peak Precipitation. Journal of Hydrometeorology, 17(2), 541–556, doi: 10.1175/jhm-d-15-0045.1.
Song, X. and G.J. Zhang, 2011: Microphysics parameterization for convective clouds in a global climate model: Description and single-column model tests. Journal of Geophysical Research: Atmospheres, 116(D2), D02201, doi: 10.1029/2010jd014833.
Sontakke, N.A., N. Singh, and H.N. Singh, 2008: Instrumental period rainfall series of the Indian region (AD 1813–2005): revised reconstruction, update and analysis. The Holocene, 18(7), 1055–1066, doi: 10.1177/0959683608095576.
Soong, J.L., C.L. Phillips, C. Ledna, C.D. Koven, and M.S. Torn, 2020: CMIP5 Models Predict Rapid and Deep Soil Warming Over the 21st Century. Journal of Geophysical Research: Biogeosciences, 125(2), e2019JG005266, doi: 10.1029/2019jg005266.
Sooraj, K.P., P. Terray, and M. Mujumdar, 2015: Global warming and the weakening of the Asian summer monsoon circulation: assessments from the CMIP5 models. Climate Dynamics, 45(1–2), 233–252, doi: 10.1007/s00382-014-2257-7.
Souri, A.H. et al., 2020: Response of Hurricane Harvey’s rainfall to anthropogenic aerosols: A sensitivity study based on spectral bin microphysics with simulated aerosols. Atmospheric Research, 242, 104965, doi: 10.1016/j.atmosres.2020.104965.
Sousa, P.M. et al., 2017: Responses of European precipitation distributions and regimes to different blocking locations. Climate Dynamics, 48(3–4), 1141–1160, doi: 10.1007/s00382-016-3132-5.
Spencer, T. et al., 2016: Global coastal wetland change under sea-level rise and related stresses: The DIVA Wetland Change Model. Global and Planetary Change, 139, 15–30, doi: 10.1016/j.gloplacha.2015.12.018.
Sperry, J.S. et al., 2016: Pragmatic hydraulic theory predicts stomatal responses to climatic water deficits. New Phytologist, 212(3), 577–589, doi: 10.1111/nph.14059.
Spracklen, D. and L. Garcia-Carreras, 2015: The impact of Amazonian deforestation on Amazon basin rainfall. Geophysical Research Letters, 42(21), 9546–9552, doi: 10.1002/2015gl066063.
Sprenger, M. et al., 2019: The Demographics of Water: A Review of Water Ages in the Critical Zone. Reviews of Geophysics, 57(3), 800–834, doi: 10.1029/2018rg000633.
Staal, A., S.C. Dekker, M. Hirota, and E.H. van Nes, 2015: Synergistic effects of drought and deforestation on the resilience of the south-eastern Amazon rainforest. Ecological Complexity, 22, 65–75, doi: 10.1016/j.ecocom.2015.01.003.
Staal, A. et al., 2018: Forest-rainfall cascades buffer against drought across the Amazon. Nature Climate Change, 8(6), 539–543, doi: 10.1038/s41558-018-0177-y.
Staal, A. et al., 2020: Hysteresis of tropical forests in the 21st century. Nature Communications, 11(1), 4978, doi: 10.1038/s41467-020-18728-7.
Stanford, M.K.W. et al., 2017: A ubiquitous ice size bias in simulations of tropical deep convection. Atmospheric Chemistry and Physics, 17(15), 9599–9621, doi: 10.5194/acp-17-9599-2017.
Staten, P.W., K.M. Grise, S.M. Davis, K. Karnauskas, and N. Davis, 2019: Regional Widening of Tropical Overturning: Forced Change, Natural Variability, and Recent Trends. Journal of Geophysical Research: Atmospheres, 124(12), 6104–6119, doi: 10.1029/2018jd030100.
Stechmann, S.N. and S. Hottovy, 2017: Unified Spectrum of Tropical Rainfall and Waves in a Simple Stochastic Model. Geophysical Research Letters, 44(20), 10713–10724, doi: 10.1002/2017gl075754.
Stephens, C.M., T.R. McVicar, F.M. Johnson, and L.A. Marshall, 2018: Revisiting Pan Evaporation Trends in Australia a Decade on. Geophysical Research Letters, 45(20), 11164–11172, doi: 10.1029/2018gl079332.
Stephens, G.L. et al., 2012: An update on Earth’s energy balance in light of the latest global observations. Nature Geoscience, 5(10), 691–696, doi: 10.1038/ngeo1580.
Stephens, G.L. et al., 2015: The albedo of earth. Reviews of Geophysics, 53(1), 141–163, doi: 10.1002/2014rg000449.
Stephens, G.L. et al., 2018: Regional Intensification of the Tropical Hydrological Cycle During ENSO. Geophysical Research Letters, 45(9), 4361–4370, doi: 10.1029/2018gl077598.
Sterling, S.M., A. Ducharne, and J. Polcher, 2013: The impact of global land-cover change on the terrestrial water cycle. Nature Climate Change, 3(4), 385–390, doi: 10.1038/nclimate1690.
Stevens, B. and G. Feingold, 2009: Untangling aerosol effects on clouds and precipitation in a buffered system. Nature, 461(7264), 607, doi: 10.1038/nature08281.
Stevenson, S., B. Otto-Bliesner, J. Fasullo, and E. Brady, 2016: “El Niño Like” Hydroclimate Responses to Last Millennium Volcanic Eruptions. Journal of Climate, 29(8), 2907–2921, doi: 10.1175/jcli-d-15-0239.1.
Stevenson, S., A. Timmermann, Y. Chikamoto, S. Langford, and P. DiNezio, 2015: Stochastically Generated North American Megadroughts. Journal of Climate, 28(5), 1865–1880, doi: 10.1175/jcli-d-13-00689.1.
Stjern, C.W. et al., 2017: Rapid Adjustments Cause Weak Surface Temperature Response to Increased Black Carbon Concentrations. Journal of Geophysical Research: Atmospheres, 122(21), 11462–11481, doi: 10.1002/2017jd027326.
Stocker, T.F. et al., 2013: Technical Summary. In: Climate Change 2013: The Physical Science Basis. Contribution of Working Group I to the Fifth Assessment Report of the Intergovernmental Panel on Climate Change[Stocker, T.F., D. Qin, G.-K. Plattner, M. Tignor, S.K. Allen, J. Boschung, A. Nauels, Y. Xia, V. Bex, and P.M. Midgley (eds.)]. Cambridge University Press, Cambridge, United Kingdom and New York, NY, USA, pp. 33–115, doi: 10.1017/cbo9781107415324.005.
Stott, P.A. et al., 2016: Attribution of extreme weather and climate-related events. WIREs Climate Change, 7(1), 23–41, doi: 10.1002/wcc.380.
Stríkis, N.M. et al., 2015: Timing and structure of Mega-SACZ events during Heinrich Stadial 1. Geophysical Research Letters, 42(13), 5477– 5484, doi: 10.1002/2015gl064048.
Stríkis, N.M. et al., 2018: South American monsoon response to iceberg discharge in the North Atlantic. Proceedings of the National Academy of Sciences, 115(15), 3788–3793, doi: 10.1073/pnas.1717784115.
Stuart-Smith, R., G.H. Roe, S. Li, and M. Allen, 2020: Increased outburst flood hazard from Lake Palcacocha due to human-induced glacier retreat. Nature Geoscience, 14(2), 85–90, doi: 10.1038/s41561-021-00686-4.
Studholme, J. and S. Gulev, 2018: Concurrent Changes to Hadley Circulation and the Meridional Distribution of Tropical Cyclones. Journal of Climate, 31(11), 4367–4389, doi: 10.1175/jcli-d-17-0852.1.
Stuecker, M.F. et al., 2018: Polar amplification dominated by local forcing and feedbacks. Nature Climate Change, 8(12), 1076–1081, doi: 10.1038/s41558-018-0339-y.
Su, H. et al., 2014: Weakening and strengthening structures in the Hadley Circulation change under global warming and implications for cloud response and climate sensitivity. Journal of Geophysical Research: Atmospheres, 119(10), 5787–5805, doi: 10.1002/2014jd021642.
Su, H. et al., 2017: Tightening of tropical ascent and high clouds key to precipitation change in a warmer climate. Nature Communications, 8, 15771, doi: 10.1038/ncomms15771.
Su, H. et al., 2019: A dichotomy between model responses of tropical ascent and descent to surface warming. npj Climate and Atmospheric Science, 2(1), 8, doi: 10.1038/s41612-019-0066-8.
Su, H. et al., 2020: Observed Tightening of Tropical Ascent in Recent Decades and Linkage to Regional Precipitation Changes. Geophysical Research Letters, 47(3), e2019GL085809, doi: 10.1029/2019gl085809.
Subramanian, A. et al., 2014: The MJO and global warming: a study in CCSM4. Climate Dynamics, 42(7–8), 2019–2031, doi: 10.1007/s00382-013-1846-1.
Sudeepkumar, B.L., C.A. Babu, and H. Varikoden, 2018: Future projections of active-break spells of Indian summer monsoon in a climate change perspective. Global and Planetary Change, 161, 222–230, doi: 10.1016/j.gloplacha.2017.12.020.
Sun, C. et al., 2018: Uncertainties in simulated El Niño-Southern Oscillation arising from internal climate variability. Atmospheric Science Letters, 19(3), e805, doi: 10.1002/asl.805.
Sun, F., N. Berg, A. Hall, M. Schwartz, and D. Walton, 2018: Understanding End-of-century Snowpack Changes Over California’s Sierra Nevada. Geophysical Research Letters, 46(2), 933–943, doi: 10.1029/2018gl080362.
Sun, Q., C. Miao, and Q. Duan, 2015: Comparative analysis of CMIP3 and CMIP5 global climate models for simulating the daily mean, maximum, and minimum temperatures and daily precipitation over China. Journal of Geophysical Research: Atmospheres, 120(10), 4806–4824, doi: 10.1002/2014jd022994.
Sun, Q., X. Zhang, F. Zwiers, S. Westra, and L. Alexander, 2021: A Global, Continental, and Regional Analysis of Changes in Extreme Precipitation. Journal of Climate, 34(1), 243–258, doi: 10.1175/jcli-d-19-0892.1.
Sun, Y. et al., 2012: Influence of Atlantic meridional overturning circulation on the East Asian winter monsoon. Nature Geoscience, 5(1), 46–49, doi: 10.1038/ngeo1326.
Supari et al., 2018: ENSO modulation of seasonal rainfall and extremes in Indonesia. Climate Dynamics, 51(7–8), 2559–2580, doi: 10.1007/s00382-017-4028-8.
Sutton, R.T., 2018: ESD Ideas: A simple proposal to improve the contribution of IPCC WGI to the assessment and communication of climate change risks. Earth System Dynamics, 9(4), 1155–1158, doi: 10.5194/esd-9-1155-2018.
Sutton, R.T., 2019: Climate Science Needs to Take Risk Assessment Much More Seriously. Bulletin of the American Meteorological Society, 100(9), 1637–1642, doi: 10.1175/bams-d-18-0280.1.
Suzuki, K. et al., 2015: Evaluation of the Warm Rain Formation Process in Global Models with Satellite Observations. Journal of the Atmospheric Sciences, 72(10), 3996–4014, doi: 10.1175/jas-d-14-0265.1.
Swann, A.L.S., F.M. Hoffman, C.D. Koven, and J.T. Randerson, 2016: Plant responses to increasing CO2 reduce estimates of climate impacts on drought severity. Proceedings of the National Academy of Sciences, 113(36), 10019–10024, doi: 10.1073/pnas.1604581113.
Swapna, P., R. Krishnan, and J.M. Wallace, 2012: Indian Ocean and monsoon coupled interactions in a warming environment. Climate Dynamics, 42(9–10), 2439–2454, doi: 10.1007/s00382-013-1787-8.
Sylla, M.B. et al., 2015: Projected changes in the annual cycle of high-intensity precipitation events over West Africa for the late twenty-first century. Journal of Climate, 28(16), 6475–6488, doi: 10.1175/jcli-d-14-00854.1.
Tachiiri, K., D. Silva Herran, X. Su, and M. Kawamiya, 2019: Effect on the Earth system of realizing a 1.5°C warming climate target after overshooting to the 2°C level. Environmental Research Letters, 14(12), 124063, doi: 10.1088/1748-9326/ab5199.
Tague, C. and G.E. Grant, 2009: Groundwater dynamics mediate low-flow response to global warming in snow-dominated alpine regions. Water Resources Research, 45(7), W07421, doi: 10.1029/2008wr007179.
Takahashi, C., N. Sato, A. Seiki, K. Yoneyama, and R. Shirooka, 2011: Projected Future Change of MJO and its Extratropical Teleconnection in East Asia during the Northern Winter Simulated in IPCC AR4 Models. SOLA, 7, 201–204, doi: 10.2151/sola.2011-051.
Takahashi, H.G., 2018: A Systematic Tropospheric Dry Bias in the Tropics in CMIP5 Models: Relationship between Water Vapor and Rainfall Characteristics. Journal of the Meteorological Society of Japan. Series II, 96(4), 415–423, doi: 10.2151/jmsj.2018-046.
Takahashi, H.G. and J. Polcher, 2019: Weakening of rainfall intensity on wet soils over the wet Asian monsoon region using a high-resolution regional climate model. Progress in Earth and Planetary Science, 6(1), 26, doi: 10.1186/s40645-019-0272-3.
Takahashi, H.G., S. Watanabe, M. Nakata, and T. Takemura, 2018: Response of the atmospheric hydrological cycle over the tropical Asian monsoon regions to anthropogenic aerosols and its seasonality. Progress in Earth and Planetary Science, 5(1), 44, doi: 10.1186/s40645-018-0197-2.
Takahashi, H.G., H. Fujinami, T. Yasunari, J. Matsumoto, and S. Baimoung, 2015: Role of tropical cyclones along the monsoon trough in the 2011 Thai flood and interannual variability. Journal of Climate, 28(4), 1465–1476, doi: 10.1175/jcli-d-14-00147.1.
Takahashi, K. and A.G. Martínez, 2019: The very strong coastal El Niño in 1925 in the far-eastern Pacific. Climate Dynamics, 52(12), 7389–7415, doi: 10.1007/s00382-017-3702-1.
Talento, S. and M. Barreiro, 2012: Estimation of Natural Variability and Detection of Anthropogenic Signal in Summertime Precipitation over South America. Advances in Meteorology, 2012, 1–10, doi: 10.1155/2012/725343.
Talento, S. and M. Barreiro, 2018: Control of the South Atlantic Convergence Zone by extratropical thermal forcing. Climate Dynamics, 50(3), 885–900, doi: 10.1007/s00382-017-3647-4.
Talib, J., S.J. Woolnough, N.P. Klingaman, and C.E. Holloway, 2018: The Role of the Cloud Radiative Effect in the Sensitivity of the Intertropical Convergence Zone to Convective Mixing. Journal of Climate, 31(17), 6821–6838, doi: 10.1175/jcli-d-17-0794.1.
Tamang, S.K., A.M. Ebtehaj, A.F. Prein, and A.J. Heymsfield, 2020: Linking global changes of snowfall and wet-bulb temperature. Journal of Climate, 33(1), 39–59, doi: 10.1175/jcli-d-19-0254.1.
Tamarin-Brodsky, T. and Y. Kaspi, 2017: Enhanced poleward propagation of storms under climate change. Nature Geoscience, 10(12), 908–913, doi: 10.1038/s41561-017-0001-8.
Tan, H., P. Ray, B.S. Barrett, M. Tewari, and M.W. Moncrieff, 2020: Role of topography on the MJO in the maritime continent: a numerical case study. Climate Dynamics, 55(1–2), 295–314, doi: 10.1007/s00382-018-4275-3.
Tan, J., L. Oreopoulos, C. Jakob, and D. Jin, 2018: Evaluating rainfall errors in global climate models through cloud regimes. Climate Dynamics, 50(9–10), 3301–3314, doi: 10.1007/s00382-017-3806-7.
Tan, X. and T.Y. Gan, 2015: Contribution of human and climate change impacts to changes in streamflow of Canada. Scientific Reports, 5(1), 17767, doi: 10.1038/srep17767.
Tan, X., Y. Wu, B. Liu, and S. Chen, 2020: Inconsistent changes in global precipitation seasonality in seven precipitation datasets. Climate Dynamics, 54(5–6), 3091–3108, doi: 10.1007/s00382-020-05158-w.
Tanaka, A. et al., 2017: On the scaling of climate impact indicators with global mean temperature increase: a case study of terrestrial ecosystems and water resources. Climatic Change, 141(4), 775–782, doi: 10.1007/s10584-017-1911-6.
Tandon, N.F., X. Zhang, and A.H. Sobel, 2018: Understanding the Dynamics of Future Changes in Extreme Precipitation Intensity. Geophysical Research Letters, 45(6), 2870–2878, doi: 10.1002/2017gl076361.
Tang, J., W.J. Riley, and J. Niu, 2015: Incorporating root hydraulic redistribution in CLM4.5: Effects on predicted site and global evapotranspiration, soil moisture, and water storage. Journal of Advances in Modeling Earth Systems, 7(4), 1828–1848, doi: 10.1002/2015ms000484.
Tang, Q., X. Zhang, and J.A. Francis, 2014: Extreme summer weather in northern mid-latitudes linked to a vanishing cryosphere. Nature Climate Change, 4(1), 45–50, doi: 10.1038/nclimate2065.
Tang, T. et al., 2018: Dynamical response of Mediterranean precipitation to greenhouse gases and aerosols. Atmospheric Chemistry and Physics, 18(11), 8439–8452, doi: 10.5194/acp-18-8439-2018.
Tao, L., J. Zhao, and T. Li, 2015: Trend analysis of tropical intraseasonal oscillations in the summer and winter during 1982–2009. International Journal of Climatology, 35(13), 3969–3978, doi: 10.1002/joc.4258.
Tao, W.-K., J.-P. Chen, Z. Li, C. Wang, and C. Zhang, 2012: Impact of aerosols on convective clouds and precipitation. Reviews of Geophysics, 50(2), RG2001, doi: 10.1029/2011rg000369.
Tapiador, F.J., J.L. Sánchez, and E. García-Ortega, 2019a: Empirical values and assumptions in the microphysics of numerical models. Atmospheric Research, 215, 214–238, doi: 10.1016/j.atmosres.2018.09.010.
Tapiador, F.J., A. Behrangi, Z.S. Haddad, D. Katsanos, and M. de Castro, 2016: Disruptions in precipitation cycles: Attribution to anthropogenic forcing. Journal of Geophysical Research: Atmospheres, 121(5), 2161–2177, doi: 10.1002/2015jd023406.
Tapiador, F.J., R. Moreno, A. Navarro, J.L. Sánchez, and E. García-Ortega, 2019b: Climate classifications from regional and global climate models: Performances for present climate estimates and expected changes in the future at high spatial resolution. Atmospheric Research, 228, 107–121, doi: 10.1016/j.atmosres.2019.05.022.
Tapiador, F.J., A. Navarro, R. Moreno, J.L. Sánchez, and E. García-Ortega, 2020: Regional climate models: 30 years of dynamical downscaling. Atmospheric Research, 235, 104785, doi: 10.1016/j.atmosres.2019.104785.
Tawfik, A.B., P.A. Dirmeyer, and J.A. Santanello, 2015a: The Heated Condensation Framework. Part I: Description and Southern Great Plains Case Study. Journal of Hydrometeorology, 16(5), 1929–1945, doi: 10.1175/jhm-d-14-0117.1.
Tawfik, A.B., P.A. Dirmeyer, and J.A. Santanello, 2015b: The Heated Condensation Framework. Part II: Climatological Behavior of Convective Initiation and Land–Atmosphere Coupling over the Conterminous United States. Journal of Hydrometeorology, 16(5), 1946–1961, doi: 10.1175/jhm-d-14-0118.1.
Taylor, C.M., 2015: Detecting soil moisture impacts on convective initiation in Europe. Geophysical Research Letters, 42(11), 4631–4638, doi: 10.1002/2015gl064030.
Taylor, C.M. et al., 2013: Modeling soil moisture–precipitation feedback in the Sahel: Importance of spatial scale versus convective parameterization. Geophysical Research Letters, 40(23), 6213–6218, doi: 10.1002/2013gl058511.
Taylor, C.M. et al., 2017: Frequency of extreme Sahelian storms tripled since 1982 in satellite observations. Nature, 544(7651), 475–478, doi: 10.1038/nature22069.
Taylor, R.G. et al., 2013a: Ground water and climate change. Nature Climate Change, 3(4), 322–329, doi: 10.1038/nclimate1744.
Taylor, R.G. et al., 2013b: Evidence of the dependence of groundwater resources on extreme rainfall in East Africa. Nature Climate Change, 3, 374–378, doi: 10.1038/nclimate1731.
Tebaldi, C. and J.M. Arblaster, 2014: Pattern scaling: Its strengths and limitations, and an update on the latest model simulations. Climatic Change, 122(3), 459–471, doi: 10.1007/s10584-013-1032-9.
Tebaldi, C. and R. Knutti, 2018: Evaluating the accuracy of climate change pattern emulation for low warming targets. Environmental Research Letters, 13(5), 055006, doi: 10.1088/1748-9326/aabef2.
Tegen, I. and K. Schepanski, 2018: Climate Feedback on Aerosol Emission and Atmospheric Concentrations. Current Climate Change Reports, 4(1), 1–10, doi: 10.1007/s40641-018-0086-1.
Teng, H. and G. Branstator, 2019: Amplification of Waveguide Teleconnections in the Boreal Summer. Current Climate Change Reports, 5(4), 421–432, doi: 10.1007/s40641-019-00150-x.
Tennant, C., B. Menounos, R. Wheate, and J.J. Clague, 2012: Area change of glaciers in the Canadian Rocky Mountains, 1919 to 2006. The Cryosphere, 6(6), 1541–1552, doi: 10.5194/tc-6-1541-2012.
ter Steege, H. et al., 2015: Estimating the global conservation status of more than 15,000 Amazonian tree species. Science Advances, 1(10), doi: 10.1126/sciadv.1500936.
Terray, L. et al., 2012: Near-Surface Salinity as Nature’s Rain Gauge to Detect Human Influence on the Tropical Water Cycle. Journal of Climate, 25(3), 958–977, doi: 10.1175/jcli-d-10-05025.1.
Terray, P., K.P. Sooraj, S. Masson, and C. Prodhomme, 2021: Anatomy of the Indian Summer Monsoon and ENSO relationships in state-of-the-art CGCMs: role of the tropical Indian Ocean. Climate Dynamics, 56(1–2), 329–356, doi: 10.1007/s00382-020-05484-z.
Terray, P. et al., 2018: Towards a realistic simulation of boreal summer tropical rainfall climatology in state-of-the-art coupled models: role of the background snow-free land albedo. Climate Dynamics, 50(9–10), 3413–3439, doi: 10.1007/s00382-017-3812-9.
Teuling, A.J. et al., 2013: Evapotranspiration amplifies European summer drought. Geophysical Research Letters, 40(10), 2071–2075, doi: 10.1002/grl.50495.
Thackeray, C.W. and C.G. Fletcher, 2016: Snow albedo feedback. Progress in Physical Geography: Earth and Environment, 40(3), 392–408, doi: 10.1177/0309133315620999.
Thackeray, C.W., C.G. Fletcher, and C. Derksen, 2015: Quantifying the skill of CMIP5 models in simulating seasonal albedo and snow cover evolution. Journal of Geophysical Research: Atmospheres, 120(12), 5831–5849, doi: 10.1002/2015jd023325.
Thackeray, C.W., C.G. Fletcher, L.R. Mudryk, and C. Derksen, 2016: Quantifying the uncertainty in historical and future simulations of Northern Hemisphere spring snow cover. Journal of Climate, 29(23), 8647–8663, doi: 10.1175/jcli-d-16-0341.1.
Thackeray, C.W., A.M. DeAngelis, A. Hall, D.L. Swain, and X. Qu, 2018: On the Connection Between Global Hydrologic Sensitivity and Regional Wet Extremes. Geophysical Research Letters, 45(20), 11343–11351, doi: 10.1029/2018gl079698.
Thomas, E.R., J.S. Hosking, R.R. Tuckwell, R.A. Warren, and E.C. Ludlow, 2015: Twentieth century increase in snowfall in coastal West Antarctica. Geophysical Research Letters, 42(21), 9387–9393, doi: 10.1002/2015gl065750.
Thomas, E.R. et al., 2017: Regional Antarctic snow accumulation over the past 1000 years. Climate of the Past, 13(11), 1491–1513, doi: 10.5194/cp-13-1491-2017.
Thompson, D.W.J., E.A. Barnes, C. Deser, W.E. Foust, and A.S. Phillips, 2015: Quantifying the Role of Internal Climate Variability in Future Climate Trends. Journal of Climate, 28(16), 6443–6456, doi: 10.1175/jcli-d-14-00830.1.
Thomson, L.I., G.R. Osinski, and C.S.L. Ommanney, 2011: Glacier change on Axel Heiberg Island, Nunavut, Canada. Journal of Glaciology, 57(206), 1079–1086, doi: 10.3189/002214311798843287.
Thornton, J.A., K.S. Virts, R.H. Holzworth, and T.P. Mitchell, 2017: Lightning enhancement over major oceanic shipping lanes. Geophysical Research Letters, 44(17), 9102–9111, doi: 10.1002/2017gl074982.
Tian, B., 2015: Spread of model climate sensitivity linked to double-Intertropical Convergence Zone bias. Geophysical Research Letters, 42(10), 4133–4141, doi: 10.1002/2015gl064119.
Tian, B. and X. Dong, 2020: The Double-ITCZ Bias in CMIP3, CMIP5, and CMIP6 Models Based on Annual Mean Precipitation. Geophysical Research Letters, 47(8), 1–11, doi: 10.1029/2020gl087232.
Tian, D., W. Dong, D. Gong, Y. Guo, and S. Yang, 2017: Fast responses of climate system to carbon dioxide, aerosols and sulfate aerosols without the mediation of SST in the CMIP5. International Journal of Climatology, 37(3), 1156–1166, doi: 10.1002/joc.4763.
Tian, F., B. Dong, J. Robson, and R. Sutton, 2018: Forced decadal changes in the East Asian summer monsoon: the roles of greenhouse gases and anthropogenic aerosols. Climate Dynamics, 51(9–10), 3699–3715, doi: 10.1007/s00382-018-4105-7.
Tian, F., B. Dong, J. Robson, R. Sutton, and S.F.B. Tett, 2019: Projected near term changes in the East Asian summer monsoon and its uncertainty. Environmental Research Letters, 14(8), 084038, doi: 10.1088/1748-9326/ab28a6.
Tierney, J.E. and P.B. DeMenocal, 2013: Abrupt Shifts in Horn of Africa Hydroclimate Since the Last Glacial Maximum. Science, 342(6160), 843–846, doi: 10.1126/science.1240411.
Tierney, J.E., C.C. Ummenhofer, and P.B. DeMenocal, 2015: Past and future rainfall in the Horn of Africa. Science Advances, 1(9), e1500682, doi: 10.1126/sciadv.1500682.
Tierney, J.E., F.S.R. Pausata, and P.B. DeMenocal, 2017: Rainfall regimes of the Green Sahara. Science Advances, 3(1), e1601503, doi: 10.1126/sciadv.1601503.
Tierney, J.E., A.M. Haywood, R. Feng, T. Bhattacharya, and B.L. Otto-Bliesner, 2019: Pliocene warmth consistent with greenhouse gas forcing. Geophysical Research Letters, 46(15), 9136–9144, doi: 10.1029/2019gl083802.
Tilinina, N., S.K. Gulev, I. Rudeva, and P. Koltermann, 2013: Comparing cyclone life cycle characteristics and their interannual variability in different reanalyses. Journal of Climate, 26(17), 6419–6438, doi: 10.1175/jcli-d-12-00777.1.
Tillman, F.D., S. Gangopadhyay, and T. Pruitt, 2017: Changes in Projected Spatial and Seasonal Groundwater Recharge in the Upper Colorado River Basin. Groundwater, 55(4), 506–518, doi: 10.1111/g wat.12507.
Tilmes, S. et al., 2013: The hydrological impact of geoengineering in the Geoengineering Model Intercomparison Project (GeoMIP). Journal of Geophysical Research: Atmospheres, 118(19), 11036–11058, doi: 10.1002/jgrd.50868.
Timbal, B. and W. Drosdowsky, 2013: The relationship between the decline of Southeastern Australian rainfall and the strengthening of the subtropical ridge. International Journal of Climatology, 33(4), 1021–1034, doi: 10.1002/joc.3492.
Toda, M. and M. Watanabe, 2018: Linear and Nonlinear Hydrological Cycle Responses to Increasing Sea Surface Temperature. Geophysical Research Letters, 45(3), 1551–1558, doi: 10.1002/2017gl076745.
Tokinaga, H., S.P. Xie, C. Deser, Y. Kosaka, and Y.M. Okumura, 2012: Slowdown of the Walker circulation driven by tropical Indo-Pacific warming. Nature, 491, 439–443, doi: 10.1038/nature11576.
Toll, V., M. Christensen, S. Gassó, and N. Bellouin, 2017: Volcano and Ship Tracks Indicate Excessive Aerosol-Induced Cloud Water Increases in a Climate Model. Geophysical Research Letters, 44(24), 12492–12500, doi: 10.1002/2017gl075280.
Torres, R.R. and J.A. Marengo, 2014: Climate change hotspots over South America: from CMIP3 to CMIP5 multi-model datasets. Theoretical and Applied Climatology, 117(3–4), 579–587, doi: 10.1007/s00704-013-1030-x.
Torres-Alavez, A., T. Cavazos, and C. Turrent, 2014: Land–Sea Thermal Contrast and Intensity of the North American Monsoon under Climate Change Conditions. Journal of Climate, 27(12), 4566–4580, doi: 10.1175/jcli-d-13-00557.1.
Torres-Batlló, J., B. Martí-Cardona, and R. Pillco-Zolá, 2020: Mapping Evapotranspiration, Vegetation and Precipitation Trends in the Catchment of the Shrinking Lake Poopó. Remote Sensing, 12(1), 73, doi: 10.3390/rs12010073.
Trenberth, K.E., 2011: Changes in precipitation with climate change. Climate Research, 47(1–2), 123–138, doi: 10.3354/cr00953.
Trenberth, K.E., J.T. Fasullo, and J. Mackaro, 2011: Atmospheric moisture transports from ocean to land and global energy flows in reanalyses. Journal of Climate, 24(18), 4907–4924, doi: 10.1175/2011jcli4171.1.
Trenberth, K.E., J.T. Fasullo, and T.G. Shepherd, 2015: Attribution of climate extreme events. Nature Climate Change, 5(8), 725–730, doi: 10.1038/nclimate2657.
Trenberth, K.E., Y. Zhang, and M. Gehne, 2017: Intermittency in Precipitation: Duration, Frequency, Intensity, and Amounts Using Hourly Data. Journal of Hydrometeorology, 18(5), 1393–1412, doi: 10.1175/jhm-d-16-0263.1.
Trenberth, K.E., L. Cheng, P. Jacobs, Y. Zhang, and J. Fasullo, 2018: Hurricane Harvey Links to Ocean Heat Content and Climate Change Adaptation. Earth’s Future, 6(5), 730–744, doi: 10.1029/2018ef000825.
Trigo, R.M., I.F. Trigo, C.C. DaCamara, and T.J. Osborn, 2004: Climate impact of the European winter blocking episodes from the NCEP/NCAR reanalyses. Climate Dynamics, 23(1), 17–28, doi: 10.1007/s00382-004-0410-4.
Tsanis, I. and E. Tapoglou, 2019: Winter North Atlantic Oscillation impact on European precipitation and drought under climate change. Theoretical and Applied Climatology, 135(1–2), 323–330, doi: 10.1007/s00704-018-2379-7.
Tseng, K.-C., E. Maloney, and E. Barnes, 2019: The Consistency of MJO Teleconnection Patterns: An Explanation Using Linear Rossby Wave Theory. Journal of Climate, 32(2), 531–548, doi: 10.1175/jcli-d-18-0211.1.
Turner, A.G. and H. Annamalai, 2012: Climate change and the South Asian summer monsoon. Nature Climate Change, 2(8), 587–595, doi: 10.1038/nclimate1495.
Turner, J., J.S. Hosking, T.J. Bracegirdle, T. Phillips, and G.J. Marshall, 2017: Variability and trends in the Southern Hemisphere high latitude, quasi-stationary planetary waves. International Journal of Climatology, 37(5), 2325–2336, doi: 10.1002/joc.4848.
Turner, J. et al., 2019: The Dominant Role of Extreme Precipitation Events in Antarctic Snowfall Variability. Geophysical Research Letters, 46(6), 3502–3511, doi: 10.1029/2018gl081517.
Udall, B. and J. Overpeck, 2017: The twenty-first century Colorado River hot drought and implications for the future. Water Resources Research, 53(3), 2404–2418, doi: 10.1002/2016wr019638.
Ukkola, A.M., M.G. De Kauwe, M.L. Roderick, G. Abramowitz, and A.J. Pitman, 2020: Robust Future Changes in Meteorological Drought in CMIP6 Projections Despite Uncertainty in Precipitation. Geophysical Research Letters, 47(11), e2020GL087820, doi: 10.1029/2020gl087820.
Ukkola, A.M. et al., 2016a: Modelling evapotranspiration during precipitation deficits: Identifying critical processes in a land surface model. Hydrology and Earth System Sciences, 20(6), 2403–2419, doi: 10.5194/hess-20-2403-2016.
Ukkola, A.M. et al., 2016b: Reduced streamflow in water-stressed climates consistent with CO2 effects on vegetation. Nature Climate Change, 6(1), 75–78, doi: 10.1038/nclimate2831.
Ummenhofer, C.C., A. Sen Gupta, M.H. England, and C.J.C. Reason, 2009: Contributions of Indian Ocean Sea Surface Temperatures to Enhanced East African Rainfall. Journal of Climate, 22(4), 993–1013, doi: 10.1175/2008jcli2493.1.
Ummenhofer, C.C. et al., 2017: Emerging European winter precipitation pattern linked to atmospheric circulation changes over the North Atlantic region in recent decades. Geophysical Research Letters, 44(16), 8557–8566, doi: 10.1002/2017gl074188.
Undorf, S., M.A. Bollasina, and G.C. Hegerl, 2018a: Impacts of the 1900–74 Increase in Anthropogenic Aerosol Emissions from North America and Europe on Eurasian Summer Climate. Journal of Climate, 31(20), 8381–8399, doi: 10.1175/jcli-d-17-0850.1.
Undorf, S. et al., 2018b: Detectable Impact of Local and Remote Anthropogenic Aerosols on the 20th Century Changes of West African and South Asian Monsoon Precipitation. Journal of Geophysical Research: Atmospheres, 123(10), 4871–4889, doi: 10.1029/2017jd027711.
Vallis, G.K., P. Zurita-Gotor, C. Cairns, and J. Kidston, 2015: Response of the large-scale structure of the atmosphere to global warming. Quarterly Journal of the Royal Meteorological Society, 141(690), 1479–1501, doi: 10.1002/qj.2456.
van der Ent, R.J. and H.H.G. Savenije, 2013: Oceanic sources of continental precipitation and the correlation with sea surface temperature. Water Resources Research, 49(7), 3993–4004, doi: 10.1002/wrcr.20296.
van Der Ent, R.J., P.W. Keys, and H.H.G. Savenije, 2014: Contrasting roles of interception and transpiration in the hydrological cycle – Part 2: Moisture recycling. Earth System Dynamics, 5, 471–489, doi: 10.5194/esd-5-471-2014.
Van Loon, A.F. et al., 2016: Drought in the Anthropocene. Nature Geoscience, 9(2), 89–91, doi: 10.1038/ngeo2646.
Van Nes, E.H. and M. Scheffer, 2005: Implications of spatial heterogeneity for catastrophic regime shifts in ecosystems. Ecology, 86, 1797–1807, doi: 10.1890/04-0550.
van Oldenborgh, G.J. et al., 2017: Attribution of extreme rainfall from Hurricane Harvey, August 2017. Environmental Research Letters, 12(12), 124009, doi: 10.1088/1748-9326/aa9ef2.
Vannière, B. et al., 2019: Multi-model evaluation of the sensitivity of the global energy budget and hydrological cycle to resolution. Climate Dynamics, 52(11), 6817–6846, doi: 10.1007/s00382-018-4547-y.
Varble, A., 2018: Erroneous Attribution of Deep Convective Invigoration to Aerosol Concentration. Journal of the Atmospheric Sciences, 75(4), 1351–1368, doi: 10.1175/jas-d-17-0217.1.
Varino, F. et al., 2019: Northern Hemisphere extratropical winter cyclones variability over the 20th century derived from ERA-20C reanalysis. Climate Dynamics, 52(1–2), 1027–1048, doi: 10.1007/s00382-018-4176-5.
Vaughan, D.G. et al., 2013: Observations: Cryosphere. In: Climate Change 2013: The Physical Science Basis. Contribution of Working Group I to the Fifth Assessment Report of the Intergovernmental Panel on Climate Change[Stocker, T.F., D. Qin, G.-K. Plattner, M. Tignor, S.K. Allen, J. Boschung, A. Nauels, Y. Xia, V. Bex, and P.M. Midgley (eds.)]. Cambridge University Press, Cambridge, United Kingdom and New York, NY, USA, pp. 317–382, doi: 10.1017/cbo9781107415324.012.
Vazifehkhah, S. and E. Kahya, 2018: Hydrological drought associations with extreme phases of the North Atlantic and Arctic Oscillations over Turkey and northern Iran. International Journal of Climatology, 38(12), 4459–4475, doi: 10.1002/joc.5680.
Vecchi, G.A. and B.J. Soden, 2007: Global warming and the weakening of the tropical circulation. Journal of Climate, 20(17), 4316–4340, doi: 10.1175/jcli4258.1.
Veldkamp, T.I.E. et al., 2018: Human impact parameterizations in global hydrological models improve estimates of monthly discharges and hydrological extremes: a multi-model validation study. Environmental Research Letters, 13(5), 055008, doi: 10.1088/1748-9326/aab96f .
Vera, C.S. and L. Díaz, 2015: Anthropogenic influence on summer precipitation trends over South America in CMIP5 models. International Journal of Climatology, 35(10), 3172–3177, doi: 10.1002/joc.4153.
Vera, C.S. and M. Osman, 2018: Activity of the Southern Annular Mode during 2015–2016 El Niño event and its impact on Southern Hemisphere climate anomalies. International Journal of Climatology, 38, e1288–e1295, doi: 10.1002/joc.5419.
Vera, C.S., L.B. Díaz, and R.I. Saurral, 2019: Influence of Anthropogenically-Forced Global Warming and Natural Climate Variability in the Rainfall Changes Observed Over the South American Altiplano. Frontiers in Environmental Science, 7, 87, doi: 10.3389/fenvs.2019.00087.
Vergara-Temprado, J., N. Ban, D. Panosetti, L. Schlemmer, and C. Schär, 2020: Climate models permit convection at much coarser resolutions than previously considered. Journal of Climate, 33(5), 1915–1933, doi: 10.1175/jcli-d-19-0286.1.
Vergnes, J.-P., B. Decharme, and F. Habets, 2014: Introduction of groundwater capillary rises using subgrid spatial variability of topography into the ISBA land surface model. Journal of Geophysical Research: Atmospheres, 119(19), 11065–11086, doi: 10.1002/2014jd021573.
Verseghy, D.L. and M.D. MacKay, 2017: Offline Implementation and Evaluation of the Canadian Small Lake Model with the Canadian Land Surface Scheme over Western Canada. Journal of Hydrometeorology, 18(6), 1563–1582, doi: 10.1175/jhm-d-16-0272.1.
Viale, M., R. Valenzuela, R.D. Garreaud, and F.M. Ralph, 2018: Impacts of Atmospheric Rivers on Precipitation in Southern South America. Journal of Hydrometeorology, 19(10), 1671–1687, doi: 10.1175/jhm-d-18-0006.1.
Vicente-Serrano, S.M., T.R. McVicar, D.G. Miralles, Y. Yang, and M. Tomas-Burguera, 2020: Unraveling the influence of atmospheric evaporative demand on drought and its response to climate change. WIREs Climate Change, 11(2), e632, doi: 10.1002/wcc.632.
Vicente-Serrano, S.M. et al., 2014: Evidence of increasing drought severity caused by temperature rise in southern Europe. Environmental Research Letters, 9(4), 044001, doi: 10.1088/1748-9326/9/4/044001.
Vicente-Serrano, S.M. et al., 2018: Global assessment of the standardized evapotranspiration deficit index (SEDI) for drought analysis and monitoring. Journal of Climate, 31(14), 5371–5393, doi: 10.1175/jcli-d-17-0775.1.
Vicente-Serrano, S.M. et al., 2019: Climate, Irrigation, and Land Cover Change Explain Streamflow Trends in Countries Bordering the Northeast Atlantic. Geophysical Research Letters, 46(19), 10821–10833, doi: 10.1029/2019gl084084.
Vicente-Serrano, S.M. et al., 2021: Long-term variability and trends in meteorological droughts in Western Europe (1851–2018). International Journal of Climatology, 41(S1), E690–E717, doi: 10.1002/joc.6719.
Vihma, T., 2014: Effects of Arctic Sea Ice Decline on Weather and Climate: A Review. Surveys in Geophysics, 35(5), 1175–1214, doi: 10.1007/s10712-014-9284-0.
Vihma, T. et al., 2016: The atmospheric role in the Arctic water cycle: A review on processes, past and future changes, and their impacts. Journal of Geophysical Research: Biogeosciences, 121(3), 586–620, doi: 10.1002/2015jg003132.
Vilasa, L. et al., 2017: Recent Walker circulation strengthening and Pacific cooling amplified by Atlantic warming. Nature, 44(4), 20–35, doi: 10.1175/2011jcli4101.1.
Villafuerte, M.Q. and J. Matsumoto, 2015: Significant Influences of Global Mean Temperature and ENSO on Extreme Rainfall in Southeast Asia. Journal of Climate, 28(5), 1905–1919, doi: 10.1175/jcli-d-14-00531.1.
Vincent, L.A. et al., 2015: Observed Trends in Canada’s Climate and Influence of Low-Frequency Variability Modes. Journal of Climate, 28(11), 4545–4560, doi: 10.1175/jcli-d-14-00697.1.
Vishnu, S., P.A. Francis, S.S.C. Shenoi, and S.S.V.S. Ramakrishna, 2016: On the decreasing trend of the number of monsoon depressions in the Bay of Bengal. Environmental Research Letters, 11(1), 014011, doi: 10.1088/1748-9326/11/1/014011.
Viste, E., D. Korecha, and A. Sorteberg, 2013: Recent drought and precipitation tendencies in Ethiopia. Theoretical and Applied Climatology, 112, 535–551, doi: 10.1007/s00704-012-0746-3.
Vizy, E.K., K.H. Cook, E.K. Vizy, and K.H. Cook, 2017: Seasonality of the Observed Amplified Sahara Warming Trend and Implications for Sahel Rainfall. Journal of Climate, 30(9), 3073–3094, doi: 10.1175/jcli-d-16-0687.1.
Voelker, S.L. et al., 2015: Deglacial Hydroclimate of Midcontinental North America. Quaternary Research, 83(2), 336–344, doi: 10.1016/j.yqres.2015.01.001.
Voss, K.A. et al., 2013: Groundwater depletion in the Middle East from GRACE with implications for transboundary water management in the Tigris-Euphrates-Western Iran region. Water Resources Research, 49(2), 904–914, doi: 10.1002/wrcr.20078.
Vuille, M. et al., 2012: A review of the South American monsoon history as recorded in stable isotopic proxies over the past two millennia. Climate of the Past, 8(4), 1309–1321, doi: 10.5194/cp-8-1309-2012.
Wada, Y. and M.F.P. Bierkens, 2014: Sustainability of global water use: Past reconstruction and future projections. Environmental Research Letters, 9(10), 104003, doi: 10.1088/1748-9326/9/10/104003.
Wada, Y., D. Wisser, and M.F.P. Bierkens, 2014: Global modeling of withdrawal, allocation and consumptive use of surface water and groundwater resources. Earth System Dynamics, 5(1), 15–40, doi: 10.5194/esd-5-15-2014.
Wada, Y. et al., 2010: Global depletion of groundwater resources. Geophysical Research Letters, 37(20), 1–5, doi: 10.1029/2010gl044571.
Wada, Y. et al., 2013: Multimodel projections and uncertainties of irrigation water demand under climate change. Geophysical Research Letters, 40(17), 4626–4632, doi: 10.1002/grl.50686.
Wagner, J.D.M. et al., 2010: Moisture variability in the southwestern United States linked to abrupt glacial climate change. Nature Geoscience, 3(2), 110–113, doi: 10.1038/ngeo707.
Wainwright, C.M. et al., 2019: ‘Eastern African Paradox’ rainfall decline due to shorter not less intense Long Rains. npj Climate and Atmospheric Science, 2(1), 34, doi: 10.1038/s41612-019-0091-7.
Waliser, D. and B. Guan, 2017: Extreme winds and precipitation during landfall of atmospheric rivers. Nature Geoscience, 10(3), 179–183, doi: 10.1038/ngeo2894.
Walsh, K.J.E. et al., 2015: Hurricanes and Climate: The U.S. Clivar Working Group on Hurricanes. Bulletin of the American Meteorological Society, 96(6), 997–1017, doi: 10.1175/bams-d-13-00242.1.
Walsh, R.P.D. and D.M. Lawler, 1981: Rainfall seasonality: description, spatial patterns and change through time (British Isles, Africa). Weather, 36(7), 201–208, doi: 10.1002/j.1477-8696.1981. tb05400.x.
Walters, D. et al., 2019: The Met Office Unified Model Global Atmosphere 7.0/7.1 and JULES Global Land 7.0 configurations. Geoscientific Model Development, 12(5), 1909–1963, doi: 10.5194/gmd-12-1909-2019.
Walvoord, M.A. and B.L. Kurylyk, 2016: Hydrologic Impacts of Thawing Permafrost – A Review. Vadose Zone Journal, 15(6), 1–20, doi: 10.2136/vzj2016.01.0010.
Wang, B., C. Jin, and J. Liu, 2020: Understanding Future Change of Global Monsoons Projected by CMIP6 Models. Journal of Climate, 33(15), 6471–6489, doi: 10.1175/jcli-d-19-0993.1.
Wang, B. et al., 2018: Dynamics-oriented diagnostics for the Madden–Julian Oscillation. Journal of Climate, 31(8), 3117–3135, doi: 10.1175/jcli-d-17-0332.1.
Wang, B. et al., 2021: Monsoons Climate Change Assessment. Bulletin of the American Meteorological Society, 102(1), E1–E19, doi: 10.1175/bams-d-19-0335.1.
Wang, G., W. Cai, and A. Santoso, 2017: Assessing the Impact of Model Biases on the Projected Increase in Frequency of Extreme Positive Indian Ocean Dipole Events. Journal of Climate, 30(8), 2757–2767, doi: 10.1175/jcli-d-16-0509.1.
Wang, J., H.-M. Kim, and E.K.M. Chang, 2017: Changes in Northern Hemisphere Winter Storm Tracks under the Background of Arctic Amplification. Journal of Climate, 30(10), 3705–3724, doi: 10.1175/jcli-d-16-0650.1.
Wang, J. et al., 2020: MJO Teleconnections over the PNA Region in Climate Models. Part I: Performance- and Process-Based Skill Metrics. Journal of Climate, 33(3), 1051–1067, doi: 10.1175/jcli-d-19-0253.1.
Wang, L., P.J. Kushner, and D.W. Waugh, 2013: Southern hemisphere stationary wave response to changes of ozone and greenhouse gases. Journal of Climate, 26(24), 10205–10217, doi: 10.1175/jcli-d-13-00160.1.
Wang, L. et al., 2016: Investigating the spread in surface albedo for snow-covered forests in CMIP5 models. Journal of Geophysical Research: Atmospheres, 121(3), 1104–1119, doi: 10.1002/2015jd023824.
Wang, M. et al., 2015: A multiscale modeling framework model (superparameterized CAM5) with a higher-order turbulence closure: Model description and low-cloud simulations. Journal of Advances in Modeling Earth Systems, 7(2), 484–509, doi: 10.1002/2014ms000375.
Wang, P.X. et al., 2017: The global monsoon across time scales: Mechanisms and outstanding issues. Earth-Science Reviews, 174, 84–121, doi: 10.1016/j.earscirev.2017.07.006.
Wang, Q., Z. Li, J. Guo, C. Zhao, and M. Cribb, 2018: The climate impact of aerosols on the lightning flash rate: is it detectable from long-term measurements?Atmospheric Chemistry and Physics, 18(17), 12797–12816, doi: 10.5194/acp-18-12797-2018.
Wang, S.-Y.S., L. Zhao, J.-H. Yoon, P. Klotzbach, and R.R. Gillies, 2018: Quantitative attribution of climate effects on Hurricane Harvey’s extreme rainfall in Texas. Environmental Research Letters, 13(5), 054014, doi: 10.1088/1748-9326/aabb85.
Wang, T. et al., 2013: Anthropogenic agent implicated as a prime driver of shift in precipitation in eastern China in the late 1970s. Atmospheric Chemistry and Physics, 13(24), 12433–12450, doi: 10.5194/acp-13-12433-2013.
Wang, W. et al., 2018: Global lake evaporation accelerated by changes in surface energy allocation in a warmer climate. Nature Geoscience, 11(6), 410–414, doi: 10.1038/s41561-018-0114-8.
Wang, X. et al., 2020: The impact of climate change and human activities on the Aral Sea Basin over the past 50 years. Atmospheric Research, 245, 105125, doi: 10.1016/j.atmosres.2020.105125.
Wang, X.L., Y. Feng, R. Chan, and V. Isaac, 2016: Inter-comparison of extra-tropical cyclone activity in nine reanalysis datasets. Atmospheric Research, 181, 133–153, doi: 10.1016/j.atmosres.2016.06.010.
Wang, X.L. et al., 2013: Trends and low frequency variability of extra-tropical cyclone activity in the ensemble of twentieth century reanalysis. Climate Dynamics, 40(11–12), 2775–2800, doi: 10.1007/s00382-012-1450-9.
Wang, X.Y., X. Li, J. Zhu, and C.A.S. Tanajura, 2018: The strengthening of Amazonian precipitation during the wet season driven by tropical sea surface temperature forcing. Environmental Research Letters, 13(9), 94015, doi: 10.1088/1748-9326/aadbb9.
Wang, Y., A. Khalizov, M. Levy, and R. Zhang, 2013: New Directions: Light absorbing aerosols and their atmospheric impacts. Atmospheric Environment, 81, 713–715, doi: 10.1016/j.atmosenv.2013.09.034.
Wang, Y., K.-H. Lee, Y. Lin, M. Levy, and R. Zhang, 2014: Distinct effects of anthropogenic aerosols on tropical cyclones. Nature Climate Change, 4(5), 368–373, doi: 10.1038/nclimate2144.
Wang, Z., H. Zhang, and X. Zhang, 2016: Projected response of East Asian summer monsoon system to future reductions in emissions of anthropogenic aerosols and their precursors. Climate Dynamics, 47(5–6), 1455–1468, doi: 10.1007/s00382-015-2912-7.
Wang, Z., S. Yang, N.-C. Lau, and A. Duan, 2018: Teleconnection between Summer NAO and East China Rainfall Variations: A Bridge Effect of the Tibetan Plateau. Journal of Climate, 31(16), 6433–6444, doi: 10.1175/jcli-d-17-0413.1.
Wang, Z., T. Li, J. Gao, and M. Peng, 2020: Enhanced winter and summer trend difference of Madden–Julian Oscillation intensity since 1871. International Journal of Climatology, 40(15), 6369–6381, doi: 10.1002/joc.6586.
Wang-Erlandsson, L. et al., 2016: Global root zone storage capacity from satellite-based evaporation. Hydrology and Earth System Sciences, 20(4), 1459–1481, doi: 10.5194/hess-20-1459-2016.
Wang-Erlandsson, L. et al., 2018: Remote land use impacts on river flows through atmospheric teleconnections. Hydrology and Earth System Sciences, 22(8), 4311–4328, doi: 10.5194/hess-22-4311-2018.
Ward, K., S. Lauf, B. Kleinschmit, and W. Endlicher, 2016: Heat waves and urban heat islands in Europe: A review of relevant drivers. Science of the Total Environment, 569–570, 527–539, doi: 10.1016/j.scitotenv.2016.06.119.
Ward, P.J., S. Eisner, M. Flörke, M.D. Dettinger, and M. Kummu, 2014: Annual flood sensitivities to El Niño-Southern Oscillation at the global scale. Hydrology and Earth System Sciences, 18(1), 47–66, doi: 10.5194/hess-18-47-2014.
Warner, M.D. and C.F. Mass, 2017: Changes in the Climatology, Structure, and Seasonality of Northeast Pacific Atmospheric Rivers in CMIP5 Climate Simulations. Journal of Hydrometeorology, 18(8), 2131–2141, doi: 10.1175/jhm-d-16-0200.1.
Warner, M.D., C.F. Mass, and E.P. Salathé, 2015: Changes in Winter Atmospheric Rivers along the North American West Coast in CMIP5 Climate Models. Journal of Hydrometeorology, 16(1), 118–128, doi: 10.1175/jhm-d-14-0080.1.
Wartenburger, R. et al., 2017: Changes in regional climate extremes as a function of global mean temperature: an interactive plotting framework. Geoscientific Model Development, 10(9), 3609–3634, doi: 10.5194/gmd-10-3609-2017.
Wasko, C. and R. Nathan, 2019: Influence of changes in rainfall and soil moisture on trends in flooding. Journal of Hydrology, 575, 432–441, doi: 10.1016/j.jhydrol.2019.05.054.
Watanabe, M., Y. Kamae, H. Shiogama, A.M. DeAngelis, and K. Suzuki, 2018: Low clouds link equilibrium climate sensitivity to hydrological sensitivity. Nature Climate Change, 8(10), 901–906, doi: 10.1038/s41558-018-0272-0.
Watt-Meyer, O. and D.M.W. Frierson, 2019: ITCZ width controls on Hadley cell extent and eddy-driven jet position and their response to warming. Journal of Climate, 32(4), 1151–1166, doi: 10.1175/jcli-d-18-0434.1.
Watt-Meyer, O., D.M.W. Frierson, and Q. Fu, 2019: Hemispheric Asymmetry of Tropical Expansion Under CO2 Forcing. Geophysical Research Letters, 46(15), 9231–9240, doi: 10.1029/2019gl083695.
Weaver, A.J. et al., 2012: Stability of the Atlantic meridional overturning circulation: A model intercomparison. Geophysical Research Letters, 39(20), 2012GL053763, doi: 10.1029/2012gl053763.
Webb, M.J., A.P. Lock, and F.H. Lambert, 2018: Interactions between hydrological sensitivity, radiative cooling, stability, and low-level cloud amount feedback. Journal of Climate, 31(5), 1833–1850, doi: 10.1175/jcli-d-16-0895.1.
Webb, M.J. et al., 2017: The Cloud Feedback Model Intercomparison Project (CFMIP) contribution to CMIP6. Geoscientific Model Development, 10(1), 359–384, doi: 10.5194/gmd-10-359-2017.
Webb, N.P. and C. Pierre, 2018: Quantifying Anthropogenic Dust Emissions. Earth’s Future, 6(2), 286–295, doi: 10.1002/2017ef000766.
Wehner, M.F., P. Gleckler, and J. Lee, 2020: Characterization of long period return values of extreme daily temperature and precipitation in the CMIP6 models: Part 1, model evaluation. Weather and Climate Extremes, 30, 100283, doi: 10.1016/j.wace.2020.100283.
Wehner, M.F., R.L. Smith, G. Bala, and P. Duffy, 2010: The effect of horizontal resolution on simulation of very extreme US precipitation events in a global atmosphere model. Climate Dynamics, 34(2), 241–247, doi: 10.1007/s00382-009-0656-y.
Wei, K. and L. Wang, 2013: Reexamination of the Aridity Conditions in Arid Northwestern China for the Last Decade. Journal of Climate, 26(23), 9594–9602, doi: 10.1175/jcli-d-12-00605.1.
Wei, Z. et al., 2017: Revisiting the contribution of transpiration to global terrestrial evapotranspiration. Geophysical Research Letters, 44(6), 2792–2801, doi: 10.1002/2016gl072235.
Weiss, J.L., C.L. Castro, and J.T. Overpeck, 2009: Distinguishing Pronounced Droughts in the Southwestern United States: Seasonality and Effects of Warmer Temperatures. Journal of Climate, 22(22), 5918–5932, doi: 10.1175/2009JCLI2905.1.
Weiss, M. et al., 2014: Contribution of dynamic vegetation phenology to decadal climate predictability. Journal of Climate, 27(22), 8563–8577, doi: 10.1175/jcli-d-13-00684.1.
Weller, E., C. Jakob, and M.J. Reeder, 2017: Projected Response of Low-Level Convergence and Associated Precipitation to Greenhouse Warming. Geophysical Research Letters, 44(20), 10682–10690, doi: 10.1002/2017gl075489.
Welty, J., S. Stillman, X. Zeng, and J. Santanello, 2020: Increased Likelihood of Appreciable Afternoon Rainfall Over Wetter or Drier Soils Dependent Upon Atmospheric Dynamic Influence. Geophysical Research Letters, 47(11), e2020GL087779, doi: 10.1029/2020gl087779.
Werner, A.D. and C.T. Simmons, 2009: Impact of Sea-Level Rise on Sea Water Intrusion in Coastal Aquifers. Groundwater, 47(2), 197–204, doi: 10.1111/j.1745-6584.2008.00535.x.
Wester, P., A. Mishra, A. Mukherji, and A.B. Shrestha (eds.), 2019: The Hindu Kush Himalaya Assessment. Springer, Cham, Switzerland, 627 pp., doi: 10.1007/978-3-319-92288-1.
Westervelt, D.M., L.W. Horowitz, V. Naik, J.-C. Golaz, and D.L. Mauzerall, 2015: Radiative forcing and climate response to projected 21st century aerosol decreases. Atmospheric Chemistry and Physics, 15(22), 12681–12703, doi: 10.5194/acp-15-12681-2015.
Westervelt, D.M. et al., 2018: Connecting regional aerosol emissions reductions to local and remote precipitation responses. Atmospheric Chemistry and Physics, 18(16), 12461–12475, doi: 10.5194/acp-18-12461-2018.
Westra, S., L. Alexander, and F.W. Zwiers, 2013: Global Increasing Trends in Annual Maximum Daily Precipitation. Journal of Climate, 26(11), 3904–3918, doi: 10.1175/jcli-d-12-00502.1.
Westra, S. et al., 2014: Future changes to the intensity and frequency of short-duration extreme rainfall. Reviews of Geophysics, 52(3), 522–555, doi: 10.1002/2014rg000464.
Wey, H.W., M.H. Lo, S.Y. Lee, J.Y. Yu, and H.H. Hsu, 2015: Potential impacts of wintertime soil moisture anomalies from agricultural irrigation at low latitudes on regional and global climates. Geophysical Research Letters, 42(20), 8605–8614, doi: 10.1002/2015gl065883.
WGMS, 2017: Global Glacier Change Bulletin No. 2 (2014–2015)[Zemp, M., S.U. Nussbaumer, I. GärtnerRoer, J. Huber, H. Machguth, F. Paul, and M. Hoelzle (eds.)]. World Glacier Monitoring Service (WGMS), Zurich, Switzerland, 244 pp., publication based on database version: doi: 10.5904/wgms-fog-2017-10.
Widlansky, M.J. et al., 2019: Tropical Cyclone Projections: Changing Climate Threats for Pacific Island Defense Installations. Weather, Climate, and Society, 11(1), 3–15, doi: 10.1175/wcas-d-17-0112.1.
Wilcox, C. et al., 2018: Trends in hydrological extremes in the Senegal and Niger Rivers. Journal of Hydrology, 566, 531–545, doi: 10.1016/j.jhydrol.2018.07.063.
Wilcox, L.J. et al., 2019: Mechanisms for a remote response to Asian anthropogenic aerosol in boreal winter. Atmospheric Chemistry and Physics, 19(14), 9081–9095, doi: 10.5194/acp-19-9081-2019.
Wilcox, L.J. et al., 2020: Accelerated increases in global and Asian summer monsoon precipitation from future aerosol reductions. Atmospheric Chemistry and Physics, 20(20), 11955–11977, doi: 10.5194/acp-20-11955-2020.
Wild, M., 2012: Enlightening Global Dimming and Brightening. Bulletin of the American Meteorological Society, 93(1), 27–37, doi: 10.1175/bams-d-11-00074.1.
Wild, M. et al., 2017: The Global Energy Balance Archive (GEBA) version 2017: A database for worldwide measured surface energy fluxes. Earth System Science Data, 9(2), 601–613, doi: 10.5194/essd-9-601-2017.
Wilhite, D.A., 2000: Chapter I. Drought as a Natural Hazard: Concepts and Definitions. In: Drought: A Global Assessment[Wilhite, D.A. (ed.)]. Routledge, London, UK, pp. 3–18.
Wilhite, D.A. and M.H. Glantz, 1985: Understanding: the Drought Phenomenon: The Role of Definitions. Water International, 10(3), 111–120, doi: 10.1080/02508068508686328.
Wille, J.D. et al., 2019: West Antarctic surface melt triggered by atmospheric rivers. Nature Geoscience, 12(11), 911–916, doi: 10.1038/s41561-019-0460-1.
Willett, K., R. Dunn, J. Kennedy, and D. Berry, 2020: Development of the HadISDH marine humidity climate monitoring dataset. Earth System Science Data, 12, 2853–2880, doi: 10.5194/essd-12-2853-2020.
Willett, K.M. et al., 2014: HadISDH land surface multi-variable humidity and temperature record for climate monitoring. Climate of the Past, 10(6), 1983–2006, doi: 10.5194/cp-10-1983-2014.
Willetts, P.D. et al., 2017: Moist convection and its upscale effects in simulations of the Indian monsoon with explicit and parametrized convection. Quarterly Journal of the Royal Meteorological Society, 143(703), 1073–1085, doi: 10.1002/qj.2991.
Williams, A.P. and C. Funk, 2011: A westward extension of the warm pool leads to a westward extension of the Walker circulation, drying eastern Africa. Climate Dynamics, 37(11–12), 2417–2435, doi: 10.1007/s00382-010-0984-y.
Williams, A.P. et al., 2013: Temperature as a potent driver of regional forest drought stress and tree mortality. Nature Climate Change, 3(3), 292–297, doi: 10.1038/nclimate1693.
Williams, A.P. et al., 2015: Contribution of anthropogenic warming to California drought during 2012–2014. Geophysical Research Letters, 42(16), 6819–6828, doi: 10.1002/2015gl064924.
Williams, A.P. et al., 2020: Large contribution from anthropogenic warming to an emerging North American megadrought. Science, 368(6488), 314–318, doi: 10.1126/science.aaz9600.
Willison, J., W.A. Robinson, and G.M. Lackmann, 2015: North Atlantic storm-track sensitivity to warming increases with model resolution. Journal of Climate, 28(11), 4513–4524, doi: 10.1175/jcli-d-14-00715.1.
Wills, R.C.J. and T. Schneider, 2015: Stationary Eddies and the Zonal Asymmetry of Net Precipitation and Ocean Freshwater Forcing. Journal of Climate, 28(13), 5115–5133, doi: 10.1175/jcli-d-14-00573.1.
Wills, R.C.J., X.J. Levine, and T. Schneider, 2017: Local energetic constraints on walker circulation strength. Journal of the Atmospheric Sciences, 74(6), 1907–1922, doi: 10.1175/jas-d-16-0219.1.
Wills, R.C.J., R.H. White, and X.J. Levine, 2019: Northern Hemisphere Stationary Waves in a Changing Climate. Current Climate Change Reports, 5(4), 372–389, doi: 10.1007/s40641-019-00147-6.
Wing, A.A., K. Emanuel, C.E. Holloway, and C. Muller, 2017: Convective Self-Aggregation in Numerical Simulations: A Review. Surveys in Geophysics, 38(6), 1173–1197, doi: 10.1007/s10712-017-9408-4.
Wise, E.K. and M.P. Dannenberg, 2017: Reconstructed storm tracks reveal three centuries of changing moisture delivery to North America. Science Advances, 3(6), e1602263, doi: 10.1126/sciadv.1602263.
Wodzicki, K.R. and A.D. Rapp, 2016: Long-term characterization of the Pacific ITCZ using TRMM, GPCP, and ERA-Interim. Journal of Geophysical Research: Atmospheres, 121(7), 3153–3170, doi: 10.1002/2015jd024458.
Wolding, B.O., E.D. Maloney, S. Henderson, and M. Branson, 2017: Climate change and the Madden–Julian Oscillation: A vertically resolved weak temperature gradient analysis. Journal of Advances in Modeling Earth Systems, 9(1), 307–331, doi: 10.1002/2016ms000843.
Wolski, P., S. Conradie, C. Jack, and M. Tadross, 2021: Spatio-temporal patterns of rainfall trends and the 2015–2017 drought over the winter rainfall region of South Africa. International Journal of Climatology, 41(S1), E1303–E1319, doi: 10.1002/joc.6768.
Woodhouse, C.A., G.T. Pederson, K. Morino, S.A. McAfee, and G.J. McCabe, 2016: Increasing influence of air temperature on upper Colorado River streamflow. Geophysical Research Letters, 43(5), 2174–2181, doi: 10.1002/2015gl067613.
Woollings, T. et al., 2018: Blocking and its Response to Climate Change. Current Climate Change Reports, 4(3), 287–300, doi: 10.1007/s40641-018-0108-z.
Woolway, R.I. and C.J. Merchant, 2019: Worldwide alteration of lake mixing regimes in response to climate change. Nature Geoscience, 12(4), 271–276, doi: 10.1038/s41561-019-0322-x.
Woolway, R.I. et al., 2020: Global lake responses to climate change. Nature Reviews Earth & Environment, 1(8), 388–403, doi: 10.1038/s43017-020-0067-5.
Wortham, B.E. et al., 2017: Assessing response of local moisture conditions in central Brazil to variability in regional monsoon intensity using speleothem87Sr/86Sr values. Earth and Planetary Science Letters, 463, 310–322, doi: 10.1016/j.epsl.2017.01.034.
Wu, B., J. Lin, and T. Zhou, 2016a: Interdecadal circumglobal teleconnection pattern during boreal summer. Atmospheric Science Letters, 17(8), 446–452, doi: 10.1002/asl.677.
Wu, B., T. Zhou, and T. Li, 2016b: Impacts of the Pacific–Japan and Circumglobal Teleconnection Patterns on the Interdecadal Variability of the East Asian Summer Monsoon. Journal of Climate, 29(9), 3253–3271, doi: 10.1175/jcli-d-15-0105.1.
Wu, P., N. Christidis, and P. Stott, 2013: Anthropogenic impact on Earth’s hydrological cycle. Nature Climate Change, 3(9), 807–810, doi: 10.1038/nclimate1932.
Wu, T. et al., 2019: The Beijing Climate Center Climate System Model (BCC-CSM): the main progress from CMIP5 to CMIP6. Geoscientific Model Development, 12(4), 1573–1600, doi: 10.5194/gmd-12-1573-2019.
Wu, X., T. Che, X. Li, N. Wang, and X. Yang, 2018: Slower snowmelt in spring along with climate warming across the Northern Hemisphere. Geophysical Research Letters, 45(22), 12331–12339, doi: 10.1029/2018gl079511.
Wurtsbaugh, W.A. et al., 2017: Decline of the world’s saline lakes. Nature Geoscience, 10(11), 816–821, doi: 10.1038/ngeo3052.
Wurtzel, J.B. et al., 2018: Tropical Indo-Pacific hydroclimate response to North Atlantic forcing during the last deglaciation as recorded by a speleothem from Sumatra, Indonesia. Earth and Planetary Science Letters, 492, 264–278, doi: 10.1016/j.epsl.2018.04.001.
Xia, Y. and Y. Huang, 2017: Differential Radiative Heating Drives Tropical Atmospheric Circulation Weakening. Geophysical Research Letters, 44(20), 10592–10600, doi: 10.1002/2017gl075678.
Xiang, B., M. Zhao, I.M. Held, and J.C. Golaz, 2017: Predicting the severity of spurious “double ITCZ” problem in CMIP5 coupled models from AMIP simulations. Geophysical Research Letters, 44(3), 1520–1527, doi: 10.1002/2016gl071992.
Xiao, M., Q. Zhang, and V.P. Singh, 2015: Influences of ENSO, NAO, IOD and PDO on seasonal precipitation regimes in the Yangtze River basin, China. International Journal of Climatology, 35(12), 3556–3567, doi: 10.1002/joc.4228.
Xiao, M., B. Udall, and D.P. Lettenmaier, 2018: On the Causes of Declining Colorado River Streamflows. Water Resources Research, 54(9), 6739–6756, doi: 10.1029/2018wr023153.
Xie, S. et al., 2018: Understanding Cloud and Convective Characteristics in Version 1 of the E3SM Atmosphere Model. Journal of Advances in Modeling Earth Systems, 10(10), 2618–2644, doi: 10.1029/2018ms001350.
Xie, S.-P., B. Lu, and B. Xiang, 2013: Similar spatial patterns of climate responses to aerosol and greenhouse gas changes. Nature Geoscience, 6(10), 828–832, doi: 10.1038/ngeo1931.
Xie, S.-P. et al., 2010: Global warming pattern formation: Sea surface temperature and rainfall. Journal of Climate, 23(4), 966–986, doi: 10.1175/2009jcli3329.1.
Xie, S.-P. et al., 2015: Towards predictive understanding of regional climate change. Nature Climate Change, 5(10), 921–930, doi: 10.1038/nclimate2689.
Xie, X. et al., 2016: Distinct effects of anthropogenic aerosols on the East Asian summer monsoon between multidecadal strong and weak monsoon stages. Journal of Geophysical Research: Atmospheres, 121(12), 7026–7040, doi: 10.1002/2015jd024228.
Xu, C., M. Sano, and T. Nakatsuka, 2013: A 400-year record of hydroclimate variability and local ENSO history in northern Southeast Asia inferred from tree-ringδ18O. Palaeogeography, Palaeoclimatology, Palaeoecology, 386, 588–598, doi: 10.1016/j.palaeo.2013.06.025.
Xu, C. et al., 2018: Decreasing Indian summer monsoon on the northern Indian sub-continent during the last 180 years: evidence from five tree-ring cellulose oxygen isotope chronologies. Climate of the Past, 14(5), 653–664, doi: 10.5194/cp-14-653-2018.
Xu, C. et al., 2019: Increased Variability of Thailand’s Chao Phraya River Peak Season Flow and Its Association With ENSO Variability: Evidence From Tree Ringδ18O. Geophysical Research Letters, 46(9), 4863–4872, doi: 10.1029/2018gl081458.
Xu, T., A.J. Valocchi, M. Ye, F. Liang, and Y.-F. Lin, 2017: Bayesian calibration of groundwater models with input data uncertainty. Water Resources Research, 53(4), 3224–3245, doi: 10.1002/2016wr019512.
Xu, Y., H. Zhang, Y. Liu, Z. Han, and B. Zhou, 2020: Atmospheric rivers in the Australia–Asian region under current and future climate in CMIP5 models. Journal of Southern Hemisphere Earth Systems Science, 70(1), 88, doi: 10.1071/es19044.
Yamada, T.J., D. Takeuchi, M.A. Farukh, and Y. Kitano, 2016: Climatological characteristics of heavy rainfall in northern Pakistan and atmospheric blocking over western Russia. Journal of Climate, 29(21), 7743–7754, doi: 10.1175/jcli-d-15-0445.1.
Yamamoto, A. and J.B. Palter, 2016: The absence of an Atlantic imprint on the multidecadal variability of wintertime European temperature. Nature Communications, 7(1), 10930, doi: 10.1038/ncomms10930.
Yanagiya, K. and M. Furuya, 2020: Post-Wildfire Surface Deformation Near Batagay, Eastern Siberia, Detected by L-Band and C-Band InSAR. Journal of Geophysical Research: Earth Surface, 125(7), e2019JF005473, doi: 10.1029/2019jf005473.
Yang, H. et al., 2017: Regional patterns of future runoff changes from Earth system models constrained by observation. Geophysical Research Letters, 44(11), 5540–5549, doi: 10.1002/2017gl073454.
Yang, H. et al., 2020: Tropical Expansion Driven by Poleward Advancing Midlatitude Meridional Temperature Gradients. Journal of Geophysical Research: Atmospheres, 125(16), e2020JD033158, doi: 10.1029/2020jd033158.
Yang, K., C. Wang, and S. Li, 2018: Improved Simulation of Frozen-Thawing Process in Land Surface Model (CLM4.5). Journal of Geophysical Research: Atmospheres, 123(23), 2017JD028260, doi: 10.1029/2017jd028260.
Yang, Q. et al., 2017: Decadal Modulation of Precipitation Patterns over Eastern China by Sea Surface Temperature Anomalies. Journal of Climate, 30(17), 7017–7033, doi: 10.1175/jcli-d-16-0793.1.
Yang, S. et al., 2015: Warming-induced northwestward migration of the East Asian monsoon rain belt from the Last Glacial Maximum to the mid-Holocene. Proceedings of the National Academy of Sciences, 112(43), 13178–13183, doi: 10.1073/pnas.1504688112.
Yang, S. et al., 2018a: A strengthened East Asian Summer Monsoon during Pliocene warmth: Evidence from ‘red clay’ sediments at Pianguan, northern China. Journal of Asian Earth Sciences, 155, 124–133, doi: 10.1016/j.jseaes.2017.10.020.
Yang, S. et al., 2018b: El Niño-Southern Oscillation and its impact in the changing climate. National Science Review, 5(6), 840–857, doi: 10.1093/nsr/nwy046.
Yang, Y. and M.L. Roderick, 2019: Radiation, surface temperature and evaporation over wet surfaces. Quarterly Journal of the Royal Meteorological Society, 145(720), 1118–1129, doi: 10.1002/qj.3481.
Yang, Y., R.J. Donohue, T.R. McVicar, M.L. Roderick, and H.E. Beck, 2016: Long-term CO2 fertilization increases vegetation productivity and has little effect on hydrological partitioning in tropical rainforests. Journal of Geophysical Research: Biogeosciences, 121(8), 2125–2140, doi: 10.1002/2016jg003475.
Yang, Y., M.L. Roderick, S. Zhang, T.R. McVicar, and R.J. Donohue, 2018: Hydrologic implications of vegetation response to elevated CO2 in climate projections. Nature Climate Change, 9(1), 44–48, doi: 10.1038/s41558-018-0361-0.
Yang, Y.-M. and B. Wang, 2019: Improving MJO simulation by enhancing the interaction between boundary layer convergence and lower tropospheric heating. Climate Dynamics, 52(7–8), 4671–4693, doi: 10.1007/s00382-018-4407-9.
Yang, Y.-M., B. Wang, J. Cao, L. Ma, and J. Li, 2020: Improved historical simulation by enhancing moist physical parameterizations in the climate system model NESM3.0. Climate Dynamics, 54(7–8), 3819–3840, doi: 10.1007/s00382-020-05209-2.
Yao, J. et al., 2017: Improved performance of high-resolution atmospheric models in simulating the East Asian summer monsoon rain belt. Journal of Climate, 30(21), 8825–8840, doi: 10.1175/jcli-d-16-0372.1.
Ye, H., E.J. Fetzer, S. Wong, and B.H. Lambrigtsen, 2017: Rapid decadal convective precipitation increase over Eurasia during the last three decades of the 20th century. Science Advances, 3(1), 1–8, doi: 10.1126/sciadv.1600944.
Yeager, S.G. et al., 2018: Predicting Near-Term Changes in the Earth System: A Large Ensemble of Initialized Decadal Prediction Simulations Using the Community Earth System Model. Bulletin of the American Meteorological Society, 99(9), 1867–1886, doi: 10.1175/bams-d-17-0098.1.
Yettella, V. and J.E. Kay, 2017: How will precipitation change in extratropical cyclones as the planet warms? Insights from a large initial condition climate model ensemble. Climate Dynamics, 49(5), 1765–1781, doi: 10.1007/s00382-016-3410-2.
Yim, B.Y., S.W. Yeh, H.J. Song, D. Dommenget, and B.J. Sohn, 2017: Land–sea thermal contrast determines the trend of Walker circulation simulated in atmospheric general circulation models. Geophysical Research Letters, 44(11), 5854–5862, doi: 10.1002/2017gl073778.
Yin, J. et al., 2018: Large increase in global storm runoff extremes driven by climate and anthropogenic changes. Nature Communications, 9(1), 4389, doi: 10.1038/s41467-018-06765-2.
Yin, L. et al., 2014: What controls the interannual variation of the wet season onsets over the Amazon?Journal of Geophysical Research: Atmospheres, 119(5), 2314–2328, doi: 10.1002/2013jd021349.
Yoden, S., S. Otsuka, N.J. Trilaksono, and T.W. Hadi, 2017: Recent progress in research on the Maritime Continent Monsoon. In: The Global Monsoon System: Research and Forecast (3rd Edition)[Chang, C.-P., H.-C. Kuo, N.-C. Lau, R.H. Johnson, B. Wang, and M.C. Wheeler (eds.)]. World Scientific, Singapore, pp. 63–77, doi: 10.1142/9789813200913_0006.
Yoshida, R., Y. Kajikawa, and H. Ishikawa, 2014: Impact of Boreal Summer Intraseasonal Oscillation on Environment of Tropical Cyclone Genesis over the Western North Pacific. SOLA, 10, 15–18, doi: 10.2151/sola.2014-004.
Yu, K., P. D’Odorico, A. Bhattachan, G.S. Okin, and A.T. Evan, 2015: Dust-rainfall feedback in West African Sahel. Geophysical Research Letters, 42(18), 7563–7571, doi: 10.1002/2015gl065533.
Yu, R. and T. Zhou, 2007: Seasonality and Three-Dimensional Structure of Interdecadal Change in the East Asian Monsoon. Journal of Climate, 20(21), 5344–5355, doi: 10.1175/2007jcli1559.1.
Yu, T. et al., 2018: Reduced connection between the East Asian Summer Monsoon and Southern Hemisphere Circulation on interannual timescales under intense global warming. Climate Dynamics, 51(9–10), 3943–3955, doi: 10.1007/s00382-018-4121-7.
Yu, X. and H.A. Michael, 2019: Mechanisms, configuration typology, and vulnerability of pumping-induced seawater intrusion in heterogeneous aquifers. Advances in Water Resources, 128, 117–128, doi: 10.1016/j.advwatres.2019.04.013.
Yuan, J., W. Li, and Y. Deng, 2015: Amplified subtropical stationary waves in boreal summer and their implications for regional water extremes. Environmental Research Letters, 10(10), 104009, doi: 10.1088/1748-9326/10/10/104009.
Yuan, W. et al., 2019: Increased atmospheric vapor pressure deficit reduces global vegetation growth. Science Advances, 5(8), eaax1396, doi: 10.1126/sciadv.aax1396.
Yuan, X. and E. Zhu, 2018: A First Look at Decadal Hydrological Predictability by Land Surface Ensemble Simulations. Geophysical Research Letters, 45(5), 2362–2369, doi: 10.1002/2018gl077211.
Yue, C. et al., 2018: Representing anthropogenic gross land use change, wood harvest, and forest age dynamics in a global vegetation model ORCHIDEE-MICT v8.4.2. Geoscientific Model Development, 11(1), 409–428, doi: 10.5194/gmd-11-409-2018.
Zahn, M. and R.P. Allan, 2013: Quantifying present and projected future atmospheric moisture transports onto land. Water Resources Research, 49(11), 7266–7277, doi: 10.1002/2012wr013209.
Zambri, B. and A. Robock, 2016: Winter warming and summer monsoon reduction after volcanic eruptions in Coupled Model Intercomparison Project 5 (CMIP5) simulations. Geophysical Research Letters, 43(20), 10920–10928, doi: 10.1002/2016gl070460.
Zambri, B., A.N. LeGrande, A. Robock, and J. Slawinska, 2017: Northern Hemisphere winter warming and summer monsoon reduction after volcanic eruptions over the last millennium. Journal of Geophysical Research: Atmospheres, 122(15), 7971–7989, doi: 10.1002/2017jd026728.
Zamrane, Z., I. Turki, B. Laignel, G. Mahé, and N.-E. Laftouhi, 2016: Characterization of the Interannual Variability of Precipitation and Streamflow in Tensift and Ksob Basins (Morocco) and Links with the NAO. Atmosphere, 7(6), 84, doi: 10.3390/atmos7060084.
Zanardo, S., L. Nicotina, A.G.J. Hilberts, and S.P. Jewson, 2019: Modulation of Economic Losses From European Floods by the North Atlantic Oscillation. Geophysical Research Letters, 46(5), 2563–2572, doi: 10.1029/2019gl081956.
Zappa, G. and T.G. Shepherd, 2017: Storylines of atmospheric circulation change for European regional climate impact assessment. Journal of Climate, 30(16), 6561–6577, doi: 10.1175/jcli-d-16-0807.1.
Zappa, G., F. Pithan, and T.G. Shepherd, 2018: Multimodel Evidence for an Atmospheric Circulation Response to Arctic Sea Ice Loss in the CMIP5 Future Projections. Geophysical Research Letters, 45(2), 1011–1019, doi: 10.1002/2017gl076096.
Zappa, G., P. Ceppi, and T.G. Shepherd, 2020: Time-evolving sea-surface warming patterns modulate the climate change response of subtropical precipitation over land. Proceedings of the National Academy of Sciences, 117(9), 201911015, doi: 10.1073/pnas.1911015117.
Zappa, G., G. Masato, L. Shaffrey, T. Woollings, and K. Hodges, 2014: Linking Northern Hemisphere blocking and storm track biases in the CMIP5 climate models. Geophysical Research Letters, 41(1), 135–139, doi: 10.1002/2013gl058480.
Zappa, G., M.K. Hawcroft, L. Shaffrey, E. Black, and D.J. Brayshaw, 2015: Extratropical cyclones and the projected decline of winter Mediterranean precipitation in the CMIP5 models. Climate Dynamics, 45(7–8), 1727–1738, doi: 10.1007/s00382-014-2426-8.
Zarzycki, C.M., 2018: Projecting Changes in Societally Impactful Northeastern U.S. Snowstorms. Geophysical Research Letters, 45(21), 12067–12075, doi: 10.1029/2018gl079820.
Zavadoff, B.L. and B.P. Kirtman, 2020: Dynamic and Thermodynamic Modulators of European Atmospheric Rivers. Journal of Climate, 33(10), 4167–4185, doi: 10.1175/jcli-d-19-0601.1.
Zeder, J. and E.M. Fischer, 2020: Observed extreme precipitation trends and scaling in Central Europe. Weather and Climate Extremes, 29, 100266, doi: 10.1016/j.wace.2020.100266.
Zelinka, M.D. et al., 2020: Causes of Higher Climate Sensitivity in CMIP6 Models. Geophysical Research Letters, 47(1), doi: 10.1029/2019gl085782.
Zemp, D.C. et al., 2017: Self-amplified Amazon forest loss due to vegetation–atmosphere feedbacks. Nature Communications, 8(1), 14681, doi: 10.1038/ncomms14681.
Zemp, M. et al., 2019: Global glacier mass changes and their contributions to sea-level rise from 1961 to 2016. Nature, 568(7752), 382–386, doi: 10.1038/s41586-019-1071-0.
Zeng, N., J.D. Neelin, K.M. Lau, and C.J. Tucker, 1999: Enhancement of interdecadal climate variability in the Sahel by vegetation interaction. Science, 286(5444), 1537–1540, doi: 10.1126/science.286. 5444.1537.
Zeng, X., P. Broxton, and N. Dawson, 2018: Snowpack Change From 1982 to 2016 Over Conterminous United States. Geophysical Research Letters, 45(23), doi: 10.1029/2018gl079621.
Zeng, Z., L. Peng, and S. Piao, 2018a: Response of terrestrial evapotranspiration to Earth’s greening. Current Opinion in Environmental Sustainability, 33, 9–25, doi: 10.1016/j.cosust.2018.03.001.
Zeng, Z. et al., 2014: A worldwide analysis of spatiotemporal changes in water balance-based evapotranspiration from 1982 to 2009. Journal of Geophysical Research: Atmospheres, 119(3), 1186–1202, doi: 10.1002/2013jd020941.
Zeng, Z. et al., 2018b: Impact of Earth greening on the terrestrial water cycle. Journal of Climate, 31(7), 2633–2650, doi: 10.1175/jcli-d-17-0236.1.
Zhan, S., C. Song, J. Wang, Y. Sheng, and J. Quan, 2019: A Global Assessment of Terrestrial Evapotranspiration Increase Due to Surface Water Area Change. Earth’s Future, 7(3), 266–282, doi: 10.1029/2018ef001066.
Zhang, C., F. Adames, B. Khouider, B. Wang, and D. Yang, 2020: Four Theories of the Madden–Julian Oscillation. Reviews of Geophysics, 58(3), e2019RG000685, doi: 10.1029/2019rg000685.
Zhang, E., W. Sun, J. Chang, D. Ning, and J. Shulmeister, 2018: Variations of the Indian summer monsoon over the last 30 000 years inferred from a pyrogenic carbon record from south-west China. Journal of Quaternary Science, 33(1), 131–138, doi: 10.1002/jqs.3008.
Zhang, G.J., X. Wu, X. Zeng, and T. Mitovski, 2016: Estimation of convective entrainment properties from a cloud-resolving model simulation during TWP-ICE. Climate dynamics, 47(7–8), 2177–2192, doi: 10.1007/s00382-015-2957-7.
Zhang, H. and A. Moise, 2016: The Australian summer monsoon in current and future climate. In: The Monsoons and Climate Change[Jones, C. and L. Carvalho (eds.)]. Springer, Cham, Switzerland, pp. 67–120, doi: 10.1007/978-3-319-21650-8_5.
Zhang, H. and T.L. Delworth, 2018: Robustness of anthropogenically forced decadal precipitation changes projected for the 21st century. Nature Communications, 9(1), 1150, doi: 10.1038/s41467-018-03611-3.
Zhang, H., A. Moise, P. Liang, and L. Hanson, 2013: The response of summer monsoon onset/retreat in Sumatra-Java and tropical Australia region to global warming in CMIP3 models. Climate Dynamics, 40(1), 377–399, doi: 10.1007/s00382-012-1389-x.
Zhang, H. et al., 2016: Uncertainty in CMIP5 model-projected changes in the onset/retreat of the Australian summer monsoon. Climate Dynamics, 46, 2371–2389, doi: 10.1007/s00382-015-2107-x.
Zhang, K. et al., 2015: Vegetation Greening and Climate Change Promote Multidecadal Rises of Global Land Evapotranspiration. Scientific Reports, 5(1), 15956, doi: 10.1038/srep15956.
Zhang, L. and T. Li, 2017: Relative roles of differential SST warming, uniform SST warming and land surface warming in determining the Walker circulation changes under global warming. Climate Dynamics, 48(3–4), 987–997, doi: 10.1007/s00382-016-3123-6.
Zhang, L., P. Wu, and T. Zhou, 2017: Aerosol forcing of extreme summer drought over North China. Environmental Research Letters, 12(3), 034020, doi: 10.1088/1748-9326/aa5fb3.
Zhang, L., W. Han, and F. Sienzn, 2018: Unraveling causes for the changing behavior of the tropical Indian Ocean in the past few decades. Journal of Climate, 31(6), 2377–2388, doi: 10.1175/jcli-d-17-0445.1.
Zhang, L., P. Wu, T. Zhou, M.J. Roberts, and R. Schiemann, 2016: Added value of high resolution models in simulating global precipitation characteristics. Atmospheric Science Letters, 17(12), 646–657, doi: 10.1002/asl.715.
Zhang, L. et al., 2019: Indian Ocean Warming Trend Reduces Pacific Warming Response to Anthropogenic Greenhouse Gases: An Interbasin Thermostat Mechanism. Geophysical Research Letters, 46(19), 10882–10890, doi: 10.1029/2019gl084088.
Zhang, R., X. Wang, and C. Wang, 2018: On the Simulations of Global Oceanic Latent Heat Flux in the CMIP5 Multimodel Ensemble. Journal of Climate, 31(17), 7111–7128, doi: 10.1175/jcli-d-17-0713.1.
Zhang, W., T. Zhou, and L. Zhang, 2017a: Wetting and greening Tibetan Plateau in early summer in recent decades. Journal of Geophysical Research: Atmospheres, 122(11), 5808–5822, doi: 10.1002/2017jd026468.
Zhang, W., G. Villarini, and M. Wehner, 2019a: Contrasting the responses of extreme precipitation to changes in surface air and dew point temperatures. Climatic Change, 154(1), 257–271, doi: 10.1007/s10584-019-02415-8.
Zhang, W., G. Villarini, G.A. Vecchi, and J.A. Smith, 2018: Urbanization exacerbated the rainfall and flooding caused by hurricane Harvey in Houston. Nature, 563(7731), 384–388, doi: 10.1038/s41586-018-0676-z.
Zhang, W., T. Zhou, L. Zhang, and L. Zou, 2019b: Future Intensification of the Water Cycle with an Enhanced Annual Cycle over Global Land Monsoon Regions. Journal of Climate, 32(17), 5437–5452, doi: 10.1175/jcli-d-18-0628.1.
Zhang, W., M. Brandt, F. Guichard, Q. Tian, and R. Fensholt, 2017b: Using long-term daily satellite based rainfall data (1983–2015) to analyze spatio-temporal changes in the sahelian rainfall regime. Journal of Hydrology, 550, 427–440, doi: 10.1016/j.jhydrol.2017.05.033.
Zhang, X., Q. Tang, X. Zhang, and D.P. Lettenmaier, 2014: Runoff sensitivity to global mean temperature change in the CMIP5 Models. Geophysical Research Letters, 41(15), 5492–5498, doi: 10.1002/2014gl060382.
Zhang, X., Q. Tang, X. Liu, G. Leng, and C. Di, 2018: Nonlinearity of Runoff Response to Global Mean Temperature Change Over Major Global River Basins. Geophysical Research Letters, 45(12), 6109–6116, doi: 10.1029/2018gl078646.
Zhang, X. et al., 2013: Enhanced poleward moisture transport and amplified northern high-latitude wetting trend. Nature Climate Change, 3(1), 47–51, doi: 10.1038/nclimate1631.
Zhang, Y. and S. Fueglistaler, 2019: Mechanism for Increasing Tropical Rainfall Unevenness With Global Warming. Geophysical Research Letters, 46(24), 14836–14843, doi: 10.1029/2019gl086058.
Zhang, Y. et al., 2016: Multi-decadal trends in global terrestrial evapotranspiration and its components. Scientific Reports, 6, 1–12, doi: 10.1038/srep19124.
Zhang, Z. and B.A. Colle, 2017: Changes in Extratropical Cyclone Precipitation and Associated Processes during the Twenty-First Century over Eastern North America and the Western Atlantic Using a Cyclone-Relative Approach. Journal of Climate, 30(21), 8633–8656, doi: 10.1175/jcli-d-16-0906.1.
Zhang, Z., F.M. Ralph, and M. Zheng, 2019: The Relationship Between Extratropical Cyclone Strength and Atmospheric River Intensity and Position. Geophysical Research Letters, 46(3), 1814–1823, doi: 10.1029/2018gl079071.
Zhang, Z., B.F. Chao, J. Chen, and C.R. Wilson, 2015: Terrestrial water storage anomalies of Yangtze River Basin droughts observed by GRACE and connections with ENSO. Global and Planetary Change, 126, 35–45, doi: 10.1016/j.gloplacha.2015.01.002.
Zhao, C. et al., 2018: Enlarging Rainfall Area of Tropical Cyclones by Atmospheric Aerosols. Geophysical Research Letters, 45(16), 8604–8611, doi: 10.1029/2018gl079427.
Zhao, D. et al., 2018: Predicting Wetland Distribution Changes under Climate Change and Human Activities in a Mid- and High-Latitude Region. Sustainability, 10(3), 863, doi: 10.3390/su10030863.
Zhao, M., 2020: Simulations of Atmospheric Rivers, Their Variability, and Response to Global Warming Using GFDL’s New High-Resolution General Circulation Model. Journal of Climate, 33(23), 10287–10303, doi: 10.1175/jcli-d-20-0241.1.
Zhao, M. et al., 2018: The GFDL Global Atmosphere and Land Model AM4.0/LM4.0: 2. Model Description, Sensitivity Studies, and Tuning Strategies. Journal of Advances in Modeling Earth Systems, 10(3), 735–769, doi: 10.1002/2017ms001209.
Zhao, S. and K. Suzuki, 2019: Differing impacts of black carbon and sulfate aerosols on global precipitation and the ITCZ location via atmosphere and ocean energy perturbations. Journal of Climate, 32(17), 5567–5582, doi: 10.1175/jcli-d-18-0616.1.
Zhao, W. and A. Li, 2015: A Review on Land Surface Processes Modelling over Complex Terrain. Advances in Meteorology, 2015, 1–17, doi: 10.1155/2015/607181.
Zhao, X., R.J. Allen, T. Wood, and A.C. Maycock, 2020: Tropical Belt Width Proportionately More Sensitive to Aerosols Than Greenhouse Gases. Geophysical Research Letters, 47(7), e2019GL086425, doi: 10.1029/2019gl086425.
Zheng, X.-T., C. Hui, and S.-W. Yeh, 2018: Response of ENSO amplitude to global warming in CESM large ensemble: uncertainty due to internal variability. Climate Dynamics, 50(11–12), 4019–4035, doi: 10.1007/s00382-017-3859-7.
Zheng, Z. et al., 2020: Diurnal variation of summer precipitation modulated by air pollution: observational evidences in the beijing metropolitan area. Environmental Research Letters, 15(9), 94053, doi: 10.1088/1748-9326/ab99fc.
Zhou, C. and K. Wang, 2017: Quantifying the sensitivity of precipitation to the long-term warming trend and interannual-decadal variation of surface air temperature over China. Journal of Climate, 30(10), 3687–3703, doi: 10.1175/jcli-d-16-0515.1.
Zhou, C., K. Wang, and D. Qi, 2018: Attribution of the July 2016 Extreme Precipitation Event Over China’s Wuhang. Bulletin of the American Meteorological Society, 99(1), S107–S112, doi: 10.1175/bams-d-17-0090.1.
Zhou, S. et al., 2019: Land–atmosphere feedbacks exacerbate concurrent soil drought and atmospheric aridity. Proceedings of the National Academy of Sciences, 116(38), 18848–18853, doi: 10.1073/pnas.1904955116.
Zhou, S. et al., 2021: Soil moisture–atmosphere feedbacks mitigate declining water availability in drylands. Nature Climate Change, 11(1), 38–44, doi: 10.1038/s41558-020-00945-z.
Zhou, T., F. Song, K.-J. Ha, and X. Chen, 2017a: Decadal Change of East Asian Summer Monsoon: Contributions of Internal Variability and External Forcing. In: The Global Monsoon System: Research and Forecast (3rd Edition)[Chang, C.-P., H.-C. Kuo, N.-C. Lau, R.H. Johnson, B. Wang, and M.C. Wheeler (eds.)]. World Scientific, Singapore, pp. 327–336, doi: 10.1142/9789813200913_0026.
Zhou, T. et al., 2016: GMMIP (v1.0) contribution to CMIP6: Global Monsoons Model Inter-comparison Project. Geoscientific Model Development, 9(10), 3589–3604, doi: 10.5194/gmd-9-3589-2016.
Zhou, T. et al., 2017b: A Robustness Analysis of CMIP5 Models over the East Asia-Western North Pacific Domain. Engineering, 3(5), 773–778, doi: 10.1016/j.eng.2017.05.018.
Zhou, W., S.-P. Xie, and D. Yang, 2019: Enhanced equatorial warming causes deep-tropical contraction and subtropical monsoon shift. Nature Climate Change, 9(11), 834–839, doi: 10.1038/s41558-019-0603-9.
Zhou, W., L.R. Leung, J. Lu, D. Yang, and F. Song, 2020: Contrasting Recent and Future ITCZ Changes From Distinct Tropical Warming Patterns. Geophysical Research Letters, 47(22), e2020GL089846, doi: 10.1029/2020gl089846.
Zhou, Y.Q., A.H. Sawyer, C.H. David, and J.S. Famiglietti, 2019: Fresh Submarine Groundwater Discharge to the Near-Global Coast. Geophysical Research Letters, 46(11), 5855–5863, doi: 10.1029/2019gl082749.
Zhu, Y. and R.E. Newell, 1998: A Proposed Algorithm for Moisture Fluxes from Atmospheric Rivers. Monthly Weather Review, 126(3), 725–735, doi: 10.1175/1520-0493(1998)126<0725:apafmf >2.0.co;2.
Zhu, Z. et al., 2016: Greening of the Earth and its drivers. Nature Climate Change, 6(8), 791–795, doi: 10.1038/nclimate3004.
Zickfeld, K., B. Knopf, V. Petoukhov, and H.J. Schellnhuber, 2005: Is the Indian summer monsoon stable against global change?Geophysical Research Letters, 32(15), L15707, doi: 10.1029/2005gl022771.
Zika, J.D. et al., 2018: Improved estimates of water cycle change from ocean salinity: The key role of ocean warming. Environmental Research Letters, 13(7), 074036, doi: 10.1088/1748-9326/aace42.
Zilli, M.T. and L.M. Carvalho, 2021: Detection and attribution of precipitation trends associated with the poleward shift of the South Atlantic Convergence Zone using CMIP5 simulations. International Journal of Climatology, 41(5), 3085–3106, doi: 10.1002/joc.7007.
Zilli, M.T., L.M. Carvalho, and B.R. Lintner, 2019: The poleward shift of South Atlantic Convergence Zone in recent decades. Climate Dynamics, 52(5), 2545–2563, doi: 10.1007/s00382-018-4277-1.
Zittis, G., 2018: Observed rainfall trends and precipitation uncertainty in the vicinity of the Mediterranean, Middle East and North Africa. Theoretical and Applied Climatology, 134(3–4), 1207–1230, doi: 10.1007/s00704-017-2333-0.
Zolina, O. et al., 2014: Precipitation variability and extremes in Central Europe: New View from STAMMEX Results. Bulletin of the American Meteorological Society, 95(7), 995–1002, doi: 10.1175/bams-d-12-00134.1.
Zou, Y. et al., 2019: Development of a REgion-Specific Ecosystem Feedback Fire (RESFire) Model in the Community Earth System Model. Journal of Advances in Modeling Earth Systems, 11(2), 417–445, doi: 10.1029/2018ms001368.
Zuo, M., T. Zhou, and W. Man, 2019: Hydroclimate responses over global monsoon regions following volcanic eruptions at different latitudes. Journal of Climate, 32(14), 4367–4385, doi: 10.1175/jcli-d-18-0707.1.
Zuo, Z. et al., 2013: Long-Term Variations of Broad-Scale Asian Summer Monsoon Circulation and Possible Causes. Journal of Climate, 26(22), 8947–8961, doi: 10.1175/jcli-d-12-00691.1.
1In this chapter, the term ‘evaporation’ includes all evaporative processes over land and ocean, including transpiration over land, while the term ‘evapotranspiration’ (ET) is also used interchangeably when the focus is only on land.
25–95% confidence range estimates are quoted unless otherwise stated.


