Chapter 7: Agriculture, Forestry, and Other Land Uses (AFOLU)


This chapter should be cited as:
Nabuurs, G-J., R. Mrabet, A. Abu Hatab, M. Bustamante, H. Clark, P. Havlík, J. House, C. Mbow, K.N. Ninan, A. Popp, S. Roe, B. Sohngen, S. Towprayoon, 2022: Agriculture, Forestry and Other Land Uses (AFOLU). In IPCC, 2022: Climate Change 2022: Mitigation of Climate Change. Contribution of Working Group III to the Sixth Assessment Report of the Intergovernmental Panel on Climate Change[P.R. Shukla, J. Skea, R. Slade, A. Al Khourdajie, R. van Diemen, D. McCollum, M. Pathak, S. Some, P. Vyas, R. Fradera, M. Belkacemi, A. Hasija, G. Lisboa, S. Luz, J. Malley, (eds.)]. Cambridge University Press, Cambridge, UK and New York, NY, USA. doi: 10.1017/9781009157926.009
Executive Summary 
TheAgriculture, Forestry and Other Land Use1 (AFOLU) sector encompasses managed ecosystems and offers significant mitigation opportunities while delivering food, wood and other renewable resources as well as biodiversity conservation, provided the sector adapts to climate change. Land-based mitigation measures represent some of the most important options currently available. They can both deliver carbon dioxide removal (CDR) and substitute for fossil fuels, thereby enabling emissions reductions in other sectors. The rapid deployment of AFOLU measures is essential in all pathways staying within the limits of the remaining budget for a 1.5°C target ( high confidence). Where carefully and appropriately implemented, AFOLU mitigation measures are uniquely positioned to deliver substantial co-benefits and help address many of the wider challenges associated with land management. If AFOLU measures are deployed badly then, when taken together with the increasing need to produce sufficient food, feed, fuel and wood, they may exacerbate trade-offs with the conservation of habitats, adaptation, biodiversity and other services. At the same time the capacity of the land to support these functions may be threatened by climate change itself ( high confidence). {IPCC AR6 WGI, Figure SPM.7; IPCC AR6 WGII, 7.1, 7.6}
The AFOLU (managed land) sector, on average, accounted for 13–21% of global total anthropogenic greenhouse gas (GHG) emissions in the period 2010–2019 (medium confidence). At the same time managed and natural terrestrial ecosystems were a carbon sink, absorbing around one third of anthropogenic CO2 emissions (medium confidence). Estimated anthropogenic net CO2 emissions from AFOLU (based on book-keeping models) result in a net source of +5.9 ± 4.1GtCO2 yr –1 between 2010 and 2019 with an unclear trend. Based on FAOSTAT or national GHG inventories, the net CO2 emissions from AFOLU were 0.0 to +0.8 GtCO2 yr –1 over the same period. There is a discrepancy in the reported CO2AFOLU emissions magnitude because alternative methodological approaches that incorporate different assumptions are used. If the managed and natural responses of all land to both anthropogenic environmental change and natural climate variability, estimated to be a gross sink of –12.5 ± 3.2 GtCO2 yr –1 for the period 2010–2019, are included with land use emissions, then land overall, constituted a net sink of –6.6 ± 5.2 GtCO2 yr –1 in terms of CO2 emissions (medium confidence). {7.2, 7.2.2.5, Table 7.1; IPCC AR6 WGI}
AFOLU CO2 emissions fluxes are mainly driven by land use change (CO2LULUCF), and account for about half of total net AFOLU emissions. The rate of deforestation has generally declined, while global tree cover and global forest growing stock levels are likely increasing (medium confidence). There are substantial regional differences, with losses of carbon generally observed in tropical regions and gains in temperate and boreal regions. Agricultural methane (CH4) and nitrous oxide (N2O) emissions are estimated to average 157 ± 47.1 MtCH4 yr –1 and 6.6 ± 4.0 MtN2O yr –1 or 4.2 ± 1.3 and 1.8 ± 1.1 GtCO2-eq yr –1 (using IPCC AR6 GWP100 values for CH4 and N2O) respectively between 2010 and 2019. AFOLU CH4 emissions continue to increase ( high confidence), the main source of which is enteric fermentation from ruminant animals ( high confidence). Similarly, AFOLU N2O emissions are increasing, dominated by agriculture, notably from manure application, nitrogen deposition, and nitrogen fertiliser use ( high confidence). In addition to being a source and sink for GHG emissions, land plays an important role in climate through albedo effects, evapotranspiration and volatile organic compounds (VOCs) and their mix, although the combined role in total climate forcing is unclear and varies strongly with bioclimatic region and management type. {2.4.2.5, 7.2, 7.2.1, 7.2.3, 7.3}
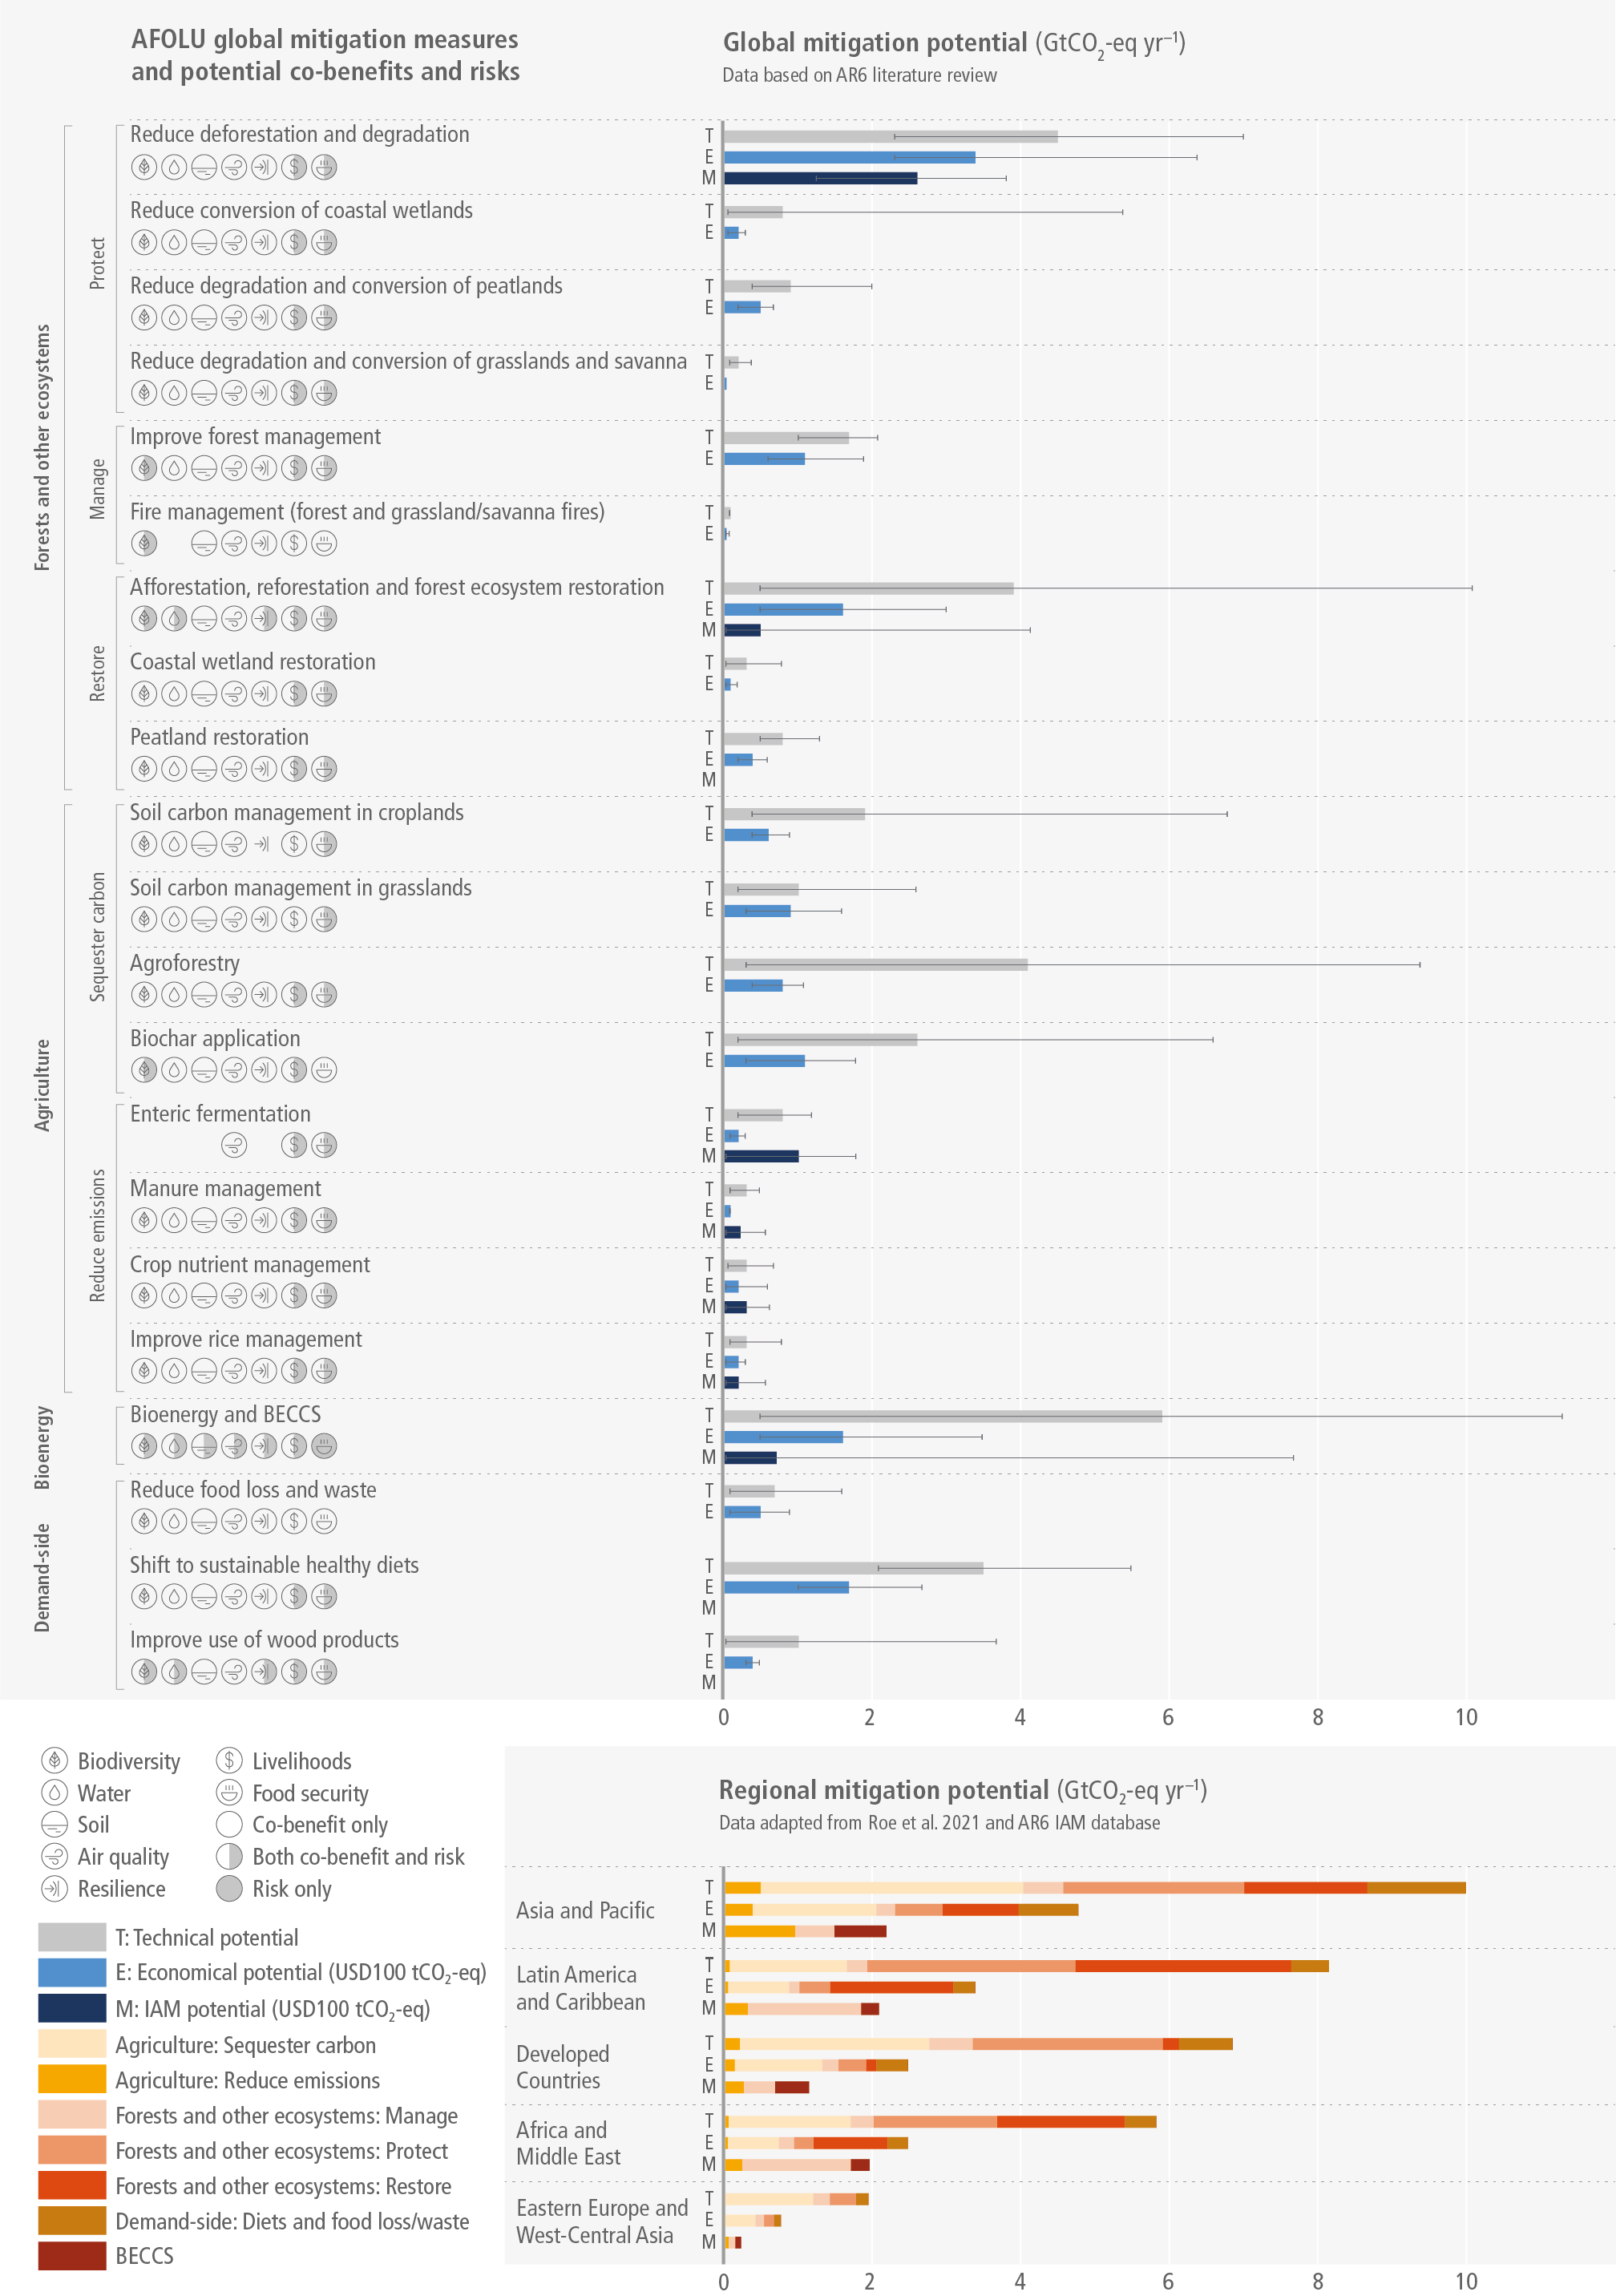
The AFOLU sector offers significant near-term mitigation potential at relatively low cost but cannot compensate for delayed emission reductions in other sectors (high evidence, medium agreement). The AFOLU sector can provide 20–30% (interquartile range) of the global mitigation needed for a 1.5°C or 2°C pathway towards 2050 (robust evidence, medium agreement ), though there are highly variable mitigation strategies for how AFOLU potential can be deployed for achieving climate targets. The estimated likely economic (<USD100 tCO2-eq –1) AFOLU sector mitigation potential is 8 to 14 GtCO2-eq yr –1 between 2020 and 2050, with the bottom end of this range representing the mean from integrated assessment models (IAMs) and the upper end representing the mean estimate from global sectoral studies. The economic potential is about half of the technical potential from AFOLU, and about 30–50% could be achieved under USD20 tCO2-eq –1. The implementation of robust measurement, reporting and verification processes is paramount to improving the transparency of net-carbon-stock changes per land unit to prevent misleading assumptions or claims on mitigation. {7.1, 7.4, 7.5}
Between 2020 and 2050, mitigation measures in forests and other natural ecosystems provide the largest share of the economic (up to USD100tCO2-eq–1) AFOLU mitigation potential, followed by agriculture and demand-side measures (high confidence). In the global sectoral studies, the protection, improved management, and restoration of forests, peatlands, coastal wetlands, savannas and grasslands have the potential to reduce emissions and/or sequester 7.3 mean (3.9–13.1 range) GtCO2-eq yr –1. Agriculture provides the second largest share of the mitigation potential, with 4.1 (1.7–6.7) GtCO2-eq yr –1 (up to USD100 tCO2-eq –1) from cropland and grassland soil carbon management, agroforestry, use of biochar, improved rice cultivation, and livestock and nutrient management. Demand-side measures including shifting to sustainable healthy diets, reducing food waste, and building with wood and biochemicals and bio-textiles have a mitigation potential of 2.2 (1.1–3.6) GtCO2-eq yr –1. Most mitigation options are available and ready to deploy. Emissions reductions can be unlocked relatively quickly, whereas CDR needs upfront investment. Sustainable intensification in agriculture, shifting diets, and reducing food waste could enhance efficiencies and reduce agricultural land needs, and are therefore critical for enabling supply-side measures such as reforestation, restoration, as well as decreasing CH4 and N2O emissions from agricultural production. In addition, emerging technologies (e.g., vaccines or inhibitors) have the potential to substantially increase CH4 mitigation potential beyond current estimates. AFOLU mitigation is not only relevant in countries with large land areas. Many smaller countries and regions, particularly with wetlands, have disproportionately high levels of AFOLU mitigation potential density. {7.4, 7.5}
The economic and political feasibility of implementing AFOLU mitigation measures is hampered by persistent barriers. Assisting countries to overcome barriers will help to achieve significant short-term mitigation (medium confidence). Finance forms a critical barrier to achieving these gains as currently mitigation efforts rely principally on government sources and funding mechanisms which do not provide sufficient resources to enable the economic potential to be realised. Differences in cultural values, governance, accountability and institutional capacity are also important barriers. Climate change could also emerge as a barrier to AFOLU mitigation, although the IPCC AR6 WGI contribution to AR6 indicated that an increase in the capacity of natural sinks may occur, despite changes in climate (medium confidence). The continued loss of biodiversity makes ecosystems less resilient to climate change extremes and this may further jeopardise the achievement of the AFOLU mitigation potentials indicated in this chapter (IPCC AR6 WGII and IPBES) ( high confidence). {7.4, 7.6; IPCC AR6 WGI, Figure SPM.7}
Bioenergy and other bio-based options represent an important share of the total mitigation potential. The range of recent estimates for the technical bioenergy potential when constrained by food security and environmental considerations is5–50and50–250EJ yr–1by 2050 for residues and dedicated biomass production system respectively. These estimates fall within previously estimated ranges (medium agreement). Poorly planned deployment of biomass production and afforestation options for in-forest carbon sequestration may conflict with environmental and social dimensions of sustainability ( high confidence). The global technical CDR potential of BECCS by 2050 (considering only the technical capture of CO2 and storage underground) is estimated at 5.9 mean (0.5–11.3) GtCO2 yr –1, of which 1.6 (0.8–3.5) GtCO2 yr –1 is available at below USD100 tCO2–1 (medium confidence). Bioenergy and other bio-based products provide additional mitigation through the substitution of fossil fuels fossil-based products ( high confidence). These substitution effects are reported in other sectors. Wood used in construction may reduce emissions associated with steel and concrete use. The agriculture and forestry sectors can devise management approaches that enable biomass production and use for energy in conjunction with the production of food and timber, thereby reducing the conversion pressure on natural ecosystems (medium confidence). {7.4}
The deployment of all land-based mitigation measures can provide multiple co-benefits, but there are also risks and trade-offs from misguided or inappropriate land management (high confidence). Such risks can best be managed if AFOLU mitigation is pursued in response to the needs and perspectives of multiple stakeholders to achieve outcomes that maximise synergies while limiting trade-offs (medium confidence). The results of implementing AFOLU measures are often variable and highly context specific. Depending on local conditions (e.g., ecosystem, climate, food system, land ownership) and management strategies (e.g., scale, method), mitigation measures have the potential to positively or negatively impact biodiversity, ecosystem functioning, air quality, water availability and quality, soil productivity, rights infringements, food security, and human well-being. Mitigation measures addressing GHGs may also affect other climate forcers such as albedo and evapotranspiration. Integrated responses that contribute to mitigation, adaptation, and other land challenges will have greater likelihood of being successful ( high confidence); measures which provide additional benefits to biodiversity and human well-being are sometimes described as ‘Nature-Based Solutions’. {7.1, 7.4, 7.6}
AFOLU mitigation measures have been well understood for decades but deployment remains slow and emissions trends indicate unsatisfactory progress despite beneficial contributions to global emissions reduction from forest-related options (high confidence). Globally, the AFOLU sector has so far contributed modestly to net mitigation, as past policies have delivered about 0.65 GtCO2 yr –1 of mitigation during 2010–2019 or 1.4% of global gross emissions ( high confidence). The majority (>80%) of emission reduction resulted from forestry measures ( high confidence). Although the mitigation potential of AFOLU measures is large from a biophysical and ecological perspective, its feasibility is hampered by lack of institutional support, uncertainty over long-term additionality and trade-offs, weak governance, fragmented land ownership, and uncertain permanence effects. Despite these impediments to change, AFOLU mitigation options are demonstrably effective and with appropriate support can enable rapid emission reductions in most countries. {7.4, 7.6}
Concerted, rapid and sustained effort by all stakeholders, from policy makers and investors to land owners and managers is a pre-requisite to achieving high levels of mitigation in the AFOLU sector (highconfidence). To date USD0.7 billion yr –1 is estimated to have been spent on AFOLU mitigation. This is well short of the more than USD400 billion yr –1 that is estimated to be necessary to deliver the up to 30% of global mitigation effort envisaged in deep mitigation scenarios (medium confidence). This estimate of the global funding requirement is smaller than current subsidies provided to agriculture and forestry. Making this funding available would require a change in flows of money and determination of who pays. A gradual redirection of existing agriculture and forestry subsidies would greatly advance mitigation. Effective policy interventions and national (investment) plans as part of Nationally Determined Contributions (NDCs), specific to local circumstances and needs, are urgently needed to accelerate the deployment of AFOLU mitigation options. These interventions are effective when they include funding schemes and long-term consistent support for implementation with governments taking the initiative together with private funders and non-state actors. {7.6}
Realising the mitigation potential of the AFOLU sector depends strongly on policies that directly address emissions and drive the deployment of land-based mitigation options, consistent with carbon prices in deep mitigation scenarios (high confidence). Examples of successful policies and measures include establishing and respecting tenure rights and community forestry, improved agricultural management and sustainable intensification, biodiversity conservation, payments for ecosystem services, improved forest management and wood chain usage, bioenergy, voluntary supply chain management efforts, consumer behaviour campaigns, private funding and joint regulatory efforts to avoid, for example, leakage. The efficacy of different policies, however, will depend on numerous region-specific factors. In addition to funding, these factors include governance, institutions, long-term consistent execution of measures, and the specific policy setting ( high confidence). {7.6}
There is a discrepancy, equating to 5.5GtCO2yr–1 between alternative methods of accounting for anthropogenic land CO2fluxes. Reconciling these methods greatly enhances the credibility of AFOLU-based emissions offsetting. It would also assist in assessing collective progress in a global stocktake (high confidence). The principal accounting approaches are national GHG inventories (NGHGI) and global modelling approaches. NGHGI, based on IPCC guidelines, consider a much larger area of forest to be under human management than global models. NGHGI consider the fluxes due to human-induced environmental change on this area to be anthropogenic and are thus reported. Global models, 2 in contrast, consider these fluxes to be natural and are excluded from the total reported anthropogenic land CO2 flux. To enable a like-with-like comparison, the remaining cumulative global CO2 emissions budget can be adjusted (medium confidence). In the absence of these adjustments, collective progress would appear better than it is. {Cross-Chapter Box 6 in this chapter, 7.2}
Addressing the many knowledge gaps in the development and testing of AFOLU mitigation options can rapidly advance the likelihood of achieving sustained mitigation (high confidence). Research priorities include improved quantification of anthropogenic and natural GHG fluxes and emissions modelling, better understanding of the impacts of climate change on the mitigation potential, permanence and additionality of estimated mitigation actions, and improved (real time and cheap) measurement, reporting and verification. There is a need to include a greater suite of mitigation measures in IAMs, informed by more realistic assessments that take into account local circumstances and socio-economic factors and cross-sector synergies and trade-offs. Finally, there is a critical need for more targeted research to develop appropriate country-level, locally specific, policy and land management response options. These options could support more specific NDCs with AFOLU measures that enable mitigation while also contributing to biodiversity conservation, ecosystem functioning, livelihoods for millions of farmers and foresters, and many other Sustainable Development Goals (SDGs) ( high conf idence). {7.7}
7.1Introduction
7.1.1Key Findings from Previous Reports
Agriculture, Forestry and Other Land Uses (AFOLU) is unique due to its capacity to mitigate climate change through greenhouse gas (GHG) emission reductions, as well as enhance removals (IPCC 2019). However, despite the attention on AFOLU since early 1990s it was reported in the IPCC Special Report on Climate Change and Land (SRCCL) as accounting for almost a quarter of anthropogenic emission (IPCC, 2019), with three main GHGs associated with AFOLU; carbon dioxide (CO2), methane (CH4) and nitrous oxide (N2O). Overall emission levels had remained similar since the publication of AR4 (Nabuurs et al. 2007). The diverse nature of the sector, its linkage with wider societal, ecological and environmental aspects and the required coordination of related policy, was suggested to make implementation of known and available supply- and demand-side mitigation measures particularly challenging (IPCC 2019). Despite such implementation barriers, the considerable mitigation potential of AFOLU as a sector on its own and its capacity to contribute to mitigation within other sectors was emphasised, with land-related measures, including bioenergy, estimated as capable of contributing between 20% and 60% of the total cumulative abatement to 2030 identified within transformation pathways (IPCC 2018). However, the vast mitigation potential from AFOLU initially portrayed in literature and in Integrated Assessment Models (IAMs), as explored in the IPCC Special Report on Climate Change of 1.5°C (SR1.5), is being questioned in terms of feasibility (Roe et al. 2021) and a more balanced perspective on the role of land in mitigation is developing, while at the same time, interest by private investors in land-based mitigation is increasing fast.
The SRCCL (IPCC 2019) outlined with medium evidence and medium agreement that supply-side agriculture and forestry measures had an economic (at USD100 tCO2-eq –1) mitigation potential of 7.2–10.6 GtCO2-eq –1 in 2030 (using GWP100 and multiple IPCC values for CH4 and N2O) of which about a third was estimated as achievable at <USD20 tCO2-eq –1. Agricultural measures were reported as sensitive to carbon price, with cropland and grazing land soil organic carbon management having the greatest potential at USD20 tCO2-eq –1 and restoration of organic soils at USD100 tCO2-eq –1. Forestry measures were less sensitive to carbon price, but varied regionally, with reduced deforestation, forest management and afforestation having the greatest potential depending on region. Although demand-side measures related to food could in theory make a large contribution to mitigation, in reality the contribution has been very small. Overall, the dependency of mitigation within AFOLU on a complex range of factors, from population growth, economic and technological developments, to the sustainability of mitigation measures and impacts of climate change, was suggested to make realisation highly challenging (IPCC 2019).
Land can only be part of the solution alongside rapid emission reduction in other sectors (IPCC 2019). It was recognised that land supports many ecosystem services on which human existence, well-being and livelihoods ultimately depend. Yet over-exploitation of land resources was reported as driving considerable and unprecedented rate of biodiversity loss, and wider environmental degradation (IPBES 2019b; IPCC 2019). Urgent action to reverse this trend was deemed crucial in helping to accommodate the increasing demands on land and enhance climate change adaptation capacity. There was high confidence that global warming was already causing an increase in the frequency and intensity of extreme weather and climate events, impacting ecosystems, food security, disturbances and production processes, with existing (and new) carbon stocks in soils and biomass at serious risk. The impact of land cover on regional climate (through biophysical effects) was also highlighted, although there was no confidence regarding impacts on global climate.
Since the IPCC Fifth Assessment Report (AR5), the share of AFOLU to anthropogenic GHG emissions had remained largely unchanged at 13–21% of total GHG emissions (medium confidence), though uncertainty in estimates of both sources and sinks of CO2, exacerbated by difficulties in separating natural and anthropogenic fluxes, was emphasised. Models indicated land (including the natural sink) to have very likely provided a net removal of CO2 between 2007 and 2016. As in AR5, land cover change, notably deforestation, was identified as a major driver of anthropogenic CO2 emissions while agriculture was a major driver of the increasing anthropogenic CH4 and N2O emissions.
In terms of mitigation, without reductions in overall anthropogenic emissions, increased reliance on large-scale land-based mitigation was predicted, which would add to the many already competing demands on land. However, some mitigation measures were suggested to not compete with other land uses, while also having multiple co-benefits, including adaptation capacity and potential synergies with some Sustainable Development Goals (SDGs). As in AR5, there was large uncertainty surrounding mitigation within AFOLU, in part because current carbon stocks and fluxes are unclear and subject to temporal variability. Additionally, the non-additive nature of individual measures that are often inter-linked and the highly context specific applicability of measures, causes further uncertainty. Many AFOLU measures were considered well-established and some achievable at low to moderate cost, yet contrasting economic drivers, insufficient policy, lack of incentivisation and institutional support to stimulate implementation among the many stakeholders involved, in regionally diverse contexts, was recognised as hampering realisation of potential.
None the less, the importance of mitigation within AFOLU was highlighted in all IPCC reports, with modelled scenarios demonstrating the considerable potential role and land-based mitigation forming an important component of pledged mitigation in Nationally Determined Contributions (NDCs) under the Paris Agreement. The sector was identified as the only one in which large-scale carbon dioxide removal (CDR) may currently and at short term be possible (e.g., through afforestation/reforestation or soil organic carbon management). This CDR component was deemed crucial to limit climate change and its impacts, which would otherwise lead to enhanced release of carbon from land. However, the SRCCL emphasised that mitigation cannot be pursued in isolation. The need for integrated response options, that mitigate and adapt to climate change, but also deal with land degradation and desertification, while enhancing food and fibre security, biodiversity and contributing to other SDGs has been made clear (IPCC 2019; IPBES 2019a; IPBES-IPCC 2021).
7.1.2Boundaries, Scope and Changing Context of the Current Report
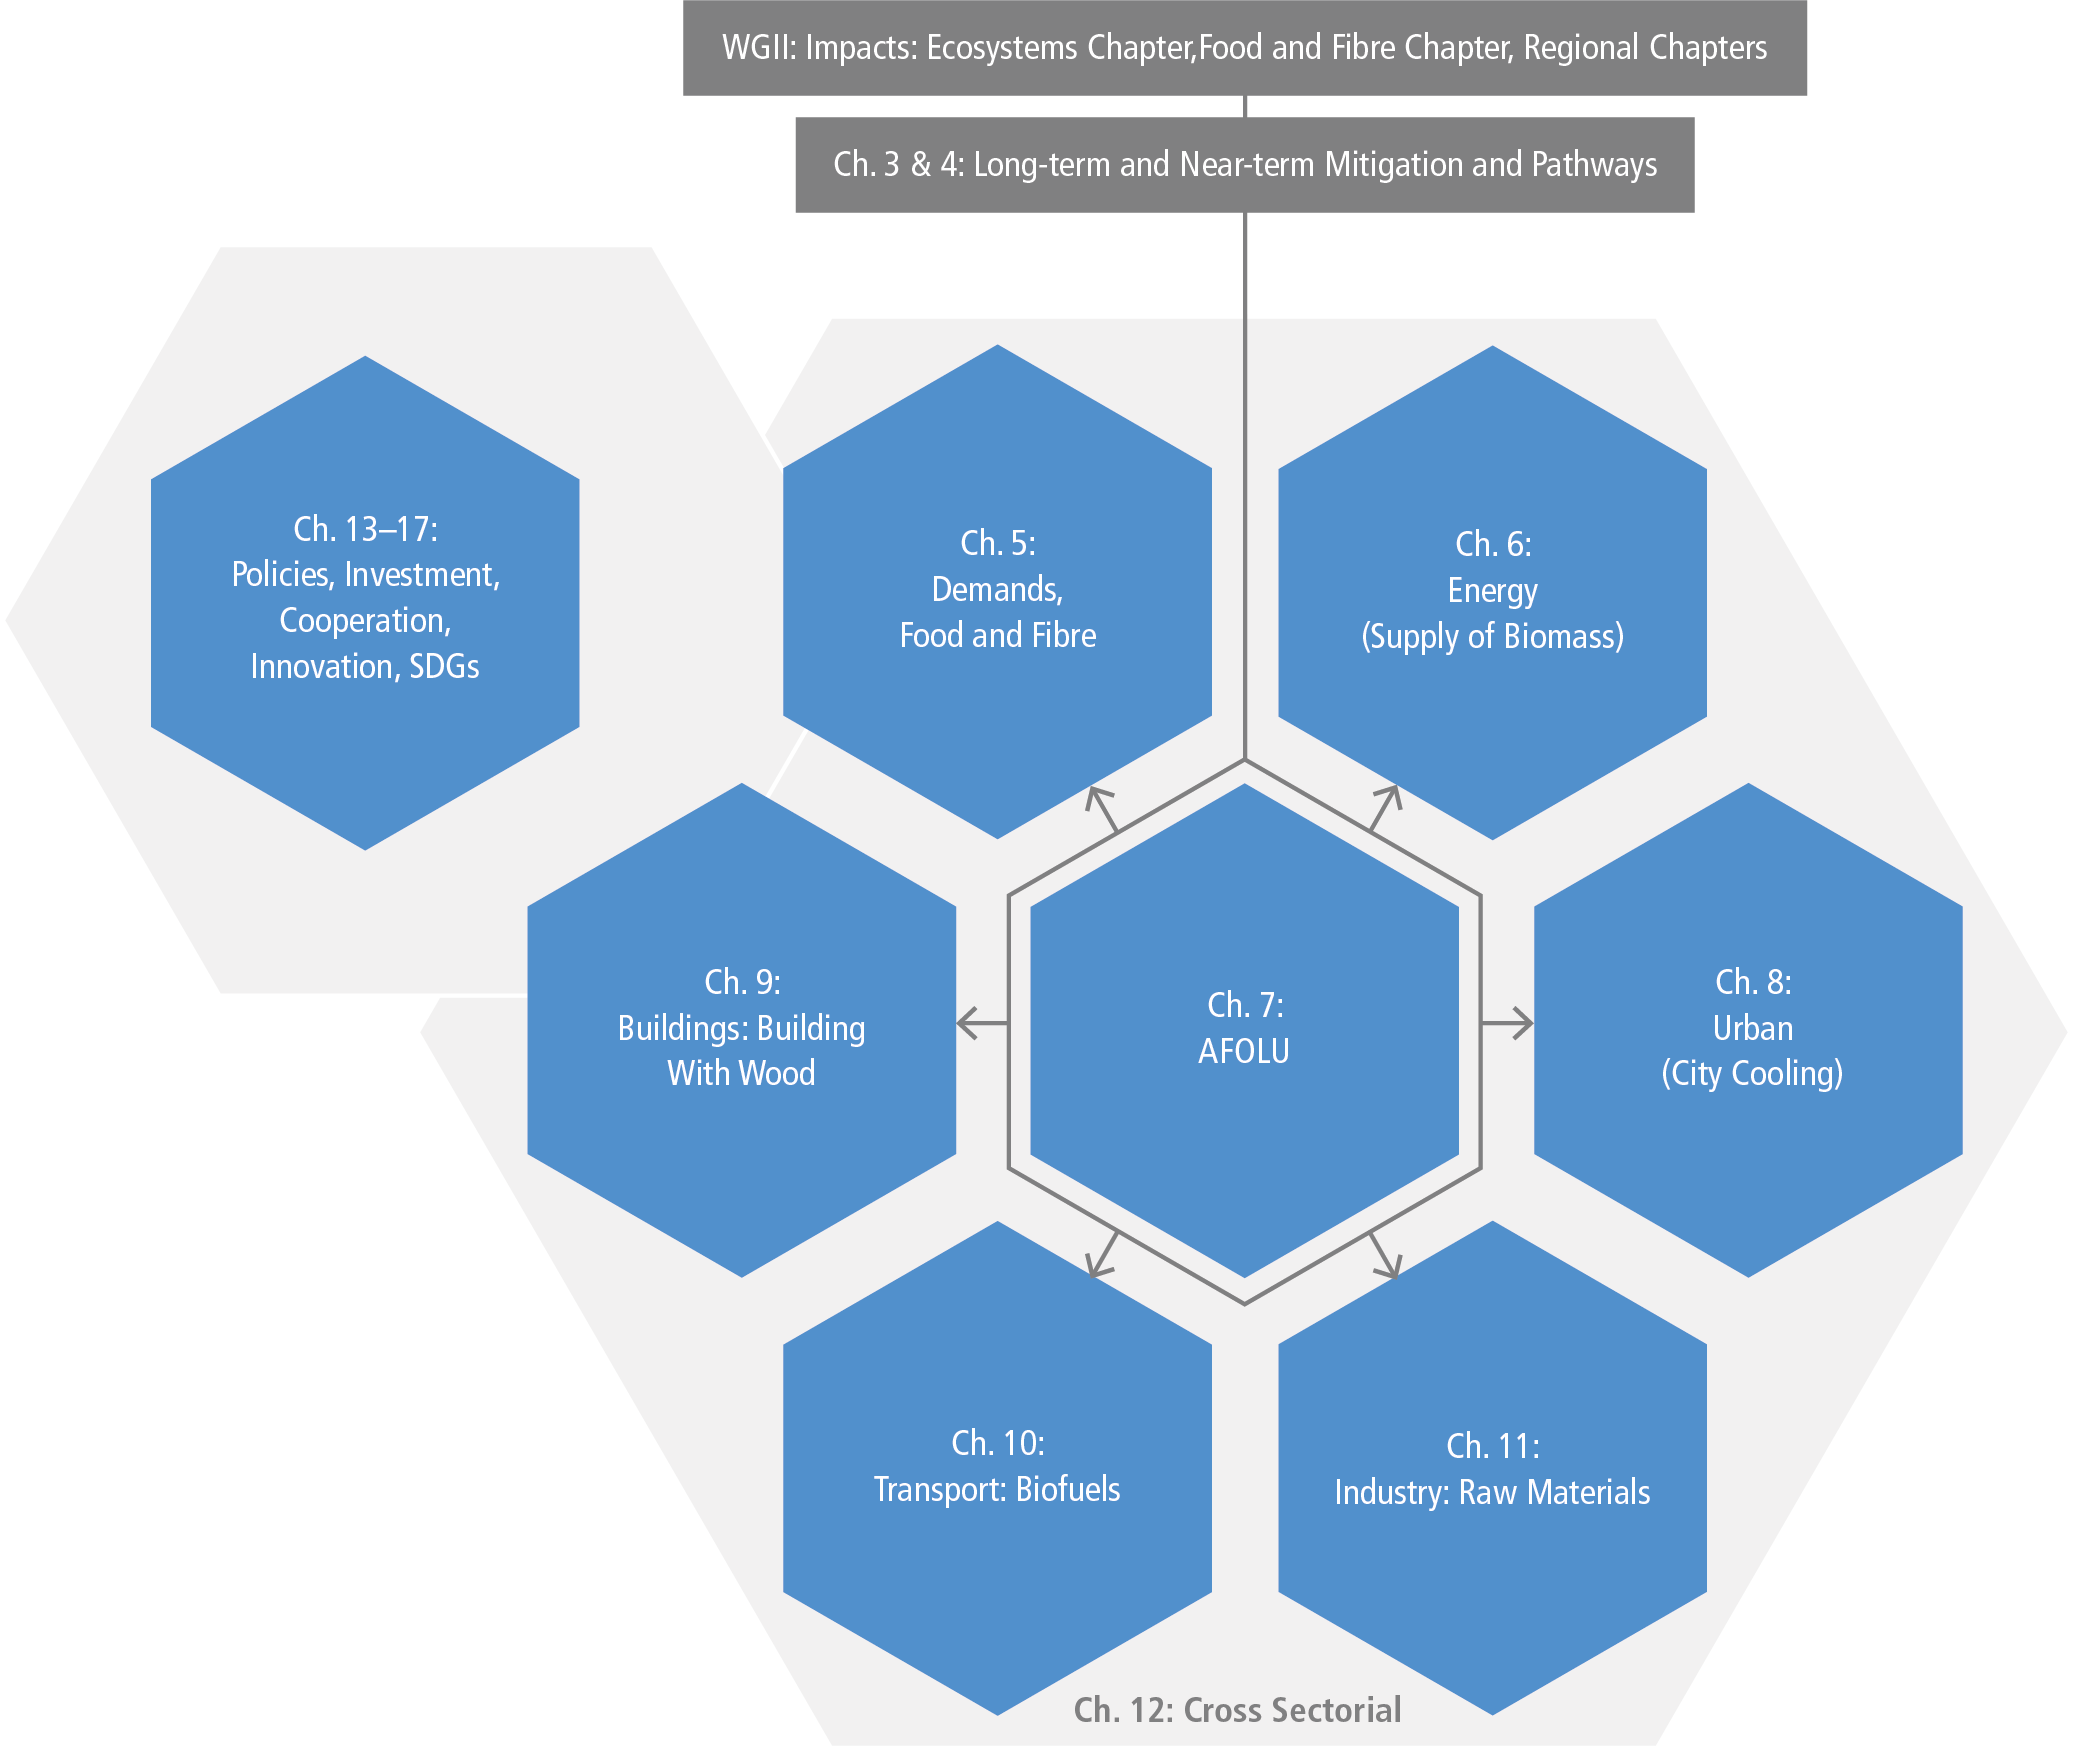
This chapter assesses GHG fluxes between land and the atmosphere due to AFOLU, the associated drivers behind these fluxes, mitigation response options and related policy, at time scales of 2030 and 2050. Land and its management has important links with other sectors and therefore associated chapters within this report, notably concerning the provision of food, feed, fuel or fibre for human consumption and societal well-being (Chapter 5), for bioenergy (Chapter 6), the built environment (Chapter 9), transport (Chapter 10) and industry (Chapter 11). Mitigation within these sectors may in part, be dependent on contributions from land and the AFOLU sector, with interactions between all sectors discussed in Chapter 12. This chapter also has important links with IPCC AR6 WGII regarding climate change impacts and adaptation. Linkages are illustrated in Figure 7.1.
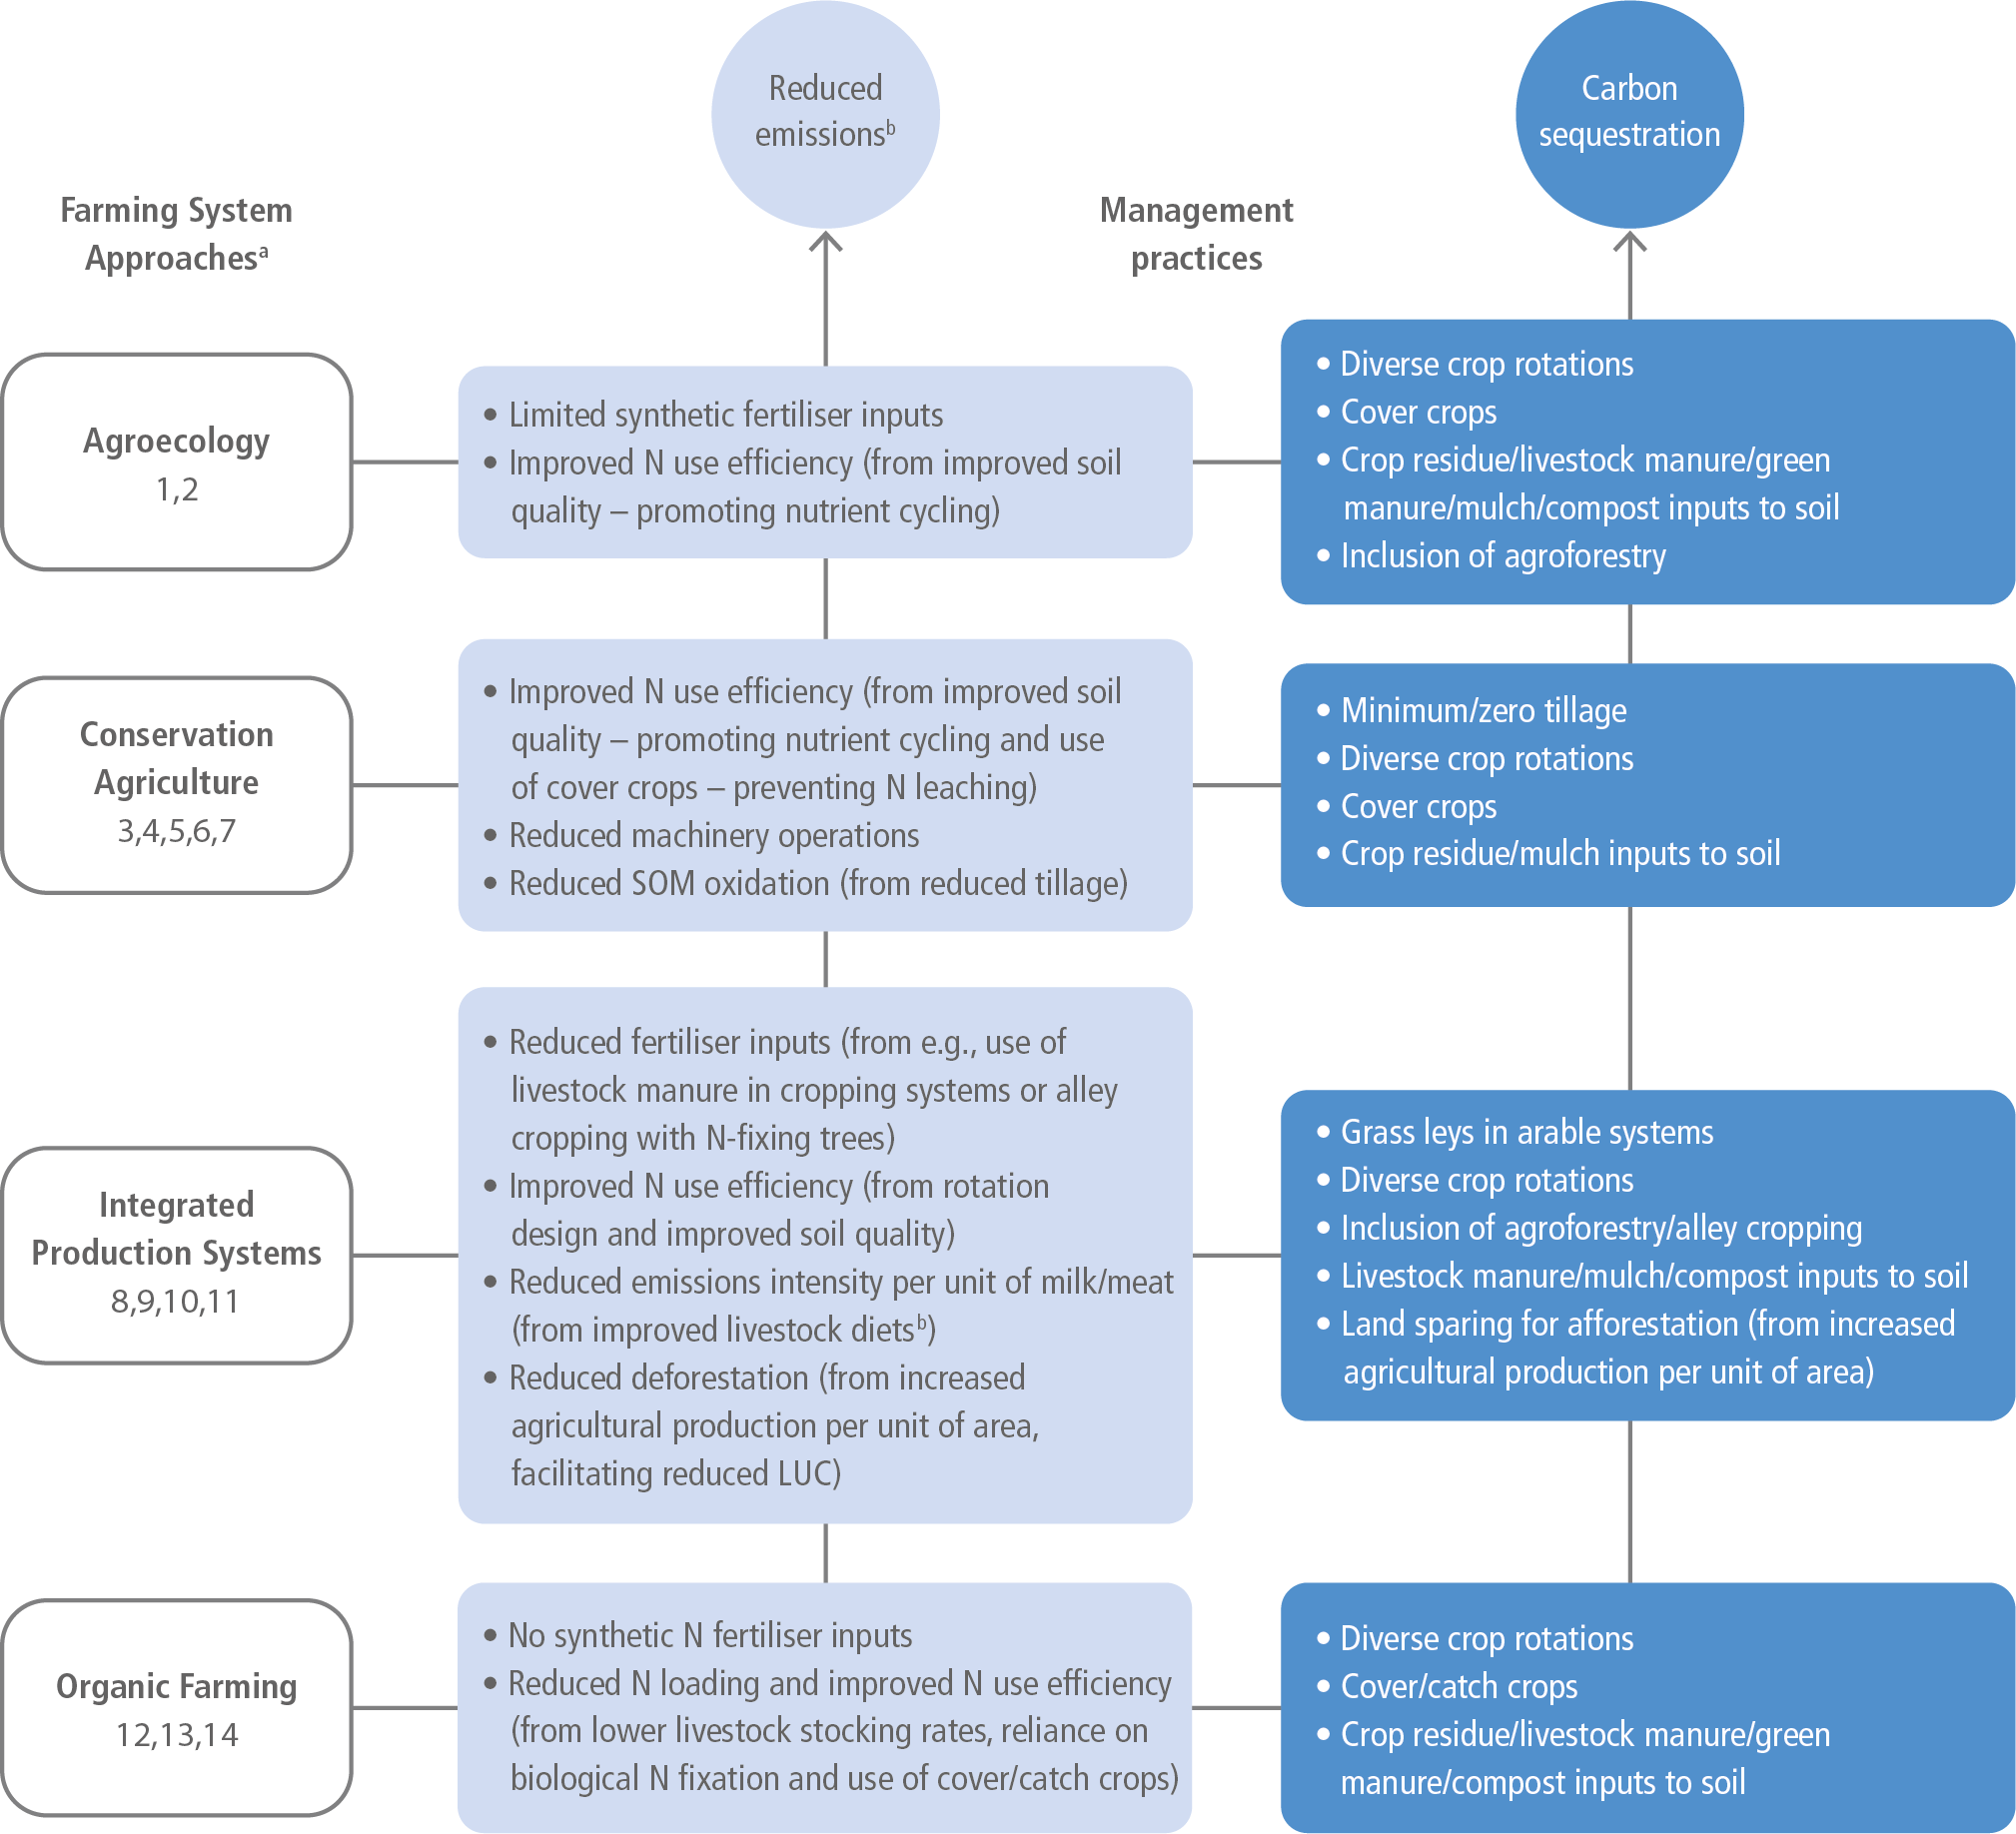
As highlighted in both AR5 and the SRCCL, there is a complex interplay between land management and GHG fluxes as illustrated in Figure 7.2, with considerable variation in management regionally, as a result of geophysical, climatic, ecological, economic, technological, institutional and socio-cultural diversity. The capacity for land-based mitigation varies accordingly. The principal focus of this chapter is therefore, on evaluating regional land-based mitigation potential, identifying applicable AFOLU mitigation measures, estimating associated costs and exploring policy options that could enable implementation.
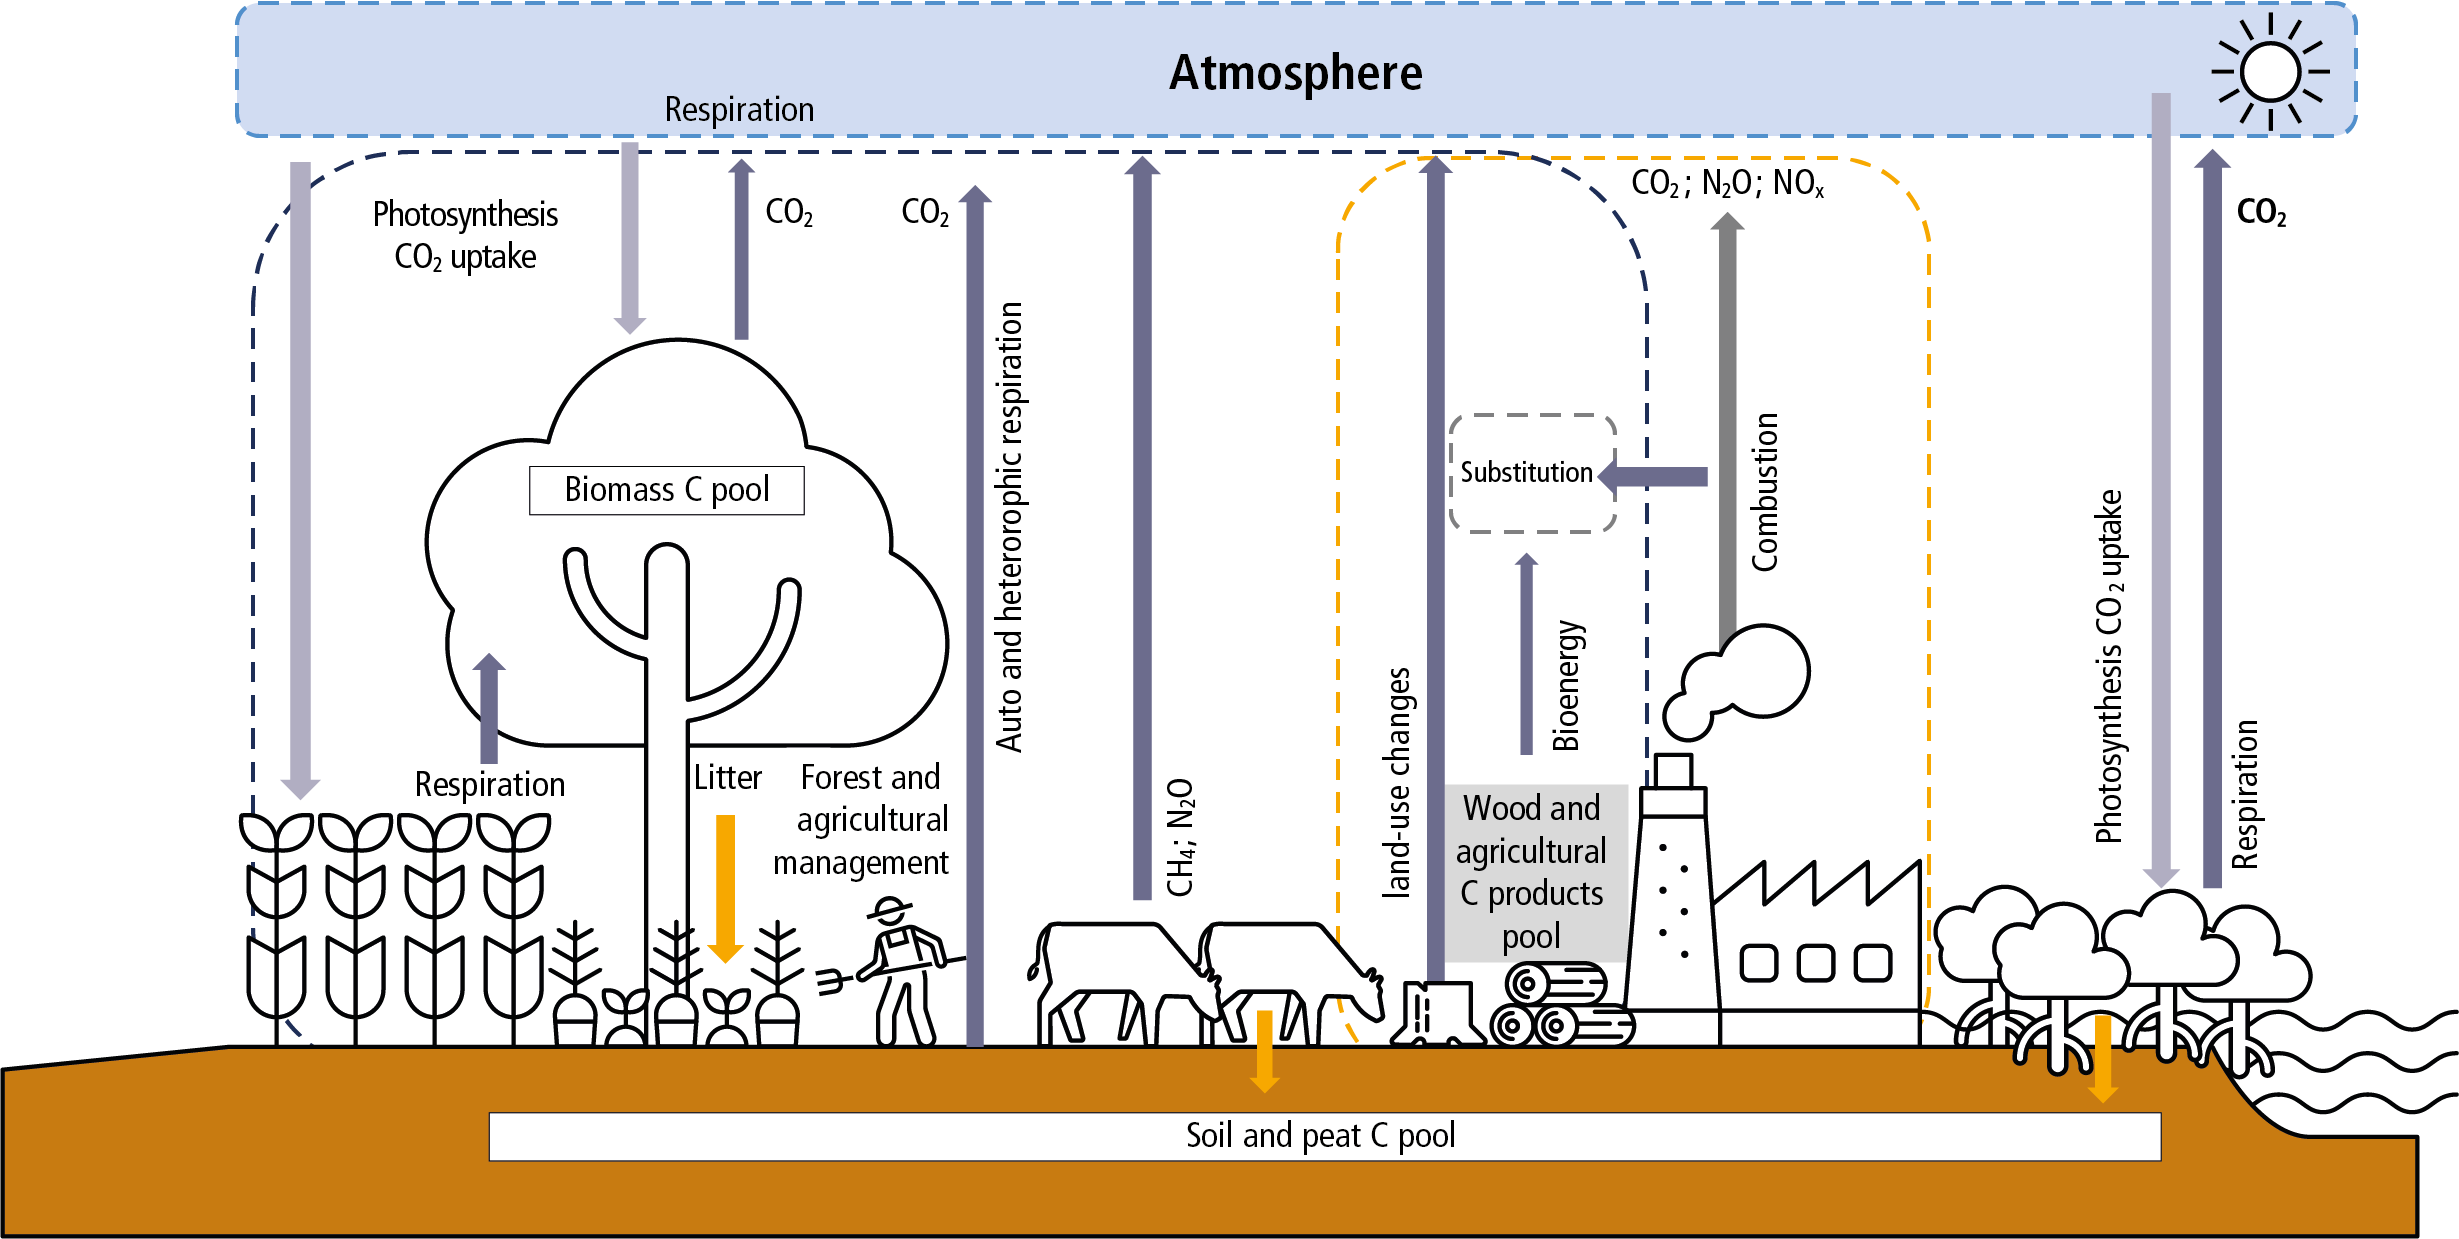
Figure 7.2 | Summarised representation of interactions between land management, its products in terms of food and fibre, and land–atmospheric GHG fluxes. For legibility reasons only a few of the processes and management measures are depicted.
Mitigation measures are broadly categorised as those relating to (i) forests and other ecosystems (ii) agriculture (iii) biomass production for products and bioenergy and (iv) demand-side levers. Assessment is made in the context that land-mitigation is expected to contribute roughly 25% of the 2030 mitigation pledged in Nationally Determined Contributions (NDCs) under the Paris Agreement (Grassi et al. 2017), yet very few countries have provided details on how this will be achieved. In light of AR5 and the SRCCL findings, that indicate large land-based mitigation potential, considerable challenges to its realisation, but also a clear nexus at which humankind finds itself, whereby current land management, driven by population growth and consumption patterns, is undermining the very capacity of land, a finite resource, to support wider critical functions and services on which humankind depends. Mitigation within AFOLU is occasionally and wrongly perceived as an opportunity for in-action within other sectors. AFOLU simply cannot compensate for mitigation shortfalls in other sectors. As the outcomes of many critical challenges (UNEP 2019), including biodiversity loss (IPBES 2019a) and soil degradation (FAO and ITPS 2015), are inextricably linked with how we manage land, the evaluation and assessment of AFOLU is crucial. This chapter aims to address three core topics:
1. What is the latest estimated (economic) mitigation potential of AFOLU measures according to both sectoral studies and integrated assessment models, and how much of this may be realistic within each global region?
2. How do we realise the mitigation potential, while minimising trade-offs and risks and maximising co-benefits that can enhance food and fibre security, conserve biodiversity and address other land challenges?
3. How effective have policies been so far and what additional policies or incentives might enable realisation of mitigation potential and at what costs?
This chapter first outlines the latest trends in AFOLU fluxes and the methodology supporting their estimation (Section 7.2). Direct and indirect drivers behind emission trends are discussed in Section 7.3. Mitigation measures, their costs, co-benefits, trade-offs, estimated regional potential and contribution within integrated global mitigation scenarios, is presented in Sections 7.4 and 7.5 respectively. Assessment of associated policy responses and links with SDGs are explored in Section 7.6. The chapter concludes with gaps in knowledge (Section 7.7) and frequently asked questions.
7.2Historical and Current Trends in GHG Emission and Removals; Their Uncertainties and Implications for Assessing Collective Climate Progress
The biosphere on land and in wetlands is a source and sink of CO2 and CH4, and a source of N2O due to both natural and anthropogenic processes that happen simultaneously and are therefore difficult to disentangle (IPCC 2010; Angelo and Du Plesis 2017; IPCC 2019). AFOLU is the only GHG sector to currently include anthropogenic sinks. A range of methodological approaches and data have been applied to estimating AFOLU emissions and removals, each developed for their own purposes, with estimates varying accordingly. Since the SRCCL (Jia et al. 2019), emissions estimates have been updated (Sections 7.2.2 and 7.2.3), while the assessment of biophysical processes and short-lived climate forcers (Section 7.2.4) is largely unchanged. Further progress has been made on the implications of differences in AFOLU emissions estimates for assessing collective climate progress (Section 7.2.2.2 and Cross-Chapter Box 6 in this chapter).
7.2.1Total Net GHG Flux from AFOLU
National greenhouse gas inventory (NGHGI) reporting following the IPCC 1996 guidelines (IPCC 1996), separates the total anthropogenic AFOLU flux into: (i) net anthropogenic flux from Land Use, Land-Use Change, and Forestry (LULUCF) due to both change in land cover and land management; and (ii) the net flux from Agriculture. While fluxes of CO2 (Section 7.2.2) are predominantly from LULUCF and fluxes of CH4 and N2O (Section 7.2.3) are predominantly from agriculture, fluxes of all three gases are associated with both sub-sectors. However, not all methods separate them consistently according to these sub-sectors, thus here we use the term AFOLU, separate by gas and implicitly include CO2 emissions that stem from the agriculture part of AFOLU, though these account for a relatively small portion.
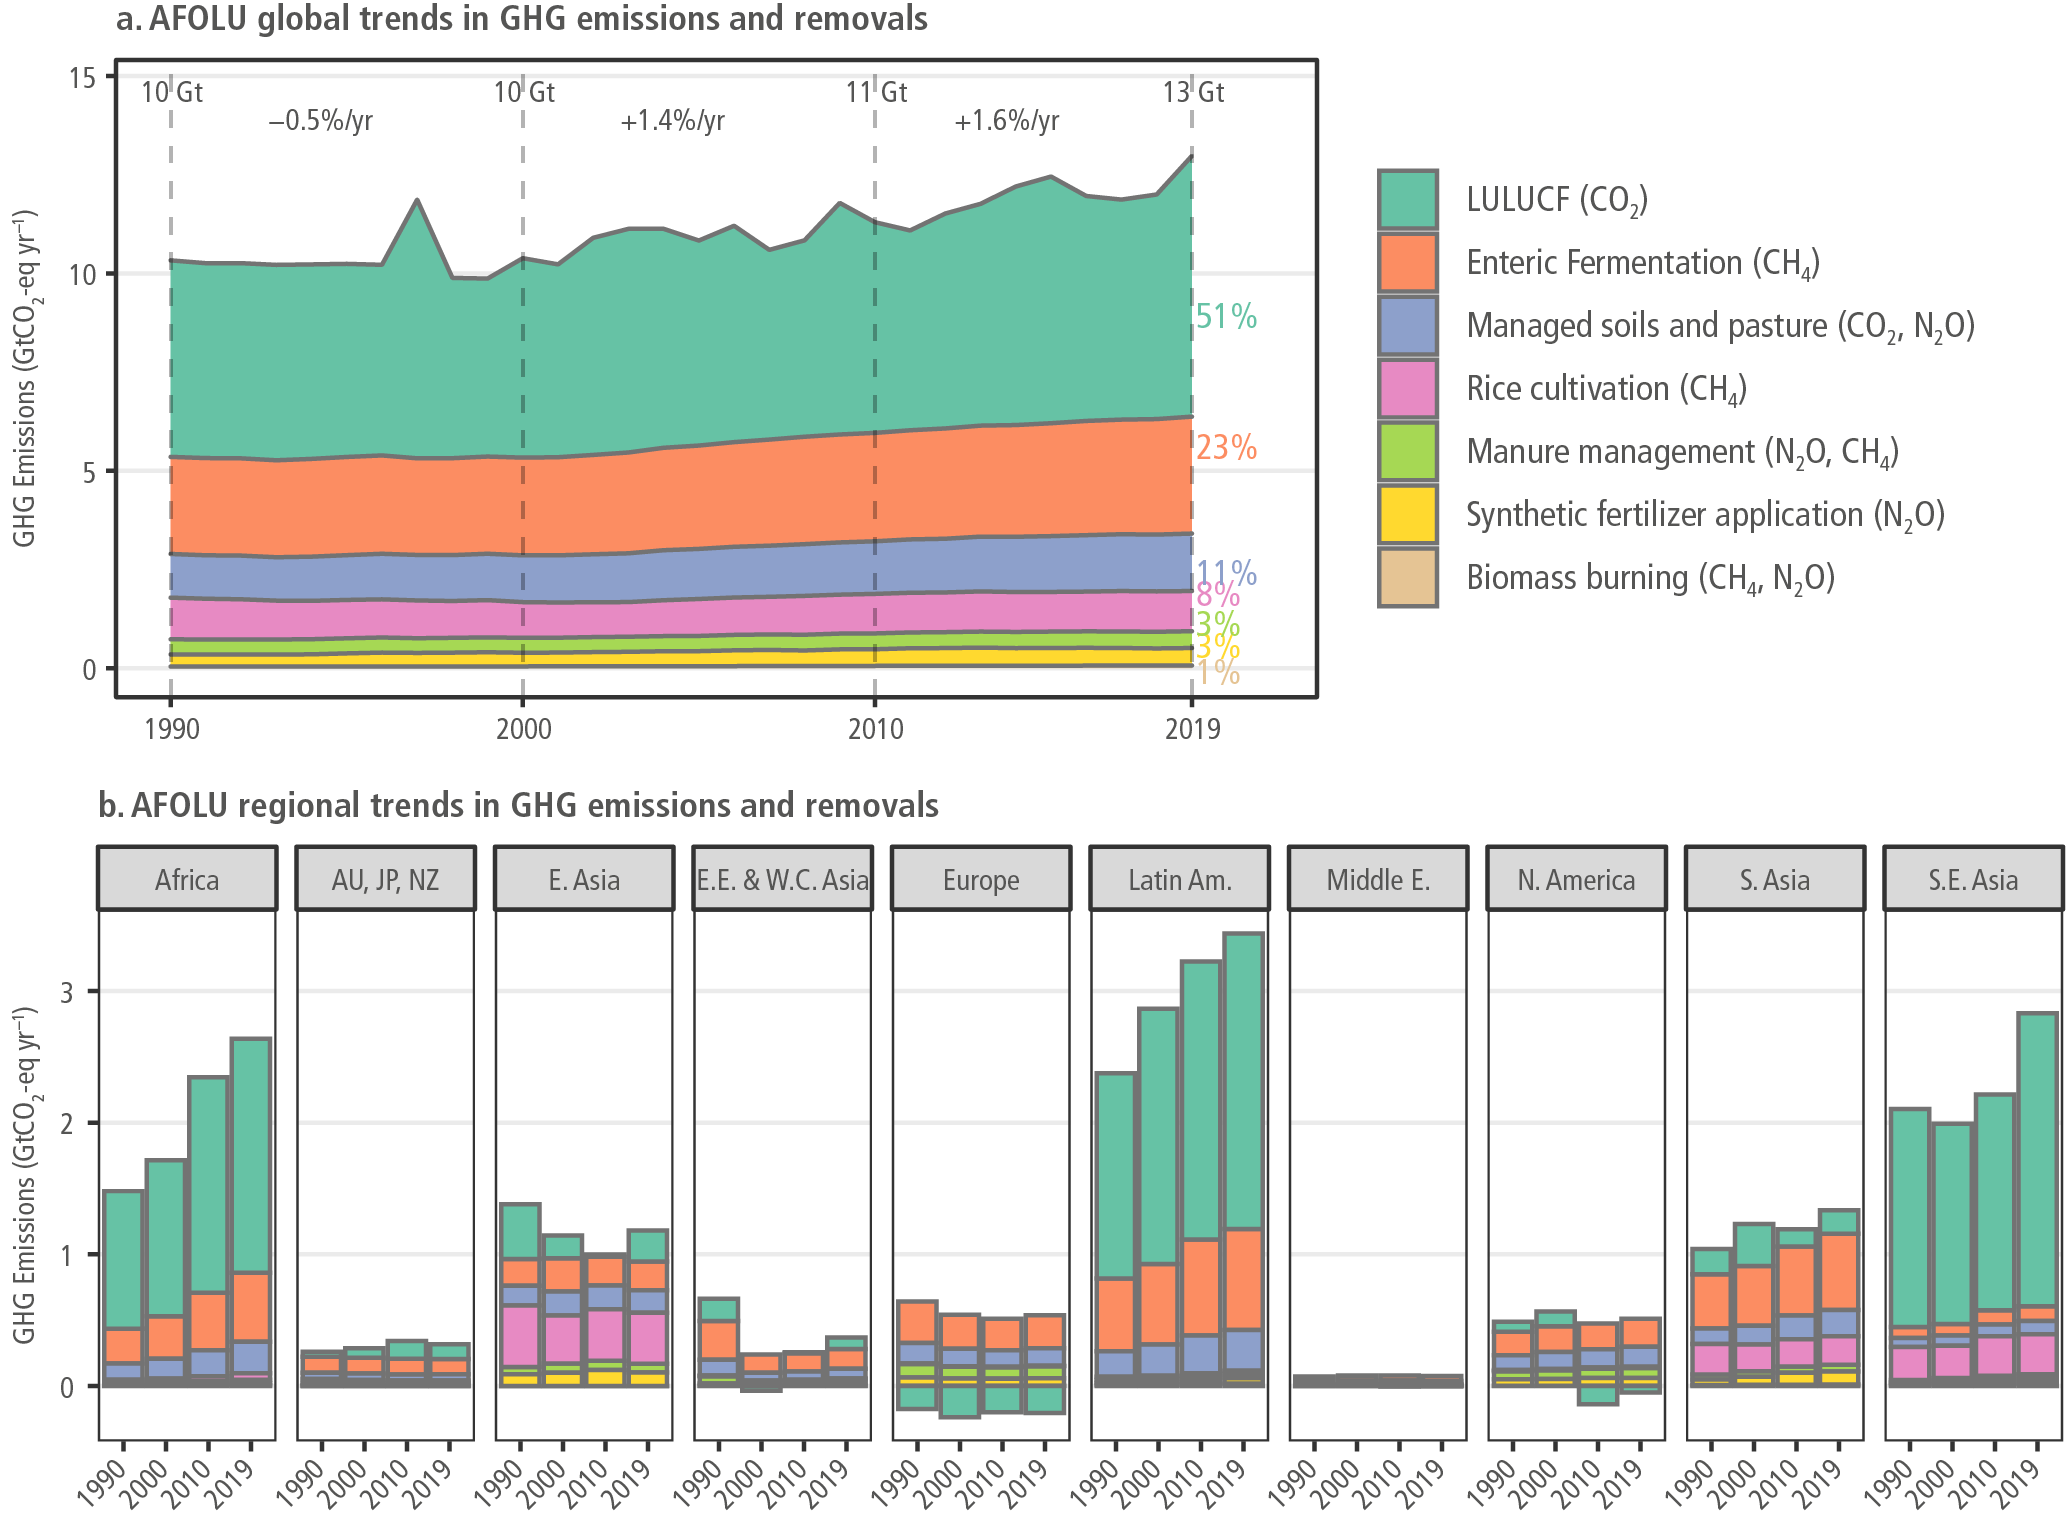
Total global net anthropogenic GHG emissions from AFOLU were 11.9 ± 4.4 GtCO2-eq yr –1 on average over the period 2010–2019, around 21% of total global net anthropogenic GHG emissions (Table 7.1 and Figure 7.3, using the sum of bookkeeping models for the CO2 component). When using FAOSTAT/NGHGIs CO2 flux data, then the contribution of AFOLU to total emissions amounts to 13% of global emissions.
Table 7.1 | Net anthropogenic emissions (annual averages for2010–2019a) from Agriculture, Forestry and Other Land Use (AFOLU). For context, the net flux due to the natural response of land to climate and environmental change is also shown for CO2 in column E. Positive values represent emissions, negative values represent removals.
Anthropogenic | Natural response | Natural and anthropogenic | |||||
Gas | Units | AFOLU Net anthropogenic emissionsh | Non-AFOLU anthropogenic GHG emissionsd, f | Total net anthropogenic emissions (AFOLU + non-AFOLU) by gas | AFOLU as a % of total net anthropogenic emissions by gas | Natural land sinks including natural response of land to anthropogenic environmental change and climate variabilitye | Net land- atmosphere CO2flux (i.e., anthropogenic AFOLU + natural fluxes across entire land surface |
A | B | C = A+B | D = (A/C) *100 | E | F=A+E | ||
CO2 | GtCO2-eq yr –1 | 5.9 ± 4.1b, f (book-keeping models, managed soils and pasture). 0 to 0.8 (NGHGI/ FAOSTAT data) | 36.2 ± 2.9 | 42.0 ± 29.0 | 14% | –12.5 ± 3.2 | –6.6 ± 4.6 |
CH4 | MtCH4 yr –1 | 157.0 ± 47.1c | 207.5 ± 62.2 | 364.4 ± 109.3 | –i | ||
GtCO2-eq yr –1 | 4.2 ± 1.3g | 5.9 ± 1.8 | 10.2 ± 3.0 | 41% | |||
N2O | MtN2O yr –1 | 6.6 ± 4.0c | 2.8 ± 1.7 | 9.4 ± 5.6 | |||
GtCO2-eq yr –1 | 1.8 ± 1.1g | 0.8 ± 0.5 | 2.6 ± 1.5 | 69% | |||
Totalj | GtCO2-eq yr –1 | 11.9 ± 4.4 (CO2 component based on book-keeping models, managed soils and pasture) | 44 ± 3.4 | 55.9 ± 6.1 | 21% | ||
aEstimates are given until 2019 as this is the latest date when data are available for all gases, consistent with Chapter 2, this report. Positive fluxes are emission from land to the atmosphere. Negative fluxes are removals.
bNet anthropogenic flux of CO2 are due to land-use change such as deforestation and afforestation and land management, including wood harvest and regrowth, peatland drainage and fires, cropland and grassland management. Average of three bookkeeping models (Hansis et al. 2015; Houghton and Nassikas 2017; Gasser et al. 2020), complemented by data on peatland drainage and fires from FAOSTAT (Prosperi et al. 2020) and GFED4s (van der Werf et al. 2017). Bookkeeping based CO2-LULUCF emissions (5.7±4.0) are consistent with AR6 WGI and Chapter 2 of this report. The value of 5.9(±4.1) includes CO2 emissions from urea application to managed soils and pasture. Comparisons with other estimates are discussed in 7.2.2. Based on NGHGIs and FAOSTAT, the range is 0 to 0.8 GtCO2 yr –1.
cCH4 and N2O emission estimates and assessed uncertainty of 30 and 60% respectively, are based on Emissions Database for Global Atmospheric Research (EDGAR) data (Crippa et al. 2021) in accordance with Chapter 2, this report (Sections 2.2.1.3 and 2.2.1.4). Both FAOSTAT (Tubiello 2019; USEPA 2019; FAO 2021a) and the USA EPA (USEPA 2019) also provide data on agricultural non-CO2 emissions, however, mean global CH4 and N2O values considering the three databases are within the uncertainty bounds of EDGAR. EDGAR only considers agricultural and not overall AFOLU non-CO2 emissions. Agriculture is estimated to account for approximately 89 and 96% of total AFOLU CH4 and N2O emissions respectively. See Section 7.2.3 for further discussion.
dTotal non-AFOLU emissions are the sum of total CO2-eq emissions values for energy, industrial sources, waste and other emissions with data from the Global Carbon Project for CO2, including international aviation and shipping, and from the PRIMAP database for CH4 and N2O averaged over 2007–2014, as that was the period for which data were available.
eThe modelled CO2 estimates include natural processes in vegetation and soils and how they respond to both natural climate variability and to human-induced environmental changes, for example, the response of vegetation and soils to environmental changes such as increasing atmospheric CO2 concentration, nitrogen deposition, and climate change (indirect anthropogenic effects) on both managed and unmanaged lands. The estimate shown represents the average from 17 Dynamic Global Vegetation Models with 1SD uncertainty (Friedlingstein et al. 2020).
f The NGHGIs take a different approach to calculating ‘anthropogenic’ CO2 fluxes than the models (Section 7.2.2). In particular the sinks due to environmental change (indirect anthropogenic fluxes) on managed lands are generally treated as anthropogenic in NGHGIs and non-anthropogenic in models such as bookkeeping and IAMs. A reconciliation of the results between IAMs and NGHGIs is presented in Cross-Chapter Box 6 in this chapter. If applied to this table, it would transfer approximately –5.5 GtCO2 yr –1 (a sink) from Column E (which would become –7.0 GtCO2 yr –1) to Column A (which would then be 0.4 GtCO2 yr –1).
gAll values expressed in units of CO2-eq are based on IPCC AR6 100-year Global Warming Potential (GWP100) values with climate-carbon feedbacks (CH4= 27, N2O = 273) (Chapter 2, Supplementary Material 2.SM.3; IPCC AR6 WGI Section 7.6).
hFor assessment of cross-sector fluxes related to the food sector, see Chapter 12.
iWhile it is acknowledged that soils are a natural CH4 sink (Jackson et al. 2020) with soil microbial removals estimated to be 30 ± 19 MtCH4 yr –1 for the period 2008–2017 (according to bottom-up estimates), natural CH4 sources are considerably greater (371 (245–488) MtCH4 yr –1) resulting in natural processes being a net CH4 source (IPCC AR6 WGI Section 5.2.2). The soil CH4 sink is therefore omitted from Column E.
jTotal GHG emissions concerning non-AFOLU sectors and all sectors combined (Columns B and C) include fluorinated gases in addition to CO2, CH4 and N2O. Therefore, total values do not equal the sum of estimates for CO2, CH4 and N2O.

Figure 7.3 | Subdivision of the total AFOLU emissions from Table 7. 1 by activity and gas for the period 1990 to 2019. Positive values are emissions from land to atmosphere, negative values are removals. Panel A shows emissions divided into major activity and gases. Note that ‘biomass burning’ is only the burning of agriculture residues in the fields. The indicated growth rates between 1990–2000, 2000–2010, 2010–2019 are annualised across each time period. Panel B illustrates regional emissions in the years 1990, 2000, 2010, 2019 AFOLU CO2 (green shading) represents all AFOLU CO2 emissions. It is the mean from three bookkeeping models (Hansis et al. 2015; Houghton and Nassikas 2017; Gasser et al. 2020) as presented in the Global Carbon Budget (Friedlingstein et al. 2020) and is not directly comparable to LULUCF in NGHGIs (Section 7.2.2). Data on CH4 and N2O emissions are from the EDGAR database (Crippa et al. 2021). See Sections 7.2.2 and 7.2.3 for comparison of different datasets. All values expressed are as CO2-eq with GWP100 values: CH4= 27, N2O = 273.
This AFOLU flux is the net of anthropogenic emissions of CO2, CH4 and N2O, and anthropogenic removals of CO2. The contribution of AFOLU to total emissions varies regionally with highest in Latin America and Caribbean with 58% and lowest in Europe and North America with each 7% (Chapter 2, Section 2.2.3). There is a discrepancy in the reported CO2AFOLU emissions magnitude because alternative methodological approaches that incorporate different assumptions are used (Section 7.2.2.2). While there is low agreement in the trend of global AFOLU CO2 emissions over the past few decades (Section 7.2.2), they have remained relatively constant (medium confidence) (Chapter 2). Average non-CO2 emission (aggregated using GWP100 IPCC AR6 values) from agriculture have risen from 5.2 ± 1.4 GtCO2-eq yr –1 for the period 1990 to 1999, to 6.0 ± 1.7 GtCO2-eq yr –1 for the period 2010 to 2019 (Crippa et al. 2021) (Section 7.2.3).
To present a fuller understanding of land–atmosphere interactions, Table 7.1 includes an estimate of the natural sink of land to atmospheric CO2 (Jia et al. 2019) (IPCC AR6 WGI Chapter 5). Land fluxes respond naturally to human-induced environmental change (e.g., climate change, and the fertilising effects of increased atmospheric CO2 concentration and nitrogen deposition), known as ‘indirect anthropogenic effects’, and also to ‘natural effects’ such as climate variability (IPCC 2010) (Table 7.1 and Section 7.2.2). This showed a removal of –12.5 ± 3.2 GtCO2 yr –1 (medium confidence) from the atmosphere during 2010–2019 according to global dynamic global vegetation model (DGVM) models (Friedlingstein et al. 2020) 31% of total anthropogenic net emissions of CO2 from all sectors. It is likely that the NGHIs and FAOSTAT implicitly cover some part of this sink and thus provide a net CO2AFOLU balance with some 5 GtCO2 lower net emissions than according to bookkeeping models, with the overall net CO2 value close to being neutral. Model results and atmospheric observations concur that, when combining both anthropogenic (AFOLU) and natural processes on the entire land surface (the total ‘land–atmosphere flux’), the land was a global net sink for CO2 of –6.6 ± 4.6 GtCO2 yr –1 with a range for 2010 to 2019 from –4.4 to –8.4 GtCO2 yr –1. (Rödenbeck et al. 2003, 2018; Chevallier et al. 2005; Feng et al. 2016; van der Laan-Luijkx et al. 2017; Niwa et al. 2017; Patra et al. 2018). The natural land sink is highly likely to be affected by both future AFOLU activity and climate change (IPCC AR6 WGI Box 5.1 and Figure SPM. 7), whereby under more severe climate change, the amount of carbon stored on land would still increase although the relative share of the emissions that land takes up, declines.
7.2.2Flux of CO2 from AFOLU, and the Non-anthropogenic Land Sink
7.2.2.1Global Net AFOLU CO2Flux
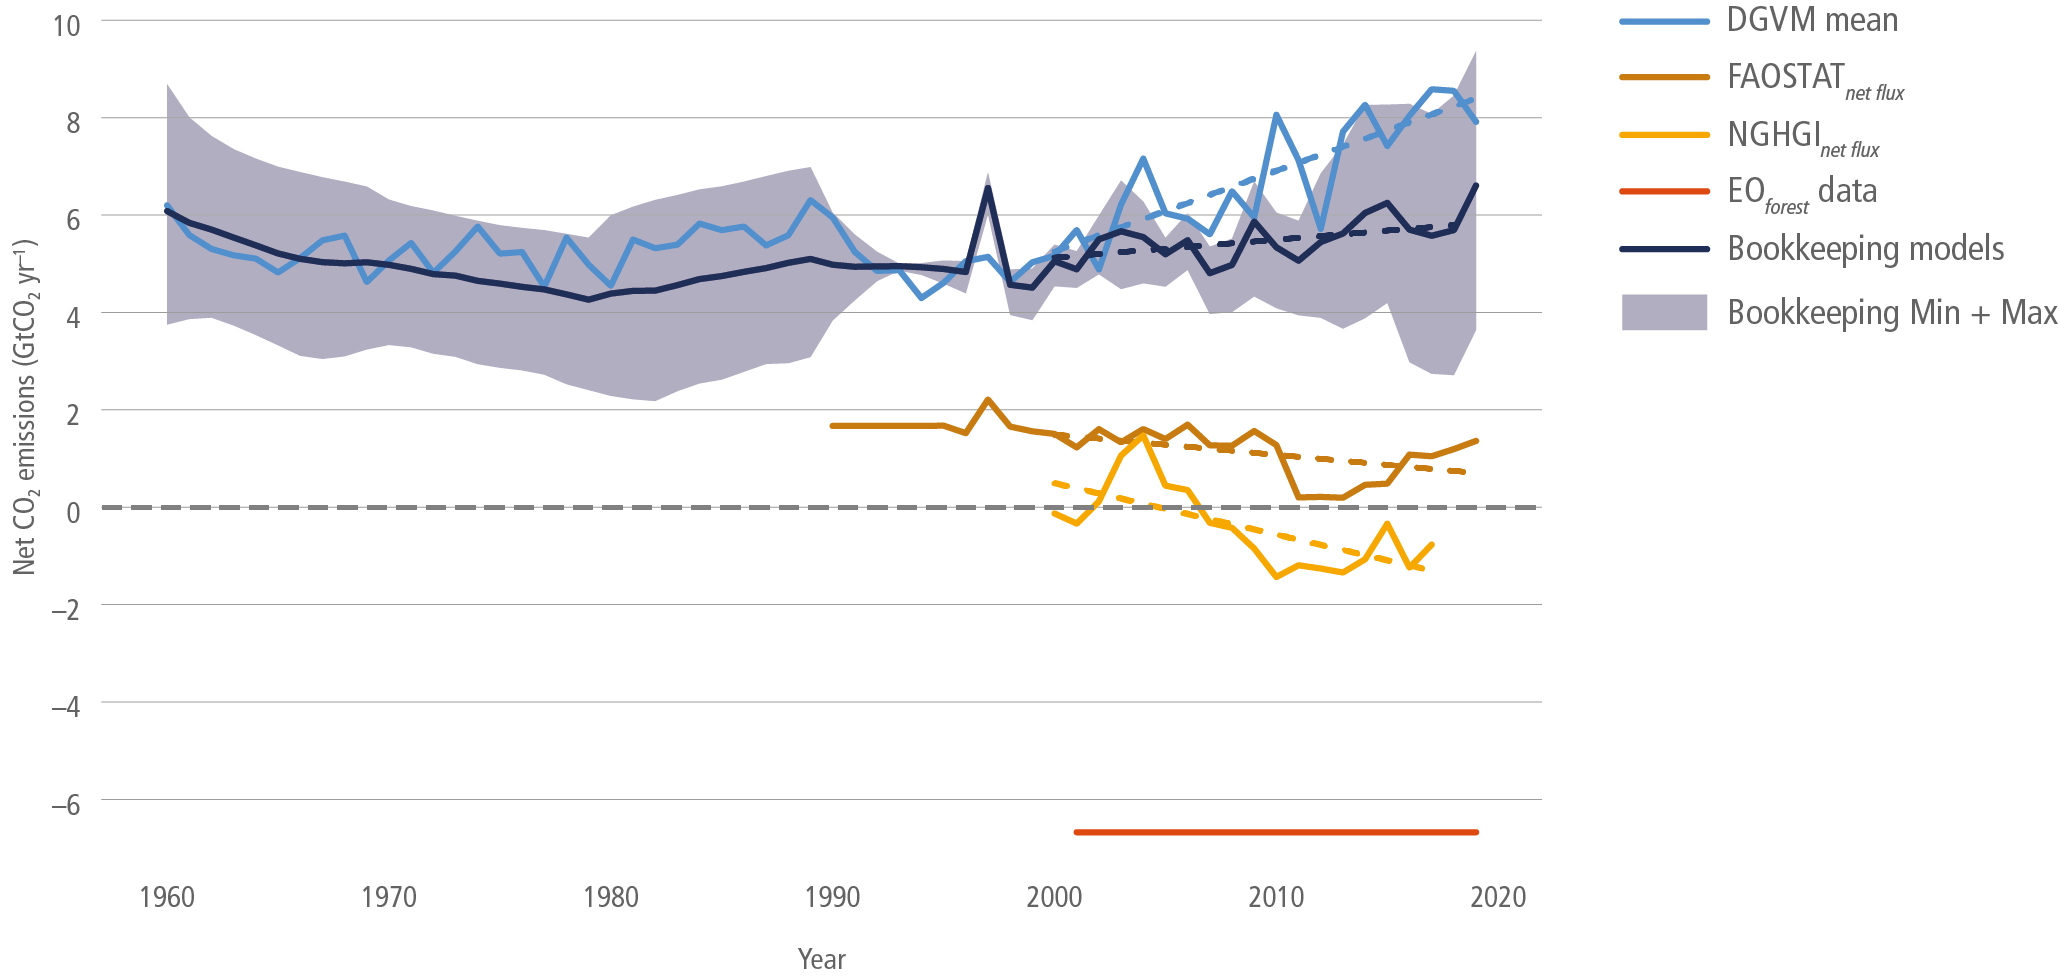
Comparison of estimates of the global net AFOLU flux of CO2 from diverse approaches (Figure 7.4) show differences on the order of several GtCO2 yr –1. When considering the reasons for the differences, and an approach to reconcile them (Grassi et al. 2021) (Section 7.2.2.3), there is medium confidence in the magnitude of the net AFOLU CO2 flux. There is a discrepancy in the reported CO2AFOLU emissions magnitude because alternative methodological approaches that incorporate different assumptions are used (Section 7.2.2.2). While the mean of the bookkeeping and DGVM model’s show a small increase in global CO2 net emissions since year 2000, individual models suggest opposite trends (Friedlingstein et al. 2020). The latest FAOSTAT and NGHGI estimates show a small reduction in net emission. Overall, the trends are unclear.
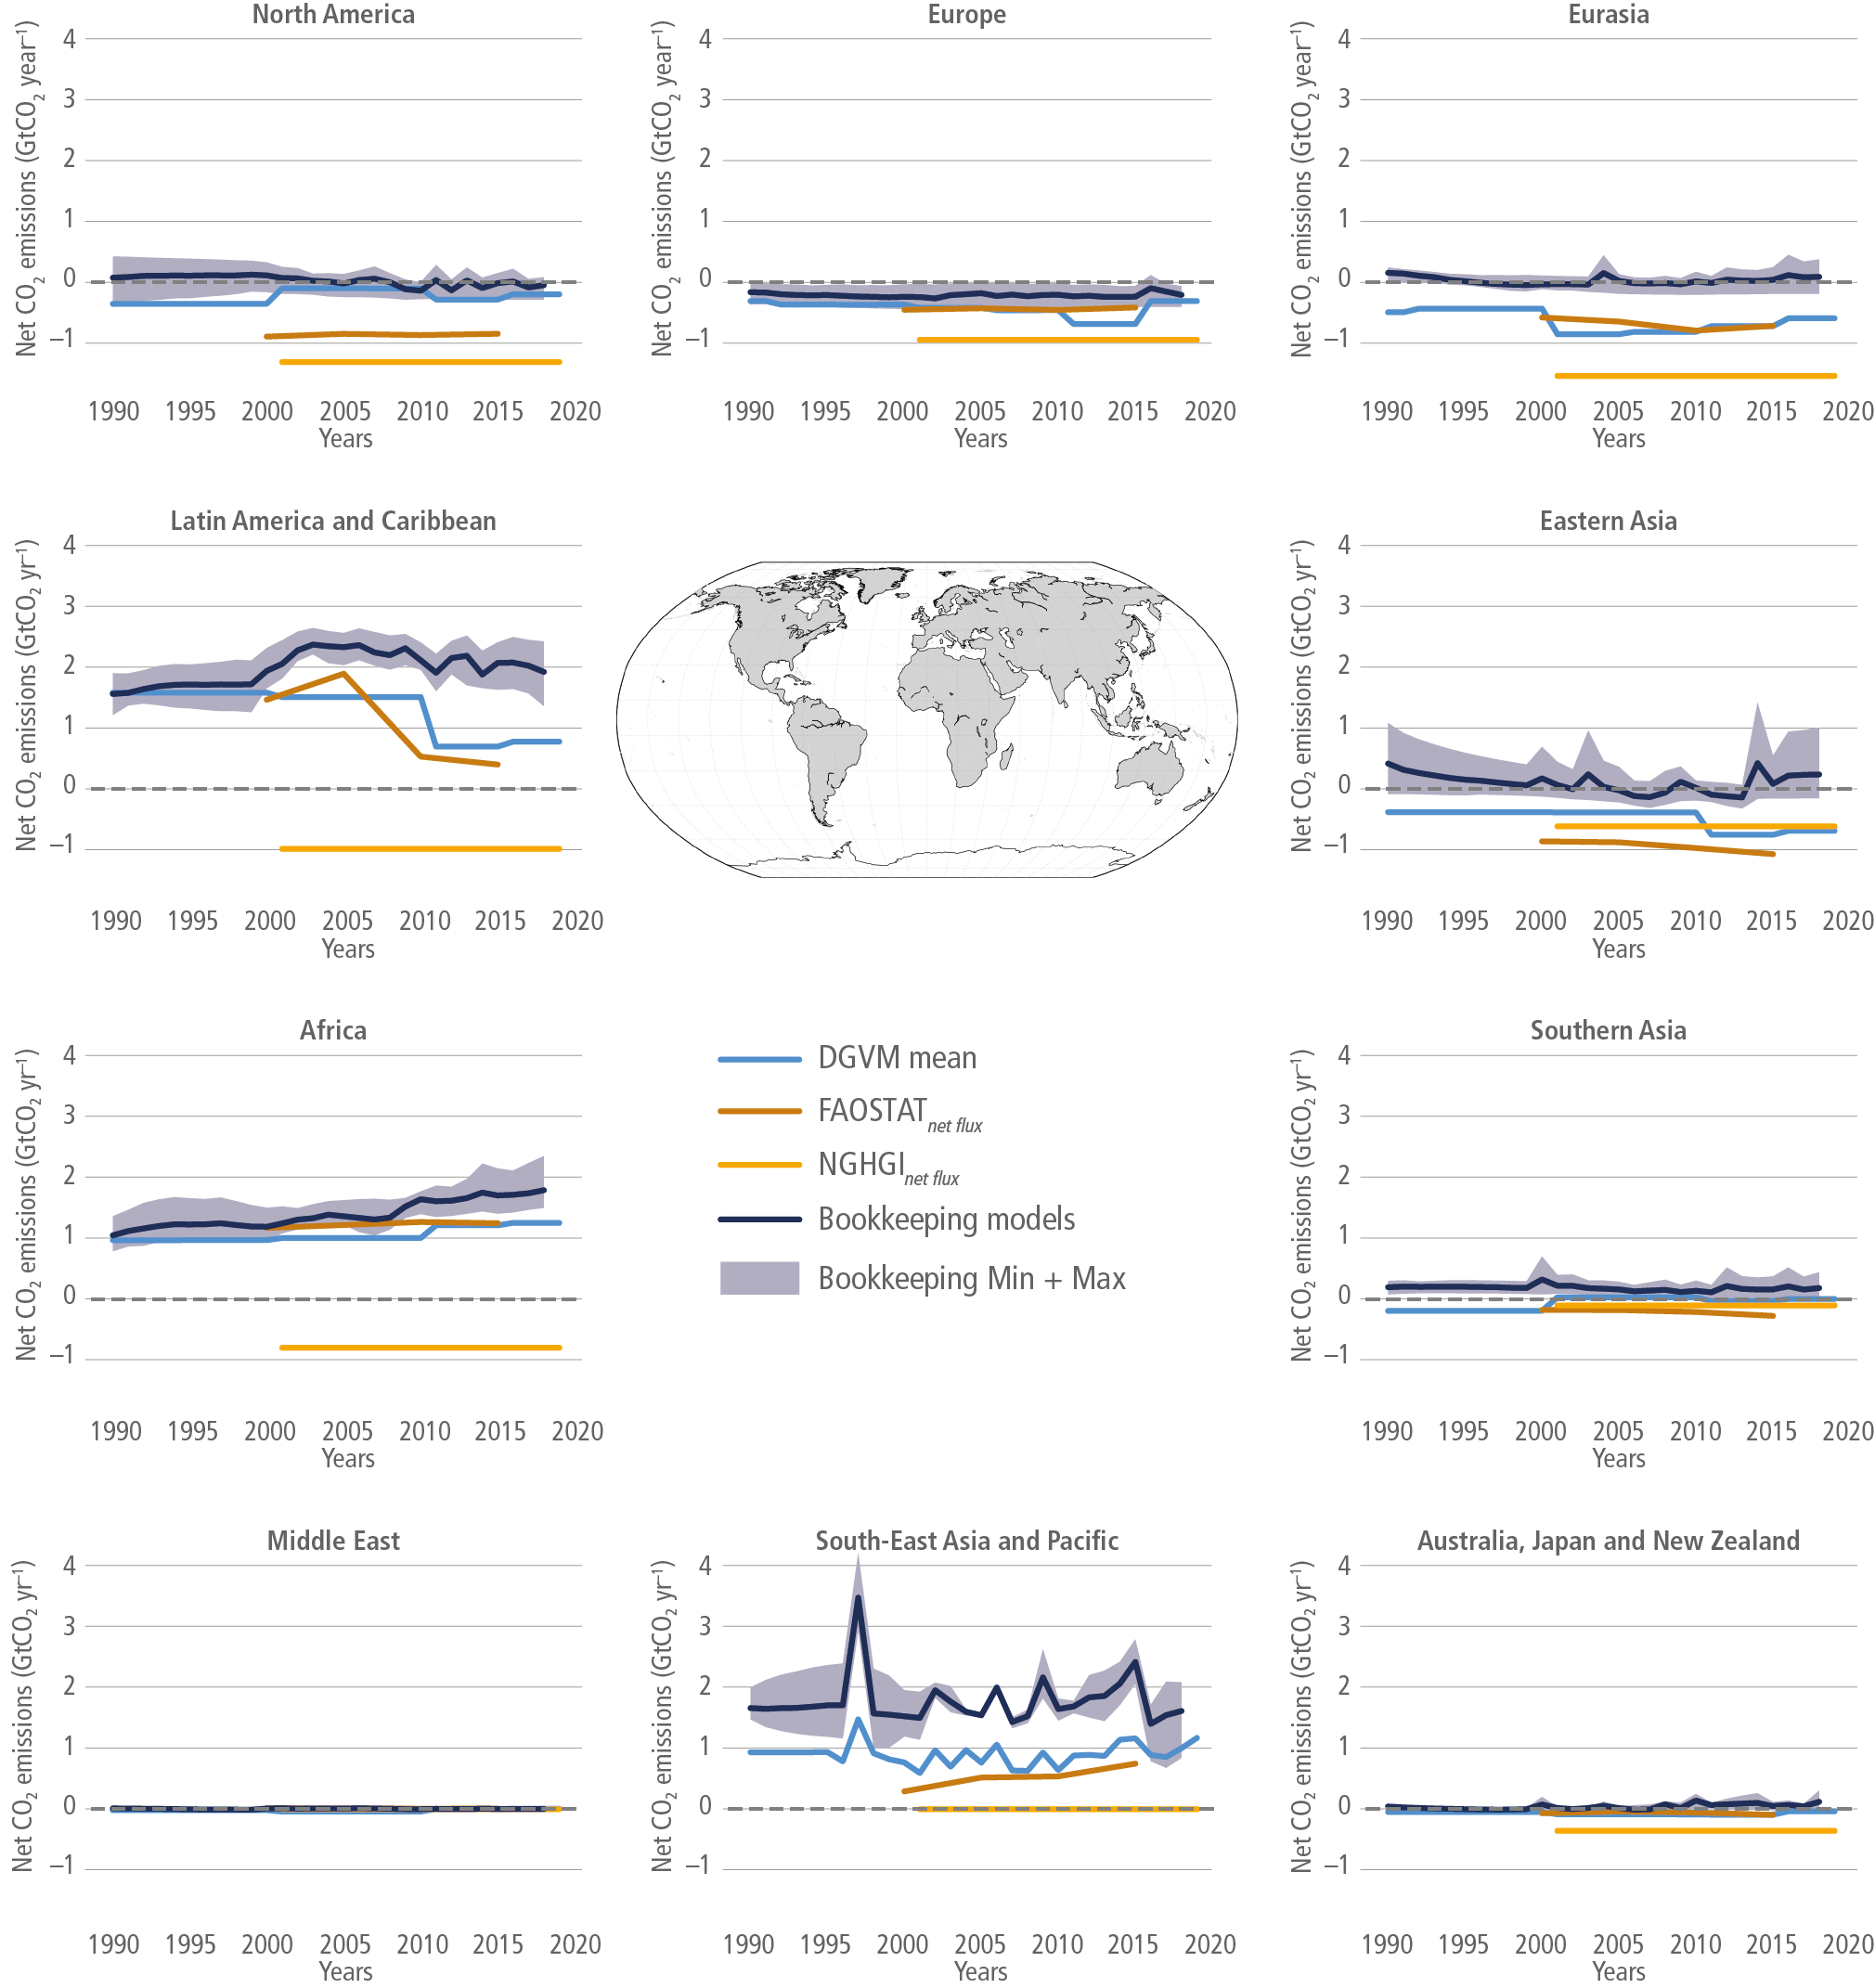
Regionally (Figure 7.5), there is high confidence of net emissions linked to deforestation in Latin America, Africa and South-East Asia from 1990 to 2019. There is medium confidence in trends indicating a decrease in net emissions in Latin America since 2005 linked to reduced gross deforestation emissions, and a small increase in net emissions related to increased gross deforestation emissions in Africa since 2000 (Figure 7.5). There is high confidence regarding the net AFOLU CO2 sink in Europe due to forest regrowth and known other sinks in managed forests, and medium confidence of a net sink in North America and Eurasia since 2010.

Figure 7.4 | Global net CO2flux due to AFOLU estimated using different methods for the period 1960 to 2019 (GtCO2yr–1). Positive numbers represent emissions. Light-blue line: The mean from 17 DGVMs all using the same driving data under TrendyV9 used within the Global Carbon Budget 2020 and including different degrees of management (Bastos et al. 2020; Friedlingstein et al. 2020). Brown line: Data downloaded 6 June 2021 from FAOSTAT (FAO 2021b;http://www.fao.org/faostat/) comprising: net emissions from (i) forest land converted to other land, (ii) net emissions from organic soils in cropland, grassland and from biomass burning, including peat fires and peat draining (Prosperi et al. 2020) and (iii) net emissions from forest land remaining forest land, which includes managed forest lands (Tubiello et al. 2020). Yellowline: Net flux estimate from National Greenhouse Gas Inventories (NGHGI) based on country reports to the UNFCCC for LULUCF (Grassi et al. 2021) which include land-use change, and flux in managed lands. Red EO line: The 2001–2019 average net CO2 flux from non-intact forest-related emissions and removals based on ground and Earth Observation data (EO) (Harris et al. 2021). Data to mask non-intact forest were used in the tropics (Turubanova et al. 2018) and extra-tropics (Potapov et al. 2017). Darkblue line: the mean estimate and minimum and maximum (dark-blue shading) from three bookkeeping models (Hansis et al. 2015; Houghton and Nassikas 2017; Gasser et al. 2020). These include land cover change (e.g., deforestation, afforestation), forest management including wood harvest and land degradation, shifting cultivation, regrowth of forests following wood harvest or abandonment of agriculture, grassland management, agricultural management. Emissions from peat burning and draining are added from external datasets (see text). Both the DGVM and bookkeeping global data is available at: https://www.icos-cp.eu/science-and-impact/global-carbon-budget/2020 (accessed on 4 October 2021). Data consistent with IPCC AR6 WGI Chapter 5. Dotted lines denote the linear regression from 2000 to 2019. Trends are statistically significant (P <0.05) with exception for the NGHGI trend (P <0.01).

Figure 7.5 | Regional net flux of CO2due to AFOLU estimated using different methods for the period1990–2019 (GtCO2yr–1). Positive numbers represent emissions. The upper-central panel depicts the world map shaded according to the IPCC AR6 regions corresponding to the individual graphs. For each regional panel; brownline: Total net flux data from FAOSTAT (Tubiello et al. 2020); yellow line: Net emissions estimates from National Greenhouse Gas Inventories based on country reports to the UNFCCC for LULUCF (Grassi et al. 2021); dark-blue line: The mean estimate and minimum and maximum (dark-blue shading) from three bookkeeping models. (Hansis et al. 2015; Houghton and Nassikas 2017; Gasser et al. 2020). Regional estimates from bookkeeping models are available at: https://zenodo.org/record/5548333#.YVwJB2LMJPY (Minx et al. 2021). See the legend in Figure 7.4 for a detailed explanation of flux components for each dataset.
7.2.2.2Why Do Various Methods Deliver Difference in Results?
The processes responsible for fluxes from land have been divided into three categories (IPCC 2006, 2010): (i) the direct human-induced effects due to changing land cover and land management; (ii) the indirect human-induced effects due to anthropogenic environmental change, such as climate change, CO2 fertilisation, nitrogen deposition, and so on; and (iii)natural effects, including climate variability and a background natural disturbance regime (e.g., wildfires, windthrows, diseases or insect outbreaks).
Global models estimate the anthropogenic land CO2 flux considering only the impact of direct effects, and only those areas that were subject to intense and direct management such as clear-cut harvest. It is important to note, that DGVMs also estimate the non-anthropogenic land CO2 flux (Land Sink) that results from indirect and natural effects (Table 7.1). In contrast, estimates of the anthropogenic land CO2 flux in NGHGIs (LULUCF) include the impact of direct effects and, in most cases, of indirect effects on a much greater area considered ‘managed’ than global models (Grassi et al. 2021).
The approach used by countries follows the IPCC methodological guidance for NGHGIs (IPCC 2006, 2019). Since separating direct, indirect and natural effects on the land CO2 sink is impossible with direct observation such as national forest inventories (IPCC 2010), upon which most NGHGIs are based, the IPCC adopted the ‘managed land’ concept as a pragmatic proxy to facilitate NGHGI reporting. Anthropogenic land GHG fluxes (direct and indirect effects) are defined as all those occurring on managed land, that is, where human interventions and practices have been applied to perform production, ecological or social functions (IPCC 2006, 2019). GHG fluxes from unmanaged land are not reported in NGHGIs because they are assumed to be non-anthropogenic. Countries report NGHGI data with a range of methodologies, resolution and completeness, dependent on capacity and available data, consistent with IPCC guidelines (IPCC 2006, 2019) and subject to an international review or assessment processes.
The FAOSTAT approach is conceptually similar to NGHGIs. FAOSTAT data on forests are based on country reports to FAO-FRA 2020 (FAO 2020a), and include changes in biomass carbon stock in ‘forest land’ and ‘net forest conversions’ in five-year intervals. ‘Forest land’ may include unmanaged natural forest, leading to possible overall overestimation of anthropogenic fluxes for both sources and sinks, though emissions from deforestation are likely underestimated (Tubiello et al. 2020). FAOSTAT also estimate emissions from forest fires and other land uses (organic soils), following IPCC methods (Prosperi et al. 2020). The FAO-FRA 2020 (FAO 2020b) update leads to estimates of larger sinks in Russia since 1991, and in China and the USA from 2011, and larger deforestation emissions in Brazil and smaller in Indonesia than FRA 2015 (FAO 2015; Tubiello et al. 2020).
The bookkeeping models by Houghton and Nassikas (2017), Hansis et al. (2015), and Gasser et al. (2020) and the DGVMs used in the Global Carbon Budget (Friedlingstein et al. 2020) use either the LUH2 dataset (Hurtt et al. 2020), HYDE (Goldewijk et al. 2017), FRA 2015 (FAO 2015) or a combination. The LUH2 dataset includes a new wood harvest reconstruction, new representation of shifting cultivation, crop rotations, and management information including irrigation and fertiliser application. The area of forest subject to harvest in LUH2 is much less than the area of forest considered ‘managed’ in the NGHGIs (Grassi et al. 2018). The model datasets do not yet include the FAO FRA 2020 update (FAO 2020a). The DGVMs consider CO2 fertilisation effects on forest growth that are sometimes confirmed from the ground-based forest inventory networks (Nabuurs et al. 2013) and sometimes not at all (van der Sleen et al. 2015).
Further, the DGVMs and bookkeeping models do not include a wide range of practices which are implicitly covered by the inventories; for example: forest dynamics (Pugh et al. 2019; Le Noë et al. 2020), forest management including wood harvest (Nabuurs, et al. 2013; Arneth et al. 2017), agricultural and grassland practices (Pugh et al. 2015; Sanderman et al. 2017; Pongratz et al. 2018); or, for example, fire management (Andela et al. 2017; Arora and Melton 2018).
Increasingly, higher emissions estimates are expected from DGVMs compared to bookkeeping models, because DGVMs include a loss of additional sink capacity of 3.3 ± 1.1 GtCO2 yr –1 on average over 2009–2018, which is increasing with larger climate and CO2 impacts (Friedlingstein et al. 2020). This arises because the DGVM methodological setup requires a reference simulation including climate and environmental changes but without any land-use change such as deforestation, so DGVMs implicitly include the sink capacity forests would have developed in response to environmental changes on areas that in reality have been cleared (Gitz and Ciais 2003; Pongratz et al. 2014) (IPCC AR6 WGI Chapter 5).
Carbon emissions from peat burning have been estimated based on the Global Fire Emission Database (GFED4s; van der Werf et al. 2017). These were included in the bookkeeping model estimates and added 2.0 GtC over 1960–2019 (e.g., causing the peak in South-East Asia in 1998) (Figure 7.5). Within the Global Carbon Budget (Friedlingstein et al. 2020), peat drainage from agriculture accounted for an additional 8.6 GtC from 1960–2019 according to FAOSTAT (Conchedda and Tubiello, 2020) used by two of the bookkeeping models (Hansis et al. 2015; Gasser et al. 2020).
Remote-sensing products provide valuable spatial and temporal land-use and biomass data globally (including in remote areas), at potentially high spatial and temporal resolutions, that can be used to calculate CO2 fluxes, but have mostly been applied only to forests at the global or even regional scale. While such data can strongly support monitoring reporting and verification, estimates of forest carbon fluxes directly from Earth Observation (EO) data vary considerably in both their magnitude and sign (i.e., whether forests are a net source or sink of carbon). For the period 2005–2017, net tropical forest carbon fluxes were estimated as –0.4 GtCO2 yr –1 (Fan et al. 2019); 0.58 GtCO2 yr –1 (Grace et al. 2014); 1.6 GtCO2 yr –1 (Baccini et al. 2017) and 2.87 GtCO2 yr –1 (Achard et al. 2014). Differences can in part be explained by spatial resolution of the datasets, the definition of ‘forest’ and the inclusion of processes and methods used to determine degradation and growth in intact and secondary forests, or the changes in algorithm over time (Palahí et al. 2021). A recent global study integrated ground observations and remote sensing data to map forest-related GHG emissions and removals at a high spatial resolution (30 m spatial scale), although it only provides an average estimate of annual carbon loss over 2001–2019 (Harris et al. 2021). The estimated net global forest carbon sink globally was –7.66 GtCO2 yr −1, being –1.7 GtCO2 yr −1 in the tropics only.
Remote sensing products can help to attribute changes to anthropogenic activity or natural inter-annual climate variability (Fan et al. 2019; Wigneron et al. 2020). Products with higher spatial resolution make it easier to determine forest and carbon dynamics in relatively small-sized managed forests (e.g., Y. Wang et al. 2020; Heinrich et al. 2021; Reiche et al. 2021). For example, secondary forest regrowth in the Brazilian Amazon offset 9 to 14% of gross emissions due to deforestation 1 (Aragão et al. 2018; Silva Junior et al. 2021). Yet disturbances such as fire and repeated deforestation cycles due to shifting cultivation over the period 1985 to 2017, were found to reduce the regrowth rates of secondary forests by 8 to 55% depending on the climate region of regrowth (Heinrich et al. 2021).
7.2.2.3Implications of Differences in AFOLU CO2Fluxes Between Global Models and National Greenhouse Gas Inventories (NGHGIs), and Reconciliation
There is about 5.5 GtCO2 yr –1 difference in the anthropogenic AFOLU estimates between NGHGIs and global models (this number relates to an IAMs comparison for the period 2005–2015 – see Cross-Chapter Box 6 in this chapter; for comparison with other models see Figure 7.4). Reconciling the differences, in other words, making estimates comparable, can build confidence in land-related CO2 estimates, for example for the purpose of assessing collective progress in the context of the Global Stocktake (Cross-Chapter Box 6 in this chapter). The difference largely results from greater estimated CO2 in NGHGIs, mostly occurring in forests (Grassi et al. 2021). This difference is potentially a consequence of: (i) simplified and/or incomplete representation of management in global models (Popp et al. 2017; Pongratz et al. 2018), for example, concerning impacts of forest management in biomass expansion and thickening (Nabuurs et al. 2013; Grassi et al. 2017), (ii) inaccurate and/or incomplete estimation of LULUCF fluxes in NGHGIs (Grassi et al. 2017), especially in developing countries, primarily in non-forest land uses and in soils, and (iii) conceptual differences in how global models and NGHGIs define ‘anthropogenic’ CO2 flux from land (Grassi et al. 2018). The impacts of (i) and (ii) are difficult to quantify and result in uncertainties that will decrease slowly over time through improvements of both models and NGHGIs. By contrast, the inconsistencies in (iii) and its resulting biases were assessed as explained below.
Since changing the NGHGIs’ approach is impractical, an interim method to translate and adjust the output of global models was outlined for reconciling a bookkeeping model and NGHGIs (Grassi et al. 2018). More recently, an improved version of this approach has been applied to the future mitigation pathways estimated by IAMs (Grassi et al. 2021), with the implications for the Global Stocktake discussed in Cross-Chapter Box 6 in this chapter. This method implies a post-processing of current global models’ results that addresses two components of the conceptual differences in the ‘anthropogenic’ CO2 flux; (i) how the impact of human-induced environmental changes (indirect effects) are considered, and (ii) the extent of forest area considered ‘managed’. Essentially, this approach adds DGVM estimates of CO2 fluxes due to indirect effects from countries’ managed forest area (using non-intact forest area maps as a proxy) to the original global models’ anthropogenic land CO2 fluxes (Figure 7.6).

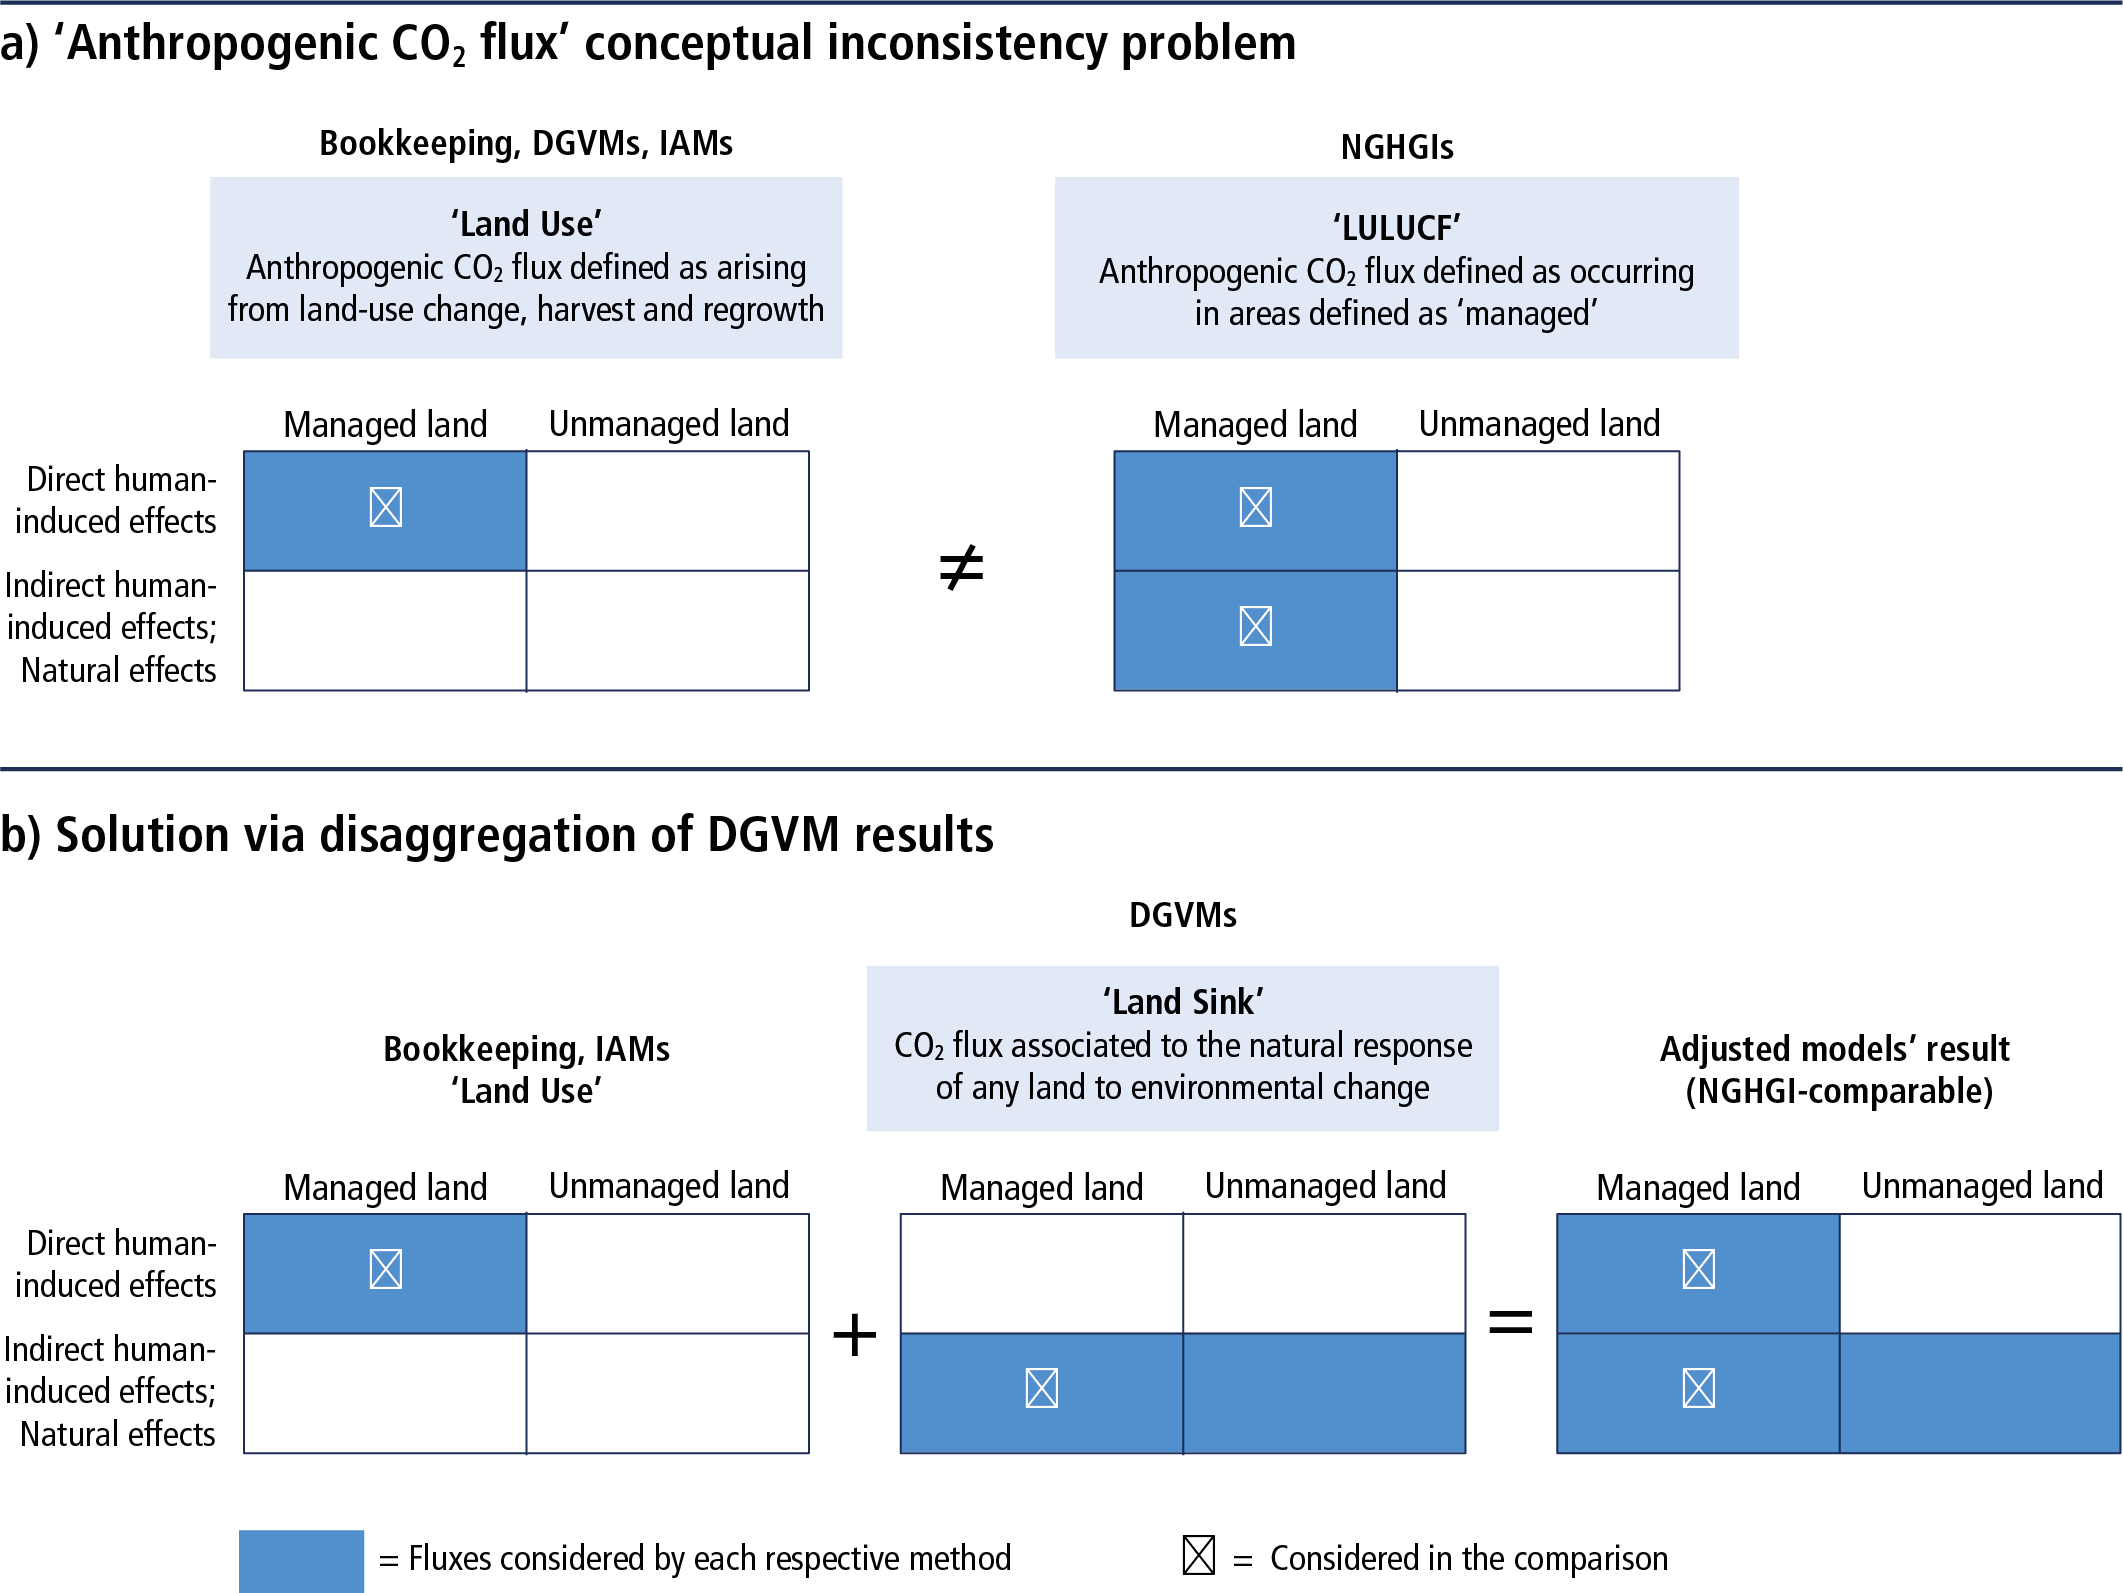
Figure 7.6 | Main conceptual differences between global models (bookkeeping models, IAMs and DGVMs) and NGHGIs definitions of what is considered the ‘anthropogenic’ land CO2flux, and proposed solution (fromGrassiet al. 2021). (a) Differences in defining the anthropogenic land CO2 flux by global models (‘land use’) and NGHGIs (‘LULUCF’), including the attribution of processes responsible for land fluxes (IPCC 2006; 2010) in managed and unmanaged lands. The anthropogenic land CO2 flux by global models typically includes only the CO2 flux due to ‘direct effects’ (land-use change, harvest, regrowth). By contrast, most NGHGIs consider anthropogenic all fluxes occurring in areas defined as ‘managed’, including also the sink due to ‘indirect effects’ (climate change, atmospheric CO2 increase, N deposition etc.) and due to ‘natural effects’ (climate variability, background natural disturbances). (b) Proposed solution to the inconsistency, via disaggregation of the ‘Land Sink’ flux from DGVMs into CO2 fluxes occurring in managed and in unmanaged lands. The sum of ‘land use’ flux (direct effects from bookkeeping models or IAMs) and the ‘Land Sink’ (indirect effects from DGVMs) in managed lands produces an adjusted global model CO2 flux which is conceptually more comparable with LULUCF fluxes from NGHGIs. Note that the figure may in some cases be an oversimplification, in other words, not all NGHGIs include all recent indirect effects.
Cross-Chapter Box 6 | Implications of Reconciled Anthropogenic Land CO2Fluxes for Assessing Collective Climate Progress in the Global Stocktake
Authors: Giacomo Grassi (Italy/European Union), Joeri Rogelj (Belgium/Austria), Joanna I. House (United Kingdom), Alexander Popp (Germany), Detlef van Vuuren (the Netherlands), Katherine Calvin (the United States of America), Shinichiro Fujimori (Japan), Petr Havlík (Austria/the Czech Republic), Gert-Jan Nabuurs (the Netherlands)
The Global Stocktake aims to assess countries’ collective progress towards the long-term goals of the Paris Agreement in the light of the best available science. Historic progress is assessed based on NGHGIs, while expectations of future progress are based on country climate targets (e.g., NDCs for 2025 or 2030 and long-term strategies for 2050). Scenarios consistent with limiting warming well-below 2°C and 1.5°C developed by IAMs (Chapter 3) are expected to play a key role as benchmarks against which countries’ aggregated future mitigation pledges will be assessed. This, however, implies that estimates by IAMs and country data used to measure progress are comparable.
In fact, there is about 5.5 GtCO2 yr –1 difference during 2005–2015 between global anthropogenic land CO2 net flux estimates of IAMs and aggregated NGHGIs, due to different conceptual approaches to what is ‘anthropogenic’. This approach and its implications when comparing climate targets with global mitigation pathways are illustrated in this Box Figure 1a–e.
By adjusting the original IAM output (Cross-Chapter Box 6, Figure 1a) with the indirect effects from countries’ managed forest (Cross-Chapter Box 6, Figure 1b, estimated by DGVMs, see also Figure 7.6), NGHGI-comparable pathways can be derived (Cross-Chapter Box 6, Figure 1c). The resulting apparent increase in anthropogenic sink reflects simply a reallocation of a CO2 flux previously labelled as natural, and thus does not reflect a mitigation action. These changes do not affect non-LULUCF emissions. However, since the atmosphere concentration is a combination of CO2 emissions from LULUCF and from fossil fuels, the proposed land-related adjustments also influence the NGHGI-comparable economy-wide (all sector) CO2 pathways (Cross-Chapter Box 6, Figure 1d).
This approach does not imply a change in the original decarbonisation pathways, nor does it suggest that indirect effects should be considered in the mitigation efforts. It simply ensures that a like-with-like comparison is made: if countries’ climate targets use the NGHGI definition of anthropogenic emissions, this same definition can be applied to derive NGHGI-comparable future CO2 pathways. This would have an impact on the NGHGI-comparable remaining carbon or GHG budget (i.e., the allowable emissions until net zero CO2 or GHG emissions consistent with a certain climate target). For example, for SSP2-1.9 and SSP2-2.6 (representing pathways in line with 1.5°C and well-below 2°C limits under SSP2 assumptions), carbon budget is 170 GtCO2-eq lower than the original remaining carbon budget according to the models’ approach (Cross-Chapter Box 6, Figure 1e). Similarly, the remaining carbon (or GHG) budgets in Chapter 3 (this report), as well as the net zero carbon (or GHG) targets, could only be used in combination with the definition of anthropogenic emissions as used by the IAMs (Cross-Chapter Box 3 in Chapter 3). In the absence of these adjustments, collective progress would appear better than it is.
Cross-Chapter Box 6
The UNEP’s annual assessment of the global 2030 ‘emission gap’ between aggregated country NDCs and specific target mitigation pathways (UNEP 2020), is only affected to a limited degree. This is because some estimates of global emissions under the NDCs already use the same land-use definitions as the IAM mitigation pathways (Rogelj et al. 2017), and because historical data of global NDC estimates is typically harmonised to the historical data of global mitigation pathway projections (Rogelj et al. 2011). This latter procedure, however, is agnostic to the reasons for the observed mismatch, and often uses a constant offset. The adjustment described here allows this mismatch to be resolved by drawing on a scientific understanding of the underlying reasons, and thus provides a more informed and accurate basis for estimating the emission gap.
The approach to deriving a NGHGI-comparable emission pathways presented here can be further refined with improved estimates of the future forest sink. Its use would enable a more accurate assessment of the collective progress achieved and of mitigation pledges under the Paris Agreement.

Cross-Chapter Box 6, Figure 1 | Impact on global mitigation pathways of adjusting the modelled anthropogenic land CO2 fluxes to be comparable with National Greenhouse Gas Inventories (NGHGIs) (from Grassiet al. 2021). (a) The mismatch between global historical LULUCF CO2 net flux from NGHGIs (black), and the original (un-adjusted) modelled flux historically and under future mitigation pathways for SSP2 scenarios from Integrated Assessment Models (IAMs, Chapter 3). (b) Fluxes due to indirect effects of environmental change on areas equivalent to countries’ managed forest (i.e., those fluxes generally considered ‘anthropogenic’ by countries and ‘natural’ by global models). (c) Original modelled (solid line) LULUCF mitigation pathways adjusted to be NGHGI-comparable (dashed line), for example, by adding the indirect effects in panel b. The indirect effects in panel b decline over time with increasing mitigation ambition, mainly because of the weaker CO2 fertilisation effect. In panel c, the dependency of the adjusted LULUCF pathways on the target becomes less evident after 2030, because the indirect effects in countries’ managed forest (which are progressively more uncertain with time, as highlighted by the grey areas) compensate the effects of the original pathways. (d) NGHGI-comparable pathways for global CO2 emissions from all sectors including LULUCF (obtained by combining global CO2 pathways without LULUCF – where no adjustment is needed – and the NGHGI-comparable CO2 pathways for LULUCF (Gütschow et al. 2019; Grassi et al. 2017). (e) Cumulative impact of the adjustments from 2021 until net zero CO2 emissions or 2100 (whatever comes first) on the remaining carbon budget.
7.2.3CH4 and N2O Flux From AFOLU
Trends in atmospheric CH4 and N2O concentrations and the associated sources, including land and land use are discussed in Sections 5.2.2 and 5.2.3 of the IPCC AR6 WGI. Regarding AFOLU, the SRCCL and AR5 (Jia et al. 2019; Smith et al. 2014) identified three global non-CO2 emissions data sources: EDGAR (Crippa et al. 2021), FAOSTAT (FAO 2021a; Tubiello, 2019) and the USA EPA (USEPA 2019). Methodological differences have been previously discussed (Jia et al. 2019). In accordance with Chapter 2, this report, EDGAR data are used in Table 7.1 and Figure 7.3. It is important to note that in terms of AFOLU sectoral CH4 and N2O emissions, only FAOSTAT provides data on AFOLU emissions, while EDGAR and USEPA data consider just the agricultural component. However, the mean of values across the three databases for both CH4 and N2O, fall within the assessed uncertainty bounds (30 and 60% for CH4 and N2O respectively, Section 2.2.1, in this report) of EDGAR data. NGHGIs annually submitted to the UNFCCC (Section 7.2.2.3) provide national AFOLU CH4 and N2O data, as included in the SRCCL (Jia et al. 2019). Aggregation of NGHGIs to indicate global emissions must be considered with caution, as not all countries compile inventories, nor submit annually. Additionally, NGHGIs may incorporate a range of methodologies for CH4 and N2O accounting (e.g., van der Weerden et al. 2016; Ndung’u et al. 2019; Thakuri et al. 2020), making comparison difficult. The analysis of complete AFOLU emissions presented here, is based on FAOSTAT data. For agricultural specific discussion, analysis considers EDGAR, FAOSTAT and USEPA data.
7.2.3.1Global AFOLU CH4 and N2O Emissions
Using FAOSTAT data, the SRCCL estimated average CH4 emissions from AFOLU to be 161.2 ± 43 MtCH4 yr –1 for the period 2007–2016, representing 44% of total anthropogenic CH4 emissions, with agriculture accounting for 88% of the AFOLU component (Jia et al. 2019). The latest data (FAO 2021a, 2020b) highlight a trend of growing AFOLU CH4 emissions, with a 10% increase evident between 1990 and 2019, despite year-to-year variation. Forestry and other land use (FOLU) CH4 emission sources include biomass burning on forest land and combustion of organic soils (peatland fires) (FAO 2020c). The agricultural share of AFOLU CH4 emissions remains relatively unchanged, with the latest data indicating agriculture to have accounted for 89% of emissions on average between 1990 and 2019. The SRCCL reported with medium evidence and high agreement that ruminants and rice production were the most important contributors to overall growth trends in atmospheric CH4 (Jia et al. 2019). The latest data confirm this in terms of agricultural emissions, with agreement between databases that agricultural CH4 emissions continue to increase and that enteric fermentation and rice cultivation remain the main sources (Figure 7.7). The proportionally higher emissions from rice cultivation indicated by EDGAR data compared to the other databases, may result from the use of a Tier 2 methodology for this source within EDGAR (Janssens-Maenhout et al. 2019).
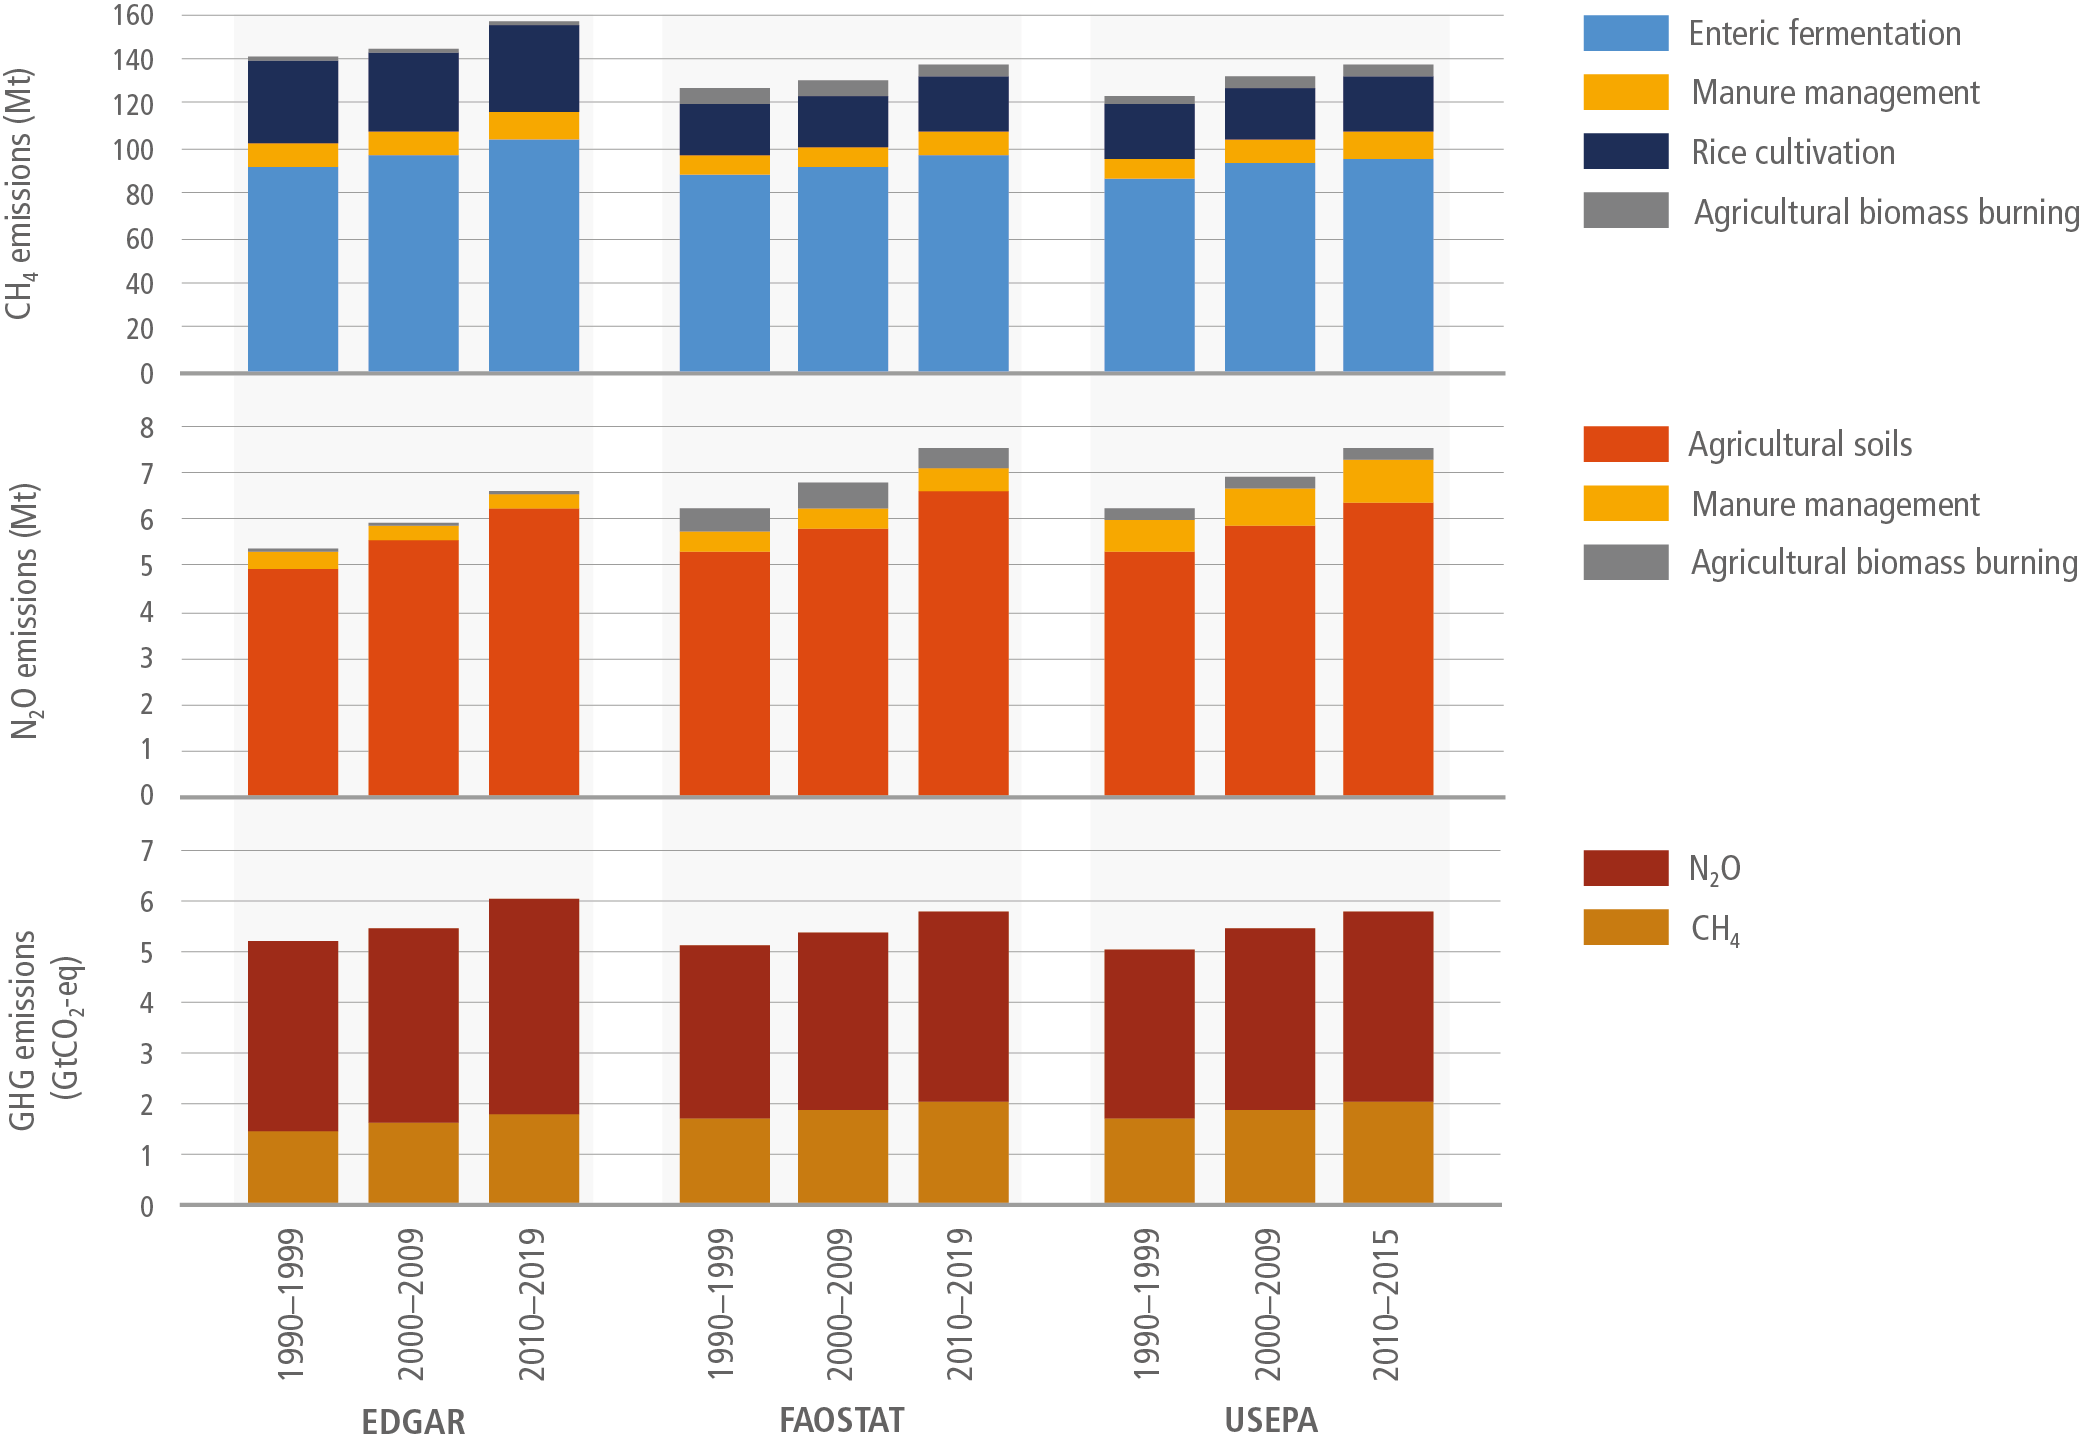
Figure 7.7 | Estimated global mean agricultural CH4 (top), N2O (middle) and aggregated CH4and N2O (using CO2-eq according to GWP100 AR6 values). (Bottom) emissions for three decades according to EDGAR v6.0 (Crippaet al. 2021), FAOSTAT (FAO 2021a) and USEPA (USEPA 2019) databases. Latest versions of databases indicate historic emissions to 2019, 2019 and 2015 respectively, with average values for the post–2010 period calculated accordingly. For CH4, emissions classified as ‘Other Ag.’ within USEPA data, are re-classified as ‘Agricultural Biomass Burning’. Despite CH4 emissions from agricultural soils also being included, this category was deemed to principally concern biomass burning on agricultural land and classified accordingly. For N2O, emissions classified within EDGAR as direct and indirect emissions from managed soils, and indirect emissions from manure management are combined under ‘Agricultural Soils’. Emissions classified by FOASTAT as from manure deposition and application to soils, crop residues, drainage of organic soils and synthetic fertilisers are combined under ‘Agricultural Soils’, while emissions reported as ‘Other Ag.’ under USEPA data are re-classified as ‘Agricultural Biomass Burning’.
The SRCCL also noted a trend of increasing atmospheric N2O concentration, with robust evidence and high agreement that agriculture accounted for approximately two-thirds of overall global anthropogenic N2O emissions. Average AFOLU N2O emissions were reported to be 8.7 ± 2.5 MtN2O yr –1 for the period 2007–2016, accounting for 81% of total anthropogenic N2O emissions, with agriculture accounting for 95% of AFOLU N2O emissions (Jia et al. 2019). A recent comprehensive review confirms agriculture as the principal driver of the growing atmospheric N2O concentration (Tian et al. 2020). The latest FAOSTAT data (FAO 2020b, 2021a) document a 25% increase in AFOLU N2O emissions between 1990 and 2019, with the average share from agriculture remaining approximately the same (96%). Agricultural soils were identified in the SRCCL and in recent literature as a dominant emission source, notably due to nitrogen fertiliser and manure applications to croplands, and manure production and deposition on pastures (Jia et al. 2019; Tian et al. 2020). There is agreement within latest data that agricultural soils remain the dominant source (Figure 7.7).
Aggregation of CH4 and N2O to CO2 equivalence (using GWP100 IPCC AR6 values), suggests that AFOLU emissions increased by 15% between 1990 and 2019, though emissions showed trend variability year to year. Agriculture accounted for 91% of AFOLU emissions on average over the period (FAO 2020b, 2021a). EDGAR (Crippa et al. 2021), FAOSTAT (FAO 2021a) and USEPA (USEPA 2019) data suggest aggregated agricultural emissions (CO2-eq) to have increased since 1990, by 19% (1990–2019), 15% (1990–2019) and 21% (1990–2015) respectively, with all databases identifying enteric fermentation and agricultural soils as the dominant agricultural emissions sources.
7.2.3.2Regional AFOLU CH4 and N2O Emissions
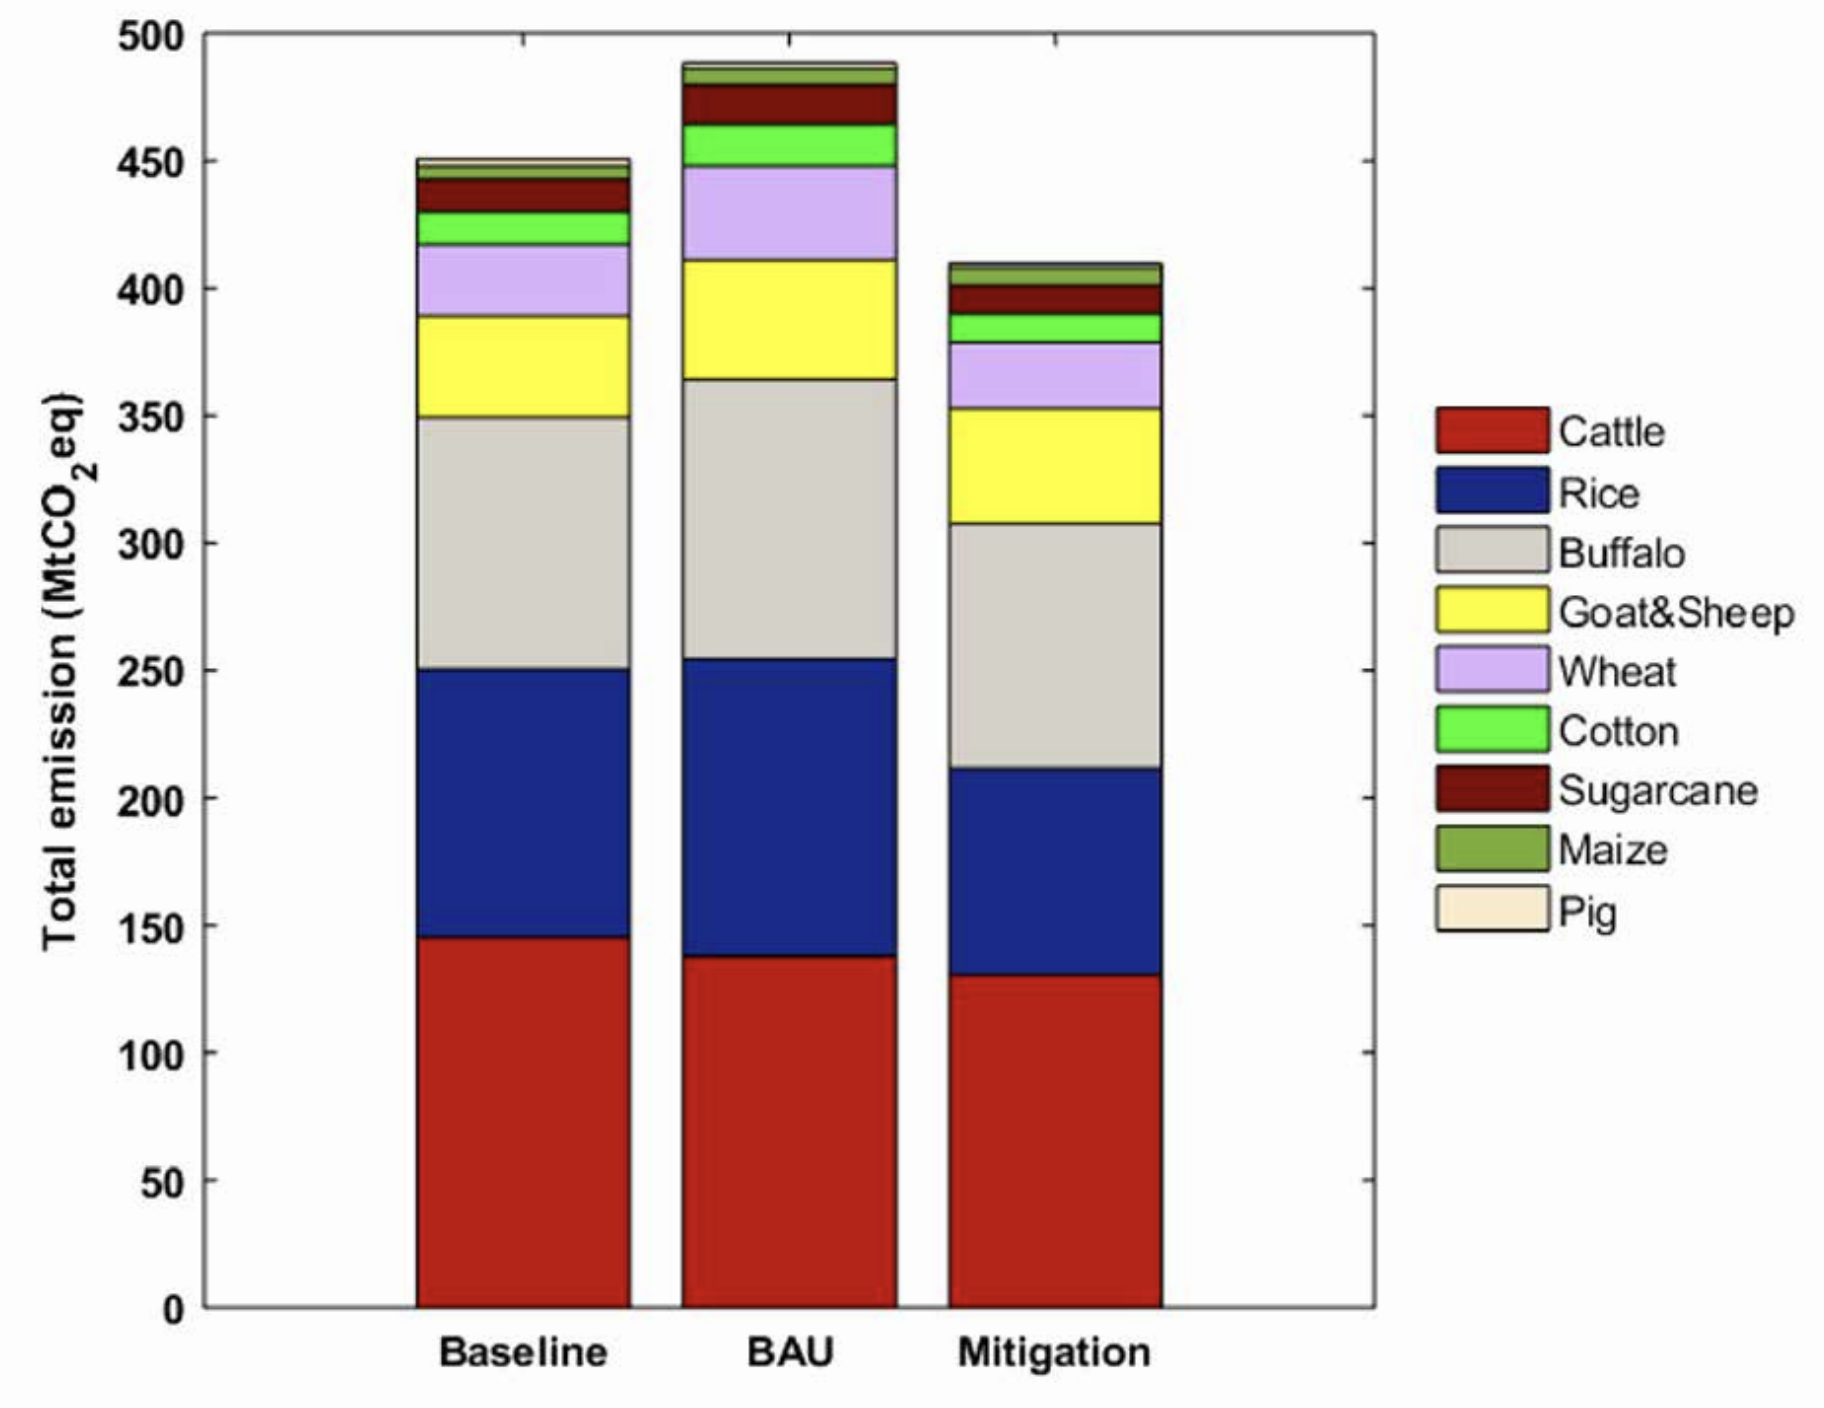
FAOSTAT data (FAO 2020b, 2021a) indicate Africa (+44%), followed by Southern Asia (+29%) to have the largest growth in AFOLU CH4 emissions between 1990 and 2019 (Figure 7.8). Eurasia was characterised by notable emission reductions (–58%), principally as a result of a sharp decline (–63%) between 1990 and 1999. The average agricultural share of AFOLU emissions between 1990 and 2019 ranged from 66% in Africa to almost 100% in the Middle East.
In agreement with AR5 (Smith et al. 2014), the SRCCL identified Asia as having the largest share (37%) of emissions from enteric fermentation and manure management since 2000, but Africa to have the fastest growth rate. Asia was identified as responsible for 89% of rice cultivation emissions, which were reported as increasing (Jia et al. 2019). Considering classification by ten IPCC regions, data suggest enteric fermentation to have dominated emissions in all regions since 1990, except in South-East Asia and Pacific, where rice cultivation forms the principal source (FAO 2021; USEPA 2019). The different databases broadly indicate the same regional CH4 emission trends, though the indicated absolute change differs due to methodological differences (Section 7.2.3.1). All databases indicate considerable emissions growth in Africa since 1990 and that this region recorded the greatest regional increases in emissions from both enteric fermentation and rice cultivation since 2010. Additionally, FAOSTAT data suggest that emissions from agricultural biomass burning account for a notably high proportion of agricultural CH4 emissions in Africa (Figure 7.8).
The latest data suggest growth in AFOLU N2O emissions in most regions between 1990 and 2019, with Southern Asia demonstrating highest growth (+74%) and Eurasia, greatest reductions (–51%), the latter mainly a result of a 61% reduction between 1990 and 2000 (FAO 2020b, 2021a). Agriculture was the dominant emission source in all regions, its proportional average share between 1990 and 2019 ranging from 87% in Africa, to almost 100% in the Middle East (Figure 7.8).
The SRCCL provided limited discussion on regional variation in agricultural N2O emissions but reported with medium confidence that certain regions (North America, Europe, East and South Asia) were notable sources of grazing land N2O emissions (Jia et al. 2019). The AR5 identified Asia as the largest source and as having the highest growth rate of N2O emissions from synthetic fertilisers between 2000 and 2010 (Smith et al. 2014). Latest data indicate agricultural N2O emission increases in most regions, though variation between databases prevents definitive conclusions on trends, with Africa, Southern Asia, and Eastern Asia suggested to have had greatest growth since 1990 according to EDGAR (Crippa et al. 2021), FAOSTAT (FAO 2021a) and USEPA (USEPA 2019) data respectively. However, all databases indicate that emissions declined in Eurasia and Europe from 1990 levels, in accordance with specific environmental regulations put in place since the late 1980s (Tubiello 2019; European Environment Agency 2020; Tian et al. 2020), but generally suggest increases in both regions since 2010.
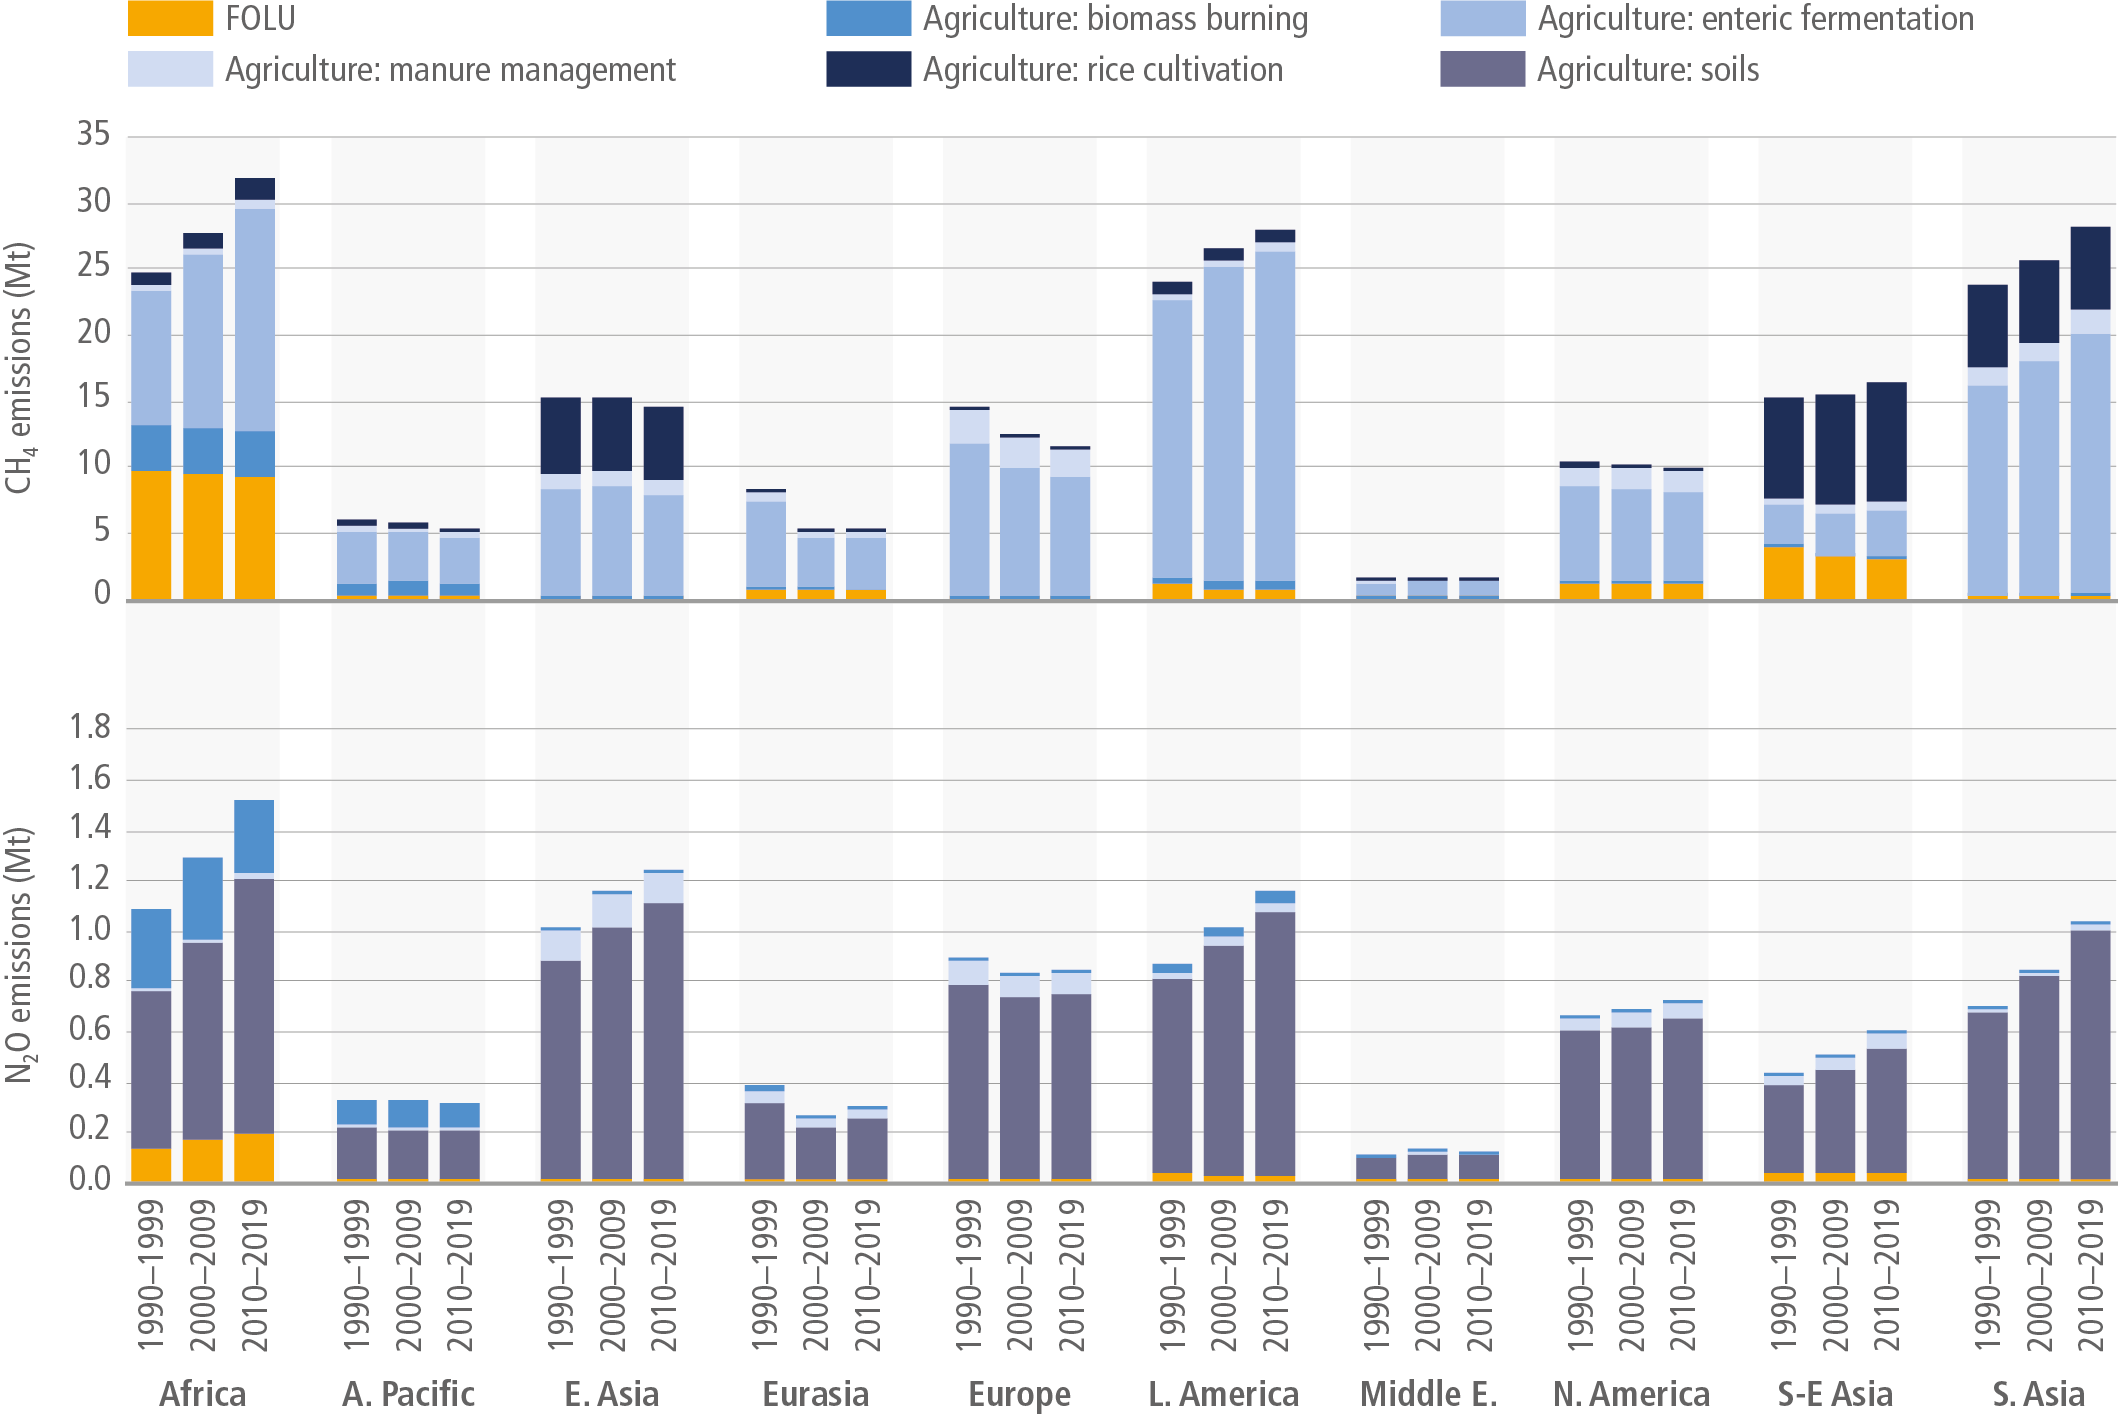
Figure 7.8 | Estimated average AFOLU CH4 (top) and N2O (bottom) emissions for three decades according to FAOSTAT data by ten global regions, with disaggregation of agricultural emissions (FAO 2020b; 2021a). Note for N2O: emissions from manure deposition and application to soils, crop residues and synthetic fertilisers are combined under ‘Agriculture: Soils’.
7.2.4Biophysical Effects and Short-lived Climate Forcers
Despite new literature, general conclusions from the SRCCL and WGI-AR6 on biophysical effects and short-lived climate forcers remain the same. Changes in land conditions from land cover change or land management jointly affect water, energy, and aerosol fluxes (biophysical fluxes) as well as GHG fluxes (biogeochemical fluxes) exchanged between the land and atmosphere ( high agreement , robust evidence) (Anderson et al. 2011; O’Halloran et al. 2012; Alkama and Cescatti 2016; Naudts et al. 2016; Erb et al. 2017). There is high confidence that changes in land condition do not just have local impacts but also have non-local impacts in adjacent and more distant areas (Pielke et al. 2011; Mahmood et al. 2014) which may contribute to surpassing climate tipping points (Nepstad et al. 2008; Brando et al. 2014). Non-local impacts may occur through: GHG fluxes and subsequent changes in radiative transfer, changes in atmospheric chemistry, thermal, moisture and surface pressure gradients creating horizontal transport (advection) (de Vrese et al. 2016; Davin and de Noblet-Ducoudré 2010) and vertical transport (convection and subsidence) (Devaraju et al. 2018). Although regional and global biophysical impacts emerge from model simulations (Davin and de Noblet-Ducoudré 2010; de Vrese et al. 2016; Devaraju et al. 2018), especially if the land condition has changed over large areas, there is very low agreement on the location, extent and characteristics of the non-local effects across models. Recent methodological advances, empirically confirmed changes in temperature and precipitation owing to distant changes in forest cover (Cohn et al. 2019; Meier et al. 2021).
Following changes in land conditions, CO2, CH4 and N2O fluxes are quickly mixed into the atmosphere and dispersed, resulting in the biogeochemical effects being dominated by the biophysical effects at local scales ( high confidence) (Y. Li et al. 2015; Alkama and Cescatti 2016). Afforestation/reforestation (Lejeune et al. 2018; Strandberg and Kjellström 2019), urbanisation (Li and Bou-Zeid 2013) and irrigation (Mueller et al. 2016 and Thiery et al. 2017) modulate the likelihood, intensity, and duration of many extreme events including heatwaves ( high confidence) and heavy precipitation events (medium confidence) (Haberlie et al. 2015). There is high confidence and high agreement that afforestation in the tropics (Perugini et al. 2017), irrigation (Alter et al. 2015; Mueller et al. 2016) and urban greening result in local cooling, high agreement and medium confidence on the impact of tree growth form (deciduous vs evergreen) (Naudts et al. 2016; Luyssaert et al. 2018 and Schwaab et al. 2020), and low agreement on the impact of wood harvest, fertilisation, tillage, crop harvest, residue management, grazing, mowing, and fire management on the local climate.
Studies of biophysical effects have increased since AR5 reaching high agreement for the effects of changes in land condition on surface albedo (Leonardi et al. 2015). Low confidence remains in proposing specific changes in land conditions to achieve desired impacts on local, regional and global climates due to: a poor relationship between changes in surface albedo and changes in surface temperature (Davin and de Noblet-Ducoudré 2010), compensation and feedbacks among biophysical processes (Bonan 2016; Kalliokoski et al. 2020), climate and seasonal dependency of the biophysical effects (Bonan 2016), omittance of short-lived chemical forcers (Unger 2014; Kalliokoski et al. 2020), and study domains often being too small to document possible conflicts between local and non-local effects (Swann et al. 2012; Hirsch et al. 2018).
7.3Drivers
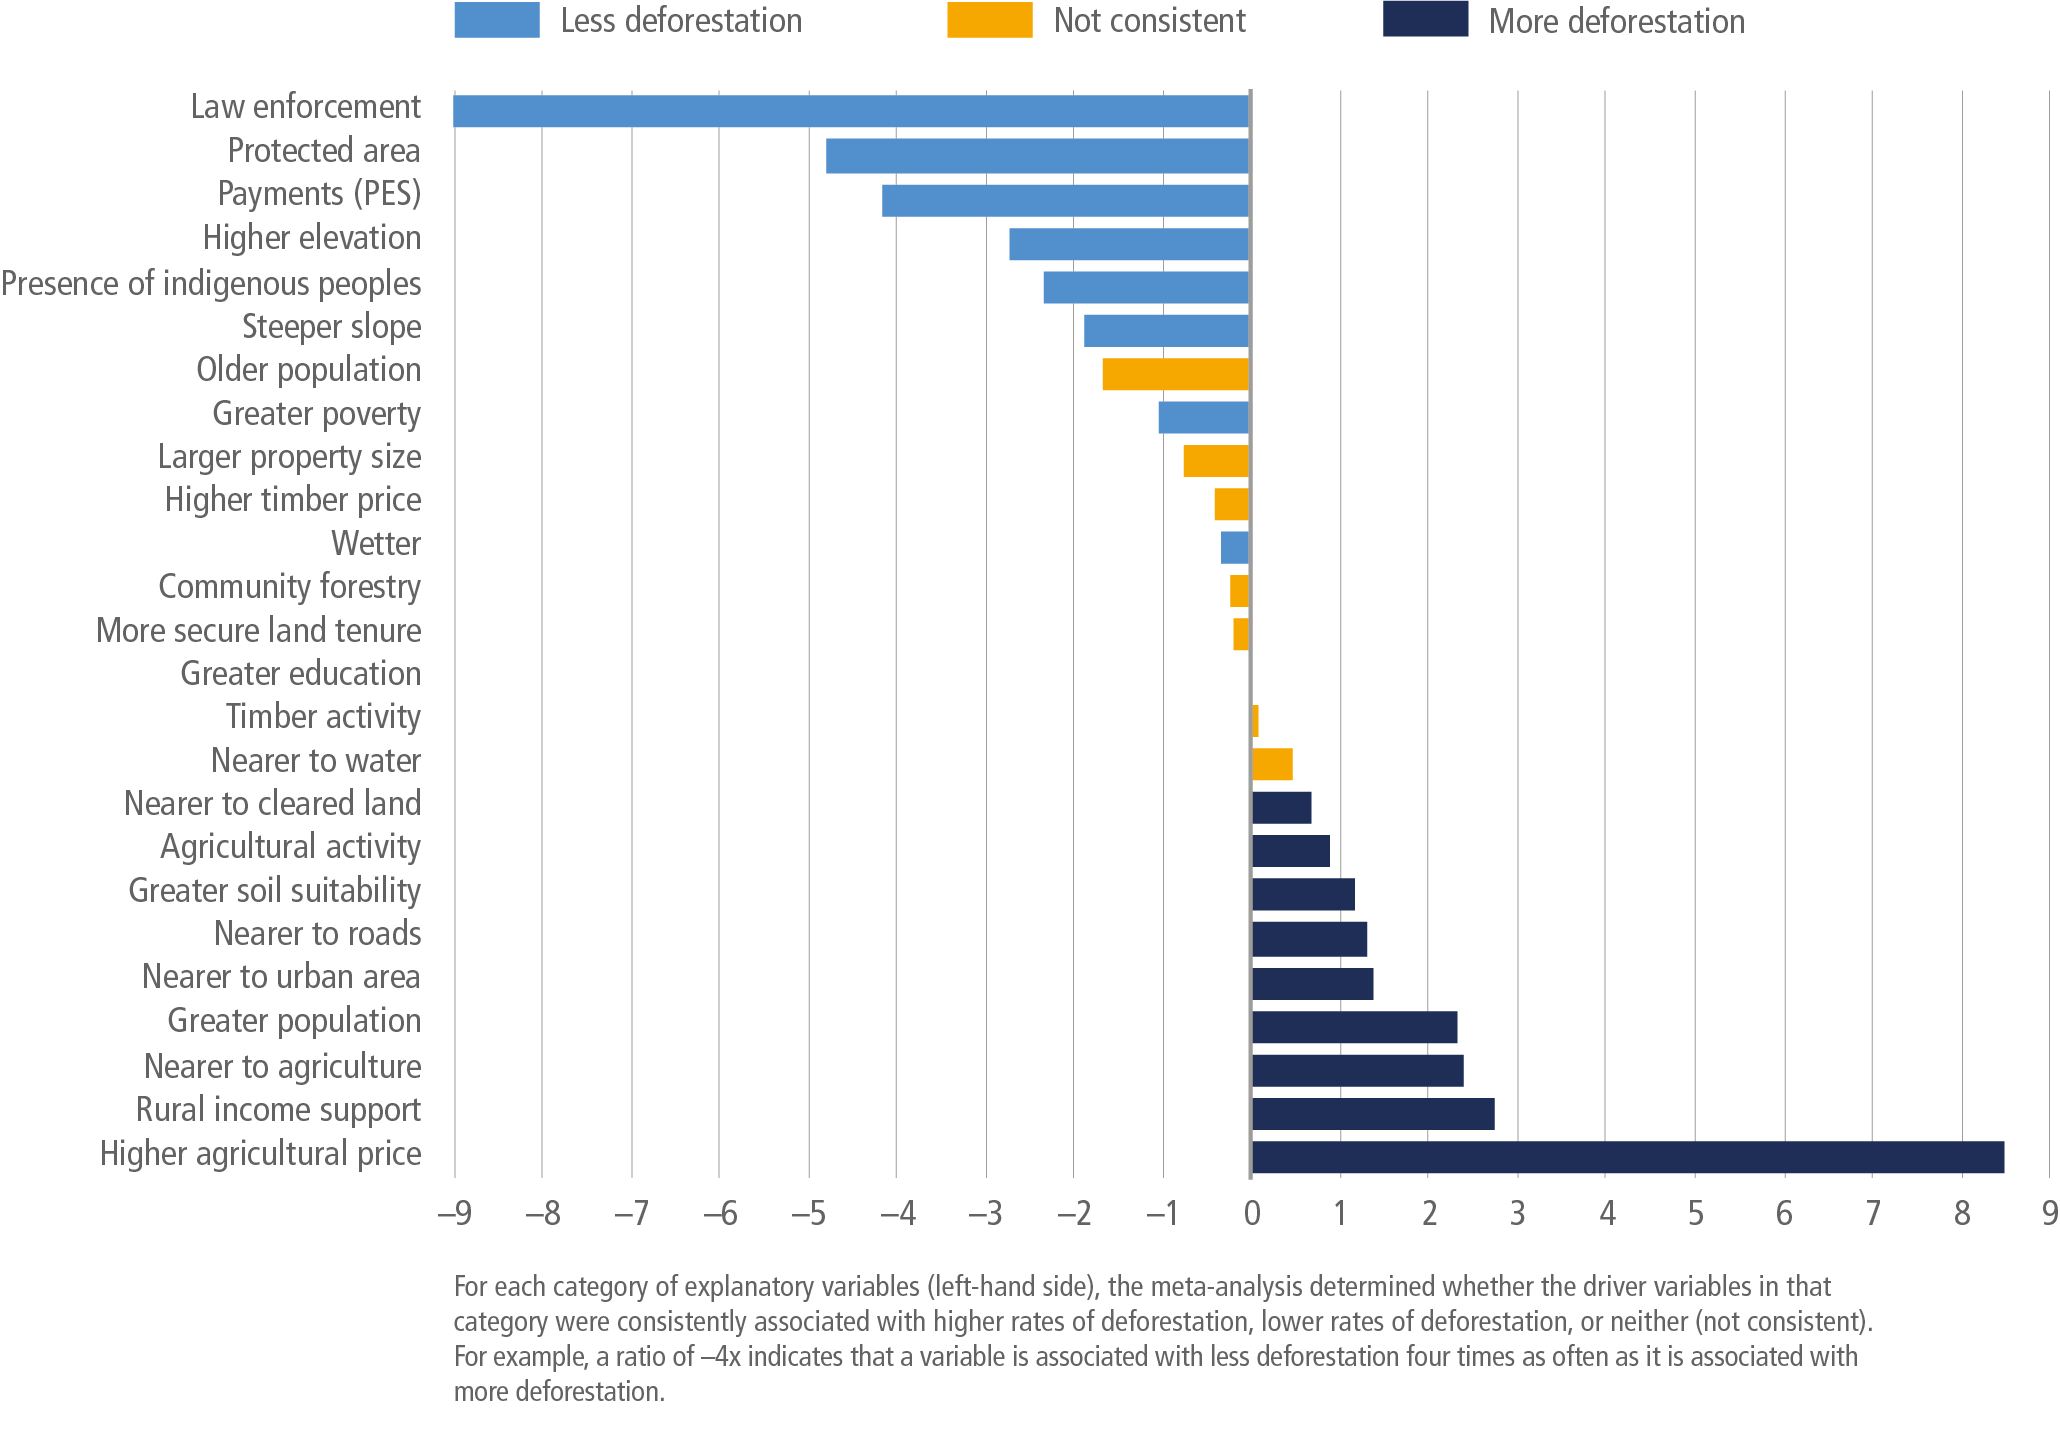
Since AR5 several global assessments (IPBES 2018a; NYDF Assessment Partners 2019; UNEP 2019; IPCC 2019) and studies (e.g., Tubiello 2019; Tian et al. 2020) have reported on drivers (natural and anthropogenic factors that affect emissions and sinks of the land-use sector) behind AFOLU emissions trends, and associated projections for the coming decades. The following analysis aligns with the drivers typology used by IPBES (2019b) and the Global Environmental Outlook (UNEP 2019). Drivers are divided into direct drivers resulting from human decisions and actions concerning land use and land-use change, and indirect drivers that operate by altering the level or rate of change of one or more direct drivers. Although drivers of emissions in agriculture and FOLU are presented separately, they are interlinked, operating in many complex ways at different temporal and spatial scales, with outcomes depending on their interactions. For example, deforestation in tropical forests is a significant component of sectorial emissions. A review of deforestation drivers’ studies published between 1996 and 2013, indicated a wide range of factors associated with deforestation rates across many analyses and studies, covering different regions (Busch and Ferretti-Gallon 2017) (Figure 7.9). Higher agricultural prices were identified as a key driver of deforestation, while law enforcement, area protection, and ecosystem services payments were found to be important drivers of reduced deforestation, while timber activity did not show a consistent impact.

Figure 7.9 | Association of driver variables with more or less deforestation. Source: reproduced with permission from Busch and Ferretti-Gallon (2017).
7.3.1Anthropogenic Direct Drivers: Deforestation, Conversion of Other Ecosystems, and Land Degradation
The global forest area in 2020 is estimated at 4.1 billion ha, representing 31% of the total land area (FAO 2020a). Most forests are situated in the tropics (45%), followed by boreal (27%), temperate (16%) and subtropical (11%) domains. Considering regional distribution of global forest area, Europe and the Russian Federation accounts for 25%, followed by South America (21%), North and Central America (19%), Africa (16%), Asia (15%) and Oceania (5%). However, a significant share (54%) of the world’s forest area concerns five countries – The Russian Federation, Brazil, Canada, the USA and China (FAO 2020a). Forest loss rates differ among regions though the global trend is towards a net forest loss (UNEP 2019). The global forest area declined by about 178 Mha in the 30 years from 1990 to 2020 (FAO 2020a). The rate of net forest loss has decreased since 1990, a result of reduced deforestation in some countries and forest gains in others. The annual net loss of forest area declined from 7.8 Mha in 1990–2000, to 5.2 Mha in 2000–2010, to 4.7 Mha in 2010–2020, while the total growing stock in global forests increased (FAO 2020a). The rate of decline in net forest loss during the last decade was due mainly to an increase in the rate of forest gain (i.e., afforestation and the natural expansion of forests).
Globally, the area of the more open, other wooded land is also of significant importance, with almost 1 billion hectares (FAO 2020a). The area of other wooded land decreased by 30.6 Mha between 1990 and 2020 with larger declines between 1990–2000 (FAO 2020a). There are still significant challenges in monitoring the area of other wooded land, largely associated with difficulties in measuring tree-canopy cover in the range of 5–10%.The global area of mangroves, one of the most productive terrestrial ecosystems (Neogi 2020a), has also experienced a significant decline (Thomas et al. 2017; Neogi 2020b), with a decrease of 1.0 Mha between 1990 and 2020 (FAO 2020a) due to agriculture and aquaculture (Bhattarai 2011; Ajonina et al. 2014; Webb et al. 2014; Giri et al. 2015; Thomas et al. 2017; Fauzi et al. 2019). Some relevant direct drivers affecting emissions and removal in forests and other ecosystems are discussed in proceeding sections.
7.3.1.1Conversion of Natural Ecosystems to Agriculture
Previous IPCC reports identify land-use change as an important driver of emissions and agriculture as a key driver of land-use change, causing both deforestation and wetland drainage (P. Smith et al. 2019 a). The AR5 reported a trend of declining global agricultural land area since 2000 (Smith et al. 2014). The latest data (FAO 2021b) indicate a 2% reduction in the global agricultural area between 2000 and 2019 (Figure 7.10). This area includes (though is not limited to) land under permanent and temporary crops or pasture, temporary fallow and natural meadows and pasture utilised for grazing or agricultural purposes (FAO 2021b), although the extent of land used for grazing may not be fully captured (Fetzel et al. 2017). Data indicate changes in how agricultural land is used. Between 2000 and 2019, the area classified as permanent meadow and pasture decreased (–6%) while cropland area (under arable production and temporary crops) increased (+2%). A key driver of this change has been a general trend of intensification, including in livestock production (Barger et al. 2018; OECD/FAO 2019; UNEP 2019), whereby less grazing land is supporting increasing livestock numbers in conjunction with greater use of crops as livestock feed (Barger et al. 2018). The share of feed crops, such as maize and soybean, of global crop production is projected to grow as the demand for animal feed increases with further intensification of livestock production (OECD/FAO 2019). Despite increased demand for food, feed, fuel and fibre from a growing human population (FAO 2019b), global agricultural land area is projected to remain relatively stable during the next decade, with increases in production expected to result from agricultural intensification (OECD/FAO 2019).
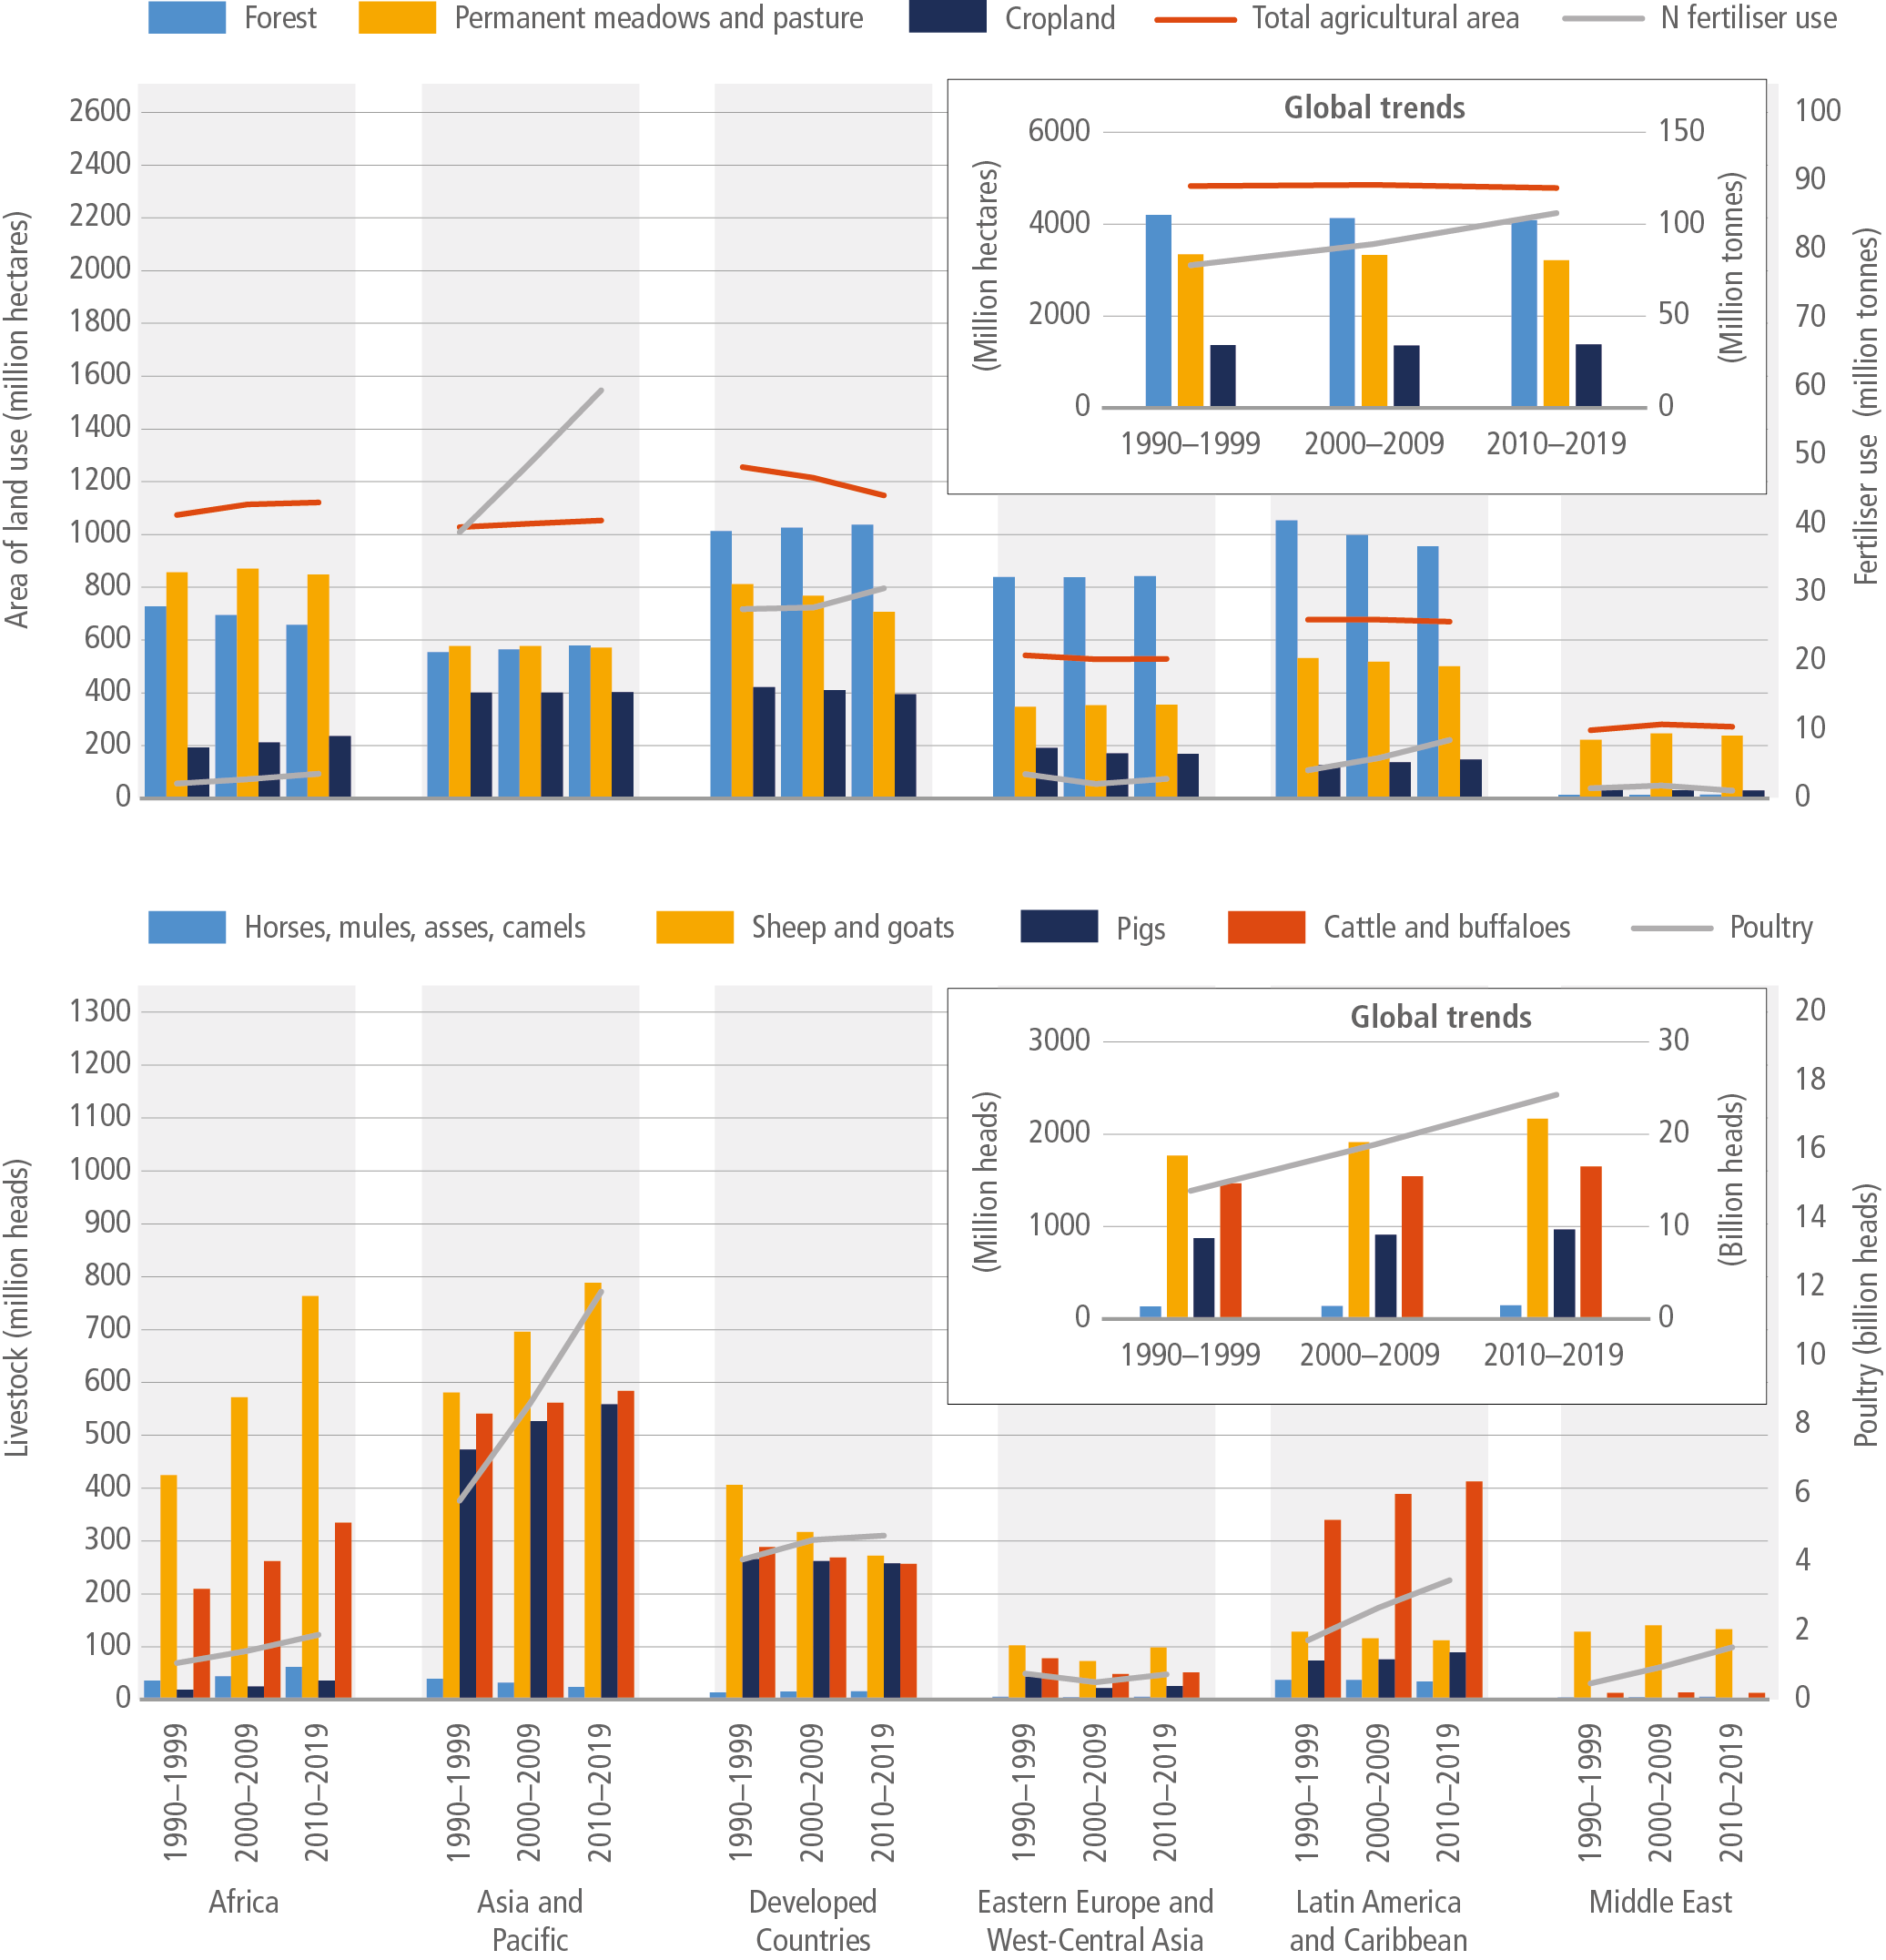
Figure 7.10 | Trends in average global and regional land area under specific land uses (FAO 2021b), inorganic nitrogen fertiliser use (FAO 2021e) (top) and number of livestock (FAO 2021c) (bottom) for three decades. For land use classification ‘cropland’ represents the FAOSTAT category ‘arable land’ which includes land under temporary crops, meadow, pasture and fallow. ‘Forest’ and ‘permanent meadow and pasture’ follow FAOSTAT categories.
Despite a decline in global agricultural area, the latest data document some regional expansion between 2000 and 2019, specifically in Africa (+3%) and Asia and the Pacific (+1%). Agricultural area declined in all other regions, notably in developed countries (–9%), due to multiple factors including among others, urbanisation (see Section 7.3.1.2).
7.3.1.2Infrastructure Development and Urbanisation
Although built-up areas (defined as cities, towns, villages and human infrastructure) occupy a relatively small fraction of land (around 1% of global land), since 1975 urban clusters (i.e., urban centres as well as surrounding suburbs) have expanded approximately 2.5 times (UNEP 2019; Chapter 8, this report). Regional differences are striking. Between 1975 and 2015, built-up areas doubled in size in Europe while urban population remained relatively constant. In Africa built-up areas grew approximately fourfold, while urban population tripled (UNEP 2019). Trends indicate that rural-to-urban migration will continue and accelerate in developing countries increasing environmental pressure in spite of measures to mitigate some of the impacts (e.g., by preserving or enhancing natural systems within cities, for example, lakes or natural and urban green infrastructures (UNEP 2019). If current population densities within cities remain stable, the extent of built-up areas in developed countries is expected to increase by 30% and triple in developing countries between 2000 and 2050 (Barger et al. 2018).
Urban expansion leads to landscape fragmentation and urban sprawl with effects on forest resources and land use (Ünal et al. 2019) while interacting with other drives. For example, in the Brazilian Amazon, the most rapid urban growth occurs within cities that are located near rural areas that produce commodities (minerals or crops) and are connected to export corridors (Richards and VanWey 2015). Urbanisation, coastal development and industrialisation also play crucial roles in the significant loss of mangrove forests (Hirales-Cota 2010; Richards and Friess 2016; Rivera-Monroy et al. 2017). Among infrastructural developments, roads are one of the most consistent and most considerable factors in deforestation, particularly in tropical frontiers (Pfaff et al. 2007; Rudel et al. 2009; Ferretti-Gallon and Busch 2014). The development of roads may also bring subsequent impacts on further development intensity due to increasing economic activities (see Chapter 8) mostly in the tropics and subtropics, where the expansion of road networks increases access to remote forests that act as refuges for biodiversity (Campbell et al. 2017) (Box 7.1). Logging is one of the main drivers of road construction in tropical forests (Kleinschroth and Healey 2017) which leads to more severe long-term impacts that include increased fire incidence, soil erosion, landslides, and sediment accumulation in streams, biological invasions, wildlife poaching, illicit land colonisation, illegal logging and mining, land grabbing and land speculation (Laurance et al. 2009; Alamgir et al. 2017).
Box 7.1 | Case Study: Reducing the Impacts of Roads on Deforestation
Summary
Rapidly expanding roads, particularly in tropical regions, are linked to forest loss, degradation, and fragmentation because the land becomes more generally accessible. Increase of land values of areas adjacent to roads also drives speculation and deforestation related to land tenure (Fearnside 2015). If poorly planned, infrastructure can facilitate fires, illegal mining, and wildlife poaching with consequences for GHG emissions and biodiversity conservation. However, some initiatives are providing new approaches for better planning and then limit environmental and societal impacts .
Background
Although the number and extent of protected areas has increased markedly in recent decades (Watson et al. 2014), many other indicators reveal that nature is in broad retreat. For example, the total area of intact wilderness is declining rapidly worldwide (Watson et al. 2016), 70% of the world’s forests are now less than 1 km from a forest edge (Haddad et al. 2015), the extent of tropical forest fragmentation is accelerating exponentially (Taubert et al. 2018). One of the most direct and immediate driver of deforestation and biodiversity decline is the dramatic expansion of roads and other transportation infrastructure (Laurance et al. 2014a; Laurance and Arrea 2017; Alamgir et al. 2017).
Case description
From 2010 to 2050, the total length of paved roads is projected to increase by 25 million km (Dulac 2013) including large infrastructure-expansion schemes in Asia (Laurance and Arrea 2017; Lechner et al. 2018) and in South America (Laurance et al. 2001; Killeen 2007), as well as widespread illegal or unplanned road building (Laurance et al. 2009; Barber et al. 2014). For example, in the Amazon, 95% of all deforestation occurs within 5.5 km of a road, and for every km of legal road there are nearly three km of illegal roads (Barber et al. 2014).
Interactionsand limitations
More than any other proximate factor, the dramatic expansion of roads is determining the pace and patterns of habitat disruption and its impacts on biodiversity (Laurance et al. 2009; Laurance and Arrea 2017). Much road expansion is poorly planned. Environmental Impact Assessments (EIAs) for roads and other infrastructure are typically too short term and superficial to detect rare species or assess long-term or indirect impacts of projects (Flyvbjerg 2009; Laurance and Arrea 2017). Another limitation is the consideration of each project in isolation from other existing or planned developments (Laurance et al. 2014b). Hence, EIAs alone are inadequate for planning infrastructure projects and assessing their broader environmental, social, and financial impacts and risks (Laurance et al. 2015a; Alamgir et al. 2017, 2018).
Lessons
The large-scale, proactive land-use planning is an option for managing the development of modern infrastructure. Approaches such as the ‘Global Roadmap’ scheme (Laurance and Balmford 2013; Laurance et al. 2014a) Strategic Environmental Assessments (Fischer 2007) can be used to evaluate the relative costs and benefits of infrastructure projects, and to spatially prioritise land uses to optimise human benefits while limited new infrastructure in areas of intact or critical habitats. For example, the Global Roadmap strategy has been used in parts of South-East Asia (Sloan et al. 2018), Indochina (Balmford et al. 2016), and sub-Saharan Africa (Laurance et al. 2015b) to devise land-use zoning that can help optimise the many risks and rewards of planned infrastructure projects.
7.3.1.3Extractive Industry Development
The extent and scale of mining is growing due to increased global demand (UNEP 2019). Due to declining ore grades, more ore needs to be processed to meet demand, with extensive use of open cast mining. A low-carbon future may be more mineral intensive with, for example, clean energy technologies requiring greater inputs in comparison to fossil-fuel-based technologies (Hund et al. 2020). Mining presents cumulative environmental impacts, especially in intensively mined regions (UNEP 2019). The impact of mining on deforestation varies considerably across minerals and countries. Mining causes significant changes to the environment, for example, through mining infrastructure establishment, soil erosion, urban expansion to support a growing workforce and development of mineral commodity supply chains (Sonter et al. 2015). The increasing consumption of gold in developing countries, increased prices, and uncertainty in financial markets is identified as driving gold mining and associated deforestation in the Amazon region (Alvarez-Berrios and Mitchell Aide 2015; Dezécache et al. 2017; Asner and Tupayachi 2017; Espejo et al. 2018). The total estimated area of gold mining throughout the region increased by about 40% between 2012 and 2016 (Asner and Tupayachi 2017). In the Brazilian Amazon, mining significantly increased forest loss up to 70 km beyond mining lease boundaries, causing 11,670 km 2 of deforestation between 2005 and 2015, representing 9% of all Amazon forest loss during this time (Sonter et al. 2015).
Mining is also an important driver of deforestation in African and Asian countries. In the Democratic Republic of Congo, where the second-largest area of tropical forest in the world occurs, mining-related deforestation exacerbated by violent conflict (Butsic et al. 2015). In India, mining has contributed to deforestation at a district level, with coal, iron and limestone having had the most adverse impact on forest area loss (Ranjan 2019). Gold mining is also identified as a driver of deforestation in Myanmar (Papworth et al. 2017).
7.3.1.4Fire Regime Changes
Wildland fires account for approximately 70% of the global biomass burned annually (van der Werf et al. 2017) and constitute a large global source of atmospheric trace gases and aerosols (Gunsch et al. 2018) (IPCC WGI AR6). Although fires are part of the natural system, the frequency of fires has increased in many areas, exacerbated by decreases in precipitation, including in many regions with humid and temperate forests that rarely experience large-scale fires naturally. Natural and human-ignited fires affect all major biomes, from peatlands through shrublands to tropical and boreal forests, altering ecosystem structure and functioning (Argañaraz et al. 2015; Nunes et al. 2016; Remy et al. 2017; Mancini et al. 2018; Aragão et al. 2018; Engel et al. 2019; Rodríguez Vásquez et al. 2021). However, the degree of incidence and regional trends are quite different and a study over 14 years indicated, on average, the largest fires in Australia, boreal North America and Northern Hemisphere Africa (Andela et al. 2019). More than half of the terrestrial surface of the Earth has fire regimes outside the range of natural variability, with changes in fire frequency and intensity posing major challenges for land restoration and recovery (Barger et al. 2018). In some ecosystems, fire prevention might lead to accumulation of large fuel loads that enable wildfires (Moreira et al. 2020a).
About 98 Mha of forest and savannahs are estimated to have been affected by fire in 2015 (FAO and UNEP 2020 ). Fire is a prevalent forest disturbance in the tropics where about 4% of the total forest and savannah area in that year was burned and more than two-thirds of the total area affected was in Africa and South America; mostly open savanna types (FAO and UNEP 2020 ). Fires have many different causes, with land clearing for agriculture the primary driver in tropical regions, for example, clearance for industrial oil-palm and paper-pulp plantations in Indonesia (Chisholm et al. 2016), or for pastures in the Amazon (Barlow et al. 2020). Other socio-economic factors are also associated with wildfire regimes such as land-use conflict and socio-demographic aspects (Nunes et al. 2016; Mancini et al. 2018). Wildfire regimes are also changing by the influence of climate change, with wildfire seasons becoming longer, wildfire average size increases in many areas and wildfires occurring in areas where they did not occur before (Jolly et al. 2015; Artés et al. 2019). Human influence has likely increased fire weather in some regions of all inhabited continents (IPCC AR6 WGI Technical Summary) and, in the last years, fire seasons of unprecedented magnitude occurred in diverse regions as California (Goss et al. 2020), the Mediterranean basin (Ruffault et al. 2020), Canada (Kirchmeier‐Young et al. 2019) with unprecedented fires in British Columbia in 2021, the Arctic and Siberia (McCarty et al. 2020), Brazilian Amazon (Silva et al. 2021) and Pantanal (Leal Filho et al. 2021), Chile (Bowman et al. 2019) and Australia (Ward et al. 2020; Gallagher et al. 2021). Lightning plays an important role in the ignition of wildfires, with the incidence of lightning igniting wildfires predicted to increase with rises in global average air temperature (Worden et al. 2017).
7.3.1.5Logging and Fuelwood Harvest
The area of forest designated for production has been relatively stable since 1990. Considering forest uses, about 30% (1.2 billion ha) of all forests is used primarily for production (wood and non-wood forest products), about 10% (424 Mha) is designated for biodiversity conservation, 398 Mha for the protection of soil and water, and 186 Mha is allocated for social services (recreation, tourism, education research and the conservation of cultural and spiritual sites) (FAO and UNEP 2020 ). While the rate of increase in the area of forest allocated primarily for biodiversity conservation has slowed in the last ten years, the rate of increase in the area of forest allocated for soil and water protection has grown since 1990, and notably in the last ten years. Global wood harvest (including from forests, other wooded land and trees outside forests) was estimated to be almost 4.0 billion m 3 in 2018 (considering both industrial roundwood and fuelwood) (FAO, 2019). Overall, wood removals are increasing globally as demand for, and the consumption of wood products grows annually by 1% in line with growing populations and incomes with this trend expected to continue in coming decades. When done in a sustainable way, more regrowth will occur and is stimulated by management, resulting in a net sink. However illegal and unsustainable logging (i.e., harvesting of timber in contravention of the laws and regulations of the country of harvest) is a global problem with significant negative economic (e.g., lost revenue), environmental (e.g., deforestation, forest degradation, GHG emissions and biodiversity losses) and social impact (e.g., conflicts over land and resources, disempowerment of local and indigenous communities) (World Bank 2019). Many countries around the world have introduced regulations for the international trade of forest products to reduce illegal logging, with significant and positive impacts (Guan et al. 2018).
Over-extraction of wood for timber and fuelwood is identified as an important driver of mangrove deforestation and degradation (Bhattarai 2011; Ajonina et al. 2014; Webb et al. 2014; Giri et al. 2015; Thomas et al. 2017; Fauzi et al. 2019). Unsustainable selective logging and over-extraction of wood is a substantial form of forest and mangrove degradation in many tropical and developing countries, with emissions associated with the extracted wood, incidental damage to the surrounding forest and from logging infrastructure (Bhattarai 2011; Ajonina et al. 2014; Webb et al. 2014; Pearson et al. 2014, Giri et al. 2015; Thomas et al. 2017; Fauzi et al. 2019). Traditional fuelwood and charcoal continue to represent a dominant share of total wood consumption in low-income countries (Barger et al. 2018). Regionally, the percentage of total wood harvested used as fuelwood varies from 90% in Africa, 62% in Asia, 50% in South America to less than 20% in Europe, North America and Oceania. Under current projections, efforts to intensify wood production in plantation forests, together with increases in fuel-use efficiency and electrification, are suggested to only partly alleviate the pressure on native forests (Barger et al. 2018). Nevertheless, the area of forest under management plans has increased in all regions since 2000 by 233 Mha (FAO 2020e). In regions representing the majority of industrial wood production, forests certified under sustainable forest management programmes accounted for 51% of total managed forest area in 2017, an increase from 11% in 2000 (ICFPA 2021).
7.3.2Anthropogenic Direct Drivers – Agriculture
7.3.2.1Livestock Populations and Management
Enteric fermentation dominates agricultural CH4 emissions (Section 7.2.3) with emissions being a function of both ruminant animal numbers and productivity (output per animal). In addition to enteric fermentation, both CH4 and N2O emissions from manure management (i.e., manure storage and application) and deposition on pasture, make livestock the main agricultural emissions source (Tubiello 2019). The AR5 reported increases in populations of all major livestock categories between the 1970s and 2000s, including ruminants, with increasing numbers directly linked with increasing CH4 emissions (Smith et al. 2014). The SRCCL identified managed pastures as a disproportionately high N2O emissions source within grazing lands, with medium confidence that increased manure production and deposition was a key driver (Jia et al. 2019). The latest data (FAO 2021c) indicate continued global livestock population growth between 1990 and 2019 (Figure 7.10), including increases of 18% in cattle and buffalo numbers, and 30% in sheep and goat numbers, corresponding with CH4 emission trends. Data also indicate increased productivity per animal for example, average increases of 16% in beef, 17% in pig meat and 70% in whole (cow) milk per respective animal between 1990 and 2019 (FAO 2021c). Despite these advances leading to reduced emissions per unit of product (calories, meat and milk) (FAO 2016; Tubiello 2019), increased individual animal productivity generally requires increased inputs (e.g., feed) and this generates increased emissions (Beauchemin et al. 2020). Manipulation of livestock diets, or improvements in animal genetics or health may counteract some of this. In addition, the production of inputs to facilitate increased animal productivity, may indirectly drive further absolute GHG emissions along the feed supply chain.
Although there are several potential drivers (McDermott et al. 2010; Alary et al. 2015), increased livestock production is principally in response to growth in demand for animal-sourced food, driven by a growing human population (FAO, 2019) and increased consumption resulting from changes in affluence, notably in middle-income countries (Godfray et al. 2018). Available data document increases in total meat and milk consumption by 24 and 22% respectively between 1990 and 2013, as indicated by average annual per capita supply (FAO 2017a). Updated data indicate that trends of increasing consumption continued between 2014 and 2018 (FAO 2021d). Sustained demand for animal-sourced food is expected to drive further livestock sector growth, with global production projected to expand by 14% by 2029, facilitated by maintained product prices and lower feed prices (OECD/FAO 2019).
7.3.2.2Rice Cultivation
In addition to livestock, both AR5 and the SRCCL identified paddy rice cultivation as an important emissions source (Smith et al. 2014), with medium evidence and high agreement that its expansion is a key driver of growing trends in atmospheric CH4 concentration (Jia et al. 2019). The latest data indicate the global harvested area of rice to have grown by 11% between 1990 and 2019, with total paddy production increasing by 46%, from 519 Mt to 755 Mt (FAO 2021c). Global rice production is projected to increase by 13% by 2028 compared to 2019 levels (OECD/FAO 2019). However, yield increases are expected to limit cultivated area expansion, while dietary shifts from rice to protein as a result of increasing per capita income, is expected to reduce demand in certain regions, with a slight decline in related emissions projected to 2030 (USEPA 2019).
Between 1990 and 2019, Africa recorded the greatest increase (+160%) in area under rice cultivation, followed by Asia and the Pacific (+6%), with area reductions evident in all other regions (FAO 2021c) broadly corresponding with related regional CH4 emission (Figures 7.3 and 7.8). Data indicate the greatest growth in consumption (average annual supply per capita) between 1990 and 2013 to have occurred in Eastern Europe and West Central Asia (+42%) followed by Africa (+25%), with little change (+1%) observed in Asia and the Pacific (FAO 2017a). Most of the projected increase in global rice consumption is in Africa and Asia (OECD/FAO 2019).
7.3.2.3 Synthetic Fertiliser Use
Both AR5 and the SRCCL described considerable increases in global use of synthetic nitrogen fertilisers since the 1970s, which was identified to be a major driver of increasing N2O emissions (Jia et al. 2019). The latest data document a 41% increase in global nitrogen fertiliser use between 1990 and 2019 (FAO 2021e) corresponding with associated increased N2O emissions (Figure 7.3). Increased fertiliser use has been driven by pursuit of increased crop yields, with for example, a 61% increase in average global cereal yield per hectare observed during the same period (FAO 2021c), achieved through both increased fertiliser use and varietal improvements. Increased yields are in response to increased demand for food, feed, fuel and fibre crops which in turn has been driven by a growing human population (FAO, 2019), increased demand for animal-sourced food and bioenergy policy (OECD/FAO 2019). Global crop production is projected to increase by almost 15% over the next decade, with low income and emerging regions with greater availability of land and labour resources expected to experience the strongest growth, and account for about 50% of global output growth (OECD/FAO 2019). Increases in global nitrogen fertiliser use are also projected, notably in low income and emerging regions (USEPA 2019).
7.3.3Indirect Drivers
The indirect drivers behind how humans both use and impact natural resources are outlined in Table 7.2. Specifically; demographic, economic and cultural, scientific and technological, and institutional and governance drivers. These indirect drivers not only interact with each other at different temporal and spatial scales but are also subject to impacts and feedbacks from the direct drivers (Barger et al. 2018).
Table 7.2| Indirect drivers of anthropogenic land and natural resource use patterns.
Demography | Global and regional trends in population growth: There was a 43% increase in global population between 1990 and 2018. The greatest growth was observed in Africa and the Middle East (+104%) and least growth in Eastern Europe and West-Central Asia (+7%) (FAO 2019b). Global and regional projections: Population is projected to increase by 28% between 2018 and 2050 reaching 9.7 billion (FAO 2019). The world’s population is expected to become older, more urbanised and live in smaller households (UNEP 2019). Human migration: Growing mobility and population are linked to human migration, a powerful driver of changes in land and resource use patterns at decadal time scales, with the dominant flow of people being from rural areas to urban settlements over the past few decades, notably in the developing world (Adger et al. 2015; Barger et al. 2018). |
Economic development and cultural factors | Changes in land use and management come from individual and social responses to economic opportunities (e.g., demand for a particular commodity or improved market access), mediated by institutions and policies (e.g., agricultural subsidies and low-interest credit or government-led infrastructure projects) (Barger et al. 2018). Projections on consumption: If the future global population adopts a per capita consumption rate similar to that of the developed world, the global capacity to provide land-based resources will be exceeded (Barger et al. 2018). Economic growth in the developing world is projected to double the global consumption of forest and wood products by 2030, with demand likely to exceed production in many developing and emerging economies in Asia and Africa within the next decade (Barger et al. 2018). Global trade: Market distorting agricultural subsidies and globalisation increases pressure on land systems and functions, with global trade and capital flow influencing land use, notably in developing countries (Furumo and Aide 2017; Yao et al. 2018; Pendrill et al. 2019a; UNEP 2019, OECD/FAO 2019). Estimates suggest that between 29 and 39% of emissions from deforestation in the tropics resulted from the international trade of agricultural commodities (Pendrill et al. 2019a). |
Science and technology | Technological factors operates in conjunction with economic drivers of land use and management, whether through intensified farming techniques and biotechnology, high-input approaches to rehabilitating degraded land (e.g., Lin et al. 2017; Guo et al. 2020) or through new forms of data collection and monitoring (e.g., Song et al. 2018; Thyagharajan and Vignesh 2019; Arévalo et al. 2020). Changes in farming and forestry systems: Changes can have both positive and negative impacts regarding multiple factors, including GHG emission trends. Fast advancing technologies shape production and consumption, and drive land-use patterns and terrestrial ecosystems at various scales. Innovation is expected to help drive increases in global crop production during the next decade (OECD/FAO 2019). For example, emerging gene editing technologies, may advance crop breeding capabilities, though are subject to biosafety, public acceptance and regulatory approval (Jaganathan et al. 2018; Chen et al. 2019; Schmidt et al. 2020). Technological changes were significant for the expansion of soybean in Brazil by adapting to different soils and photoperiods (Abrahão and Costa 2018). In Asia, technological development changed agriculture with significant improvements in production and adaptation to climate change (Thomson et al. 2019; Giller and Ewert 2019; Anderson et al. 2020; Cassman and Grassini 2020). Developments such as precision agriculture and drip irrigation have facilitated more efficient agrochemical and water use (UNEP 2019). Research and development are central to forest restoration strategies that have become increasingly important around the world as costs vary depending on methods used, from natural regeneration with native tree species to active restoration using site preparation and planting (Löf et al. 2019). In addition, climate change poses the challenge about tree species selection in the future. Innovations in the forest sector also form the basis of a bioeconomy associated with bioproducts and new processes (Verkerk et al. 2020) (Cross-Working Group Box 3 in Chapter 12). Emerging mitigation technologies: Chemically synthesised methanogen inhibitors for ruminants are expected to be commercially available in some countries within the next two years and have considerable CH4 mitigation potential (McGinn et al. 2019; Melgar et al. 2020; Beauchemin et al. 2020; Reisinger et al. 2021) (Section 7.4.3). There is growing literature (in both academic and non-academic spheres) on the biological engineering of protein. Although in its infancy and subject to investment, technological development, regulatory approval and consumer acceptance, it is suggested to have the potential to disrupt current livestock production systems and land use (Stephens et al. 2018; Ben-Arye and Levenberg 2019; RethinkX 2019; Post et al. 2020). The extent to which this is possible and the overall climate benefits are unclear (Lynch and Pierrehumbert 2019; Chriki and Hocquette 2020). |
Institutions and governance | Institutional factors often moderate the relevance and impact of changes in economic and demographic variables related to resource exploitation and use. Institutions encompass the rule of law, legal frameworks and other social structures (e.g., civil society networks and movements) determining land management (e.g., formal and informal property rights, regimes and their enforcement); information and knowledge exchange systems; local and traditional knowledge and practice systems (Barger et al. 2018). Land rights: Land tenure often allows communities to exercise traditional governance based on traditional ecological knowledge, devolved and dynamic access rights, judicious use, equitable distribution of benefits (Mantyka-Pringle et al. 2017; Wynberg 2017; Thomas et al. 2017), biodiversity (Contreras-Negrete et al. 2014) and fire and grazing management (Levang et al. 2015; Varghese et al. 2015). Agreements and Finance: Since AR5, global agreements were reached on climate change, sustainable development goals, and the mobilisation of finance for development and climate action. Several countries adopted policies and commitments to restore degraded land (Barger et al. 2018). The UN Environment Programme (UNEP) and the Food and Agriculture Organization of the UN (FAO), launched the UN Decade on Ecosystem Restoration (https://www.decadeonrestoration.org/). Companies have also made pledges to reduce impacts on forests and on the rights of local communities as well as eliminating deforestation from their supply chains. The finance sector, a crucial driver behind action (Section 7.6, Box 7.12), has also started to make explicit commitments to avoiding environmental damage (Barger et al. 2018) and net zero targets (Forest Trends Ecosystem Marketplace 2021), though investment is sensitive to market outlook. |
7.4Assessment of AFOLU Mitigation Measures Including Trade-offs and Synergies
AFOLU mitigation or land-based climate change mitigation (used in this chapter interchangeably) are a variety of land management or demand management practices that reduce GHG emissions and/or enhance carbon sequestration within the land system (i.e., in forests, wetlands, grasslands, croplands and pasturelands). If implemented with benefits to human well-being and biodiversity, land-based mitigation measures are often referred to as nature-based solutions and/or natural climate solutions (Glossary). Measures that result in a net removal of GHGs from the atmosphere and storage in either living or dead organic material, or in geological stores, are known as CDR, and in previous IPCC reports were sometimes referred to as greenhouse gas removal (GGR) or negative emissions technologies (NETs) (Rogelj et al. 2018a; Jia et al. 2019). This section evaluates current knowledge and latest scientific literature on AFOLU mitigation measures and potentials, including land-based CDR measures. Section 7.4.1 provides an overview of the approaches for estimating mitigation potential, the co-benefits and risks from land-based mitigation measures, estimated global and regional mitigation potential and associated costs according to literature published over the last decade. Subsequent subsections assess literature on 20 key AFOLU mitigation measures specifically providing:
•A description of activities, co-benefits, risks and implementation opportunities and barriers.
•A summary of conclusions in the IPCC Fifth Assessment Report (AR5) and IPCC Special Reports (Special Report on Climate Change of 1.5°C (SR1.5), Special Report on the Ocean and Cryosphere in a Changing Climate (SROCC) and Special Report on Climate Change and Land (SRCCL)).
•An overview of literature and developments since the AR5 and IPCC Special Reports.
•An assessment and conclusion based on current evidence.
Measures are categorised as supply-side activities in: (i) forests and other ecosystems (Section 7.4.2); (ii) agriculture (Section 7.4.3); (iii) bioenergy and other land-based energy technologies (Section 7.4.4); as well as (iv) demand-side activities (Section 7.4.5 and Figure 7.11). Several information boxes are dispersed within the section and provide supporting material, including case studies exploring a range of topics from climate-smart forestry in Europe (Box 7.2), agroforestry in Brazil (Box 7.3), climate-smart village approaches (Box 7.4), farm systems approaches (Box 7.5), mitigation within Indian agriculture (Box 7.6), and bioenergy and BECCS mitigation calculations (Box 7.7). Novel measures, including enhanced weathering and novel foods are covered in Chapter 12, this report. In addition, as mitigation within AFOLU concerns land management and use of land resources, AFOLU measures impact other sectors. Accordingly, AFOLU measures are also discussed in other sectoral chapters within this report, notably demand-side solutions (Chapter 5), bioenergy and bioenergy with carbon capture and storage (BECCS) (Chapter 6), the use of wood products and biomass in buildings (Chapter 9), and CDR measures, food systems and land related impacts, risks and opportunities of mitigation measures (Chapter 12).
7.4.1Introduction and Overview of Mitigation Potential
7.4.1.1Estimating Mitigation Potentials
Mitigation potentials for AFOLU measures are estimated by calculating the scale of emissions reductions or carbon sequestration against a counterfactual scenario without mitigation activities. The types of mitigation potential estimates in recent literature include: (i) technical potential (the biophysical potential or amount possible with current technologies); (ii) economic potential (constrained by costs, usually by a given carbon price (Table 7.3); (iii) sustainable potential (constrained by environmental safeguards and/or natural resources, e.g., limiting natural forest conversion), and (iv) feasible potential (constrained by environmental, socio-cultural, and/or institutional barriers), however, there are no set definitions used in literature. In addition to types of mitigation estimates, there are two AFOLU mitigation categories often calculated: supply-side measures (land management interventions) and demand-side measures (interventions that require a change in consumer behaviour).
Table 7.3 | Estimated annual mitigation potential (GtCO2-eq yr–1) in2020–2050of AFOLU mitigation options by carbon price. Estimates reflect sectoral studies based on a comprehensive literature review updating data from (Roe et al. 2019) and integrated assessment models using the IPCC AR6 database (Section 7.5). Values represent the mean, and full range of potential. Sectoral mitigation estimates are averaged for the years 2020–2050 to capture a wider range of literature, and the IAM estimates are given for 2050 as many model assumptions delay most land-based mitigation to mid-century. The sectoral potentials are the sum of global estimates for the individual measures listed for each option. IAM potentials are given for mitigation options with available data; for example, net land-use CO2 for total forests and other ecosystems, and land sequestration from A/R, but not reduced deforestation (protect). Sectoral estimates predominantly use GWP100 IPCC AR5 values (CH4= 28, N2O = 265), although some use GWP100 IPCC AR4 values (CH4= 25, N2O = 298); and the IAMs use GWP100 IPCC AR6 values (CH4= 27, N2O = 273). The sectoral and IAM estimates reflected here do not account for the substitution effects of avoiding fossil fuel emissions nor emissions from other more energy intensive resources/materials. For example, BECCS estimates only consider the carbon dioxide removal (CDR) via geological storage component and not potential mitigation derived from the displacement of fossil fuel use in the energy sector. Mitigation potential from substitution effects are included in the other sectoral chapters like energy, transport, buildings and industry. The total AFOLU sectoral estimate aggregates potential from agriculture, forests and other ecosystems, and diverted agricultural production from avoided food waste and diet shifts (excluding land-use impacts to avoid double counting). Because of potential overlaps between measures, sectoral values from BECCS and the full value chain potential from demand-side measures are not summed with AFOLU. IAMs account for land competition and resource optimisation and can therefore sum across all available categories to derive the total AFOLU potential. Key: ND = no data; Sectoral = as assessed by sectoral literature review; IAM = as assessed by integrated assessment models; EJ = exajoule primary energy.
Mitigation option | Estimate type | <USD20 tCO2-eq–1 | <USD50 tCO2-eq–1 | <USD100tCO2-eq–1 | Technical |
Agriculture total | Sectoral | 0.9 (0.5–1.4) | 1.6 (1–2.4) | 4.1 (1.7–6.7) | 11.2 (1.6–28.5) |
IAM | 0.9 (0–3.1) | 1.3 (0–3.2) | 1.8 (0.7–3.3) | ND | |
Agriculture – Carbon sequestration (Soil carbon management in croplands and grasslands, agroforestry, and biochar) | Sectoral | 0.5 (0.4–0.6) | 1.2 (0.9–1.6) | 3.4 (1.4–5.5) | 9.5 (1.1–25.3) |
IAM | ND | ND | ND | ND | |
Agriculture – Reduce CH4and N2O emissions (Improve enteric fermentation, manure management, nutrient management, and rice cultivation) | Sectoral | 0.4 (0.1–0.8) | 0.4 (0.1–0.8) | 0.6 (0.3–1.3) | 1.7 (0.5–3.2) |
IAM | 0.9 (0–3.1) | 1.3 (0–3.2) | 1.8 (0.7–3.3) | ND | |
Forests and other ecosystems total | Sectoral | 2.9 (2.2–3.5) | 3.1 (1.4–5.1) | 7.3 (3.9–13.1) | 13 (5–29.5) |
IAM | 2.4 (0–10.5) | 3.3 (0–9.9) | 4.2 (0–12.1) | ND | |
Forests and other ecosystems – Protect (Reduce deforestation, loss and degradation of peatlands, coastal wetlands, and grasslands) | Sectoral | 2.3 (1.7–2.9) | 2.4 (1.2–3.6) | 4.0 (2.5–7.4) | 6.2 (2.8–14.4) |
IAM | ND | ND | ND | ND | |
Forests and other ecosystems – Restore (Afforestation, reforestation, peatland restoration, coastal wetland restoration) | Sectoral | 0.15 | 0.7 (0.2–1.5) | 2.1 (0.8–3.8) | 5 (1.1–12.3) |
IAM (A/R) | 0.6 (0.2–6.5) | 0.6 (0.01–8.3) | 0.7 (0.07–6.8) | ND | |
Forests and other ecosystems – Manage (Improve forest management, fire management) | Sectoral | 0.4 (0.3–0.4) | ND | 1.2 (0.6–1.9) | 1.8 (1.1–2.8) |
IAM | ND | ND | ND | ND | |
Demand-side measures (Shift to sustainable healthy diets, reduce food waste, and enhanced and improved use of wood products)* For all three only the direct avoided emissions; land-use effects are in measures above | Sectoral | ND | ND | 2.2 (1.1–3.6)* | 4.2 (2.2–7.1)* |
IAM | ND | ND | ND | ND | |
BECCS (Only the CDR component, for example, the geological storage. Substitution effects are accounted in other sectoral chapters e.g: Energy (ch 6), Transport (ch 10)) | Sectoral | ND | ND | 1.6 (0.5–3.5) | 5.9 (0.5–11.3) |
IAM | 0.08 (0–0.7) | 0.5 (0–6) | 1.8 (0.2–9.9) | ND | |
Bioenergy from residues | Sectoral | ND | ND | ND | Up to 57 EJ yr –1 |
TOTAL AFOLU (Agriculture, forests and other ecosystems, diverted agricultural production from demand-side) | Sectoral | 3.8 (2.7–4.9) | 4.3 (2.3–6.7) | 13.6 (6.7–23.4) | 28.4 (8.8–65.1) |
TOTAL AFOLU (Agriculture, forests and other ecosystems, BECCS) | IAM | 3.4 (0–14.6) | 5.3 (0.6–19.4) | 7.9 (4.1–17.3) | ND |
Two main approaches to estimating mitigation potentials include: (i) studies on individual measures and/or sectors – henceforth referred to as sectoral assessments, and (ii) integrated assessment models (IAM). Sectoral assessments include studies focusing on one activity (e.g., agroforestry) based on spatial and biophysical data, as well as econometric and optimisation models for a sector, for example, the forest or agriculture sector, and therefore cover a large suite of practices and activities while representing a broad body of literature. Sectoral assessments, however, rarely capture cross-sector interactions or impacts, making it difficult to completely account for land competition, trade-offs, and double counting when aggregating sectoral estimates across different studies and methods (Smith et al. 2014; Jia et al. 2019). On the other hand, IAMs assess the climate impact of multiple and interlinked practices across sectors and therefore, can account for interactions and trade-offs (including land competition, use of other resources and international trade) between them. However, the number of land-based measures used in IAMs are limited compared with the sectoral portfolio (Figure 7.11). The resolution of land-based measures in IAMs are also generally coarser compared to some sectoral estimates, and as such, may be less robust for individual measures (Roe et al. 2021). Given the differences between and strengths and weaknesses of the two approaches, it is helpful to compare the estimates from both. We combine estimates from both approaches to establish an updated range of global land-based mitigation potential.

Figure 7.11 | Global and regional mitigation potential (GtCO2-eq yr–1) in2020–2050for 20 land-based measures. 2-eq yr–1) in2020–2050for 20 land-based measures. (a) Global estimates represent the mean (bar) and full range (error bars) of the economic potential (up to USD100 tCO2-eq –1) based on a comprehensive literature review of sectoral studies (references are outlined in the sub-section for each measure in Sections 7.4.2–7.4.5). Potential co-benefits and trade-offs for each of the 20 measures are summarised in icons. (b) Regional estimates illustrate the mean technical (T) and economic (E) (up to USD100 tCO2-eq –1) sectoral potential based on data from (Roe et al. 2021). IAM economic potential (M) (USD100 tCO2-eq –1) data is from the IPCC AR6 database.
For the 20 land-based mitigation measures outlined in this section, the mitigation potential estimates are largely derived from sectoral approaches, and where data is available, are compared to IAM estimates. Integrated assessment models and the emissions trajectories, cost-effectiveness and trade-offs of various mitigation pathways are detailed in Section 7.5. It should be noted that the underlying literature for sectoral as well as IAM mitigation estimates consider GWP100 IPCC AR5 values (CH4= 28, N2O = 265) as well as GWP100 IPCC AR4 values (CH4= 25, N2O = 298) to convert CH4 and N2O to CO2-eq. Where possible, we note the various GWP100 values (in IAM estimates, and the wetlands and agriculture sections), however in some instances, the varying GWP100 values used across studies prevents description of non-CO2 gases in native units as well as conversion to AR6 GWP100 (CH4= 27, N2O = 273) CO2-eq values to aggregate sectoral assessment estimates.
7.4.1.2Co-benefits and Risks
Land interventions have interlinked implications for climate mitigation, adaptation, food security, biodiversity, ecosystem services, and other environmental and societal challenges (Section 7.6.5). Therefore, it is important to consider the net effect of mitigation measures for achieving both climate and non-climate goals (Section 7.1).
While it is helpful to assess the general benefits, risks and opportunities possible for land-based mitigation measures (L.G. Smith et al. 2019), their efficacy and scale of benefit or risk largely depends on the type of activity undertaken, deployment strategy (e.g., scale, method), and context (e.g., soil, biome, climate, food system, land ownership) that vary geographically and over time (robust evidence, high agreement ) (L.G. Smith et al. 2019; P. Smith et al. 2019 a; Hurlbert et al. 2019) (Section 12.5). Impacts of land-based mitigation measures are therefore highly context specific and conclusions from specific studies may not be universally applicable. If implemented at appropriate scales and in a sustainable manner, land-based mitigation practices have the capacity to reduce emissions and sequester billions of tonnes of carbon from the atmosphere over coming decades, while also preserving or enhancing biodiversity, water quality and supply, air quality, soil fertility, food and wood security, livelihoods, resilience to droughts, floods and other natural disasters, and positively contributing to ecosystem health and human well-being ( high confidence) (Toensmeier 2016; Karlsson et al. 2020).
Overall, measures in the AFOLU sector are uniquely positioned to deliver substantial co-benefits. However, the negative consequences of inappropriate or misguided design and implementation of measures may be considerable, potentially impacting for example, mitigation permanence, longevity, and leakage, biodiversity, wider ecosystem functioning, livelihoods, food security and human well-being (Section 7.6) (AR6 WGII, Box 2.2). Land-based mitigation may also face limitations and trade-offs in achieving sustained emission reductions and/or removals due to other land challenges including climate change impacts. It is widely recognised that land-use planning that is context-specific, considers other sustainable development goals, and is adaptable over time can help achieve land-based mitigation that maximises co-benefits, avoids or limits trade-offs, and delivers on international policy goals including the SDGs, Land Degradation Neutrality, and Convention on Biological Diversity (Section 7.6; Chapter 12).
Potential co-benefits and trade-offs are outlined for each of the 20 land-based mitigation measures in the proceeding sub-sections and summarised in Figure 7.12. Section 7.6.5. discusses general links with ecosystem services, human well-being and adaptation, while Chapter 12 (Section 12.5) provides an in-depth assessment of the land related impacts, risks and opportunities associated with mitigation options across sectors, including positive and negative effects on land resources, water, biodiversity, climate, and food security.
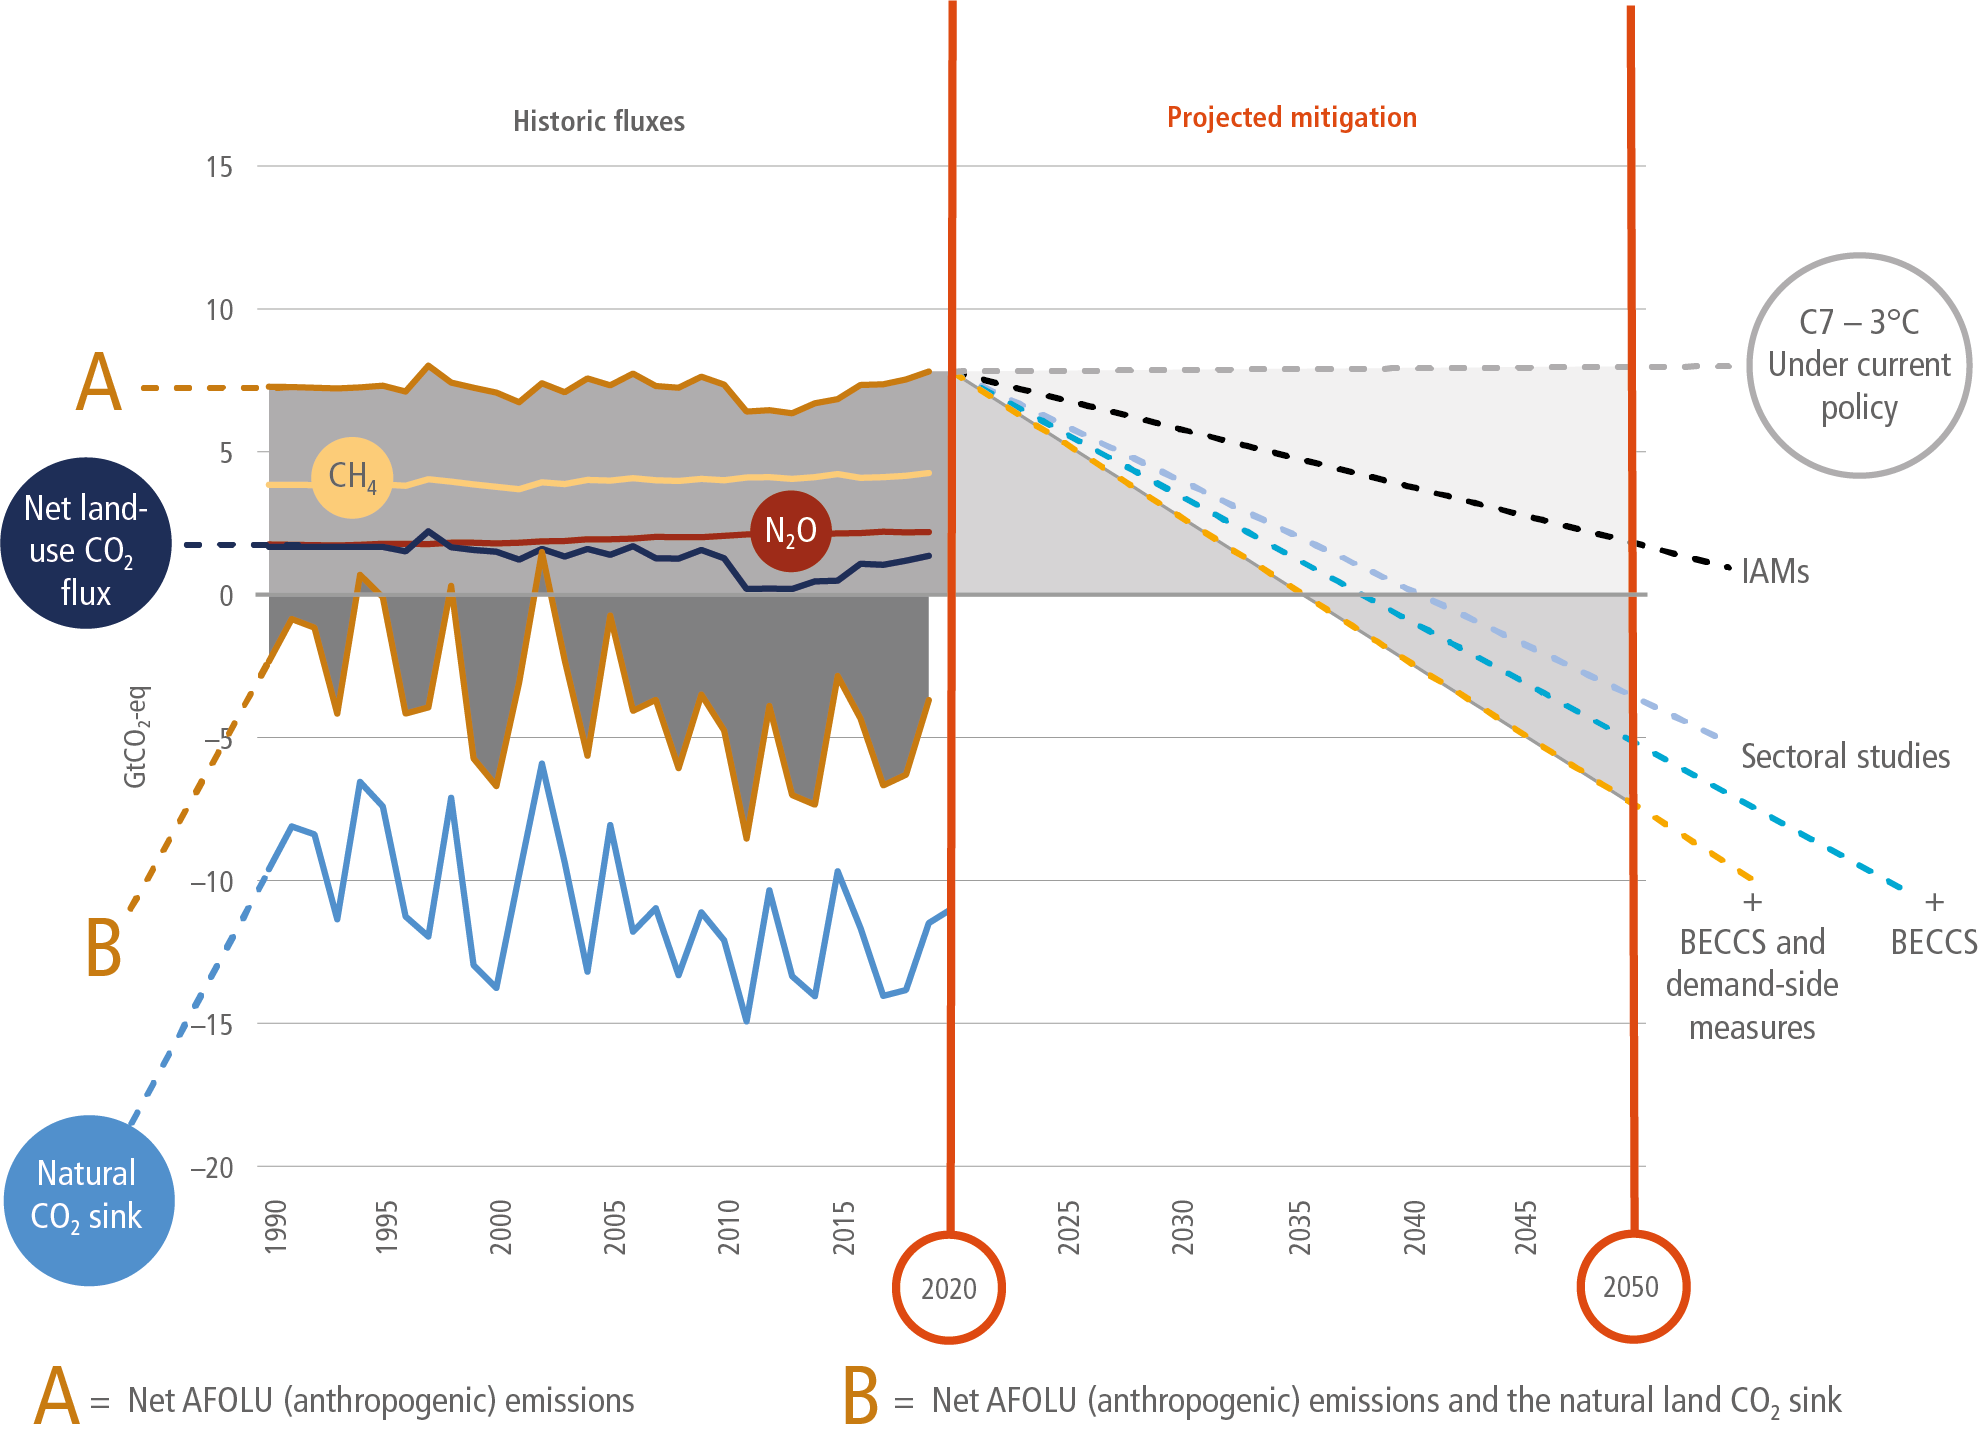
Figure 7.12 | Historic land sector GHG flux estimates and illustrative AFOLU mitigation pathways to 2050, based on data presented in Sections 7. 2, 7.4 and 7.5. Historic trends consider both A anthropogenic (AFOLU) GHG fluxes (GtCO2-eq yr –1) according to FAOSTAT (FAO 2021a; 2021b) and B the estimated natural land CO2 sink according to (Friedlingstein et al. 2020). Note that for the anthropogenic net land CO2 flux component, several approaches and methods are described within the literature (Section 7.2.2) with a wide range in estimates. For clarity, only one dataset (FAOSTAT) is illustrated here. It is not intended to indicate preference for one particular method over others. Historic flux trends are illustrated to 2019, the latest year for which data is available. Projected economic mitigation potential (at costs of up to USD100 tCO2-eq –1) includes estimates from IAMs and sectoral studies (Table 7.3). The ‘sectoral studies’ are disaggregated into several cumulative parts: first ‘sectoral studies’ involves measures in agriculture, forests and other ecosystems, then an additional BECCS share (‘+ BECCS’), then the additional effect of demand-side measures and BECCS (‘+BECCS and demand-side measures’). The latter only accounting for diverted agricultural production to avoid double counting. Projected mitigation assumes adoption of measures to achieve increasing, linear mitigation, reaching average annual potential in 2050, although this does not reflect deployment rates for most measures. For illustrative purposes, a pathway to projected emissions in 2050 according to a scenario of current policy (C7– above 3.0°C – Model: GCAM 5.3) is additionally included for reference.
7.4.1.3Overview of Global and Regional Technical and Economic Potentials in AFOLU
IPCC AR5 (2014). In the AR5, the economic mitigation potential of supply-side measures in the AFOLU sector was estimated at 7.18–10.60 GtCO2-eq yr –1 in 2030 with carbon prices up to USD100 tCO2-eq –1, about a third of which could be achieved at <USD20 tCO2-eq –1 (medium evidence, medium agreement ) (Smith et al. 2014). The AR5 provided a summary table of individual AFOLU mitigation measures, but did not conduct a detailed assessment for each.
IPCC SRCCL (2019). The SRCCL assessed the full range of technical, economic and sustainability mitigation potentials in AFOLU for the period 2030–2050 and identified reduced deforestation and forest degradation to have greatest potential for reducing supply-side emissions (0.4 to 5.8 GtCO2-eq yr –1) ( high confidence) followed by combined agriculture measures, 0.3 to 3.4 GtCO2-eq yr –1 (medium confidence) (Jia et al. 2019). For the demand-side estimates, shifting towards healthy, sustainable diets (0.7 to 8.0 GtCO2-eq yr –1) ( high confidence) had the highest potential, followed by reduced food loss and waste (0.8 to 4.5 GtCO2-eq yr –1) ( high confidence). Measures with greatest potential for CDR were afforestation/reforestation (0.5 to 10.1 GtCO2-eq yr –1) (medium confidence), soil carbon sequestration in croplands and grasslands (0.4 to 8.6 GtCO2-eq yr –1) (medium confidence) and BECCS (0.4 to 11.3 GtCO2-eq yr –1) (medium confidence). The SRCCL did not explore regional potential, associated feasibility nor provide detailed analysis of costs.
IPCC AR6. This assessment concludes the likely range of global land-based mitigation potential is approximately 8–14 GtCO2-eq yr –1 between 2020–2050 with carbon prices up to USD100 tCO2-eq –1, about half of the technical potential (medium evidence, medium agreement ). About 30–50% could be achieved <USD20 tCO2-eq –1 (Table 7.3). The global economic potential estimates in this assessment are slightly higher than the AR5 range. Since AR5, there have been numerous new global assessments of sectoral land-based mitigation potential (Fuss et al. 2018; Griscom et al. 2017, 2020; Roe et al. 2019; Jia et al. 2019; Griscom et al. 2020; Roe et al. 2021) as well as IAM estimates of mitigation potential (Riahi et al. 2017; Popp et al. 2017; Rogelj et al. 2018a; Frank et al. 2019; Johnston and Radeloff 2019; Baker et al. 2019), expanding the scope of AFOLU mitigation measures included and substantially improving the robustness and spatial resolution of mitigation estimates. A recent development is an assessment of country-level technical and economic (USD100 tCO2-eq –1) mitigation potential for 20 AFOLU measures, including for demand-side and soil organic carbon sequestration in croplands and grasslands, not estimated before (Roe et al. 2021). Estimates on costs, feasibility, sustainability, benefits, and risks have also been developed for some mitigation measures, and they continue to be active areas of research. Developing more refined sustainable potentials at a country-level will be an important next step. Although most mitigation estimates still do not consider the impact of future climate change, there are some emerging studies that do (Sonntag et al. 2016; Doelman et al. 2019). Given the IPCC WG1 finding that the land sink is continuing to increase although its efficiency is decreasing with climate change, it will be critical to better understand how future climate will affect mitigation potentials, particularly from CDR measures.
Across global sectoral studies, the economic mitigation potential (up to USD100 tCO2-eq –1) of supply-side measures in AFOLU for the period 2020–2050 is 11.4 mean (5.6–19.8 full range) GtCO2-eq yr –1, about 50% of the technical potential of 24.2 (4.9–58) GtCO2-eq yr –1 (Table 7.3). Adding 2.1 GtCO2-eq yr –1 from demand-side measures (accounting only for diverted agricultural production to avoid double counting with land-use change effects), total land-based mitigation potential up to USD100 tCO2-eq –1 is 13.6 (6.7–23.4) GtCO2-eq yr –1. This estimate aligns with the most recent regional assessment (Roe et al. 2021), which found the aggregate global mitigation potential of supply and demand-side measures to be 13.8 ± 3.1 GtCO2-eq yr –1 up to USD100 tCO2-eq –1 for the period 2020–2050. Across integrated assessment models (IAMs), the economic potential for land-based mitigation (Agriculture, LULUCF and BECCS) for USD100 tCO2-eq –1 is 7.9 mean (4.1–17.3 range) GtCO2-eq yr –1 in 2050 (Table 7.3). We add the estimate for BECCS here to provide the full land-based potential, as IAMs optimise land allocation based on costs, which displaces land-based CDR activities for BECCS. Combining both IAM and sectoral approaches, the likely range is therefore 7.9–13.6 (rounded to 8–14) GtCO2-eq yr –1 up to USD100 tCO2-eq –1 between 2020–2050. Considering both IAM and sectoral economic potential estimates, land-based mitigation could have the capacity to make the AFOLU sector net negative in GHG emissions from 2036 (Figure 7.12), although there are highly variable mitigation strategies for how AFOLU potential can be deployed for achieving climate targets (Illustrative Mitigation Pathways in Section 7.5.5). Economic potential estimates, which reflect a public willingness to pay, may be more relevant for policy making compared with technical potentials which reflect a theoretical maximum that may not be feasible or sustainable.
Among the mitigation options, the protection, improved management, and restoration of forests and other ecosystems (wetlands, savannas and grasslands) have the largest potential to reduce emissions and/or sequester carbon at 7.3 (3.9–13.1) GtCO2-eq yr –1 (up to USD100 tCO2-eq –1), with measures that ‘protect’ having the single highest total mitigation and mitigation densities (mitigation per area) in AFOLU (Table 7.3 and Figure 7.11). Agriculture provides the second largest share of mitigation, with 4.1 (1.7–6.7) GtCO2-eq yr –1 potential (up to USD100 tCO2-eq –1), from soil carbon management in croplands and grasslands, agroforestry, biochar, rice cultivation, and livestock and nutrient management (Table 7.3 and Figure 7.11). Demand-side measures including shifting to sustainable healthy diets, reducing food waste, and improving wood products can mitigate 2.2 (1.1–3.6) GtCO2-eq yr –1 when accounting only for diverted agricultural production from diets and food waste to avoid double counting with measures in forests and other ecosystems (Table 7.3 and Figure 7.11). The potential of demand-side measures increases three-fold, to 6.5 (4–9.5) GtCO2-eq yr –1 when accounting for the entire value chain including land-use effects, but would overlap with other measures and is therefore not additive.
Most mitigation options are available and ready to deploy. Emissions reductions can be unlocked relatively quickly, whereas CDR need upfront investment to generate sequestration over time. The protection of natural ecosystems, carbon sequestration in agriculture, sustainable healthy diets and reduced food waste have especially high co-benefits and cost efficiency. Avoiding the conversion of carbon-rich primary peatlands, coastal wetlands and forests is particularly important as most carbon lost from those ecosystems are irrecoverable through restoration by the 2050 timeline of achieving net zero carbon emissions (Goldstein et al. 2020). Sustainable intensification, shifting diets, reducing food waste could enhance efficiencies and reduce agricultural land needs, and are therefore critical for enabling supply-side measures such as reduced deforestation, restoration, as well as reducing N2O and CH4 emissions from agricultural production – as seen in the Illustrative Mitigation Pathway (IMP-SP) (Section 7.5.6). Although agriculture measures that reduce non-CO2, particularly of CH4, are important for near-term emissions reductions, they have less economic potential due to costs. Demand-side measures may be able to deliver non-CO2 emissions reductions more cost efficiently.
Regionally, economic mitigation potential up to USD100 tCO2-eq –1 is estimated to be greatest in tropical countries in Asia and Pacific (34%), Latin America and the Caribbean (24%), and Africa and the Middle East (18%) because of the large potential from reducing deforestation and sequestering carbon in forests and agriculture (Figure 7.11). However, there is also considerable potential in Developed Countries (18%) and more modest potential in Eastern Europe and West-Central Asia (5%). These results are in line with the IAM regional mitigation potentials (Figure 7.11). The protection of forests and other ecosystems is the dominant source of mitigation potential in tropical regions, whereas carbon sequestration in agricultural land and demand-side measures are important in Developed Countries and Asia and Pacific. The restoration and management of forests and other ecosystems is more geographically distributed, with all regions having significant potential. Regions with large livestock herds (Developed Countries, Latin America) and rice paddy fields (Asia and Pacific) have potential to reduce CH4. As expected, the highest total potential is associated with countries and regions with large land areas, however when considering mitigation density (total potential per hectare), many smaller countries, particularly those with wetlands have disproportionately high levels of mitigation for their size (Roe et al. 2021). As global commodity markets connect regions, AFOLU measures may create synergies and trade-offs across the world, which could make national demand-side measures for example, important in mitigating supply-side emissions elsewhere (Kallio et al. 2018).
Although economic potentials provide more realistic, near-term climate mitigation compared to technical potentials, they still do not account for feasibility barriers and enabling conditions that vary by region and country. For example, according to most models, including IAMs, avoided deforestation is the cheapest land-based mitigation option (Table 7.3, Sections 7.5.3 and 7.5.4), however implementing interventions aimed at reducing deforestation (including REDD+) often have higher transaction and implementation costs than expected due to various barriers and enabling conditions (Luttrell et al. 2018) (Section 7.6). The feasibility of implementing AFOLU mitigation measures, including those with multiple co-benefits, depends on varying economic, technological, institutional, socio-cultural, environmental and geophysical barriers ( high confidence) (L.G. Smith et al. 2019). The section for each individual mitigation measure provides an overview of co-benefits and risks associated with the measure and Section 7.6.6 outlines key enabling factors and barriers for implementation.
7.4.2Forests and Other Ecosystems
7.4.2.1Reduce Deforestation and Degradation
Activities, co-benefits, risks and implementation opportunities and barriers. Reducing deforestation and forest degradation conserves existing carbon pools in forest vegetation and soil by avoiding tree cover loss and disturbance. Protecting forests involves controlling the drivers of deforestation (such as commercial and subsistence agriculture, mining, urban expansion) and forest degradation (such as overharvesting including fuelwood collection, poor harvesting practices, overgrazing, pest outbreaks, and extreme wildfires), as well as by establishing well designed, managed and funded protected areas (Barber et al. 2014), improving law enforcement, forest governance and land tenure, supporting community forest management and introducing forest certification (P. Smith et al. 2019 a). Reducing deforestation provides numerous and substantial co-benefits, preserving biodiversity and ecosystem services (e.g., air and water filtration, water cycling, nutrient cycling) more effectively and at lower costs than afforestation/reforestation (Jia et al. 2019). Potential adverse side effects of these conservation measures include reducing the potential for agriculture land expansion, restricting the rights and access of local people to forest resources, or increasing the dependence of local people to insecure external funding. Barriers to implementation include unclear land tenure, weak environmental governance, insufficient funds, and increasing pressures associated to agriculture conversion, resource exploitation and infrastructure development (Sections 7.3 and 7.6).
Conclusions from AR5 and IPCC Special Reports (SR1.5, SROCC and SRCCL); mitigation potential, costs, and pathways. Reducing deforestation and forest degradation represents one of the most effective options for climate change mitigation, with technical potential estimated at 0.4–5.8 GtCO2 yr –1 by 2050 ( high confidence) (SRCCL, Chapters 2 and 4, and Table 6.14). The higher technical estimate represents a complete halting of land-use conversion in forests and peatland forests (i.e., assuming recent rates of carbon loss are saved each year) and includes vegetation and soil carbon pools. Ranges of economic potentials for forestry ranged in AR5 from 0.01–1.45 GtCO2 yr –1 for USD20 tCO2–1 to 0.2–13.8 GtCO2 yr –1 for USD100 tCO2–1 by 2030 with reduced deforestation dominating the forestry mitigation potential LAM and MAF, but very little potential in OECD-1990 and EIT (IPCC AR5).
Developments since AR5 and IPCC Special Reports (SR1.5, SROCC and SRCCL). Since the SRCCL, several studies have provided updated and convergent estimates of economic mitigation potentials by region (Busch et al. 2019; Griscom et al. 2020; Austin et al. 2020; Roe et al. 2021). Tropical forests and savannas in Latin America provide the largest share of mitigation potential (3.9 GtCO2 yr –1 technical, 2.5 GtCO2 yr –1 at USD100 tCO2–1) followed by South-East Asia (2.2 GtCO2 yr –1 technical, 1.5 GtCO2 yr –1 at USD100 tCO2–1) and Africa (2.2 GtCO2 yr –1 technical, 1.2 GtCO2 yr –1 at USD100 tCO2–1) (Roe et al. 2021). Tropical forests continue to account for the highest rates of deforestation and associated GHG emissions. While deforestation shows signs of decreasing in several countries, in others, it continues at a high rate or is increasing (Turubanova et al. 2018). Between 2010–2020, the rate of net forest loss was 4.7 Mha yr –1 with Africa and South America presenting the largest shares (3.9 Mha and 2.6 Mha, respectively) (FAO 2020a).
A major uncertainty in all studies on avoided deforestation potential is their reliance on future reference levels that vary across studies and approaches. If food demand increases in the future, for example, the area of land deforested will likely increase, suggesting more technical potential for avoiding deforestation. Transboundary leakage due to market adjustments could also increase costs or reduce effectiveness of avoiding deforestation (e.g., Ingalls et al. 2018; Gingrich et al. 2019). Regarding forest regrowth, there are uncertainties about the time for the secondary forest carbon saturation (Houghton and Nassikas 2017; Zhu et al. 2018). Permanence of avoided deforestation may also be a concern due to the impacts of climate change and disturbance of other biogeochemical cycles on the world’s forests that can result in future potential changes in terrestrial ecosystem productivity, climate-driven vegetation migration, wildfires, forest regrowth and carbon dynamics (Ballantyne et al. 2012; Kim et al. 2017b; Lovejoy and Nobre 2018; Aragão et al. 2018).
Critical assessment and conclusion. Based on studies since AR5, the technical mitigation potential for reducing deforestation and degradation is significant, providing 4.5 (2.3–7) GtCO2 yr –1 globally by 2050, of which 3.4 (2.3–6.4) GtCO2 yr –1 is available at below USD100 tCO2–1 (medium confidence) (Figure 7.11). Over the last decade, hundreds of subnational initiatives that aim to reduce deforestation related emissions have been implemented across the tropics (Section 7.6). Reduced deforestation is a significant piece of the NDCs in the Paris Agreement (Seddon et al. 2020) and keeping the temperature below 1.5°C (Crusius 2020). Conservation of forests provides multiple co-benefits linked to ecosystem services, biodiversity and sustainable development (Section 7.6.). Still, ensuring good governance, accountability (e.g., enhanced monitoring and verification capacity; Bos 2020), and the rule of law are crucial for implementing forest-based mitigation options. In many countries with the highest deforestation rates, insecure land rights often are significant barriers for forest-based mitigation options (Gren and Zeleke 2016; Essl et al. 2018).
7.4.2.2Afforestation, Reforestation and Forest Ecosystem Restoration
Activities, co-benefits, risks and implementation opportunities and barriers. Afforestation and reforestation (A/R) are activities that convert land to forest, where reforestation is on land that has previously contained forests, while afforestation is on land that historically has not been forested (Box 7.2). Forest restoration refers to a form of reforestation that gives more priority to ecological integrity as well, even though it can still be a managed forest. Depending on the location, scale, and choice and management of tree species, A/R activities have a wide variety of co-benefits and trade-offs. Well-planned, sustainable reforestation and forest restoration can enhance climate resilience and biodiversity, and provide a variety of ecosystem services including water regulation, microclimatic regulation, soil erosion protection, as well as renewable resources, income and livelihoods (Locatelli et al. 2015; Stanturf et al. 2015; Ellison et al. 2017; Verkerk et al. 2020). Afforestation, when well planned, can help address land degradation and desertification by reducing runoff and erosion and lead to cloud formation however, when not well planned, there are localised trade-offs such as reduced water yield or biodiversity (Teuling et al. 2017; Ellison et al. 2017). The use of non-native species and monocultures may have adverse impacts on ecosystem structure and function, and water availability, particularly in dry regions (Ellison et al. 2017). A/R activities may change the surface albedo and evapotranspiration regimes, producing net cooling in the tropical and subtropical latitudes for local and global climate and net warming at high latitudes (Section 7.4.2). Very large-scale implementation of A/R may negatively affect food security since an increase in global forest area can increase food prices through land competition (Kreidenweis et al. 2016).
Conclusions from AR5 and IPCC Special Reports (SR1.5, SROCC and SRCCL); mitigation potential, costs, and pathways. The AR5 did not provide a new specification of A/R potential, but referred to IPCC AR4 mostly for forestry measures (Nabuurs et al. 2007). The AR5 did view the feasible A/R potential from a diets change scenario that released land for reforestation and bioenergy crops. The AR5 provided top-down estimates of costs and potentials for forestry mitigation options – including reduced deforestation, forest management, afforestation, and agroforestry, estimated to contribute between 1.27 and 4.23 GtCO2 yr –1 of economically viable abatement in 2030 at carbon prices up to USD100 tCO2-eq –1 (Smith et al. 2014).
The SRCCL remained with a reported wide range of mitigation potential for A/R of 0.5–10.1 GtCO2 yr –1 by 2050 (medium confidence) (Kreidenweis et al. 2016; Griscom et al. 2017; Hawken 2017; Fuss et al. 2018; Roe et al. 2019) (SRCCL Chapters 2 and 6). The higher estimate represents a technical potential of reforesting all areas where forests are the native cover type (reforestation), constrained by food security and biodiversity considerations, considering above and below-ground carbon pools and implementation on a rather theoretical maximum of 678 Mha of land (Griscom et al. 2017; Roe et al. 2019). The lower estimates represent the minimum range from an Earth System Model and a sustainable global CDR potential (Fuss et al. 2018). Climate change will affect the mitigation potential of reforestation due to impacts in forest growth and composition, as well as changes in disturbances including fire. However, none of the mitigation estimates included in the SRCCL account for climate impacts.
Developments since AR5 and IPCC Special Reports (SR1.5, SROCC and SRCCL). Since SRCCL, additional studies have been published on A/R mitigation potential by Bastin et al. (2019), Lewis et al. (2019), Doelman et al. (2019), Favero et al. (2020) and Austin et al. (2020). These studies are within the range reported in the SRCCL stretching the potentials at the higher range. The rising public interest in nature-based solutions, along with high profile initiatives being launched (UN Decade on Restoration announced in 2019, the Bonn challenge on 150 million ha of restored forest in 2020 and the one trillion trees campaign launched by the World Economic Forum in 2020), has prompted intense discussions on the scale, effectiveness, and pitfalls of A/R and tree planting for climate mitigation (Luyssaert et al. 2018; Bond et al. 2019; Anderegg et al. 2020; Heilmayr et al. 2020; Holl and Brancalion 2020). The sometimes sole attention on afforestation and reforestation – suggesting it may solve the climate problem to large extent, in combination with the very high estimates of potentials – have led to polarisation in the debate, resulting in criticism to these measures or an emphasis on nature restoration only (Lewis et al. 2019). Our assessment based on most recent literature produced regional economic mitigation potential at USD100 tCO2–1 estimate of 100–400 MtCO2 yr –1 in Africa, 210–266 MtCO2 yr –1 in Asia and Pacific, 291 MtCO2-eq yr –1 in Developed Countries (87% in North America), 30 MtCO2-eq yr –1 in Eastern Europe and West-Central Asia, and 345–898 MtCO2-eq yr –1 in Latin America and Caribbean (Roe et al. 2021), which totals to about 1200 MtCO2 yr –1, leaning to the lower range of the potentials in earlier IPCC reports. A recent global assessment of the aggregate costs for afforestation and reforestation suggests that at USD100 tCO2–1, 1.6 GtCO2 yr –1 could be sequestered globally for an annual cost of USD130 billion (Austin et al. 2020). Sectoral studies that are able to deal with local circumstances and limits estimate A/R potentials at 20 MtCO2 yr –1 in Russia (Eastern Europe and West-Central Asia) (Romanovskaya et al. 2020) and 64 MtCO2 yr –1 in Europe (Nabuurs et al. 2017). (Domke et al. 2020) estimated for the USA an additional 20% sequestration rate from tree planting to achieve full stocking capacity of all understocked productive forestland, in total reaching 187 MtCO2 yr –1 sequestration. A new study on costs in the USA estimates 72–91 MtCO2 yr –1 could be sequestered between now and 2050 for USD100 tCO2–1 (Wade et al. 2019). The tropical and subtropical latitudes are the most effective for forest restoration in terms of carbon sequestration because of the rapid growth and lower albedo of the land surface compared with high latitudes (Lewis et al. 2019). Costs may be higher if albedo is considered in North America, Russia, and Africa (Favero et al. 2017). In addition, a wide variety of sequestration rates have been collected and published in the IPCC Good Practice Guidance for the AFOLU sector (IPCC 2006).
Critical assessment and conclusion. There is medium confidence that the global technical mitigation potential of afforestation and reforestation activities by 2050 is 3.9 (0.5–10.1) GtCO2 yr –1, and the economic mitigation potential (<USD100 tCO2–1) is 1.6 (0.5–3.0) GtCO2 yr –1 (requiring about 200 Mha). Per hectare a long (about 100 year) sustained effect of 5–10 t CO2 ha –1 yr –1 is realistic with ranges between 1–20 t(CO2) ha –1 yr –1. Not all sectoral studies rely on economic models that account for leakage (Murray et al. 2004; Sohngen and Brown 2004), suggesting that technical potential may be overestimated.
7.4.2.3Improved Forest Management
Activities, co-benefits, risks and implementation opportunities and barriers. Improved sustainable forest management of already managed forests can lead to higher forest carbon stocks, better quality of produced wood, continuously produced wood, while maintaining and enhancing the forest carbon stock, and can also partially prevent and counteract the impacts of disturbances (Kurz et al. 2008; Marlon et al. 2012; Abatzoglou and Williams 2016; Seidl et al. 2017; Nabuurs et al. 2017; Tian et al. 2018; Ekholm 2020). Furthermore, it can provide benefits for climate change adaptation, biodiversity conservation, microclimatic regulation, soil erosion protection and water and flood regulation with reduced lateral carbon fluxes (Ashton et al. 2012; Martínez-Mena et al. 2019; Verkerk et al. 2020). Often, in existing (managed) forests with existing carbon stocks, large changes per hectare cannot be expected, although many forest owners may respond to carbon price incentives (Favero et al. 2020; Ekholm 2020). The full mitigation effects can be assessed in conjunction with the overall forest and wood use system i.e., carbon stock changes in standing trees, soil, harvested wood products (HWPs) and its bioenergy component with the avoided emissions through substitution. Forest management strategies aimed at increasing the biomass stock may have adverse side effects, such as decreasing the stand-level structural complexity, large emphasis on pure fast-growing stands, risks for biodiversity and resilience to natural disasters.
Generally, measures can consist of one or combination of longer rotations, less intensive harvests, continuous-cover forestry, mixed stands, more adapted species, selected provenances, high quality wood assortments, and so on. Further, there is a trade-off between management in various parts of the forest product value chain, resulting in a wide range of results on the role of managed forests in mitigation (Agostini et al. 2013; Braun et al. 2016; Soimakallio et al. 2016; Gustavsson et al. 2017; Erb et al. 2017; Favero et al. 2020; Hurmekoski et al. 2020). Some studies conclude that reduction in forest carbon stocks due to harvest exceeds for decades the joint sequestration of carbon in harvested wood product stocks and emissions avoided through wood use (Soimakallio et al. 2016; Seppälä et al. 2019), whereas others emphasise country level examples where investments in forest management have led to higher growing stocks while producing more wood (Schulze et al. 2020; Ouden et al. 2020; Cowie et al. 2021).
Conclusions from AR5 and IPCC Special Reports (SR1.5, SROCC and SRCCL); mitigation potential, costs, and pathways. In the SRCCL, forest management activities have the potential to mitigate 0.4–2.1 GtCO2-eq yr –1 by 2050 (medium confidence) (SRCCL: Griscom et al. 2017; Roe et al. 2019). The higher estimate stems from assumptions of applications on roughly 1.9 billion ha of already managed forest which can be seen as very optimistic. It combines both natural forest management as well as improved plantations, on average with a small net additional effect per hectare, not including substitution effects in the energy sector nor the buildings sector.
Developments since AR5 and IPCC Special Reports (SR1.5, SROCC and SRCCL). The area of forest under management plans has increased in all regions since 2000 by 233 Mha (FAO 2020e). The roughly 1 billion ha of secondary and degraded forests would be ideal to invest in and develop a sustainable sector that pays attention to biodiversity, wood provision and climate mitigation at the same time. This all depends on the effort made, the development of expertise, know-how in the field, nurseries with adapted provenances, etc as was also found for Russian climate-smart forestry options (Leskinen et al. 2020). Regionally, recently updated economic mitigation potential at USD100 tCO2–1 have 179–186 MtCO2-eq yr –1 in Africa, 193–313 MtCO2-eq yr –1 in Asia and Pacific, 215–220 MtCO2-eq yr –1 in Developed Countries , 82–152 MtCO2-eq yr –1 in Eastern Europe and West-Central Asia, and 62–204 MtCO2-eq yr –1 in Latin America and Caribbean (Roe et al. 2021).
Regional studies can take into account the local situation better: Russia Romanovskaya et al. (2020) estimate the potential of forest fires management at 220–420 MtCO2 yr –1, gentle logging technology at 15–59, reduction of wood losses at 61–76 MtCO2 yr –1. In North America, (Austin et al. 2020) estimate that in the next 30 years, forest management could contribute 154 MtCO2 yr –1 in the USA and Canada with 81 MtCO2 yr –1 available at less than USD100 tCO2–1. In one production region (British Columbia) a cost-effective portfolio of scenarios was simulated that directed more of the harvested wood to longer-lived wood products, stopped burning of harvest residues and instead produced bioenergy to displace fossil fuel burning, and reduced harvest levels in regions with low disturbance rates. Net GHG emissions were reduced by an average of –9 MtCO2-eq yr –1 (Smyth et al. 2020). In Europe, climate-smart forestry could mitigate an additional 0.19 GtCO2 yr –1 by 2050 (Nabuurs et al. 2017), in line with the regional estimates in (Roe et al. 2021).
In the tropics, estimates of the pantropical climate mitigation potential of natural forest management (a light intensity management in secondary forests), across three tropical regions (Latin America, Africa, Asia), is around 0.66 GtCO2-eq yr –1 with Asia responding for the largest share followed by Africa and Latin America (Roe et al. 2021). Selective logging occurs in at least 20% of the world’s tropical forests and causes at least half of the emissions from tropical forest degradation (Asner et al. 2005; Blaser and Küchli 2011; Pearson et al. 2017). Reduced-impact logging for climate (RIL-C; promotion of reduced wood waste, narrower haul roads, and lower impact skidding equipment) has the potential to reduce logging emissions by 44% (Ellis et al. 2019), while also providing timber production.
Critical assessment and conclusion. There is medium confidence that the global technical mitigation potential for improved forest management by 2050 is 1.7 (1–2.1) GtCO2 yr –1, and the economic mitigation potential (<USD100 tCO2–1) is 1.1 (0.6–1.9) GtCO2 yr –1. Efforts to change forest management do not only require, for example, a carbon price incentive, but especially require knowledge, institutions, skilled labour, good access and so on. These requirements outline that although the potential is of medium size, we estimate a feasible potential towards the lower end. The net effect is also difficult to assess, as management changes impact not only the forest biomass, but also the wood chain and substitution effects. Further, leakage can arise from efforts to change management for carbon sequestration. Efforts, for example to set aside large areas of forest, may be partly counteracted by higher harvesting pressures elsewhere (Kallio et al. 2018). Studies such as (Austin et al. 2020) implicitly account for leakage and thus suggest higher costs than other studies. We therefore judge the mitigation potential at medium potential with medium agreement .
Box 7.2 | Climate-smart Forestry in Europe
Summary
European forests have been regarded as prospering and increasing for the last five decades. However, these views also changed recently. Climate change is putting a large pressure on mono species and high stocked areas of Norway spruce in Central Europe (Hlásny et al. 2021; Senf and Seidl 2021) with estimates of mortality reaching 200 million m 3, biodiversity under pressure, the Mediterranean area showing a weak sector and harvesting pressure in the Baltics and north reaching maxima achievable. A European strategy for unlocking the EU’s forests and forest sector potential was needed at the time of developing the LULUCF regulation and was based on the concept of ‘climate-smart forestry’ (CSF) (Nabuurs et al. 2017; Verkerk et al. 2020).
Background
The idea behind CSF is that it considers the whole value chain from forest to wood products and energy, illustrating that a wide range of measures can be applied to provide positive incentives for more firmly integrating climate objectives into the forest and forest sector framework. CSF is more than just storing carbon in forest ecosystems; it builds upon three main objectives; (i) reducing and/or removing GHG emissions; (ii) adapting and building diverse forests for forest resilience to climate change; and (iii) sustainably increasing forest productivity and incomes. These three CSF objectives can be achieved by tailoring policy measures and actions to regional circumstances in member states’ forest sectors.
Box 7.2
Case description
The 2015 annual mitigation effect of EU-28 forests via contributions to the forest sink, material substitution and energy substitution is estimated at 569 MtCO2 yr –1, or 13% of total current EU emissions. With the right set of incentives in place at EU and member states levels, it was found that the EU-28 has the potential to achieve an additional combined mitigation impact through the implementation of CSF of 441 MtCO2 yr –1 by 2050. Also, with the Green Deal and its biodiversity and forest strategy, more emphasis will be placed on forests, forest management and the provision of renewables. It is the diversity of measures (from strict reserves to more intensively managed systems while adapting the resource) that will determine the success. Only with co-benefits in, for example, nature conservation, soil protection, and provision of renewables, wood for buildings and income, the mitigation and adaptation measures will be successful.
Interactions, limitations and lessons
Climate-smart forestry is now taking shape across Europe with various research and implementation projects (Climate Smart Forest and Nature Management, 2021). Pilots and projects are being implemented by a variety of forest owners, some with more attention on biodiversity and adaptation, some with more attention on production functions. They establish examples and in longer term the outreach to the 16 million private owners in Europe. However, the right triggers and incentives are often still lacking. For example, adapting the spruce forest areas in Central Europe to climate change requires knowledge about different species, biodiversity and different management options and eventually use in industry. It requires alternative species to be available from the nurseries, as well as improved monitoring to assess the success and steer activities.
7.4.2.4Fire Management (Forest and Grassland/Savanna Fires)
Activities, co-benefits, risks and implementation opportunities and barriers. Fire management objectives include safeguarding life, property, and resources through the prevention, detection, control, restriction, and management of fire for diverse purposes in natural ecosystems (SRCCL, Chapter 6). Controlled burning is an effective economic method of reducing fire danger and stimulating natural regeneration. Co-benefits of fire management include reduced air pollution compared to much larger, uncontrolled fires, prevention of soil erosion and land degradation, biodiversity conservation in rangelands, and improvement of forage quality (Hurteau and Brooks 2011; Falk 2017; Hurteau et al. 2019). Fire management is still challenging because it is not only fire suppression at times of fire, but especially proper natural resource management in between fire events. Furthermore, it is challenging because of legal and policy issues, equity and rights concerns, governance, capacity, and research needs (Wiedinmyer and Hurteau 2010; Goldammer 2016; Russell-Smith et al. 2017). It will increasingly be needed under future enhanced climate change.
Conclusions from AR5 and IPCC Special Reports (SR1.5, SROCC and SRCCL); mitigation potential, costs, and pathways. In the SRCCL, fire management is among the nine options that can deliver medium-to-large benefits across multiple land challenges (climate change mitigation, adaptation, desertification, land degradation, and food security) ( high confidence). Total emissions from fires have been on the order of 8.1 GtCO2-eq yr –1 in terms of gross biomass loss for the period 1997–2016 (SRCCL, Chapter 2, and Cross-Chapter Box 3 in Chapter 2). Reduction in fire CO2 emissions was calculated to enhance land carbon sink by 0.48 GtCO2-eq yr –1 for the 1960–2009 period (Arora and Melton 2018) (SRCCL, Table 6.16).
Developments since AR5 and IPCC Special Reports (SR1.5, SROCC and SRCCL)
Savannas. Savannas constitute one of the most fire-prone vegetation types on Earth and are a significant source of GHG emissions. Savanna fires contributed 62% (4.92 PgCO2-eq yr –1) ) of gross global mean fire emissions between 1997 and 2016. Regrowth from vegetation postfire sequesters the CO2 released into the atmosphere, but not the CH4 and N2O emissions which contributed an approximate net of 2.1 PgCO2-eq yr −1 (Lipsett-Moore et al. 2018). Therefore, implementing prescribed burning with low intensity fires, principally in the early dry season, to effectively manage the risk of wildfires occurring in the late dry season is associated with reducing emissions (Whitehead et al. 2014). Considering this fire management practice, estimates of global opportunities for emissions reductions were estimated at 69.1 MtCO2-eq yr −1 in Africa (29 countries, with 20 least developed African countries accounting for 74% of the mitigation potential), 13.3 MtCO2-eq yr −1 in South America (six countries), and 6.9 MtCO2-eq yr –1 in Australia and Papua New Guinea (Lipsett-Moore et al. 2018). In Australia, savanna burning emissions abatement methodologies have been available since 2012, and abatement has exceeded 9.3 MtCO2-eq mainly through the management of low intensity early dry season fire. Until September 2021, 78 projects were registered (Australian Government, Clean Energy Regulator, 2021).
Forests. Fire is also a prevalent forest disturbance (Falk et al. 2011; Scott et al. 2014; Andela et al. 2019). About 98 Mha of forest were affected by fire in 2015, affecting about 4% of the tropical (dry) forests, 2% of the subtropical forests, and 1% of temperate and boreal forests (FAO 2020a). Between 2001–2018, remote sensing data showed that tree-covered areas correspond to about 29% of the total area burned by wildfires, most in Africa. Prescribed fires are also applied routinely in forests worldwide for fuel reduction and ecological reasons (Kalies and Yocom Kent 2016). Fire resilience is increasingly managed in Southwestern USA forest landscapes, which have experienced droughts and widespread, high-severity wildfires (Keeley et al. 2019). In these forests, fire exclusion management, coupled with a warming climate, has led to increasingly severe wildfires (Hurteau et al. 2014). However, the impacts of prescribed fires in forests in reducing carbon emissions are still inconclusive. Some positive impacts of prescribed fires are associated with other fuel reduction techniques (Loudermilk et al. 2017; Flanagan et al. 2019; Stephens et al. 2020), leading to maintaining carbon stocks and reducing carbon emissions in the future where extreme fire weather events are more frequent (Krofcheck et al. 2018, 2019; Hurteau et al. 2019; Bowman et al. 2020a,b; Goodwin et al. 2020). Land management approaches will certainly need to consider the new climatic conditions (e.g., the proportion of days in fire seasons with the potential for unmanageable fires more than doubling in some regions in northern and eastern boreal forest) (Wotton et al. 2017).
Critical assessment and conclusion. There is low confidence that the global technical mitigation potential for grassland and savanna fire management by 2050 is 0.1 (0.09–0.1) GtCO2 yr –1, and the economic mitigation potential (<USD100 tCO2–1) is 0.05 (0.03–0.07) GtCO2 yr –1. Savanna fires produce significant emissions globally, but prescribed fires in the early dry season could mitigate emissions in different regions, particularly Africa. Evidence is less clear for fire management of forests, with the contribution of GHG mitigation depending on many factors that affect the carbon balance (e.g., Simmonds et al. 2021). Although prescribed burning is promoted to reduce uncontrolled wildfires in forests, the benefits for the management of carbon stocks are unclear, with different studies reporting varying results especially concerning its long-term effectiveness (Wotton et al. 2017; Bowman et al. 2020b). Under increasing climate change however, an increased attention on fire management will be necessary.
7.4.2.5Reduce Degradation and Conversion of Grasslands and Savannas
Activities, co-benefits, risks and implementation opportunities and barriers. Grasslands cover approximately 40.5% of the terrestrial area (i.e., 52.5 million km 2) divided as 13.8% woody savanna and savanna; 12.7% open and closed shrub; 8.3% non-woody grassland; and 5.7% is tundra (White et al. 2000). Sub-Saharan Africa and Asia have the most extensive total area, 14.5 and 8.9 million km 2, respectively. A review by Conant et al. (2017) reported based on data on grassland area (FAO 2013) and grassland soil carbon stocks (Sombroek et al. 1993) a global estimate of about 343 PgC (in the top 1 m), nearly 50% more than is stored in forests worldwide (FAO 2007). Reducing the conversion of grasslands and savannas to croplands prevents soil carbon losses by oxidation, and to a smaller extent, biomass carbon loss due to vegetation clearing (SRCCL, Chapter 6). Restoration of grasslands through enhanced soil carbon sequestration, including (i) management of vegetation, (ii) animal management, and (iii) fire management, was also included in the SRCCL and is covered in Section 7.4.3.1. Similar to other measures that reduce conversion, conserving carbon stocks in grasslands and savannas can be achieved by controlling conversion drivers (e.g., commercial and subsistence agriculture, see Section 7.3) and improving policies and management. In addition to mitigation, conserving grasslands provide various socio-economic, biodiversity, water cycle and other environmental benefits (Claassen et al. 2010; Ryals et al. 2015; Bengtsson et al. 2019). Annual operating costs, and opportunity costs of income foregone by undertaking the activities needed for avoiding conversion of grasslands making costs one of the key barriers for implementation (Lipper et al. 2010).
Conclusions from AR5 and IPCC Special Reports (SR1.5, SROCC and SRCCL); mitigation potential, costs, and pathways. The SRCCL reported a mitigation potential for reduced conversion of grasslands and savannas of 0.03–0.12 GtCO2-eq yr –1 (Griscom et al. 2017; IPCC 2019) considering the higher loss of soil organic carbon in croplands (Sanderman et al. 2017). Assuming an average starting soil organic carbon stock of temperate grasslands (Poeplau et al. 2011), and the mean annual global cropland conversion rates (1961–2003) (Krause et al. 2017), the equivalent loss of soil organic carbon over 20 years would be 14 GtCO2-eq, for example, 0.7 GtCO2 yr –1 (SRCCL, Chapter 6). IPCC AR5 and AR4 did not explicitly consider the mitigation potential of avoided conversion of grasslands-savannas but the management of grazing land is accounted for considering plant, animal, and fire management with a mean mitigation potential of 0.11–0.80 tCO2-eq ha –1 yr –1 depending on the climate region. This resulted in 0.25 GtCO2-eq yr –1 at USD20 tCO2–1 to 1.25 GtCO2-eq yr –1 at USD100 tCO2–1 by 2030.
Developments since AR5 and IPCC Special Reports (SR1.5, SROCC and SRCCL). Unlike most of the measures covered in Section 7.4, there are currently no global, spatially explicit mitigation potential estimates for reduced grassland conversion to generate technical and economic potentials by region. Literature developments since AR5 and SRCCL are studies that provide mitigation estimates in one or a few countries or regions. Modelling experiments comparing Californian forests and grasslands found that grasslands resulted in a more resilient carbon sink than forests to future climate change (Dass et al. 2018). However, previous studies indicated that precipitation is a key controller of the carbon storage in these grasslands, with the grassland became a carbon sink in 2005, when the region received relatively high spring precipitation (Ma et al. 2007). In North America, grassland conversion was the source for 77% of all new croplands from 2008–2012 (Lark et al. 2015). Avoided conversion of North American grasslands to croplands presents an economic mitigation potential of 0.024 GtCO2-eq yr –1 and technical potential of 0.107 GtCO2-eq yr –1 (Fargione et al. 2018). This potential is related mainly to root biomass and soils (81% of emissions from soils). Estimates of GHG emissions from any future deforestation in Australian savannas also point to the potential mitigation of around 0.024 GtCO2-eq yr –1 (Bristow et al. 2016). The expansion of the Soy Moratorium (SoyM) from the Brazilian Amazon to the Cerrado (Brazilian savannas) would prevent the direct conversion of 3.6 Mha of native vegetation to soybeans by 2050 and avoid the emission of 0.02 GtCO2-eq yr –1 (Soterroni et al. 2019).
Critical assessment and conclusion. There is low confidence that the global technical mitigation potential for reduced grassland and savanna conversion by 2050 is 0.2 (0.1–0.4) GtCO2 yr –1, and the economic mitigation potential (<USD100 tCO2–1) is 0.04 GtCO2 yr –1. Most of the carbon sequestration potential is in below-ground biomass and soil organic matter. However, estimates of potential are still based on few studies and vary according to the levels of soil carbon, and ecosystem productivity (e.g., in response to rainfall distribution). Conservation of grasslands presents significant benefits for desertification control, especially in arid areas (SRCCL, Chapter 3). Policies supporting avoided conversion can help protect at-risk grasslands, reduce GHG emissions, and produce positive outcomes for biodiversity and landowners (Ahlering et al. 2016). In comparison to tropical rainforest regions that have been the primary target for mitigation policies associated to natural ecosystems (e.g., REDD+), conversion grasslands and savannas has received less national and international attention, despite growing evidence of concentrated cropland expansion into these areas with impacts of carbon losses.
7.4.2.6Reduce Degradation and Conversion of Peatlands Activities, Co-benefits, Risks and Implementation Barriers
Peatlands are carbon-rich wetland ecosystems with organic soil horizons in which soil organic matter concentration exceeds 30% (dry weight) and soil carbon concentrations can exceed 50% (Page and Baird 2016, Boone Kauffman et al. 2017). Reducing the conversion of peatlands avoids emissions of above- and below-ground biomass and soil carbon due to vegetation clearing, fires, and peat decomposition from drainage. Similar to deforestation, peatland carbon stocks can be conserved by controlling the drivers of conversion and degradation (e.g., commercial and subsistence agriculture, mining, urban expansion) and improving governance and management. Reducing conversion is urgent because peatland carbon stocks accumulate slowly and persist over millennia; loss of existing stocks cannot be easily reversed over the decadal time scales needed to meet the Paris Agreement (Goldstein et al. 2020). The main co-benefits of reducing conversion of peatlands include conservation of a unique biodiversity including many critically endangered species, provision of water quality and regulation, and improved public health through decreased fire-caused pollutants (Griscom et al. 2017). Although reducing peatland conversion will reduce land availability for alternative uses including agriculture or other land-based mitigation, drained peatlands constitute a small share of agricultural land globally while contributing significant emissions (Joosten 2009). Mitigation through reduced conversion of peatlands therefore has a high potential of avoided emissions per hectare (Roe et al. 2019).
Conclusions from AR5 and IPCC Special Reports (SR1.5, SROCC and SRCCL); mitigation potential, costs, and pathways. In the SRCCL (Chapters 2 and 6), it was estimated that avoided peat impacts could deliver 0.45–1.22 GtCO2-eq yr –1 technical potential by 2030–2050 (medium confidence) (Hooijer et al. 2010; Griscom et al. 2017; Hawken 2017). The mitigation potential estimates cover tropical peatlands and include CO2, N2O and CH4 emissions. The mitigation potential is derived from quantification of losses of carbon stocks due to land conversion, shifts in GHG fluxes, alterations in net ecosystem productivity, input factors such as fertilisation needs, and biophysical climate impacts (e.g., shifts in albedo, water cycles, etc.). Tropical peatlands account for only about 10% of peatland area and about 20% of peatland carbon stock but about 80% of peatland carbon emissions, primarily from peatland conversion in Indonesia (about 60%) and Malaysia (about 10%) (Hooijer et al. 2010; Page et al. 2011; Leifeld and Menichetti 2018). While the total mitigation potential of peatland conservation is considered moderate, the per hectare mitigation potential is the highest among land-based mitigation measures (Roe et al. 2019).
Developments since AR5 and IPCC Special Reports (SR1.5, SROCC and SRCCL). Recent studies continue to report high carbon stocks in peatlands and emphasise the vulnerability of peatland carbon after conversion. The carbon stocks of tropical peatlands are among the highest of any forest, 1,211–4,257 tCO2-eq ha –1 in the Peruvian Amazon (Bhomia et al. 2019) and 1,956–14,757 tCO2-eq ha –1 in Indonesia (Novita et al. 2021). Ninety percent of tropical peatland carbon stocks are vulnerable to emission during conversion and may not be recoverable through restoration; in contrast, boreal and temperate peatlands hold similar carbon stocks (1,439–5,619 tCO2-eq ha –1) but only 30% of northern carbon stocks are vulnerable to emission during conversion and irrecoverable through restoration (Goldstein et al. 2020). A recent study shows global mitigation potential of about 0.2 GtCO2-eq yr –1 at costs up to USD100 tCO2–1 (Roe et al. 2021). Another study estimated that 72% of mitigation is achieved through avoided soil carbon impacts, with the remainder through avoided impacts to vegetation (Bossio et al. 2020). Recent model projections show that both peatland protection and peatland restoration (Section 7.4.2.7) are needed to achieve a 2°C mitigation pathway and that peatland protection and restoration policies will have minimal impacts on regional food security (Leifeld et al. 2019, Humpenöder et al. 2020). Global studies have not accounted for extensive peatlands recently reported in the Congo Basin, estimated to cover 145,500 km 2 and contain 30.6 PgC, as much as 29% of total tropical peat carbon stock (Dargie et al. 2017). These Congo peatlands are relatively intact; continued preservation is needed to prevent major emissions (Dargie et al. 2019). In northern peatlands that are underlain by permafrost roughly 50% of the total peatlands north of 23° latitude, (Hugelius et al. 2020), climate change (i.e., warming) is the major driver of peatland degradation (e.g., through permafrost thaw) (Schuur et al. 2015, Goldstein et al. 2020). However, in non-permafrost boreal and temperate peatlands, reduction of peatland conversion is also a cost-effective mitigation strategy. Peatlands are sensitive to climate change and there is low confidence about the future peatland sink globally (SRCCL, Chapter 2). Permafrost thaw may shift northern peatlands from a net carbon sink to net source (Hugelius et al. 2020). Uncertainties in peatland extent and the magnitude of existing carbon stocks, in both northern (Loisel et al. 2014) and tropical (Dargie et al. 2017) latitudes limit understanding of current and future peatland carbon dynamics (Minasny et al. 2019).
Critical assessment and conclusion. Based on studies to date, there is medium confidence that peatland conservation has a technical potential of 0.86 (0.43–2.02) GtCO2-eq yr –1 of which 0.48 (0.2–0.68) GtCO2-eq yr –1 is available at USD100 tCO2–1 (Figure 7.11). High per hectare mitigation potential and high rate of co-benefits particularly in tropical countries, support the effectiveness of this mitigation strategy (Roe et al. 2019). Feasibility of reducing peatland conversion may depend on countries’ governance, financial capacity and political will.
7.4.2.7Peatland Restoration
Activities, co-benefits, risks and implementation barriers. Peatland restoration involves restoring degraded and damaged peatlands, for example through rewetting and revegetation, which both increases carbon accumulation in vegetation and soils and avoids ongoing CO2 emissions. Peatlands only account for about 3% of the terrestrial surface, predominantly occurring in boreal ecosystems (78%), with a smaller proportion in tropical regions (13%), but may store about 600 GtC or 21% of the global total soil organic carbon stock of about 3000 Gt (Page et al. 2011; Leifeld and Menichetti 2018). Peatland restoration delivers co-benefits for biodiversity, as well as regulating water flow and preventing downstream flooding, while still allowing for extensive management such as paludiculture (Tan et al. 2021). Rewetting of peatlands also reduces the risk of fire, but may also mobilise salts and contaminants in soils (van Diggelen et al. 2020) and in severely degraded peatlands, restoration of peatland hydrology and vegetation may not be feasible (Andersen et al. 2017). At a local level, restoration of peatlands drained for agriculture could displace food production and damage local food supply, although impacts to regional and global food security would be minimal (Humpenöder et al. 2020). Collaborative and transparent planning processes are needed to reduce conflict between competing land uses (Tanneberger et al. 2020b). Adequate resources for implementing restoration policies are key to engage local communities and maintain livelihoods (Resosudarmo et al. 2019; Ward et al. 2021).
Conclusions from AR5 and IPCC Special Reports (SR1.5, SROCC and SRCCL); mitigation potential, costs, and pathways. Large areas (0.51 Mkm 2) of global peatlands are degraded of which 0.2 Mkm 2 are tropical peatlands (Griscom et al. 2017; Leifeld and Menichetti 2018). According the SRCCL, peatland restoration could deliver technical mitigation potentials of 0.15 – 0.81GtCO2-eq yr –1 by 2030–2050 (low confidence) (Couwenberg et al. 2010; Griscom et al. 2017) (Chapters 2 and 6 of the SRCCL), though there could be an increase in methane emissions after restoration (Jauhiainen et al. 2008). The mitigation potential estimates cover global peatlands and include CO2, N2O and CH4 emissions. Peatlands are highly sensitive to climate change ( high confidence), however there are currently no studies that estimate future climate effects on mitigation potential from peatland restoration.
Developments since AR5 and IPCC Special Reports (SR1.5, SROCC and SRCCL). The most recent literature and reviews indicate with high confidence that restoration would decrease CO2 emissions and with medium confidence that restoration would decrease net GHG emissions from degraded peatlands (Wilson et al. 2016; Ojanen and Minkkinen 2020; van Diggelen et al. 2020). Although rewetting of drained peatlands increases CH4 emissions, this effect is often outweighed by decreases in CO2 and N2O emissions but depends very much on local circumstances (Günther et al. 2020). Restoration and rewetting of almost all drained peatlands is needed by 2050 to meet 1.5°C–2°C pathways which is unlikely to happen (Leifeld et al. 2019); immediate rewetting and restoration minimises the warming from cumulative CO2 emissions (Nugent et al. 2019).
According to recent data, the technical mitigation potential for global peatland restoration is estimated at 0.5–1.3 GtCO2-eq yr –1 (Leifeld and Menichetti 2018; Griscom et al. 2020; Bossio et al. 2020; Roe et al. 2021) (Figure 7.11), with 80% of the mitigation potential derived from improvements to soil carbon (Bossio et al. 2020). The regional mitigation potentials of all peatlands outlined in Roe et al. (2021) reflect the country-level estimates from (Humpenöder et al. 2020).
Climate mitigation effects of peatland rewetting depend on the climate zone and land use. Recent analysis shows the strongest mitigation gains from rewetting drained temperate and boreal peatlands used for agriculture and drained tropical peatlands (Ojanen and Minkkinen 2020). However, estimates of emission factors from rewetting drained tropical peatlands remain uncertain (Wilson et al. 2016; Murdiyarso et al. 2019). Topsoil removal, in combination with rewetting, may improve restoration success and limit CH4 emissions during restoration of highly degraded temperate peatlands (Zak et al. 2018). In temperate and boreal regions, co-benefits mentioned above are major motivations for peatland restoration (Chimner et al. 2017; Tanneberger et al. 2020a).
Critical assessment and conclusion. Based on studies to date, there is medium confidence that peatland restoration has a technical potential of 0.79 (0.49–1.3) GtCO2-eq yr –1 (median) of which 0.4 (0.2–0.6) GtCO2-eq yr –1 is available up to USD100 tCO2–1. The large land area of degraded peatlands suggests that significant emissions reductions could occur through large-scale restoration especially in tropical peatlands. There is medium confidence in the large carbon stocks of tropical peat forests (1956–14,757 tCO2-eq ha –1) and large rates of carbon loss associated with land cover change (640–1650 tCO2-eq ha –1) (Goldstein et al. 2020; Novita et al. 2021). However, large-scale implementation of tropical peatland restoration will likely be limited by costs and other demands for these tropical lands.
7.4.2.8Reduce Conversion of Coastal Wetlands
Activities, co-benefits, risks and implementation barriers. Reducing conversion of coastal wetlands, including mangroves, marshes and seagrass ecosystems, avoids emissions from above and below ground biomass and soil carbon through avoided degradation and/or loss. Coastal wetlands occur mainly in estuaries and deltas, areas that are often densely settled, with livelihoods closely linked to coastal ecosystems and resources (Moser et al. 2012). The carbon stocks of these highly productive ecosystems are sometimes referred to as ‘blue carbon’. Loss of existing stocks cannot be easily reversed over decadal time scales (Goldstein et al. 2020). The main drivers of conversion include intensive aquaculture, agriculture, salt ponds, urbanisation and infrastructure development, the extensive use of fertilisers, and extraction of water resources (Lovelock et al. 2018). Reduced conversion of coastal wetlands has many co-benefits, including biodiversity conservation, fisheries production, soil stabilisation, water flow and water quality regulation, flooding and storm surge prevention, and increased resilience to cyclones (Windham-Myers et al. 2018 a; UNEP 2020). Risks associated with the mitigation potential of coastal wetland conservation include uncertain permanence under future climate scenarios, including the effects of coastal squeeze, where coastal wetland area may be lost if upland area is not available for migration as sea levels rise (Lovelock and Reef 2020) (AR6 WGII, Section 3.4.2.5). Preservation of coastal wetlands also conflicts with other land use in the coastal zone, including aquaculture, agriculture, and human development; economic incentives are needed to prioritise wetland preservation over more profitable short-term land use. Integration of policies and efforts aimed at coastal climate mitigation, adaptation, biodiversity conservation, and fisheries, for example through integrated coastal zone management and marine spatial planning, will bundle climate mitigation with co-benefits and optimise outcomes (Herr et al. 2017).
Conclusions from AR5 and IPCC Special Reports (SR1.5, SROCC and SRCCL); mitigation potential, costs, and pathways. Coastal wetlands contain high, yet variable, organic carbon stocks, leading to a range of estimates of the global mitigation potential of reduced conversion. The SRCCL (Chapter 2) and SROCC (Chapter 5), report a technical mitigation potential of 0.15–5.35 GtCO2-eq yr –1 by 2050 (Pendleton et al. 2012; Lovelock et al. 2017; Howard et al. 2017; Griscom et al. 2017). The mitigation potential is derived from quantification of losses of carbon stocks in vegetation and soil due to land conversion, shifts in GHG fluxes associated with land use, and alterations in net ecosystem productivity. The wide range in estimates mostly relate to the scope (all coastal ecosystems vs mangroves only) and different assumptions on decomposition rates. Loss rates of coastal wetlands have been estimated at 0.2–3% yr –1, depending on the vegetation type and location (Atwood et al. 2017; Howard et al. 2017).
Developments since AR5 and IPCC Special Reports (SR1.5, SROCC and SRCCL). Global technical mitigation potential for conservation of coastal wetlands from recent literature have focused on protection of mangroves; estimates range from 0.06–2.25 GtCO2-eq yr –1 (Griscom et al. 2020; Bossio et al. 2020) with 80% of the mitigation potential derived from improvements to soil carbon (Bossio et al. 2020). Regional potentials (Roe et al. 2021) reflect mangrove protection; marsh and seagrass protection were not included due to lack of country-level data on marsh and seagrass distribution and conversion.
Global estimates show mangroves have the largest per hectare carbon stocks (see IPCC AR6 WGII Box 3.4 for estimates of carbon stocks, burial rates and ecosystem extent for coastal wetland ecosystems). Mean ecosystem carbon stock in mangroves is 3131 tCO2-eq ha –1 among the largest carbon stocks on Earth. Recent studies emphasise the variability in total ecosystem carbon stocks for each wetland type, based on species and climatic and edaphic conditions (Kauffman et al. 2020; Bedulli et al. 2020; Ricart et al. 2020; Alongi et al. 2020; F. Wang et al. 2021), and highlight the vulnerability of soil carbon below 1 m depth (Arifanti et al. 2019). Sea level strongly influences coastal wetland distribution, productivity, and sediment accretion; therefore, sea level rise will impact carbon accumulation and persistence of existing carbon stocks (Macreadie et al. 2019) (IPCC AR6 WGII Box 3.4).
Recent loss rates of mangroves are 0.16–0.39% yr –1 and are highest in South-East Asia (Hamilton and Casey 2016; Friess et al. 2019; Hamilton and Casey 2016). Assuming loss of soil carbon to 1 m depth after deforestation, avoiding mangrove conversion has the technical potential to mitigate approximately 23.5–38.7 MtCO2-eq yr –1 (Ouyang and Lee 2020); note, this potential is additional to reduced conversion of forests (Griscom et al. 2020) (Section 7.4.2.1). Regional estimates show that about 85% of mitigation potential for avoided mangrove conversion is in South-East Asia and Pacific (32 MtCO2-eq yr –1 at USD100 tCO2–1), 10% is in Latin American and the Caribbean (4 MtCO2-eq yr –1), and approximately 5% in other regions (Griscom et al. 2020; Roe et al. 2021).
Key uncertainties remain in mapping extent and conversion rates for salt marshes and seagrasses (McKenzie et al. 2020). Seagrass loss rates were estimated at 1–2% yr –1 (Dunic et al. 2021) with stabilisation in some regions (de los Santos et al. 2019 ) (AR6 WGII, Section 3.4.2.5); however, loss occurs non-linearly and depends on site-specific context. Tidal marsh extent and conversion rates remains poorly estimated, outside of the USA, Europe, South Africa, and Australia (Mcowen et al. 2017; Macreadie et al. 2019).
Critical assessment and conclusion. There is medium confidence that coastal wetland protection has a technical potential of 0.8 (0.06–5.4) GtCO2-eq yr –1 of which 0.17 (0.06–0.27) GtCO2-eq yr –1 is available up to USD100 tCO2–1. There is a high certainty (robust evidence, high agreement ) that coastal ecosystems have among the largest carbon stocks of any ecosystem. As these ecosystems provide many important services, reduced conversion of coastal wetlands is a valuable mitigation strategy with numerous co-benefits. However, the vulnerability of coastal wetlands to climatic and other anthropogenic stressors may limit the permanence of climate mitigation.
7.4.2.9Coastal Wetland Restoration
Activities, co-benefits, risks and implementation barriers. Coastal wetland restoration involves restoring degraded or damaged coastal wetlands including mangroves, salt marshes, and seagrass ecosystems, leading to sequestration of ‘blue carbon’ in wetland vegetation and soil (SRCCL, Chapter 6; SROCC, Chapter 5). Successful approaches to wetland restoration include: (i) passive restoration, the removal of anthropogenic activities that are causing degradation or preventing recovery; and (ii) active restoration, purposeful manipulations to the environment in order to achieve recovery to a naturally functioning system (Elliott et al. 2016) (IPCC AR6 WGII Chapter 3). Restoration of coastal wetlands delivers many valuable co-benefits, including enhanced water quality, biodiversity, aesthetic values, fisheries production (food security), and protection from rising sea levels and storm impacts (Barbier et al. 2011; Hochard et al. 2019; Sun and Carson 2020; Duarte et al. 2020). Of the 0.3 Mkm 2 coastal wetlands globally, 0.11 Mkm 2 of mangroves are considered feasible for restoration (Griscom et al. 2017). Risks associated with coastal wetland restoration include uncertain permanence under future climate scenarios (IPCC AR6 WGII, Box 3.4), partial offsets of mitigation through enhanced methane and nitrous oxide release and carbonate formation, and competition with other land uses, including aquaculture and human settlement and development in the coastal zone (SROCC, Chapter 5). To date, many coastal wetland restoration efforts do not succeed due to failure to address the drivers of degradation (van Katwijk et al. 2016). However, improved frameworks for implementing and assessing coastal wetland restoration are emerging that emphasise the recovery of ecosystem functions (Zhao et al. 2016; Cadier et al. 2020). Restoration projects that involve local communities at all stages and consider both biophysical and socio-political context are more likely to succeed (Brown et al. 2014; Wylie et al. 2016).
Conclusions from AR5 and IPCC Special Reports (SR1.5, SROCC and SRCCL); mitigation potential, costs, and pathways. The SRCCL reported that mangrove restoration has the technical potential to mitigate 0.07 GtCO2 yr –1 through rewetting (Crooks et al. 2011) and take up 0.02–0.84 GtCO2 yr –1 from vegetation biomass and soil enhancement through 2030 (medium confidence) (Griscom et al. 2017). The SROCC concluded that cost-effective coastal blue carbon restoration had a potential of about 0.15–0.18 GtCO2-eq yr –1, a low global potential compared to other ocean-based solutions but with extensive co-benefits and limited adverse side effects (Gattuso et al. 2018).
Developments since AR5 and IPCC Special Reports (SR1.5, SROCC and SRCCL). Recent studies emphasise the time frame needed to achieve the full mitigation potential (Duarte et al. 2020; Taillardat et al. 2020). The first project-derived estimate of the net GHG benefit from seagrass restoration found 1.54 tCO2-eq (0.42 MgC) ha –1 yr –110 years after restoration began (Oreska et al. 2020); comparable to the default emission factor in the Wetlands Supplement (Kennedy et al. 2014). Recent studies of rehabilitated mangroves also indicate that annual carbon sequestration rates in biomass and soils can return to natural levels within decades of restoration (Cameron et al. 2019; Sidik et al. 2019). A meta-analysis shows increasing carbon sequestration rates over the first 15 years of mangrove restoration with rates stabilising at 25.7 ± 7.7 tCO2-eq (7.0 ± 2.1 MgC) ha –1 yr –1 through forty years, although success depends on climate, sediment type, and restoration methods (Sasmito et al. 2019). Overall, 30% of mangrove soil carbon stocks and 50–70% of marsh and seagrass carbon stocks are unlikely to recover within 30 years of restoration, underscoring the importance of preventing conversion of coastal wetlands (Goldstein et al. 2020) (Section 7.4.2.8).
According to recent data, the technical mitigation potential for global coastal wetland restoration is 0.04–0.84 GtCO2-eq yr –1 (Griscom et al. 2020; Bossio et al. 2020; Roe et al. 2021) with 60% of the mitigation potential derived from improvements to soil carbon (Bossio et al. 2020). Regional potentials based on country-level estimates from Griscom et al. (2020) show the technical and economic (up to USD100 tCO2–1) potential of mangrove restoration; seagrass and marsh restoration was not included due to lack of country-level data on distribution and conversion (but see McKenzie et al. 2020 for updates on global seagrass distribution). Although global potential is relatively moderate, mitigation can be quite significant for countries with extensive coastlines (e.g., Indonesia, Brazil) and for small island states where coastal wetlands have been shown to comprise 24–34% of their total national carbon stock (Donato et al. 2012). Furthermore, non-climatic co-benefits can strongly motivate coastal wetland restoration worldwide (UNEP 2021a). Major successes in both active and passive restoration of seagrasses have been documented in North America and Europe (Lefcheck et al. 2018; de los Santos et al. 2019 ; Orth et al. 2020); passive restoration may also be feasible for mangroves (Cameron et al. 2019).
There is high site-specific variation in carbon sequestration rates and uncertainties regarding the response to future climate change (Jennerjahn et al. 2017; Nowicki et al. 2017) (IPCC AR6 WGII Box 3.4). Changes in distributions (Kelleway et al. 2017; Wilson and Lotze 2019), methane release (Al-Haj and Fulweiler 2020), carbonate formation (Saderne et al. 2019), and ecosystem responses to interactive climate stressors are not well-understood (Short et al. 2016; Fitzgerald and Hughes 2019; Lovelock and Reef 2020).
Critical assessment and conclusion. There is medium confidence that coastal wetland restoration has a technical potential of 0.3 (0.04–0.84) GtCO2-eq yr –1 of which 0.1 (0.05–0.2) GtCO2-eq yr –1 is available up to USD100 tCO2–1. There is high confidence that coastal wetlands, especially mangroves, contain large carbon stocks relative to other ecosystems and medium confidence that restoration will reinstate pre-disturbance carbon sequestration rates. There is low confidence on the response of coastal wetlands to climate change; however, there is high confidence that coastal wetland restoration will provide a suite of valuable co-benefits.
7.4.3Agriculture
7.4.3.1 Soil Carbon Management in Croplands and Grasslands
Activities, co-benefits, risks and implementation opportunities and barriers. Increasing soil organic matter in croplands are agricultural management practices that include (i) crop management: for example, high input carbon practices such as improved crop varieties, crop rotation, use of cover crops, perennial cropping systems (including agroforestry; see Section 7.4.3.3), integrated production systems, crop diversification, agricultural biotechnology; (ii) nutrient management including fertilisation with organic amendments/green manures (Section 7.4.3.6); (iii) reduced tillage intensity and residue retention, (iv) improved water management: including drainage of waterlogged mineral soils and irrigation of crops in arid/semi-arid conditions, (v) improved rice management (Section 7.4.3.5) and (vi) biochar application (P. Smith et al. 2019 a) (Section 7.4.3.2). For increased soil organic matter in grasslands, practices include (i)management of vegetation: including improved grass varieties/sward composition, deep rooting grasses, increased productivity, and nutrient management, (ii)livestock management : including appropriate stocking densities fit to carrying capacity, fodder banks, and fodder diversification, and (iii)fire management : improved use of fire for sustainable grassland management, including fire prevention and improved prescribed burning (Smith et al. 2014, 2019b). All these measures are recognised as Sustainable Soil Management Practices by FAO (Baritz et al. 2018). While there are co-benefits for livelihoods, biodiversity, water provision and food security (P. Smith et al. 2019 a), and impacts on leakage, indirect land-use change and foregone sequestration do not apply (since production in not displaced), the climate benefits of soil carbon sequestration in croplands can be negated if achieved through additional fertiliser inputs (potentially causing increased N2O emissions; (Guenet et al. 2021), and both saturation and permanence are relevant concerns. When considering implementation barriers, soil carbon management in croplands and grasslands is a low-cost option at a high level of technology readiness (it is already widely deployed globally) with low socio-cultural and institutional barriers, but with difficulty in monitoring and verification proving a barrier to implementation (Smith et al. 2020a).
Conclusions from AR5 and IPCC Special Reports (SR1.5, SROCC and SRCCL); mitigation potential, costs, and pathways. Building on AR5, the SRCCL reported the global mitigation potential for soil carbon management in croplands to be 1.4–2.3 GtCO2-eq yr –1 (Smith et al. 2014), though the full literature range was 0.3–6.8 GtCO2-eq yr –1 (Sommer and Bossio 2014; Powlson et al. 2014; Dickie et al. 2014b; Henderson et al. 2015; Herrero et al. 2016; Paustian et al. 2016; Zomer et al. 2016; Frank et al. 2017; Conant et al. 2017; Griscom et al. 2017; Hawken 2017; Sanderman et al. 2017; Fuss et al. 2018; Roe et al. 2019). The global mitigation potential for soil organic carbon management in grasslands was assessed to be 1.4–1.8 GtCO2-eq yr –1, with the full literature range being 0.1–2.6 GtCO2-eq yr –1 (Herrero et al. 2013; 2016; Conant et al. 2017; Roe et al. 2019). Lower values in the range represented economic potentials, while higher values represented technical potentials – and uncertainty was expressed by reporting the whole range of estimates. The SR1.5 outlined associated costs reported in literature to range from USD –45 to 100 tCO2–1, describing enhanced soil carbon sequestration as a cost-effective measure (IPCC 2018). Despite significant mitigation potential, there is limited inclusion of soil carbon sequestration as a response option within IAM mitigation pathways (Rogelj et al. 2018a).
Developments since AR5 and IPCC Special Reports (SR1.5, SROCC and SRCCL). No recent literature has been published which conflict with the mitigation potentials reported in the SRCCL. Relevant papers include Lal et al. (2018) which estimated soil carbon sequestration potential to be 0.7–4.1 GtCO2-eq yr –1 for croplands and 1.1–2.9 GtCO2-eq yr –1 for grasslands. Bossio et al. (2020) assessed the contribution of soil carbon sequestration to natural climate solutions and found the potential to be 5.5 GtCO2 yr –1 across all ecosystems, with only small portions of this (0.41 GtCO2-eq yr –1 for cover cropping in croplands; 0.23, 0.15, 0.15 GtCO2-eq yr –1 for avoided grassland conversion, optimal grazing intensity and legumes in pastures, respectively) arising from croplands and grasslands. Regionally, soil carbon management in croplands is feasible anywhere, but effectiveness can be limited in very dry regions (Sanderman et al. 2017). For soil carbon management in grasslands the feasibility is greatest in areas where grasslands have been degraded (e.g., by overgrazing) and soil organic carbon is depleted. For well managed grasslands, soil carbon stocks are already high and the potential for additional carbon storage is low. Roe et al. (2021) estimate the greatest economic (up to USD100 tCO2–1) potential between 2020 and 2050 for croplands to be in Asia and the Pacific (339.7 MtCO2 yr –1) and for grasslands, in Developed Countries (253.6 MtCO2 yr –1).
Critical assessment and conclusion. In conclusion, there is medium confidence that enhanced soil carbon management in croplands has a global technical mitigation potential of 1.9 (0.4–6.8) GtCO2 yr –1, and in grasslands of 1.0 (0.2–2.6) GtCO2 yr –1, of which, 0.6 (04–0.9) and 0.9 (0.3–1.6) GtCO2 yr –1 is estimated to be available at up to USD100 tCO2–1 respectively. Regionally, soil carbon management in croplands and grasslands is feasible anywhere, but effectiveness can be limited in very dry regions, and for grasslands it is greatest in areas where degradation has occurred (e.g., by overgrazing) and soil organic carbon is depleted. Barriers to implementation include regional capacity for monitoring and verification (especially in developing countries), and more widely through concerns over saturation and permanence.
7.4.3.2Biochar
Activities, co-benefits, risks and implementation opportunities and barriers. Biochar is produced by heating organic matter in oxygen-limited environments (pyrolysis and gasification) (Lehmann and Joseph 2012). Feedstocks include forestry and sawmill residues, straw, manure and biosolids. When applied to soils, biochar is estimated to persist from decades to thousands of years, depending on feedstock and production conditions (J. Wang et al. 2016; Singh et al. 2015). Biochar systems producing biochar for soil application plus bioenergy, generally give greater mitigation than bioenergy alone and other uses of biochar, and are recognised as a CDR strategy. Biochar persistence is increased through interaction with clay minerals and soil organic matter (Fang et al. 2015). Additional CDR benefits arise through ‘negative priming’ whereby biochar stabilises soil carbon and rhizodeposits (Weng et al. 2015; J. Wang et al. 2016; Archanjo et al. 2017; Hagemann et al. 2017; Han Weng et al. 2017; Weng et al. 2018). Besides CDR, additional mitigation can arise from displacing fossil fuels with pyrolysis gases, lower soil N2O emissions (Cayuela et al. 2014, 2015; Song et al. 2016; He et al. 2017; Verhoeven et al. 2017; Borchard et al. 2019), reduced nitrogen fertiliser requirements due to reduced nitrogen leaching and volatilisation from soils (Liu et al. 2019; Borchard et al. 2019), and reduced GHG emissions from compost when biochar is added (Agyarko-Mintah et al. 2017; Wu et al. 2017). Biochar application to paddy rice has resulted in substantial reductions (20–40% on average) in N2O (Song et al. 2016; Awad et al. 2018; Liu et al. 2018) (Section 7.4.3.5) and smaller reduction in CH4 emissions (Song et al. 2016; Kammann et al. 2017; Kim et al. 2017a; He et al. 2017; Awad et al. 2018). Potential co-benefits include yield increases particularly in sandy and acidic soils with low cation exchange capacity (Woolf et al. 2016; Jeffery et al. 2017); increased soil water-holding capacity (Omondi et al. 2016), nitrogen use efficiency (Liu et al. 2019; Borchard et al. 2019), biological nitrogen fixation (Van Zwieten et al. 2015); adsorption of organic pollutants and heavy metals (e.g., Silvani et al. 2019); odour reduction from manure handling (e.g., Hwang et al. 2018) and managing forest fuel loads (Puettmann et al. 2020). Due to its dark colour, biochar could decrease soil albedo (Meyer et al. 2012), though this is insignificant under recommended rates and application methods. Biochar could reduce enteric CH4 emissions when fed to ruminants (Section 7.4.3.4). Barriers to upscaling include insufficient investment, limited large-scale production facilities, high production costs at small scale, lack of agreed approach to monitoring, reporting and verification, and limited knowledge, standardisation and quality control, restricting user confidence (Gwenzi et al. 2015).
Conclusions from AR5 and IPCC Special Reports (SR1.5, SROCC and SRCCL); mitigation potential, costs, and pathways. Biochar is discussed as a mitigation option in AR5 and CDR strategy in the SR1.5. Consideration of potential was limited as biochar is not included in IAMs. The SRCCL estimated mitigation potential of 0.03–6.6 GtCO2-eq yr –1 by 2050 based on studies with widely varying assumptions, definitions of potential, and scope of mitigation processes included (SRCCL, Chapters 2 and 4: (Roberts et al. 2010; Pratt and Moran 2010; Hristov et al. 2013; Lee and Day 2013; Dickie et al. 2014a; Hawken 2017; Fuss et al. 2018; Powell and Lenton 2012; Woolf et al. 2010).
Developments since AR5 and IPCC Special Reports (SR1.5, SROCC and SRCCL). Developments include mechanistic understanding of ‘negative priming’ and biochar-soil-microbes-plant interactions (DeCiucies et al. 2018; Fang et al. 2019). Indirect climate benefits are associated with persistent yield response to biochar (Kätterer et al. 2019; Ye et al. 2020), improved crop water use efficiency (Du et al. 2018; Gao et al. 2020) and reduced GHG and ammonia emissions from compost and manure (Sanchez-Monedero et al. 2018; Bora et al. 2020a,b; Zhao et al. 2020). A quantification method based on biochar properties is included in the IPCC guidelines for NGHGIs (Domke et al. 2019). Studies report a range of biochar responses, from positive to occasionally adverse impacts, including on GHG emissions, and identify risks (Tisserant and Cherubini 2019). This illustrates the expected variability (Lehmann and Rillig 2014) of responses, which depend on the biochar type and climatic and edaphic characteristics of the site (Zygourakis 2017). Biochar properties vary with feedstock, production conditions and post-production treatments, so mitigation and agronomic benefits are maximised when biochars are chosen to suit the application context (Mašek et al. 2018). A recent assessment finds greatest economic potential (up to USD100 tCO2–1) between 2020 and 2050 to be in Asia and the Pacific (793 MtCO2 yr –1) followed by Developed Countries (447 MtCO2 yr –1) (Roe et al. 2021). Mitigation through biochar will be greatest where biochar is applied to responsive soils (acidic, low fertility), where soil N2O emissions are high (intensive horticulture, irrigated crops), and where the syngas co-product displaces fossil fuels. Due to the early stage of commercialisation, mitigation estimates are based pilot-scale facilities, leading to uncertainty. However, the long-term persistence of biochar carbon in soils has been widely studied (Singh et al. 2012; Fang et al. 2019; Zimmerman and Ouyang 2019). The greatest uncertainty is the availability of sustainably-sourced biomass for biochar production.
Critical assessment and conclusion. Biochar has significant mitigation potential through CDR and emissions reduction, and can also improve soil properties, enhancing productivity and resilience to climate change (medium agreement , robust evidence). There is medium evidence that biochar has a technical potential of 2.6 (0.2–6.6) GtCO2-eq yr –1, of which 1.1 (0.3–1.8) GtCO2-eq yr –1 is available up to USD100 tCO2–1. However, mitigation and agronomic co-benefits depend strongly on biochar properties and the soil to which biochar is applied (strong agreement , robust evidence). While biochar could provide moderate to large mitigation potential, it is not yet included in IAMs, which has restricted comparison and integration with other CDR strategies.
7.4.3.3Agroforestry
Activities, co-benefits, risks and implementation opportunities and barriers. Agroforestry is a set of diverse land management systems that integrate trees and shrubs with crops and/or livestock in space and/or time. Agroforestry accumulates carbon in woody vegetation and soil (Ramachandran Nair et al. 2010) and offers multiple co-benefits such as increased land productivity, diversified livelihoods, reduced soil erosion, improved water quality, and more hospitable regional climates (Ellison et al. 2017; Kuyah et al. 2019; Mbow et al. 2020; Zhu et al. 2020). Incorporation of trees and shrubs in agricultural systems, however, can affect food production, biodiversity, local hydrology and contribute to social inequality (Amadu et al. 2020; Fleischman et al. 2020; Holl and Brancalion 2020). To minimise risks and maximise co-benefits, agroforestry should be implemented as part of support systems that deliver tools, and information to increase farmers’ agency. This may include reforming policies, strengthening extension systems and creating market opportunities that enable adoption (Jamnadass et al. 2020; Sendzimir et al. 2011; P. Smith et al. 2019 a). Consideration of carbon sequestration in the context of food and fuel production, as well as environmental co-benefits at the farm, local, and regional scales can further help support decisions to plant, regenerate and maintain agroforestry systems (Kumar and Nair 2011; Miller et al. 2020). In spite of the advantages, biophysical and socio-economic factors can limit the adoption (Pattanayak et al. 2003). Contextual factors may include, but are not limited to; water availability, soil fertility, seed and germplasm access, land policies and tenure systems affecting farmer agency, access to credit, and to information regarding the optimum species for a given location.
Conclusions from AR5 and IPCC Special Reports (SR1.5, SROCC and SRCCL); mitigation potential, costs, and pathways. The SRCCL estimated the global technical mitigation potential of agroforestry, with medium confidence, to be between 0.08 and 5.6 GtCO2-eq yr –1 by 2050 (Griscom et al. 2017; Dickie et al. 2014a; Zomer et al. 2016; Hawken 2017). Estimates are derived from syntheses of potential area available for various agroforestry systems, for example, windbreaks, farmer managed natural regeneration, and alley cropping and average annual rates of carbon accumulation. The cost-effective economic potential, also with medium confidence, is more limited at 0.3–2.4 GtCO2-eq yr –1 (Zomer et al. 2016; Griscom et al. 2017; Roe et al. 2019). Despite this potential, agroforestry is currently not considered in integrated assessment models used for mitigation pathways (Section 7.5).
Developments since AR5 and IPCC Special Reports (SR1.5, SROCC and SRCCL). Updated estimates of agroforestry’s technical mitigation potential and synthesised estimates of carbon sequestration across agroforestry systems have since been published. The most recent global analysis estimates technical potential of 9.4 GtCO2-eq yr –1 (Chapman et al. 2020) of agroforestry on 1.87 and 1.89 billion ha of crop and pasture lands below median carbon content, respectively. This estimate is at least 68% greater than the largest estimate reported in the SRCCL (Hawken 2017) and represents a new conservative upper bound as Chapman et al. (2020) only accounted for above-ground carbon. Considering both above- and below-ground carbon of windbreaks, alley cropping and silvopastoral systems at a more limited areal extent (Griscom et al. 2020), the economic potential of agroforestry was estimated to be only about 0.8 GtCO2-eq yr –1. Variation in estimates primarily result from assumptions on the agroforestry systems including, extent of implementation and estimated carbon sequestration potential when converting to agroforestry.
Regional estimates of mitigation potential are scant with agroforestry options differing significantly by geography (Feliciano et al. 2018). For example, multi-strata shaded coffee and cacao are successful in the humid tropics (Somarriba et al. 2013; Blaser et al. 2018), silvopastoral systems are prevalent in Latin American (Peters et al. 2013; Landholm et al. 2019) while agrosilvopastoral systems, shelterbelts, hedgerows, and windbreaks are common in Europe (Joffre et al. 1988; Rigueiro-Rodriguez 2009). At the field scale, agroforestry accumulates between 0.59 and 6.24 t ha –1 yr –1 of carbon above-ground. Below-ground carbon often constitutes 25% or more of the potential carbon gains in agroforestry systems (De Stefano and Jacobson 2018; Cardinael et al. 2018). Roe et al. (2021) estimate greatest regional economic (up to USD100 tCO2–1) mitigation potential for the period 2020–2050 to be in Asia and the Pacific (368.4 MtCO2-eq yr –1) and Developed Countries (264.7 MtCO2-eq yr –1).
Recent research has also highlighted co-benefits and more precisely identified implementation barriers. In addition to aforementioned co-benefits, evidence now shows that agroforestry can improve soil health, regarding infiltration and structural stability (Muchane et al. 2020); reduces ambient temperatures and crop heat stress (Arenas-Corraliza et al. 2018; Sida et al. 2018); increases groundwater recharge in drylands when managed at moderate density (Ilstedt et al. 2016; Bargués-Tobella et al. 2020); positively influences human health (Rosenstock et al. 2019); and can improve dietary diversity (McMullin et al. 2019). Along with previously mentioned barriers, low social capital, assets, and labour availability have been identified as pertinent to adoption. Practically all barriers are interdependent and subject to the context of implementation.
Critical assessment and conclusion. There is medium confidence that agroforestry has a technical potential of 4.1 (0.3–9.4) GtCO2-eq yr –1 for the period 2020–2050, of which 0.8 (0.4–1.1) GtCO2-eq yr –1 is available at USD100 tCO2–1. Despite uncertainty around global estimates due to regional preferences for management systems, suitable land availability, and growing conditions, there is high confidence in agroforestry’s mitigation potential at the field scale. With countless options for farmers and land managers to implement agroforestry, there is medium confidence in the feasibility of achieving estimated regional mitigation potential. Appropriately matching agroforestry options, to local biophysical and social contexts is important in maximising mitigation and co-benefits, while avoiding risks (Sinclair and Coe 2019).
Box 7.3 | Case Study: Agroforestry in Brazil – CANOPIES
Summary
Brazilian farmers are integrating trees into their croplands in various ways, ranging from simple to highly complex agroforestry systems. While complex systems are more effective in the mitigation of climate change, trade-offs with scalability need to be resolved for agroforestry systems to deliver on their potential. The Brazilian-Dutch CANOPIES project (Janssen 2020) is exploring transition pathways to agroforestry systems optimised for local ecological and socio-economic conditions.
Background
The climate change mitigation potential of agroforestry systems is widely recognised (Zomer et al. 2016; FAO 2017b) and Brazilian farmers and researchers are pioneering diverse ways of integrating trees into croplands, from planting rows of eucalyptus trees in pastures up to highly complex agroforests consisting of >30 crop and tree species. The degree of complexity influences the multiple functions that farmers and societies can attain from agroforestry: the more complex it is, the more it resembles a natural forest with associated benefits for its carbon storage capacity and its habitat quality for biodiversity (Santos et al. 2019). However, trade-offs exist between the complexity and scalability of agroforestry as complex systems rely on intensive manual labour to achieve high productivity (Tscharntke et al. 2011). To date, mechanisation of structurally diverse agroforests is scarce and hence, efficiencies of scale are difficult to achieve.
Case description
These synergies and trade-offs between complexity, multifunctionality and scalability are studied in the CANOPIES (Co-existence of Agriculture and Nature: Optimisation and Planning of Integrated Ecosystem Services) project, a collaboration between Wageningen University (NL), the University of São Paulo and EMBRAPA (both Brazil). Soil and management data are collected on farms of varying complexity to evaluate carbon sequestration and other ecosystem services, economic performance and labour demands.
Interactionsand limitations
The trade-off between complexity and labour demand is less pronounced in EMBRAPA’s integrated crop-livestock-forestry (ICLF) systems, where grains and pasture are planted between widely spaced tree rows. Here, barriers for implementation relate mostly to livestock and grain farmers’ lack of knowledge on forestry management and financing mechanisms 5 (Gil et al. 2015). Additionally, linking these financing mechanisms to carbon sequestration remains a Monitoring, Reporting and Verification challenge (Smith et al. 2020b).
Box 7.3
Lessons
Successful examples of how more complex agroforestry can be upscaled do exist in Brazil. For example, on farm trials and consistent investments over several years have enabled Rizoma Agro to develop a citrus production system that integrates commercial and native trees in a large-scale multi-layered agroforestry system. The success of their transition resulted in part from their corporate structure that allowed them to tap into the certified Green Bonds market (CBI 2020). However, different transition strategies need to be developed for family farmers and their distinct socio-economic conditions.
7.4.3.4Enteric Fermentation
Activities, co-benefits, risks and implementation opportunities and barriers. Mitigating CH4 emissions from enteric fermentation can be direct (i.e., targeting ruminal methanogenesis and emissions per animal or unit of feed consumed) or indirect, by increasing production efficiency (i.e., reducing emission intensity per unit of product). Measures can be classified as those relating to (i) feeding, (ii) supplements, additives and vaccines, and (iii) livestock breeding and wider husbandry (Jia et al. 2019). Co-benefits include enhanced climate change adaptation and increased food security associated with improved livestock breeding (Smith et al. 2014). Risks include mitigation persistence, ecological impacts associated with improving feed quality and supply, or potential toxicity and animal welfare issues concerning feed additives. Implementation barriers include feeding/administration constraints, the stage of development of measures, legal restrictions on emerging technologies and negative impacts, such as the previously described risks (Smith et al. 2014; Jia et al. 2019; P. Smith et al. 2019 a).
Conclusions from AR5 and IPCC Special Reports (SR1.5, SROCC and SRCCL); mitigation potential, costs, and pathways. The AR5 indicated medium (5–15%) technical mitigation potential from both feeding and breeding related measures (Smith et al. 2014). More recently, the SRCCL estimated with medium confidence, a global potential of 0.12–1.18 GtCO2-eq yr –1 between 2020 and 2050, with the range reflecting technical, economic and sustainability constraints (SRCCL, Chapter 2: Hristov et al. 2013; Dickie et al. 2014a; Herrero et al. 2016; Griscom et al. 2017). The underlying literature used a mixture of IPCC GWP100 values for CH4, preventing conversion of CO2-eq to CH4. Improved livestock feeding and breeding were included in IAM emission pathway scenarios within the SRCCL and SR1.5, although it was suggested that the full mitigation potential of enteric CH4 measures is not captured in current models (Rogelj et al. 2018b; IPCC 2018).
Developments since AR5 and IPCC Special Reports (SR1.5, SROCC and SRCCL). Recent reviews generally identify the same measures as those outlined in the SRCCL, with the addition of early life manipulation of the ruminal biome (Grossi et al. 2019; Eckard and Clark 2020; Thompson and Rowntree 2020; Beauchemin et al. 2020; Ku-Vera et al. 2020; Honan et al. 2021). There is robust evidence and high agreement that chemically synthesised inhibitors are promising emerging near-term measures (Patra 2016; Jayanegara et al. 2018; Van Wesemael et al. 2019; Beauchemin et al. 2020) with high (e.g., 16–70% depending on study) mitigation potential reported (e.g., Hristov et al. 2015; McGinn et al. 2019; Melgar et al. 2020) and commercial availability expected within two years in some countries (Reisinger et al. 2021). However, their mitigation persistence (McGinn et al. 2019), cost (Carroll and Daigneault 2019; Alvarez-Hess et al. 2019) and public acceptance (Jayasundara et al. 2016) or regulatory approval is currently unclear while administration in pasture-based systems is likely to be challenging (Patra et al. 2017; Leahy et al. 2019). Research into other inhibitors/feeds containing inhibitory compounds, such as macroalga or seaweed (Chagas et al. 2019; Kinley et al. 2020; Roque et al. 2019), shows promise, although concerns have been raised regarding palatability, toxicity, environmental impacts and the development of industrial-scale supply chains (Abbott et al. 2020; Vijn et al. 2020). In the absence of CH4 vaccines, which are still under development (Reisinger et al. 2021) pasture-based and non-intensive systems remain reliant on increasing production efficiency (Beauchemin et al. 2020). Breeding of low emitting animals may play an important role and is a subject under ongoing research (Pickering et al. 2015; Jonker et al. 2018; López-Paredes et al. 2020).
Approaches differ regionally, with more focus on direct, technical options in Developed Countries, and improved efficiency in developing countries (Caro Torres et al. 2016; Mottet et al. 2017b; MacLeod et al. 2018; Frank et al. 2018). A recent assessment finds greatest economic (up to USD100 tCO2-eq –1) potential (using the IPCC AR4 GWP100 value for CH4) for 2020–2050 in Asia and the Pacific (32.9 MtCO2-eq yr –1) followed by Developed Countries (25.5 MtCO2-eq yr –1) (Roe et al. 2021). Despite numerous country and sub-sector specific studies, most of which include cost analysis (Hasegawa and Matsuoka 2012; Hoa et al. 2014; Jilani et al. 2015; Eory et al. 2015; Pradhan et al. 2017; Pellerin et al. 2017; Ericksen and Crane 2018; Habib and Khan 2018; Kashangaki and Ericksen 2018; Salmon et al. 2018; Brandt et al. 2019b; Kiggundu et al. 2019; Kavanagh et al. 2019; Mosnier et al. 2019; Pradhan et al. 2019; Sapkota et al. 2019; Carroll and Daigneault 2019; Leahy et al. 2019; Dioha and Kumar 2020), sectoral assessment of regional technical and notably economic (Beach et al. 2015; USEPA 2019) potential is restricted by lack comprehensive and comparable data. Therefore, verification of regional estimates indicated by global assessments is challenging. Feed quality improvement, which may have considerable potential in developing countries (Caro et al. 2016; Mottet et al. 2017a), may have negative wider impacts. For example, potential land-use change and greater emissions associated with production of concentrates (Brandt et al. 2019b).
Critical review and conclusion. Based on studies to date, using a range of IPCC GWP100 values for CH4, there is medium confidence that activities to reduce enteric CH4 emissions have a global technical potential of 0.8 (0.2–1.2) GtCO2-eq yr –1, of which 0.2 (0.1–0.3) GtCO2-eq yr –1 is available up to USD100 tCO2-eq –1 (Figure 7.11). The CO2-eq value may also slightly differ if the GWP100 IPCC AR6 CH4 value was uniformly applied within calculations. Lack of comparable country and sub-sector studies to assess the context applicability of measures, associated costs and realistic adoption likelihood, prevents verification of estimates.
7.4.3.5Improve Rice Management
Activities, co-benefits, risks and implementation opportunities and barriers. Emissions from rice cultivation mainly concern CH4 associated with anaerobic conditions, although N2O emission also occur via nitrification and denitrification processes. Measures to reduce CH4 and N2O emissions include (i) improved water management (e.g., single drainage and multiple drainage practices), (ii) improved residue management, (iii) improved fertiliser application (e.g., using slow release fertiliser and nutrient specific application), and (iv) soil amendments (including biochar and organic amendments) (Pandey et al. 2014; Kim et al. 2017b; Yagi et al. 2020; Sriphirom et al. 2020). These measures not only have mitigation potential but can improve water use efficiency, reduce overall water use, enhance drought adaptation and overall system resilience, improve yield, reduce production costs from seed, pesticide, pumping and labour, increase farm income, and promote sustainable development (Quynh and Sander 2015; Yamaguchi et al. 2017; Tran et al. 2018; Sriphirom et al. 2019). However, in terms of mitigation of CH4 and N2O, antagonistic effects can occur, whereby water management can enhance N2O emissions due to creation of alternate wet and dry conditions (Sriphirom et al. 2019), with trade-offs between CH4 and N2O during the drying period potentially offsetting some mitigation benefits. Barriers to adoption may include site-specific limitations regarding soil type, percolation and seepage rates or fluctuations in precipitation, water canal or irrigation infrastructure, paddy surface level and rice field size, and social factors including farmer perceptions, pump ownership, and challenges in synchronising water management between neighbours and pumping stations (Quynh and Sander 2015; Yamaguchi et al. 2017; Yamaguchi et al. 2019).
Conclusions from AR5 and IPCC Special Reports (SR1.5, SROCC and SRCCL); mitigation potential, costs, and pathways. The AR5 outlined emissions from rice cultivation of 0.49–0.723 GtCO2-eq yr –1 in 2010 with an average annual growth of 0.4% yr –1. The SRCCL estimated a global mitigation potential from improved rice cultivation of 0.08–0.87 GtCO2-eq yr –1 between 2020 and 2050, with the range representing the difference between technical and economic constraints, types of activities included (e.g., improved water management and straw residue management) and GHGs considered (Dickie et al. 2014a; Beach et al. 2015; Paustian et al. 2016; Griscom et al. 2017; Hawken 2017) (SRCCL, Chapter 2).
Developments since AR5 and IPCC Special Reports (SR1.5, SROCC and SRCCL). Since AR5 and the SRCCL, studies on mitigation have principally focused on water and nutrient management practices with the aim of improving overall sustainability as well as measurements of site-specific emissions to help improve the resolution of regional estimates. Intensity of emissions show considerable spatial and temporal variation, dependent on site specific factors including degradation of soil organic matter, management of water levels in the field, the types and amount of fertilisers applied, rice variety and local cultivation practices. Variation in CH4 emissions have been found to range from 0.5–41.8 mg m 2 hr –1 in South-East Asia (Sander et al. 2014; Chidthaisong et al. 2018; Setyanto et al. 2018; Sibayan et al. 2018; J. Wang et al. 2018; Maneepitak et al. 2019), 0.5–37.0 mg m 2 hr –1 in Southern and Eastern Asia (Zhang et al. 2010; Wang et al. 2012; Oo et al. 2018; J. Wang et al. 2018; Takakai et al. 2020), and 0.5–10.4 mg m 2 hr –1 in North America (J. Wang et al. 2018). Current studies on emissions of N2O also showed high variation in the range of 0.13–654 ug/m 2/hr (Akiyama et al. 2005; Islam et al. 2018; Kritee et al. 2018; Zschornack et al. 2018; Oo et al. 2018).
Recent studies on water management have highlighted the potential to mitigate GHG emissions, while also enhancing water use efficiency (Tran et al. 2018). A meta-analysis on multiple drainage systems found that Alternative Wetting and Drying (AWD) with irrigation management, can reduce CH4 emissions by 20–30% and water use by 25.7%, though this resulted in a slight yield reduction (5.4%) (Carrijo et al. 2017). Other studies have described improved yields associated with AWD (Tran et al. 2018). Water management for both single and multiple drainage can (most likely ) reduce methane emissions by about 35% but increase N2O emissions by about 20% (Yagi et al. 2020). However, N2O emissions occur only under dry conditions, therefore total reduction in terms of net GWP is approximately 30%. Emissions of N2O are higher during dry seasons (Yagi et al. 2020) and depend on site specific factors as well as the quantity of fertiliser and organic matter inputs into the paddy rice system. Variability of N2O emissions from single and multiple drainage can range from 0.06–33 kg/ha (Hussain et al. 2015; Kritee et al. 2018). AWD in Vietnam was found to reduce both CH4 and N2O emissions by 29–30 and 26–27% respectively with the combination of net GWP about 30% as compared to continuous flooding (Tran et al. 2018). Overall, greatest average economic mitigation potential (up to USD100 tCO2-eq –1) between 2020 and 2050 is estimated to be in Asia and the Pacific (147.2 MtCO2-eq yr –1) followed by Latin America and the Caribbean (8.9 MtCO2-eq yr –1) using the IPCC AR4 GWP100 value for CH4 (Roe et al. 2021).
Critical assessment and conclusion. There is medium confidence that improved rice management has a technical potential of 0.3 (0.1–0.8) GtCO2-eq yr –1 between 2020 and 2050, of which 0.2 (0.05–0.3) GtCO2-eq yr –1 is available up to USD100 tCO2-eq –1 (Figure 7.11). Improving rice cultivation practices will not only reduce GHG emissions, but also improve production sustainability in terms of resource utilisation including water consumption and fertiliser application. However, emission reductions show high variability and are dependent on site specific conditions and cultivation practices.
7.4.3.6Crop Nutrient Management
Activities, co-benefits, risks and implementation opportunities and barriers. Improved crop nutrient management can reduce N2O emissions from cropland soils. Practices include optimising fertiliser application delivery, rates and timing, utilising different fertiliser types (i.e., organic manures, composts and synthetic forms), and using slow or controlled-released fertilisers or nitrification inhibitors (Smith et al. 2014; Griscom et al. 2017; P. Smith et al. 2019 a). In addition to individual practices, integrated nutrient management that combines crop rotations including intercropping, nitrogen biological fixation, reduced tillage, use of cover crops, manure and bio-fertiliser application, soil testing and comprehensive nitrogen management plans, is suggested as central for optimising fertiliser use, enhancing nutrient uptake and potentially reducing N2O emissions (Bationo et al. 2012; Lal et al. 2018; Bolinder et al. 2020; Jensen et al. 2020; Namatsheve et al. 2020). Such practices may generate additional mitigation by indirectly reducing synthetic fertiliser manufacturing requirements and associated emissions, though such mitigation is accounted for in the Industry Sector and not considered in this chapter. Tailored nutrient management approaches, such as 4R nutrient stewardship, are implemented in contrasting farming systems and contexts and supported by best management practices to balance and match nutrient supply with crop requirements, provide greater stability in fertiliser performance and to minimise N2O emissions and nutrient losses from fields and farms (Fixen 2020; Maaz et al. 2021). Co-benefits of improved nutrient management can include enhanced soil quality (notably when manure, crop residues or compost is utilised), carbon sequestration in soils and biomass, soil water holding capacity, adaptation capacity, crop yields, farm incomes, water quality (from reduced nitrate leaching and eutrophication), air quality (from reduced ammonia emissions) and in certain cases, it may facilitate land sparing (Sapkota et al. 2014; Johnston and Bruulsema 2014; Zhang et al. 2017; P. Smith et al. 2019 a; Mbow et al. 2019).
A potential risk under certain circumstances, is yield reduction, while implementation of practices should consider current soil nutrient status. There are significant regional imbalances, with some regions experiencing nutrient surpluses from over fertilisation and others, nutrient shortages and chronic deficiencies (FAO 2021e). Additionally, depending on context, practices may be inaccessible, expensive or require expertise to implement (Hedley 2015; Benson and Mogues 2018) while impacts of climate change may influence nutrient use efficiency (Amouzou et al. 2019) and therefore, mitigation potential.
Conclusions from AR5 and IPCC Special Reports (SR1.5, SROCC and SRCCL); mitigation potential, costs, and pathways. The SRCCL broadly identified the same practices as outlined in AR5 and estimated that improved cropland nutrient management could mitigate between 0.03 and 0.71 GtCO2-eq yr –1 between 2020 and 2050 (SRCCL Chapter 2) (Dickie et al. 2014a; Beach et al. 2015; Paustian et al. 2016; Griscom et al. 2017; Hawken 2017).
Developments since AR5 and IPCC Special Reports (SR1.5, SROCC and SRCCL). Research since the SRCCL highlights the mitigation potential and co-benefits of adopting improved nutrient management strategies, notably precision fertiliser application methods and nutrient expert systems, and applicability in both large-scale mechanised and small-scale systems (USEPA 2019; Hijbeek et al. 2019; Griscom et al. 2020; Tian et al. 2020; Aryal et al. 2020; Sapkota et al. 2021). Improved crop nutrient management is feasible in all regions, but effectiveness is context dependent. Sub-Saharan Africa has one of the lowest global fertiliser consumption rates, with increased fertiliser use suggested as necessary to meet projected future food requirements (Mueller et al. 2012; ten Berge et al. 2019; Adam et al. 2020; Falconnier et al. 2020). Fertiliser use in Developed Countries is already high (Figure 7.10) with increased nutrient use efficiency among the most promising mitigation measures (Roe et al. 2019; Hijbeek et al. 2019). Considering that Asia and Pacific, and Developed Countries accounted for the greatest share of global nitrogen fertiliser use, it is not surprising that these regions are estimated to have greatest economic mitigation potential (up to USD100 tCO2-eq –1) between 2020 and 2050, at 161.8 and 37.1 MtCO2-eq yr –1 respectively (using the IPCC AR4 GWP100 value for N2O) (Roe et al. 2021).
Critical assessment and conclusion. There is medium confidence that crop nutrient management has a technical potential of 0.3 (0.06–0.7) GtCO2-eq yr –1 of which 0.2 (0.05–0.6) GtCO2-eq yr –1 is available up to USD100 tCO2-eq –1. This value is based on GWP100 using a mixture of IPCC values for N2O and may slightly differ if calculated using AR6 values. The development of national roadmaps for sustainable fertiliser (nutrient) management can help in scaling-up related practices and in realising this potential. Crop nutrient management measures can contribute not only to mitigation, but food and nutrition security and wider environmental sustainability goals.
Box 7.4 | Case Study: The Climate-smart Village Approach
Summary
The climate-smart villages (CSV) approach aims to generate local knowledge, with the involvement of farmers, researchers, practitioners, and governments, on climate change adaptation and mitigation while improving productivity, food security, and farmers’ livelihoods (Aggarwal et al. 2018). This knowledge feeds a global network that includes 36 climate-smart villages in South and South-East Asia, West and East Africa, and Latin America.
Background
It is expected that agricultural production systems across the world will change in response to climate change, posing significant challenges to the livelihoods and food security of millions of people (Kennedy et al. 2014). Maintaining agricultural growth while minimising climate shocks is crucial to building a resilient food production system and meeting sustainable development goals in vulnerable countries.
Case description
The CSV approach seeks an integrated vision so that sustainable rural development is the final goal for rural communities. At the same time, it fosters the understanding of climate change with the implementation of adaptation and mitigation actions, as much as possible. Rural communities and local stakeholders are the leaders of this process, where scientists facilitate their knowledge to be useful for the communities and learn at the same time about challenges but also the capacity those communities have built through time. The portfolio includes weather-smart activities, water-smart practices, seed/breed smart, carbon-/nutrient-smart practices, and institutional-/market-smart activities.
Interactionsand limitations
The integration of technologies and services that are suitable for the local conditions resulted in many gains for food security and adaptation and for mitigation where appropriate. It was also shown that, in all regions, there is considerable yield advantage when a portfolio of technologies is used, rather than the isolated use of technologies (Govaerts et al. 2005; Zougmoré et al. 2014). Moreover, farmers are using research results to promote their products as climate-smart leading to increases in their income (Acosta-Alba et al. 2019). However, climatic risk sites and socio-economic conditions together with a lack of resource availability are key issues constraining agriculture across all five regions.
Lessons
i. Understanding the priorities, context, challenges, capacity, and characteristics of the territory and the communities regarding climate, as well as the environmental and socio-economic dimensions, is the first step. Then, understanding climate vulnerability in their agricultural systems based on scientific data but also listening to their experience will set the pathway to identify climate-smart agriculture (CSA) options (practices and technologies) to reduce such vulnerability.
ii. Building capacity is also a critical element of the CSV approach, rural families learn about the practices and technologies in a neighbour’s house, and as part of the process, families commit to sharing their knowledge with other families, to start a scaling-out process within the communities. Understanding the relationship between climate and their crop is key, as well as the use of weather forecasts to plan their agricultural activities.
The assessment of the implementation of the CSA options should be done together with community leaders to understand changes in livelihoods and climate vulnerability. Also, knowledge appropriation by community leaders has led to farmer-to-farmer knowledge exchange within and outside the community (Ortega Fernandez and Martínez-Barón 2018).
7.4.3.7Manure Management
Activities, co-benefits, risks and implementation opportunities and barriers. Manure management measures aim to mitigate CH4 and N2O emissions from manure storage and deposition. Mitigation of N2O considers both direct and indirect (i.e., conversion of ammonia and nitrate to N2O) sources. According to the SRCCL, measures may include (i) anaerobic digestion, (ii) applying nitrification or urease inhibitors to stored manure or urine patches, (iii) composting, (iv) improved storage and application practices, (v) grazing practices and (vi) alteration of livestock diets to reduce nitrogen excretion (Mbow et al. 2019; Jia et al. 2019). Implementation of manure management with other livestock and soil management measures can enhance system resilience, sustainability, food security and help prevent land degradation (Smith et al. 2014; Mbow et al. 2019; P. Smith et al. 2019 a), while potentially benefiting the localised environment, for example, regarding water quality (Di and Cameron 2016). Risks include increased N2O emission from the application of manure to poorly drained or wet soils, trade-offs between N2O and ammonia emissions and potential eco-toxicity associated with some measures.
Conclusions from AR5 and IPCC Special Reports (SR1.5, SROCC and SRCCL); mitigation potential, costs, and pathways. The AR5 reported manure measures to have high (>10%) mitigation potential. The SRCCL estimated a technical global mitigation potential between 2020 and 2050 of 0.01–0.26 GtCO2-eq yr –1, with the range depending on economic and sustainable capacity (Dickie et al. 2014a; Herrero et al. 2016) (SRCCL, Chapter 2). Conversion of estimates to native units is restricted as a mixture of GWP100 values was used in underlying studies. Measures considered were typically more suited to confined production systems (Jia et al. 2019; Mbow et al. 2019), while improved manure management is included within IAM emission pathways (Rogelj et al. 2018b).
Developments since AR5 and IPCC Special Reports (SR1.5, SROCC and SRCCL). Research published since SRCCL broadly focuses on measures relevant to intensive or confined systems (e.g., (Hunt et al. 2019; Kavanagh et al. 2019; Sokolov et al. 2020; Im et al. 2020; Adghim et al. 2020; Mostafa et al. 2020), highlighting co-benefits and risks. For example, measures may enhance nutrient recovery, fertiliser value (Sefeedpari et al. 2019; Ba et al. 2020; Yao et al. 2020) and secondary processes such as biogas production (Shin et al. 2019). However, the potential antagonistic relationship between GHG and ammonia mitigation and need for appropriate management is emphasised (Aguirre-Villegas et al. 2019; Grossi et al. 2019; Kupper et al. 2020; Ba et al. 2020). In some circumstances, fugitive emissions may reduce the potential mitigation benefits of biogas production (Scheutz and Fredenslund 2019; Bakkaloglu et al. 2021), while high implementation cost is identified as an adoption barrier, notably of anaerobic digestion (Liu and Liu 2018; Niles and Wiltshire 2019; Ndambi et al. 2019; Ackrill and Abdo 2020; Adghim et al. 2020). Nitrification inhibitors have been found to be effective at reducing N2O emissions from pasture deposited urine (López-Aizpún et al. 2020), although the use of nitrification inhibitors is restricted in some jurisdictions due to concerns regarding residues in food products (Di and Cameron 2016; Eckard and Clark 2020) while limited evidence suggests eco-toxicity risk under certain circumstances (Kösler et al. 2019). Some forage crops may naturally contain inhibitory substances (Simon et al. 2019, 2020; de Klein et al. 2020), though this warrants further research (Podolyan et al. 2020; Gardiner et al. 2020).
Country specific studies provide insight into regionally applicable measures, with emphasis on small-scale anaerobic digestion (e.g., dome digesters), solid manure coverage and daily manure spreading in Asia and the Pacific, and Africa (Hasegawa and Matsuoka 2012; Hoa et al. 2014; Jilani et al. 2015; Hasegawa et al. 2016; Pradhan et al. 2017; Ericksen and Crane 2018; Pradhan et al. 2019; Kiggundu et al. 2019; Dioha and Kumar 2020). Tank/lagoon covers, large-scale anaerobic digestion, improved application timing, nitrogen inhibitor application to urine patches, soil-liquid separation, reduced livestock nitrogen intake, trailing shoe, band or injection slurry spreading and acidification are emphasised in Developed Countries (Kaparaju and Rintala 2011; Eory et al. 2015; Pape et al. 2016; Jayasundara et al. 2016; Pellerin et al. 2017; Liu and Liu 2018; Lanigan et al. 2018; Carroll and Daigneault 2019; Eckard and Clark 2020). Using IPCC AR4 GWP100 values for CH4 and N2O, a recent assessment finds 69% (63.4 MtCO2-eq yr –1) of economic potential (up to USD100 tCO2-eq –1) between 2020–2050, to be in Developed Countries (Roe et al. 2021).
Critical assessment and conclusion. There is medium confidence that manure management measures have a global technical potential of 0.3 (0.1–0.5) GtCO2-eq yr –1, (using a range of IPCC GWP100 values for CH4 and N2O), of which 0.1 (0.09–0.1) GtCO2-eq yr –1 is available at up to USD100 tCO2-eq –1 (Figure 7.11). As with other non-CO2GHG mitigation estimates, values may slightly differ depending upon which IPCC GWP100 values were used. There is robust evidence and high agreement that there are measures that can be applied in all regions, but greatest mitigation potential is estimated in Developed Countries in more intensive and confined production systems.
Box 7.5 | Farming System Approachesand Mitigation
Introduction
There is robust evidence and high agreement that agriculture needs to change to facilitate environment conservation while maintaining and where appropriate, increase overall production. The SRCCL identified several farming system approaches, deemed alternative to conventional systems (Olsson et al. 2019; Mbow et al. 2019; L.G. Smith et al. 2019). These may incorporate several of the mitigation measures described in Section 7.4.3, while potentially also delivering environmental co-benefits. This Box assesses evidence specifically on the mitigation capacity of some such system approaches. The approaches are not mutually exclusive, may share similar principles or practices and can be complimentary. In all cases, mitigation may result from either (i) emission reductions or (ii) enhanced carbon sequestration, via combinations of management practices as outlined in Figure 1 within this Box. The approaches will have pros and cons concerning multiple factors, including mitigation, yield and co-benefits, with trade-offs subject to the diverse contexts and ways in which they are implemented.

Box 7.5, Figure 1 | Potential mitigation mechanisms and associated management practices. N = nitrogen, SOM = soil organic matter, LUC = land-use change. aThe farming system approaches outlined are not necessarily mutually exclusive. bOnly agricultural emissions are considered. Mitigation may also result from reduced production of fertilisers and agrochemicals. cReduced emissions intensity per unit of milk/meat will only result in a reduction in absolute emissions where increased productivity facilitates a reduction in animal numbers. 1 = Altieri et al. 2015; 2 = Altieri and Nicholls 2017; 3 = Powlson et al. 2016; 4 = Corbeels et al. 2019; 5 = Lal 2015; 6 = Gonzalez-Sanchez et al. 2019; 7 = Thierfelder et al. 2017; 8 = Hendrickson et al. 2008; 9 = Weindl et al. 2015; 10 = Thornton and Herrero 2015; 11 = Lal al. 2020; 12 = Scialabba and Müller–Lindenlauf 2010; 13 = Goh 2011; 14 = IFOAM 2016.
Is there evidence that these approaches deliver mitigation?
Agroecology (AE) including Regenerative Agriculture (RA)
There is limited discussion on the mitigation potential of AE (Gliessman 2013; Altieri and Nicholls 2017), but robust evidence that AE can improve system resilience and bring multiple co-benefits (Altieri et al. 2015; Mbow et al. 2019; Aguilera et al. 2020; Tittonell 2020; Wanger et al. 2020) (AR6 WGII Box 5.10). Limited evidence concerning the mitigation capacity of AE at a system level (Saj et al. 2017; Snapp et al. 2021) makes conclusions difficult, yet studies into specific practices that may be incorporated, suggest AE may have mitigation potential (medium confidence) (Section 7.4.3). However, AE, that incorporates management practices used in organic farming (see below), may result in reduced yields, driving compensatory agricultural production elsewhere. Research into GHG mitigation by AE as a system and impacts of wide-scale implementation is required. Despite absence of a universally accepted definition (see Annex I), RA is gaining increasing attention and shares principles of AE. Some descriptions include carbon sequestration as a specific aim (Elevitch et al. 2018). Few studies have assessed mitigation potential of RA at a system level (e.g., Colley et al. 2020). Like AE, it is likely that RA can contribute to mitigation, the extent to which is currently unclear and by its case-specific design, will vary (medium confidence).
Conservation agriculture (CA)
The SRCCL noted both positive and inconclusive results regarding CA and soil carbon, with sustained sequestration dependent on productivity and residue returns (Jia et al. 2019; Mirzabaev et al. 2019; Mbow et al. 2019). Recent research is in broad agreement (Ogle et al. 2019; Corbeels et al. 2020, 2019; Gonzalez-Sanchez et al. 2019; Munkholm et al. 2020) with greatest mitigation potential suggested in dry regions (Sun et al. 2020). Theoretically, CA may facilitate improved nitrogen use efficiency (limited evidence) (Lal 2015; Powlson et al. 2016), though CA appears to have mixed effects on soil N2O emission (Six et al. 2004; Mei et al. 2018). CA is noted for its adaptation benefits, with wide agreement that CA can enhance system resilience to climate related stress, notably in dry regions. There is evidence that CA can contribute to mitigation, but its contribution is depended on multiple factors including climate and residue returns (high confidence).
Integrated production systems (IPS)
The integration of different enterprises in space and time (e.g., diversified cropping, crop and livestock production, agroforestry), therefore facilitating interaction and transfer of recourses between systems, is suggested to enhance sustainability and adaptive capacity (Hendrickson et al. 2008; Franzluebbers et al. 2014; Lemaire et al. 2014; Weindl et al. 2015; Gil et al. 2017; Olsson et al. 2019; Peterson et al. 2020; Walkup et al. 2020; Garrett et al. 2020). Research indicates some mitigation potential, including by facilitating sustainable intensification (Box 7.11), though benefits are likely to be highly context specific (Herrero et al. 2013; Carvalho et al. 2014; Piva et al. 2014; de Figueiredo et al. 2017; Rosenstock et al. 2014; Weindl et al. 2015; Thornton and Herrero 2015; Descheemaeker et al. 2016; Lal 2020; Guenet et al. 2021). The other systems outlined within this Box may form or facilitate IPS.
Organic farming (OF)
OF can be considered a form of AE (Lampkin et al. 2017) though it is discussed separately here as it is guided by specific principles and associated regulations (Annex I). OF is perhaps noted more for potential co-benefits, such as enhanced system resilience and biodiversity promotion, than mitigation. Several studies have reviewed the emissions footprint of organic compared to conventional systems (Mondelaers et al. 2009; Tuomisto et al. 2012; Skinner et al. 2014; Meier et al. 2015; Seufert and Ramankutty 2017; Clark and Tilman 2017; Meemken and Qaim 2018; Bellassen et al. 2021). Acknowledging potential assessment limitations (Meier et al. 2015; van der Werf et al. 2020), evidence suggests organic production to typically generate lower emissions per unit of area, while emissions per unit of product vary and depend on the product ( high agreement , medium evidence). OF has been suggested to increase soil carbon sequestration (Gattinger et al. 2012), though definitive conclusions are challenging (Leifeld et al. 2013). Fewer studies consider impacts of large-scale conversion from conventional to organic production globally. Though context specific (Seufert and Ramankutty 2017), OF is reported to typically generate lower yields (Seufert et al. 2012; De Ponti et al. 2012; Kirchmann 2019; Biernat et al. 2020). Large-scale conversion, without fundamental changes in food systems and diets (Muller et al. 2017; Theurl et al. 2020), may lead to increases in absolute emissions from land-use change, driven by greater land requirements to maintain production (L.G. Smith et al. 2019; Leifeld 2016; Meemken and Qaim 2018).
Box 7.6 | Case Study: Mitigation Options and Costs in the Indian Agricultural Sector
Objective
To assess the technical mitigation potentials of Indian agriculture and costs under a business as usual scenario (BAU) and Mitigation scenario up to 2030 (Sapkota et al. 2019).
Results
The study shows that by 2030 under BAU scenario GHG emissions from the agricultural sector in India would be 515 MtCO2-eq yr –1 (using GWP100 and IPCC AR4 values) with a technical mitigation potential of 85.5 MtCO2-eq yr –1 through the adoption of various mitigation practices. About 80% of the technical mitigation potential could be achieved by adopting cost-saving measures. Three mitigation options, for example, efficient use of fertiliser, zero-tillage, and rice-water management, could deliver more than 50% of the total technical abatement potential. Under the BAU scenario the projected GHG emissions from major crop and livestock species is estimated at 489 MtCO2-eq in 2030, whereas under mitigation scenario GHG emissions are estimated at 410 MtCO2-eq implying a technical mitigation option of about 78.67 MtCO2-eq yr –1 (Box 7.6, Figure 1). Major sources of projected emissions under the BAU scenario, in order of importance, were cattle, rice, buffalo, and small ruminants. Although livestock production and rice cultivation account for a major share of agricultural emissions, the highest mitigation potential was observed in rice (about 36 MtCO2-eq yr –1) followed by buffalo (about 14 MtCO2-eq yr –1), wheat (about 11 MtCO2-eq yr –1) and cattle (about 7 MtCO2-eq yr –1). Crops such as cotton and sugarcane each offered mitigation potential of about 5 MtCO2-eq yr –1 while the mitigation potential from small ruminants (goat/sheep) was about 2 MtCO2-eq yr –1.
Sapkota et al. (2019) also estimated the magnitude of GHG savings per year through adoption of various mitigation measures, together with the total cost and net cost per unit of CO2-eq abated. When the additional benefits of increased yield due to adoption of the mitigation measures were considered, about 80% of the technical mitigation potential (67.5 out of 85.5 MtCO2-eq) could be achieved by cost-saving measures. When yield benefits were considered, green fodder supplements to ruminant diets were the most cost-effective mitigation measure, followed by vermicomposting and improved diet management of small ruminants. Mitigation measures such as fertigation and micro-irrigation, various methods of restoring degraded land and feed additives in livestock appear to be cost-prohibitive, even when considering yield benefits, if any. The study accounted for GHG emissions at the farm level and excluded emissions arising due to processing, marketing or consumption post farm-gate. It also did not include emissions from feed production, since livestock in India mostly rely on crop by-products and concentrates. Further the potential of laser land levelling seems exaggerated which may also be redundant with already accounted potential from ‘improved water management in rice’. The mitigation potential of agroecological approaches/technologies such as natural farming which is picking up in India in recent years has also been overlooked.
Box 7.6, Figure 1 | Contribution of various crops and livestock species to total agricultural emission in 2012 (baseline) and by 2030 under business as usual (BAU) and mitigation scenarios for Indian agricultural sector. Source: Sapkota et al. (2019). Reprinted from Science of The Total Environment, 655, Sapkota T.B. et al., Cost-effective opportunities for climate change mitigation in Indian agriculture., 2019, with permission from Elsevier.
7.4.4Bioenergy and BECCS
Activities, co-benefits, risks and implementation opportunities and barriers. Bioenergy refers to energy products (solid, liquid and gaseous fuels, electricity, heat) derived from multiple biomass sources including organic waste, harvest residues and by-flows in the agriculture and forestry sectors, and biomass from tree plantations, agroforestry systems, lignocellulosic crops, and conventional food/feed crops. It may reduce net GHG emissions by displacing the use of coal, oil and natural gas with renewable biomass in the production of heat, electricity, and fuels. When combined with carbon capture and storage (BECCS) and biochar production, bioenergy systems may provide CDR by durably storing biogenic carbon in geological, terrestrial, or ocean reservoirs, or in products, further contributing to mitigation (Chum et al. 2011; Cabral et al. 2019; Hammar and Levihn 2020; Emenike et al. 2020; Moreira et al. 2020b; Y. Wang et al. 2020: Johnsson et al. 2020) (Section 7.4.3.2, Chapters 3, 4, 6 and 12).
This section addresses especially aspects related to land use and biomass supply for bioenergy and BECCS. The mitigation potential presented here and in Table 7.3, includes only the CDR component of BECCS. The additional mitigation achieved from displacing fossil fuels is covered elsewhere (Chapters 6, 8, 9, 10, 11 and 12).
Modern bioenergy systems (as opposed to traditional use of fuelwood and other low-quality cooking and heating fuels) currently provide approximately 30 EJ yr –1 of primary energy, making up 53% of total renewable primary energy supply (IEA 2019). Bioenergy systems are commonly integrated within forest and agriculture systems that produce food, feed, lumber, paper and other bio-based products. They can also be combined with other AFOLU mitigation options: deployment of energy crops, agroforestry and A/R can provide biomass while increasing land carbon stocks (Sections 7.4.2.2 and 7.4.3.3) and anaerobic digestion of manure and wastewater, to reduce methane emissions, can produce biogas and CO2 for storage (Section 7.4.3.7). But ill-deployment of energy crops can also cause land carbon losses (Hanssen et al. 2020) and increased biomass demand for energy could hamper other mitigation measures such as reduced deforestation and degradation (Sections 7.4.2.1).
Bioenergy and BECCS can be associated with a range of co-benefits and adverse side effects (Smith et al. 2016; Jia et al. 2019; Calvin et al. 2021) (Section 12.5). It is difficult to disentangle bioenergy development from the overall development in the AFOLU sector given its multiple interactions with food, land, and energy systems. It is therefore not possible to precisely determine the scale of bioenergy and BECCS deployment at which negative impacts outweigh benefits. Important uncertainties include governance systems, future food and biomaterials demand, land-use practices, energy systems development, climate impacts, and time scale considered when weighing negative impacts against benefits (Robledo-Abad et al. 2017; Turner et al. 2018b; Daioglou et al. 2019; Wu et al. 2019; Kalt et al. 2020; Hanssen et al. 2020; Calvin et al. 2021; Cowie et al. 2021) (SRCCL, Cross-Chapter Box 7; Box 7.7). The use of municipal organic waste, harvest residues, and biomass processing by-products as feedstock is commonly considered to have relatively lower risk, provided that associated land-use practices are sustainable (Cowie et al. 2021). Deployment of dedicated biomass production systems can have positive and negative implications on mitigation and other sustainability criteria, depending on location and previous land use, feedstock, management practice, deployment strategy and scale (Rulli et al. 2016; Popp et al. 2017; Daioglou et al. 2017; Staples et al. 2017; Carvalho et al. 2017; Humpenöder et al. 2018; Fujimori et al. 2019; Hasegawa et al. 2020; Drews et al. 2020; Schulze et al. 2020; Stenzel et al. 2020; Mouratiadou et al. 2020; Buchspies et al. 2020; Hanssen et al. 2020, IPBES 2019b) (Sections 12.5 and 17.3.3.1).
Conclusions from AR5 and IPCC Special Reports (SR1.5, SROCC and SRCCL); mitigation potential, costs, and pathways. Many more stringent mitigation scenarios in AR5 relied heavily on bioenergy and BECCS. The SR1.5 reported a range for the CDR potential of BECCS (2100) at 0.5 to 5 GtCO2-eq yr –1 when applying constraints reflecting sustainability concerns, at a cost of 100–200 USD tCO2–1 (Fuss et al. 2018). The SRCCL reported a technical CDR potential for BECCS at 0.4–11.3 GtCO2 yr –1 (medium confidence), noting that most estimates do not include socio-economic barriers, the impacts of future climate change, or non-GHG climate forcing (IPCC. 2019). The SR1.5 and SRCCL highlighted that bioenergy and BECCS can be associated with multiple co-benefits and adverse side effects that are context specific.
Developments since AR5 and IPCC Special Reports (SR1.5, SROCC and SRCCL). The role of bioenergy and BECCS in mitigation pathways has been reduced as IAM-based studies have incorporated broader mitigation portfolios and have explored non-CO2 emissions reduction and a wider variation of underlying assumptions about socio-economic drivers and associated energy and food demand, as well as deployment limits such as land availability for A/R and for cultivation of crops used for bioenergy and BECCS (Grubler et al. 2018; Van Vuuren et al. 2018).
Increased availability of spatially explicit data and advances in the modelling of crop productivity and land use, land carbon stocks, hydrology, and ecosystem properties, have enabled more comprehensive analyses of factors that influence the contribution of bioenergy and BECCS in IAM-based mitigation scenarios, and also associated co-benefits and adverse side effects (Turner et al.2018a; Wu et al. 2019, Li et al. 2020, Hanssen et al. 2020; Drews et al. 2020; Ai et al. 2021; Hasegawa et al. 2021). Yet, IAMs are still coarse in local land-use practices. (Daioglou et al. 2019; Wu et al. 2019; Moreira et al. 2020b). Literature complementary to IAM studies indicate opportunities for integration of biomass production systems into agricultural landscapes (e.g., agroforestry, double cropping) to produce biomass while achieving co-benefits (Section 12.5). Similarly, climate-smart forestry puts forward measures (Box 7.3) adapted to regional circumstances in forest sectors, enabling co-benefits in nature conservation, soil protection, employment and income generation, and provision of wood for buildings, bioenergy and other bio-based products (Nabuurs et al. 2017).
Studies have also investigated the extent and possible use of marginal, abandoned, and degraded lands, and approaches to help restore the productive value of these lands (Awasthi et al. 2017; Fritsche et al. 2017; Chiaramonti and Panoutsou, 2018; Fernando et al. 2018; Elbersen et al. 2019; Rahman et al. 2019; Næss et al. 2021). In the SRCCL, the presented range for degraded or abandoned land was 32–1400 Mha (Jia et al. 2019). Recent regional assessments not included in the SRCCL found up to 69 Mha in EU-28, 185 Mha in China, 9.5 Mha in Canada, and 127 Mha in the USA (Emery et al. 2017; Liu et al. 2017; Elbersen et al. 2019; Zhang et al.2020; Vera et al. 2021). The definitions of marginal/abandoned/degraded land, and the methods used to assess such lands remain inconsistent across studies (Jiang et al. 2019), causing large variation amongst them (Jiang et al. 2021). Furthermore, the availability of such lands has been contested since they may serve other functions, such as: subsistence, biodiversity protection, and so on (Baka 2014).
Box 7.7 | Climate Change Mitigation Value of Bioenergy and BECCS
Besides emissions, and possible avoided emissions, related to the supply chain, the GHG effects of using bioenergy depend on: (i) change in GHG emissions when bioenergy substitutes another energy source; and (ii) how the associated land use and possible land-use change influence the amount of carbon that is stored in vegetation and (Calvin et al. 2021) soils over time. Studies arrive at varying mitigation potentials for bioenergy and BECCS due to the large diversity of bioenergy systems, and varying conditions concerning where and how they are deployed (Elshout 2015; Harper et al.2018; Muri 2018; Kalt et al.2019; Brandão et al. 2019; Buchspies et al. 2020; Cowie et al. 2021; Calvin et al. 2021). Important factors include feedstock type, land management practice, energy conversion efficiency, type of bioenergy product (and possible co-products), emissions intensity of the products being displaced, and the land use/cover prior to bioenergy deployment (Zhu et al. 2017; Staples et al. 2017; Daioglou et al. 2017; Carvalho et al. 2017; Hanssen et al. 2020; Mouratiadou et al. 2020). Studies arrive at contrasting conclusions also when similar bioenergy systems and conditions are analysed, due to different methodologies, assumptions, and parametrization (Harper et al.2018; Kalt et al.2019; Brandão et al. 2019; Albers et al. 2019; Buchspies et al. 2020; Bessou et al. 2020; Rolls and Forster 2020; Cowie et al. 2021).
Box 7.7, Figure 1 shows emissions associated with biomass supply (residues and crops grown on cropland not needed for food) in 2050, here designated emission-supply curves. The curves are constructed assuming that additional biomass supply consistently comes from the available land/biomass resource that has the lowest GHG emissions, for example, the marginal GHG emissions increase with increasing biomass use for bioenergy. Net negative emissions indicate cases where biomass production increases land carbon stocks.
One curve (EMF-33) is determined from stylised scenarios using IAMs (Rose et al. 2020). One of the two curves determined from sectoral models, Constant Land Cover, reflects supply chain emissions and changes in land carbon storage caused by the biomass supply system itself. These two curves are obtained with modelling approaches compatible with the modelling protocol used for the scenarios in the AR6 database, which accounts for the land-use change and all other GHG emissions along a given transformation trajectory, enabling assessments of the warming level incurred.
The Natural Regrowth curve attribute additional ‘counterfactual emissions’ to the bioenergy system, corresponding to estimated uptake of CO2 in a counterfactual scenario where land is not used for bioenergy but instead subject to natural vegetation regrowth. This curve does not show actual emissions from the bioenergy system, but it provides insights in the mitigation value of the bioenergy option compared to alternative land-use strategies. To illustrate, if biomass is used instead of a primary energy source with emission factor 75 kgCO2GJ–1, and the median values in the Natural Regrowth curve are adopted, then the curve indicates that up to about 150 EJ of biomass can be produced and used for energy while achieving higher net GHG savings than the alternative to set aside the same land for natural vegetation regrowth (assuming same conversion factor).
The large ranges in the bars signify the importance of uncertainties and how the biomass is deployed. Variation in energy conversion efficiencies and uncertainty about magnitude, timing, and permanence of land carbon storage further complicate the comparison. Finally, not shown in Box 7.7, Figure 1, the emission-supply curves would be adjusted downwards if displacement of emission intensive energy was included or if the bioenergy is combined with CCS to provide CDR.

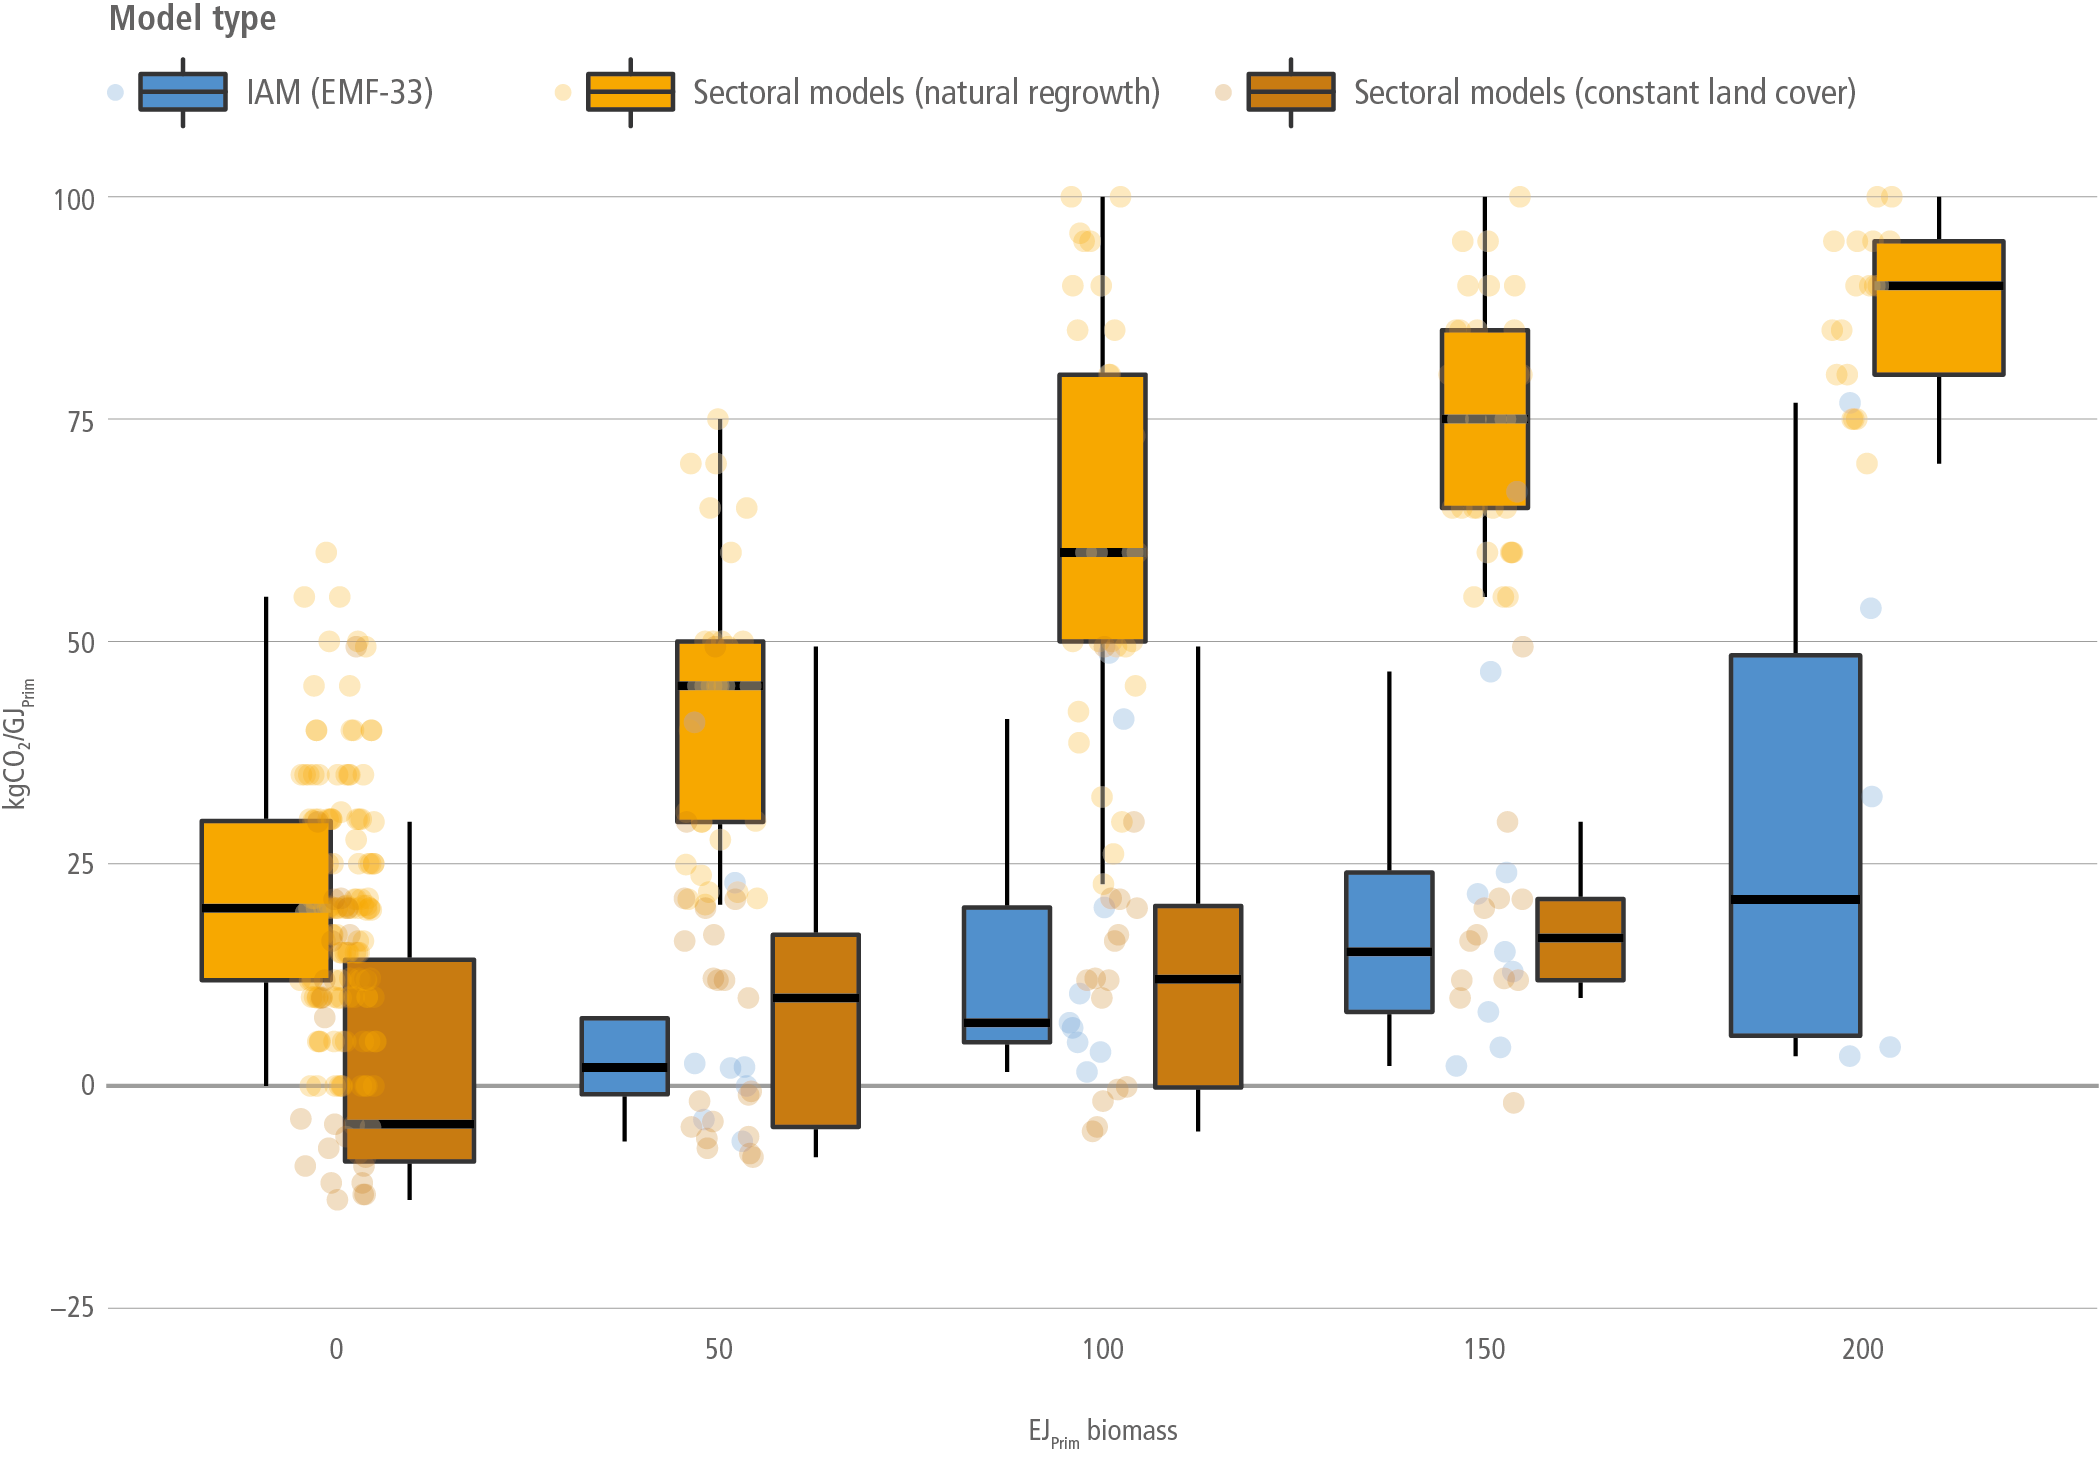
Box 7.7, Figure 1 | Emissions associated with primary biomass supply in 2050 (residues and crops grown on cropland not needed for food), as determined from sectoral models (Daioglouet al. 2017; Kalt et al. 2020), and stylised scenarios from the EMF-33 project using Integrated Assessment Models (Roseet al. 2020). All methods include LUC (direct and indirect) emissions. Emissions associated with Natural Regrowth include counterfactual carbon fluxes (see text). The sectoral models include a more detailed representation of the emissions, including lifecycle emissions from fertiliser production. IAM models may include economic feedbacks such as intensification as a result of increasing prices. As an indication: for natural gas the emission factor is around 56, for coal around 95 kgCO2GJ–1.
Critical assessment and conclusion. Recent estimates of technical biomass potentials constrained by food security and environmental considerations fall within previous ranges corresponding to medium agreement , (e.g., Turner et al. 2018b; Daioglou et al. 2019; Wu et al. 2019, Hansen et al.2020; Kalt et al. 2020) arriving at 4–57 and 46–245 EJ yr –1 by 2050 for residues and dedicated biomass crops, respectively. Based on studies to date, the technical net CDR potential of BECCS (including LUC and other supply chain emissions, but excluding energy carrier substitution) by 2050 is 5.9 (0.5–11.3) GtCO2 yr –1 globally, of which 1.6 (0.5–3.5) GtCO2 yr –1 is available at below USD100 tCO2–1 (medium confidence) (Lenton 2010; Koornneef et al. 2012; McLaren 2012; Powell and Lenton 2012; Fuss et al. 2018; Turner et al. 2018a; Hanssen et al. 2020; Roe et al. 2021) (Figure 7.11). The equivalent economic potential as derived from IAMs is 1.8 (0.2–9.9) GtCO2 yr –1 (Table 7.3).
Technical land availability does not imply that dedicated biomass production for bioenergy and BECCS is the most effective use of this land for mitigation. Further, implications of deployment for climate change mitigation and other sustainability criteria are context dependent and influenced by many factors, including rate and total scale. While governance has a critical influence on outcome, larger scale and higher expansion rate generally translates into higher risk for negative outcomes for GHG emissions, biodiversity, food security and a range of other sustainability criteria (Searchinger 2017; Vaughan et al. 2018; Rochedo et al. 2018; de Oliveira Garcia et al. 2018; Daioglou et al. 2019; Junginger et al. 2019; Galik et al. 2020; Stenzel et al. 2020).
However, literature has also highlighted how the agriculture and forestry sectors may respond to increasing demand by devising management approaches that enable biomass production for energy in conjunction with supply of food, construction timber, and other bio-based products, providing climate change mitigation while enabling multiple co-benefits including for nature conservation (Nabuurs et al. 2017; Parodi et al. 2018; Springmann et al. 2018; Rosenzweig et al. 2020; Clark et al. 2020; Favero et al. 2020; Hanssen et al. 2020) (Section 7.4 and Cross-Working Group Box 3 in Chapter 12).
Strategies to enhance the benefits of bioenergy and BECCS include (i) management practices that protect carbon stocks and the productive and adaptive capacity of lands, as well as their environmental and social functions (van Ittersum et al. 2013, Gerssen-Gondelach et al. 2015; Moreira et al. 2020b) (ii) supply chains from primary production to final consumption that are well managed and deployed at appropriate levels (Fajardy et al. 2018; Donnison et al. 2020); and (iii) development of a cross-sectoral agenda for bio-based production within a circular economy, and international cooperation and governance of global trade in products to maximise synergies while limiting trade-offs concerning environmental, economic and social outcomes (very high confidence). Finally, the technical feasibility of BECCS depends on investments in and the roll-out of advanced bioenergy technologies currently not widely available (Baker et al. 2015; Daioglou et al. 2020b).
7.4.5Demand-side Measures
7.4.5.1 Shift to Sustainable Healthy Diets
Activities, co-benefits, risks and implementation opportunities and barriers. The term ‘sustainable healthy diets’ refers to dietary patterns that ‘promote all dimensions of individuals’ health and well-being; have low environmental pressure and impact; are accessible, affordable, safe and equitable; and are culturally acceptable’ (FAO and WHO 2019). In addition to climate mitigation gains, a transition towards more plant-based consumption and reduced consumption of animal-based foods, particularly from ruminant animals, could reduce pressure on forests and land used for feed, support the preservation of biodiversity and planetary health (FAO 2018c; Theurl et al. 2020), and contribute to preventing forms of malnutrition (i.e., undernutrition, micronutrient deficiency, and obesity) in developing countries (Section 12.4). Other co-benefits include lowering the risk of cardiovascular disease, type 2 diabetes, and reducing mortality from diet-related non-communicable diseases (Toumpanakis et al. 2018; Satija and Hu 2018; Faber et al. 2020; Magkos et al. 2020). However, transition towards sustainable healthy diets could have adverse impacts on the economic stability of the agricultural sector (MacDiarmid 2013; Aschemann-Witzel 2015; Van Loo et al. 2017). Therefore, shifting toward sustainable and healthy diets requires effective food-system oriented reform policies that integrate agriculture, health, and environment policies to comprehensively address synergies and conflicts in co-lateral sectors (agriculture, trade, health, environment protection etc.) and capture spill-over effects, for example, climate change, biodiversity loss, food poverty (FAO and WHO 2019; Galli et al. 2020).
Conclusions from AR5 and IPCC Special Reports (SR1.5, SROCC and SRCCL); mitigation potential, costs, and pathways. According to the AR5, changes in human diets and consumption patterns can reduce emissions 5.3 to 20.2 GtCO2-eq yr –1 by 2050 from diverted agricultural production and avoided land-use change (Smith et al. 2014). In the SRCCL, a ‘contract and converge’ model of transition to sustainable healthy diets was suggested as an effective approach, reducing food consumption in over-consuming populations and increasing consumption of some food groups in populations where minimum nutritional needs are not met (P. Smith et al. 2019 a). The total technical mitigation potential of changes in human diets was estimated as 0.7–8 GtCO2-eq yr –1 by 2050 (Tilman and Clark 2014; Springmann et al. 2016; Hawken 2017) (SRCCL, Chapter 2 and 6), ranging from a 50% adoption of healthy diets (<60g of animal-based protein) and only accounting for diverted agricultural production, to the global adoption of a vegetarian diet.
Developments since AR5 and IPCC Special Reports (SR1.5, SROCC and SRCCL). Since the SRCCL, global studies continue to find high mitigation potential from reducing animal-source foods and increasing proportions of plant-rich foods in diets. Springmann et al. (2018) estimated that diet changes in line with global dietary guidelines for total energy intake and consumption of red meat, sugar, fruits, and vegetables, could reduce GHG emissions by 29% and other environmental impacts by 5–9% compared with the baseline in 2050. Poore and Nemecek (2018) revealed that shifting towards diets that exclude animal-source food could reduce land use by 3.1 billion ha, decrease food-related GHG emissions by 6.5 GtCO2-eq yr –1, acidification by 50%, eutrophication by 49%, and freshwater withdrawals by 19% for a 2010 reference year. Frank et al. (2019) estimated non-CO2 emissions reductions of 0.4 GtCO2-eq yr –1 at a carbon price of USD100 tCO2–1 and 0.6 GtCO2-eq yr –1 at USD20 tCO2–1 in 2050 from shifting to lower animal-source diets (430 kcal of livestock calorie intake) in developed and emerging countries. From a systematic literature review, Ivanova et al. (2020) found mitigation potentials of 0.4–2.1 tCO2-eq capita –1 for a vegan diet, of 0.01–1.5 for a vegetarian diet, and of 0.1–2.0 for Mediterranean or similar healthy diet.
Regionally, mitigation potentials for shifting towards sustainable healthy diets (50% convergence to <60g of meat-based protein, only accounting for diverted production) vary across regions. A recent assessment finds greatest economic (up to USD100 tCO2–1) potential for 2020–2050 in Asia and the Pacific (609 MtCO2-eq yr –1) followed by Developed Countries (322 MtCO2-eq yr –1) based on IPCC AR4 GWP100 values for CH4 and N2O) (Roe et al. 2021). In the EU, (Latka et al. 2021) found that moving to healthy diets through price incentives could bring about annual reductions of non-CO2 emissions from agriculture of 12–111 MtCO2-eq yr –1. At the country level, recent studies show that following National Dietary Guidelines (NDG) would reduce food system GHG emissions by 4–42%, confer large health gains (1.0–1.5 million quality-adjusted life-years) and lower health care system costs (NZD 14–20 billion) in New Zealand Drew et al. (2020); reduce 28% of GHG emissions in Argentina Arrieta and González (2018); about 25% in Portugal Esteve-Llorens et al. (2020) and reduce GHG emissions, land use and blue water footprint by 15–60% in Spain (Batlle-Bayer et al. 2020). In contrast, Aleksandrowicz et al. (2019) found that meeting healthy dietary guidelines in India required increased dietary energy intake overall, which slightly increased environmental footprints by about 3–5% across GHG emissions, blue and green water footprints and land use.
Critical assessment and conclusion. Shifting to sustainable healthy diets has large potential to achieve global GHG mitigation targets as well as public health and environmental benefits ( high confidence). Based on studies to date, there is medium confidence that shifting toward sustainable healthy diets has a technical potential including savings in the full value chain of 3.6 (0.3–8.0) GtCO2-eq yr –1 of which 2.5 (1.5–3.9) GtCO2-eq yr –1 is considered plausible based on a range of GWP100 values for CH4 and N2O. When accounting for diverted agricultural production only, the feasible potential is 1.7 (1–2.7) GtCO2-eq yr –1. A shift to more sustainable and healthy diets is generally feasible in many regions (medium confidence). However, potential varies across regions as diets are location- and community- specific, and thus may be influenced by local production practices, technical and financial barriers and associated livelihoods, everyday life and behavioural and cultural norms around food consumption (Meybeck and Gitz 2017; Creutzig et al. 2018; FAO 2018b). Therefore, a transition towards low-GHG emission diets and achieving their mitigation potential requires a combination of appropriate policies, financial and non-financial incentives and awareness-raising campaigns to induce changes in consumer behaviour with potential synergies between climate objectives, health and equity (Rust et al. 2020).
7.4.5.2Reduce Food Loss and Waste
Activities, co-benefits, risks and implementation opportunities and barriers. Food loss and waste (FLW) refer to the edible parts of plants and animals produced for human consumption that are not ultimately consumed (UNEP 2021b). Food loss occurs through spoilage, spilling or other unintended consequences due to limitations in agricultural infrastructure, storage and packaging (Parfitt et al. 2010). Food waste typically takes place at the distribution (retail and food service) and consumption stages in the food supply chain and refers to food appropriate for human consumption that is discarded or left to spoil (HLPE 2014). Options that could reduce FLW include: investing in harvesting and post-harvesting technologies in developing countries, taxing and other incentives to reduce business and consumer-level waste in developed countries, mandatory FLW reporting and reduction targets for large food businesses, regulation of unfair trading practices, and active marketing of cosmetically imperfect products (van Giesen and de Hooge 2019; Sinclair Taylor et al. 2019). Other studies suggested providing options of longer-lasting products and behavioural changes (e.g., through information provision) that cause dietary and consumption changes and motivate consumers to actively make decisions that reduce FLW. Reductions of FLW along the food chain bring a range of benefits beyond GHG mitigation, including reducing environmental stress (e.g., water and land competition, land degradation, desertification), safeguarding food security, and reducing poverty (Galford et al. 2020; Venkatramanan et al. 2020). Additionally, FLW reduction is crucial for achieving SDG 12 which calls for ensuring ‘sustainable consumption and production patterns’ through lowering per capita global food waste by 50% at the retail and consumer level and reducing food losses along food supply chains by 2030. In line with these SDG targets, it is estimated that reducing FLW can free up several million km 2 of land ( high confidence). The interlinkages between reducing FLW and food system sustainability are discussed in Chapter 12. Recent literature identifies a range of barriers to climate change mitigation through FLW reduction, which are linked to technological, biophysical, socio-economic, financial and cultural contexts at regional and local levels (Vogel and Meyer 2018; Gromko and Abdurasalova 2019; Rogissart et al. 2019; Blok et al. 2020). Examples of these barriers include infrastructural and capacity limitations, institutional regulations, financial resources, constraining resources (e.g., energy), information gaps (e.g., with retailers), and consumers’ behaviour (Gromko and Abdurasalova 2019; Blok et al. 2020).
Conclusions from AR5 and IPCC Special Reports (SR1.5, SROCC and SRCCL); mitigation potential, costs, and pathways. In AR5, reduced FLW was considered as a mitigation measure that could substantially lower emissions, with estimated mitigation potential of 0.6–6.0 GtCO2-eq yr –1 in the food supply chain (Smith et al. 2014). In the SRCCL, the technical mitigation potential of reducing food and agricultural waste was estimated at 0.76–4.5 GtCO2-eq yr –1 (Bajželj et al. 2014; Dickie et al. 2014b; Hawken 2017) (SRCCL, Chapter 2 and 6).
Developments since AR5 and IPCC Special Reports (SR1.5, SROCC and SRCCL). Since the SRCCL, there have been very few quantitative estimates of the mitigation potential of FLW reductions. Evidence suggests that reducing FLW together with overall food intake could have substantial mitigation potential, equating to an average of 0.3 tCO2-eq capita –1 (Ivanova et al. 2020). Some regional sectoral studies indicate that reducing FLW in the EU can reduce emissions by 186 MtCO2-eq yr –1, the equivalent of around 15% of the environmental impacts (climate, acidification, and eutrophication) of the entire food value chain (Scherhaufer et al. 2018). In the UK, disruptive low-carbon innovations relating to FLW reduction were found to be associated with potential emissions reductions ranging between 2.6 and 3.6 MtCO2-eq (Wilson et al. 2019). Other studies investigated the effect of tax mechanisms, such as ‘pay as you throw’ for household waste, on the mitigation potential of reducing FLW. Generally, these mechanisms are recognised as particularly effective in reducing the amount of waste and increasing the recycling rate of households (Carattini et al. 2018; Rogissart et al. 2019). Technological FWL mitigation opportunities exist throughout the food supply chain; post-harvest opportunities for FLW reductions are discussed in Chapter 12. Based on IPCC AR4 GWP100 values for CH4 and N2O, greatest economic mitigation potential (up to USD100 tCO2–1) for the period 2020–2050 from FLW reduction is estimated to be in Asia and Pacific (192.3 GtCO2-eq yr –1) followed by Developed Countries (101.6 GtCO2-eq yr –1) (Roe et al. 2021). These estimates reflect diverted agricultural production and do not capture potential from avoided land-use changes.
Critical assessment and conclusion. There is medium confidence that reduced FLW has large global technical mitigation potential of 2.1 (0.1–5.8) GtCO2-eq yr –1 including savings in the full value chain and using GWP100 and a range of IPCC values for CH4 and N2O. Potentials at 3.7 (2.2–5.1) GtCO2-eq yr –1 are considered plausible. When accounting for diverted agricultural production only, the feasible potential is 0.5 (0.0–0.9) GtCO2-eq yr –1. See the section above for the joint land-use effects of food related demand-side measures which increases three-fold when accounting for the land-use effects as well. But this would overlap with other measures and is therefore not additive. Regionally, FLW reduction is feasible anywhere but its potential needs to be understood in a wider and changing socio-cultural context that determines nutrition (high confidence).
7.4.5.3Improved and Enhanced Use of Wood Products
Activities, co-benefits, risks and implementation opportunities and barriers. The use of wood products refers to the fate of harvested wood for material uses and includes two distinctly different components affecting the carbon cycle, including carbon storage in wood products and material substitution. When harvested wood is used for the manufacture of wood products, carbon remains stored in these products depending on their end use and lifetime. Carbon storage in wood products can be increased through enhancing the inflow of products in use, or effectively reducing the outflow of the products after use. This can be achieved through additional harvest under sustainable management (Pilli et al. 2015; Johnston and Radeloff 2019), changing the allocation of harvested wood to long-lived wood products or by increasing products’ lifetime and increasing recycling (Brunet-Navarro et al. 2017; Jasinevičius et al. 2017; Xu et al. 2018; Xie et al. 2021). Material substitution involves the use of wood for building, textiles, or other applications instead of other materials (e.g., concrete or steel, which consume more energy to produce) to avoid or reduce emissions associated with the production, use and disposal of those products it replaces.
The benefits and risks of improved and enhanced improved use of wood products are closely linked to forest management. First of all, the enhanced use of wood products could potentially activate or lead to improved sustainable forest management that can mitigate and adapt (Verkerk et al. 2020). Secondly, carbon storage in wood products and the potential for substitution effects can be increased by additional harvest, but with the risk of decreasing carbon storage in forest biomass when not done sustainably (P. Smith et al. 2019 a). Conversely, reduced harvest may lead to gains in carbon storage in forest ecosystems locally, but these gains may be offset through international trade of forest products causing increased harvesting pressure or even degradation elsewhere (Kastner et al. 2011; Kallio et al. 2018; Pendrill et al. 2019b). There are also environmental impacts associated with the processing, manufacturing, use and disposal of wood products (Adhikari and Ozarska 2018; Baumgartner 2019). See Section 9.6.4 of this report for additional discussion on benefits and risks.
Conclusions from AR5 and IPCC Special Reports (SR1.5, SROCC and SRCCL); mitigation potential, costs, and pathways. There is strong evidence at the product level that wood products from sustainably managed forests are associated with less greenhouse emissions in their production, use and disposal over their life-time compared to products made from emission-intensive and non-renewable materials. However, there is still limited understanding of the substitution effects at the level of markets, countries (Leskinen et al. 2018). The AR5 did not report on the mitigation potential of wood products. The SRCCL (Chapters 2 and 6) finds that some studies indicate significant mitigation potentials for material substitution, but concludes that the global, technical mitigation potential for material substitution for construction applications ranges from 0.25–1 GtCO2-eq yr –1 (medium confidence) (Miner 2010; McLaren 2012; Roe et al. 2019).
Developments since AR5 and IPCC Special Reports (SR1.5, SROCC and SRCCL). Since the SRCCL, several studies have examined the mitigation potential of the enhanced and improved use of wood products. A global forest sector modelling study (Johnston and Radeloff 2019) estimated that carbon storage in wood products represented a net carbon stock increase of 0.34 GtCO2-eq yr –1 globally in 2015 and which could provide an average mitigation potential (by increasing the HWP pool) of 0.33–0.41 GtCO2-eq yr –1 for the period 2020–2050, based on the future socio-economic development (SSP scenarios) and its effect on the production and consumption of wood products. Traded feedstock provided another 0.071 GtCO2 yr –1 of carbon storage in 2015 and 0.12 GtCO2 yr –1 by 2065. These potentials exclude the effect of material substitution. Another recent study estimated the global mitigation potential of mid-rise urban buildings designed with engineered wood products at 0.04–3.7 GtCO2 yr –1 (Churkina et al. 2020). Another study (Oliver et al. 2014) estimated that using wood to substitute for concrete and steel as building materials could provide a technical mitigation potential of 0.78–1.73 GtCO2 yr –1 achieved through carbon storage in wood products and through material and energy substitution.
The limited availability or absence of estimates of the future mitigation potential of improved use of wood products for many world regions represents an important knowledge gap, especially with regards to material substitution effects. At the product level, wood products are often associated with lower fossil-based emissions from production, use and disposal, compared to products made from emission-intensive and non-renewable materials (Sathre and O’Connor 2010; Geng et al. 2017; Leskinen et al. 2018).
Critical assessment and conclusion. Based on studies to date, there is strong evidence and medium agreement that the improved use of wood products has a technical potential of 1.0 (0.04–3.7) GtCO2-eq yr –1 and economic potential of 0.4 (0.3–0.5) GtCO2-eq yr –1. There is strong evidence and high agreement at the product level that material substitution provides on average benefits for climate change mitigation as wood products are associated with less fossil-based GHG emissions over their lifetime compared to products made from emission-intensive and non-renewable materials. However, the evidence at the level of markets or countries is uncertain and fairly limited for many parts of the world. There is medium confidence that material substitution and carbon storage in wood products contribute to climate change mitigation when also the carbon balances of forest ecosystems are considered of sustainably managed large areas of forests in medium term. The total future mitigation potential will depend on the forest system considered, the type of wood products that are produced and substituted and the assumed production technologies and conversion efficiencies of these products.
7.5AFOLU Integrated Models and Scenarios
This section assesses the literature and data available on potential future GHG dynamics in the AFOLU sector, the cost-effectiveness of different mitigation measures, and consequences of climate change mitigation pathways on land-use dynamics as well as relevant sustainable development indicators at the regional and global level based on global integrated models.
Land-based mitigation options interact and create various trade-offs, and thus need to be assessed together as well as with mitigation options in other sectors, and in combination with other sustainability goals (Popp et al. 2014; Obersteiner et al. 2016; Roe et al. 2019; Van Vuuren et al. 2019; Prudhomme et al. 2020; Strefler et al. 2021). The assessments of individual mitigation measures or sectoral estimates used to estimate mitigation potential in Section 7.4, when aggregated together, do not account for interactions and trade-offs. Integrative land-use models (ILMs) combine different land-based mitigation options and are partially included in Integrated Assessment Models (IAMs) which combine insights from various disciplines in a single framework and cover the largest sources of anthropogenic GHG emissions from different sectors. Over time, ILMs and IAMs have extended their system coverage (Johnson et al. 2019). However, the explicit modelling and analysis of integrated land-use systems is relatively new compared to other sectoral assessments such as the energy system (Jia et al. 2019). Consequently, ILMs as well as IAMs differ in their portfolio and representation of land-based mitigation options, the representation of sustainability goals other than climate action as well as the interplay with mitigation in other sectors (van Soest et al. 2019; Johnson et al. 2019). These structural differences have implications for the regional and global deployment of different mitigation options as well as their sustainability impacts.
As a consequence of the relative novelty of land-based mitigation assessment in ILMs and IAMs, the portfolio of land-based mitigation options does not cover the full option space as outlined in Section 7.4. The inclusion and detail of a specific mitigation measure differs across models. Land-based mitigation options are only partially included in ILM and IAM analyses, which mostly rely on afforestation/reforestation and bioenergy with CCS (BECCS). Most ILM and IAM scenarios are based on the Shared Socio-economic Pathways (SSPs) (Riahi et al. 2017), which is a set of contrasting future scenarios widely used in the research community such as in the CMIP6 exercise, the SRCCL and the IPBES global assessment. However, the coverage of land-based mitigation options in these scenarios is mostly limited to dietary changes, higher efficiency in food processing (especially in livestock production systems), reduction of food waste, increasing agricultural productivity, methane reductions in rice paddies, livestock and grazing management for reduced methane emissions from enteric fermentation, manure management, improvement of N-efficiency, international trade, first generation of biofuels, avoided deforestation, afforestation, bioenergy and BECCS (Popp et al. 2017; Van Meijl et al. 2018; Frank et al. 2019). Hence, there are mitigation options not being broadly included in integrated pathway modelling as soil carbon, forest management, agroforestry or wetland management (Humpenöder et al. 2020) which have the potential to alter the contribution of land-based mitigation in terms of timing, potential and sustainability consequences (Frank et al. 2017).
7.5.1Regional GHG Emissions and Land Dynamics
In most of the assessed mitigation pathways, the AFOLU sector is of great importance for climate change mitigation as it (i) turns from a source into a sink of atmospheric CO2 due to large-scale afforestation and reforestation, (ii) provides high amounts of biomass for bioenergy with or without CCS and (iii), even under improved agricultural management, still causes residual non-CO2 emissions from agricultural production and (iv) interplays with sustainability dimensions other than climate action (Popp et al. 2017; Rogelj et al. 2017; Van Vuuren et al. 2018; Frank et al. 2018; Hasegawa et al. 2018; van Soest et al. 2019). Regional AFOLU GHG emissions in scenarios with <4°C warming in 2100 (scenario category C7), as shown in Figure 7.13, are shaped by considerable CH4 and N2O emissions throughout 2050 and 2100, mainly from ASIA and AFRICA. CH4 emissions from enteric fermentation are largely caused by ASIA, followed by AFRICA, while CH4 emissions from paddy rice production are almost exclusively caused by ASIA. N2O emissions from animal waste management and soils are more equally distributed across region.
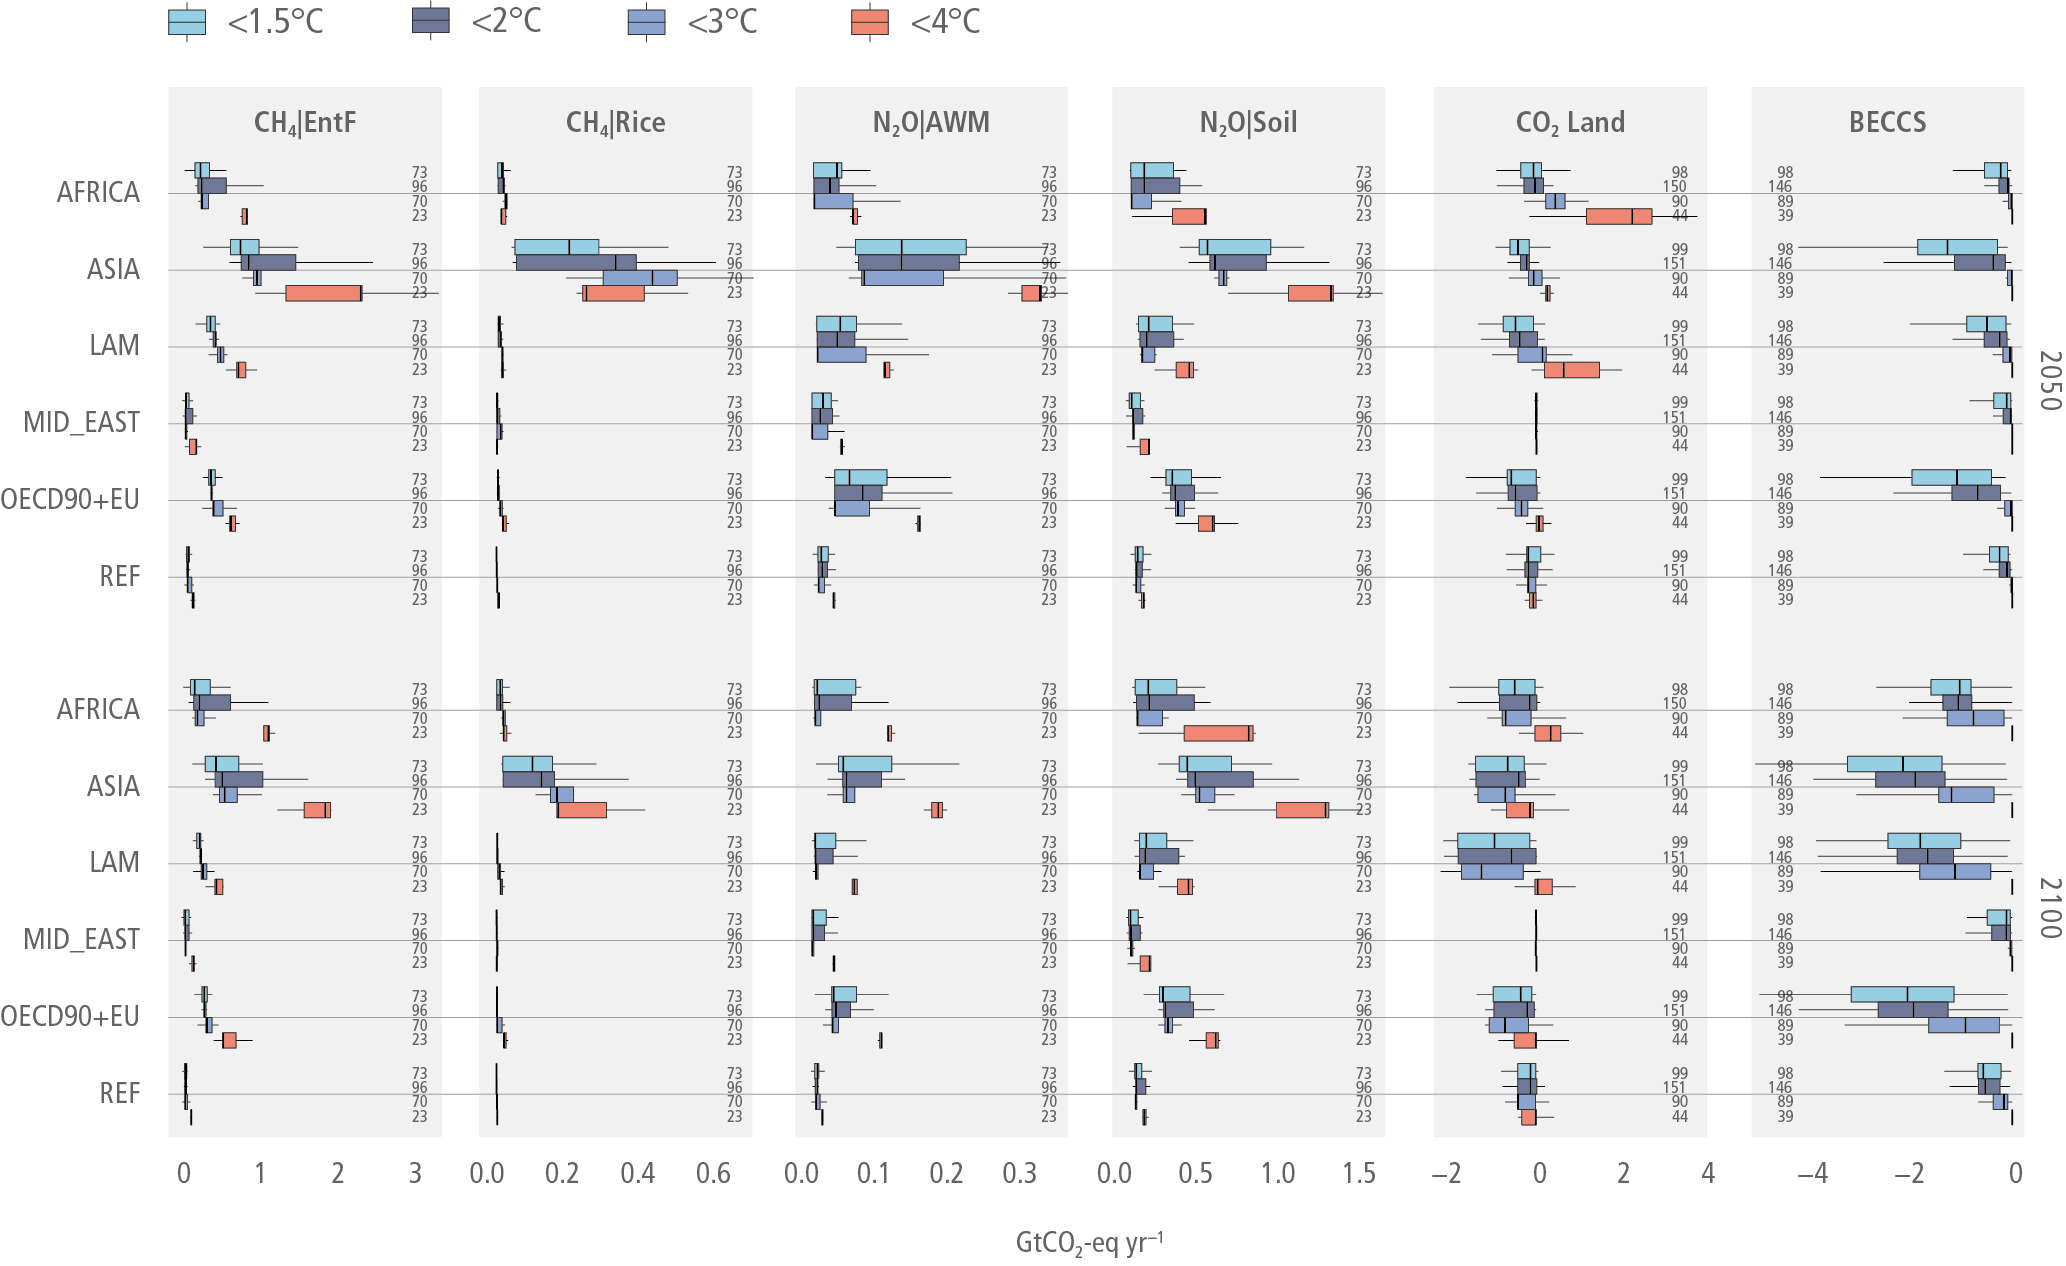
Figure 7.13 | Land-based regional GHG emissions and removals in 2050 (top) and 2100 (bottom) for scenarios from the AR6 Database with <1. 5°C (C1, C2), <2°C (C3, C4), <3°C (C5, C6) and <4°C (C7) global warming in 2100 (scenario type is indicated by colour). The categories shown include CH4 emissions from enteric fermentation (EntF) and rice production (Rice), N2O emissions from animal waste management (AWM) and fertilisation (Soil). The category CO2Land includes CO2 emissions from land-use change as well as removals due to afforestation/reforestation. BECCS reflects the CO2 emissions captured from bioenergy use and stored in geological deposits. The annual GHG emission data from various models and scenarios is converted to CO2 equivalents using GWP factors of 27 for CH4 and 273 for N2O. The data is summarised in boxplots (Tukey style), which show the median (vertical line), the interquartile range (IQR box) and the range of values within 1.5 × interquartile range at either end of the box (horizontal lines) across all models and scenarios. The number of data points available for each emission category, scenario type, region and year is shown at the edge of each panel. Regional definitions: AFRICA = sub-Saharan Africa, ASIA = Asia, LAM = Latin America and Caribbean, MID_EAST = Middle East, OECD90+EU = OECD 90 and EU, REF = Reforming Economies of Eastern Europe and the Former Soviet Union.
In most regions, CH4 and N2O emission are both lower in mitigation pathways that limit warming to 3°C (>50%) or lower (C1–C6) compared to scenarios with <4°C (Popp et al. 2017; Rogelj et al. 2018a). In particular, the reduction of CH4 emissions from enteric fermentation in ASIA and AFRICA is profound. Land-related CO2 emissions, which include emissions from deforestation as well as removals from afforestation, are slightly negative (i.e., AFOLU systems turn into a sink) in <1.5°C, <2°C and <3°C mitigation pathways compared to <4°C scenarios. Carbon sequestration via BECCS is most prominent in ASIA, LAM, AFRICA and OECD90+EU, which are also the regions with the highest bioenergy area.
Figure 7.14 indicates that regional land-use dynamics in scenarios with <4°C warming in 2100 are characterised by rather static agricultural land (i.e., cropland and pasture) in ASIA, LAM, OECD90+EU and REF, and increasing agricultural land in AFRICA. Bioenergy area is relatively small in all regions. Agricultural land in AFRICA expands at the cost of forests and other natural land.
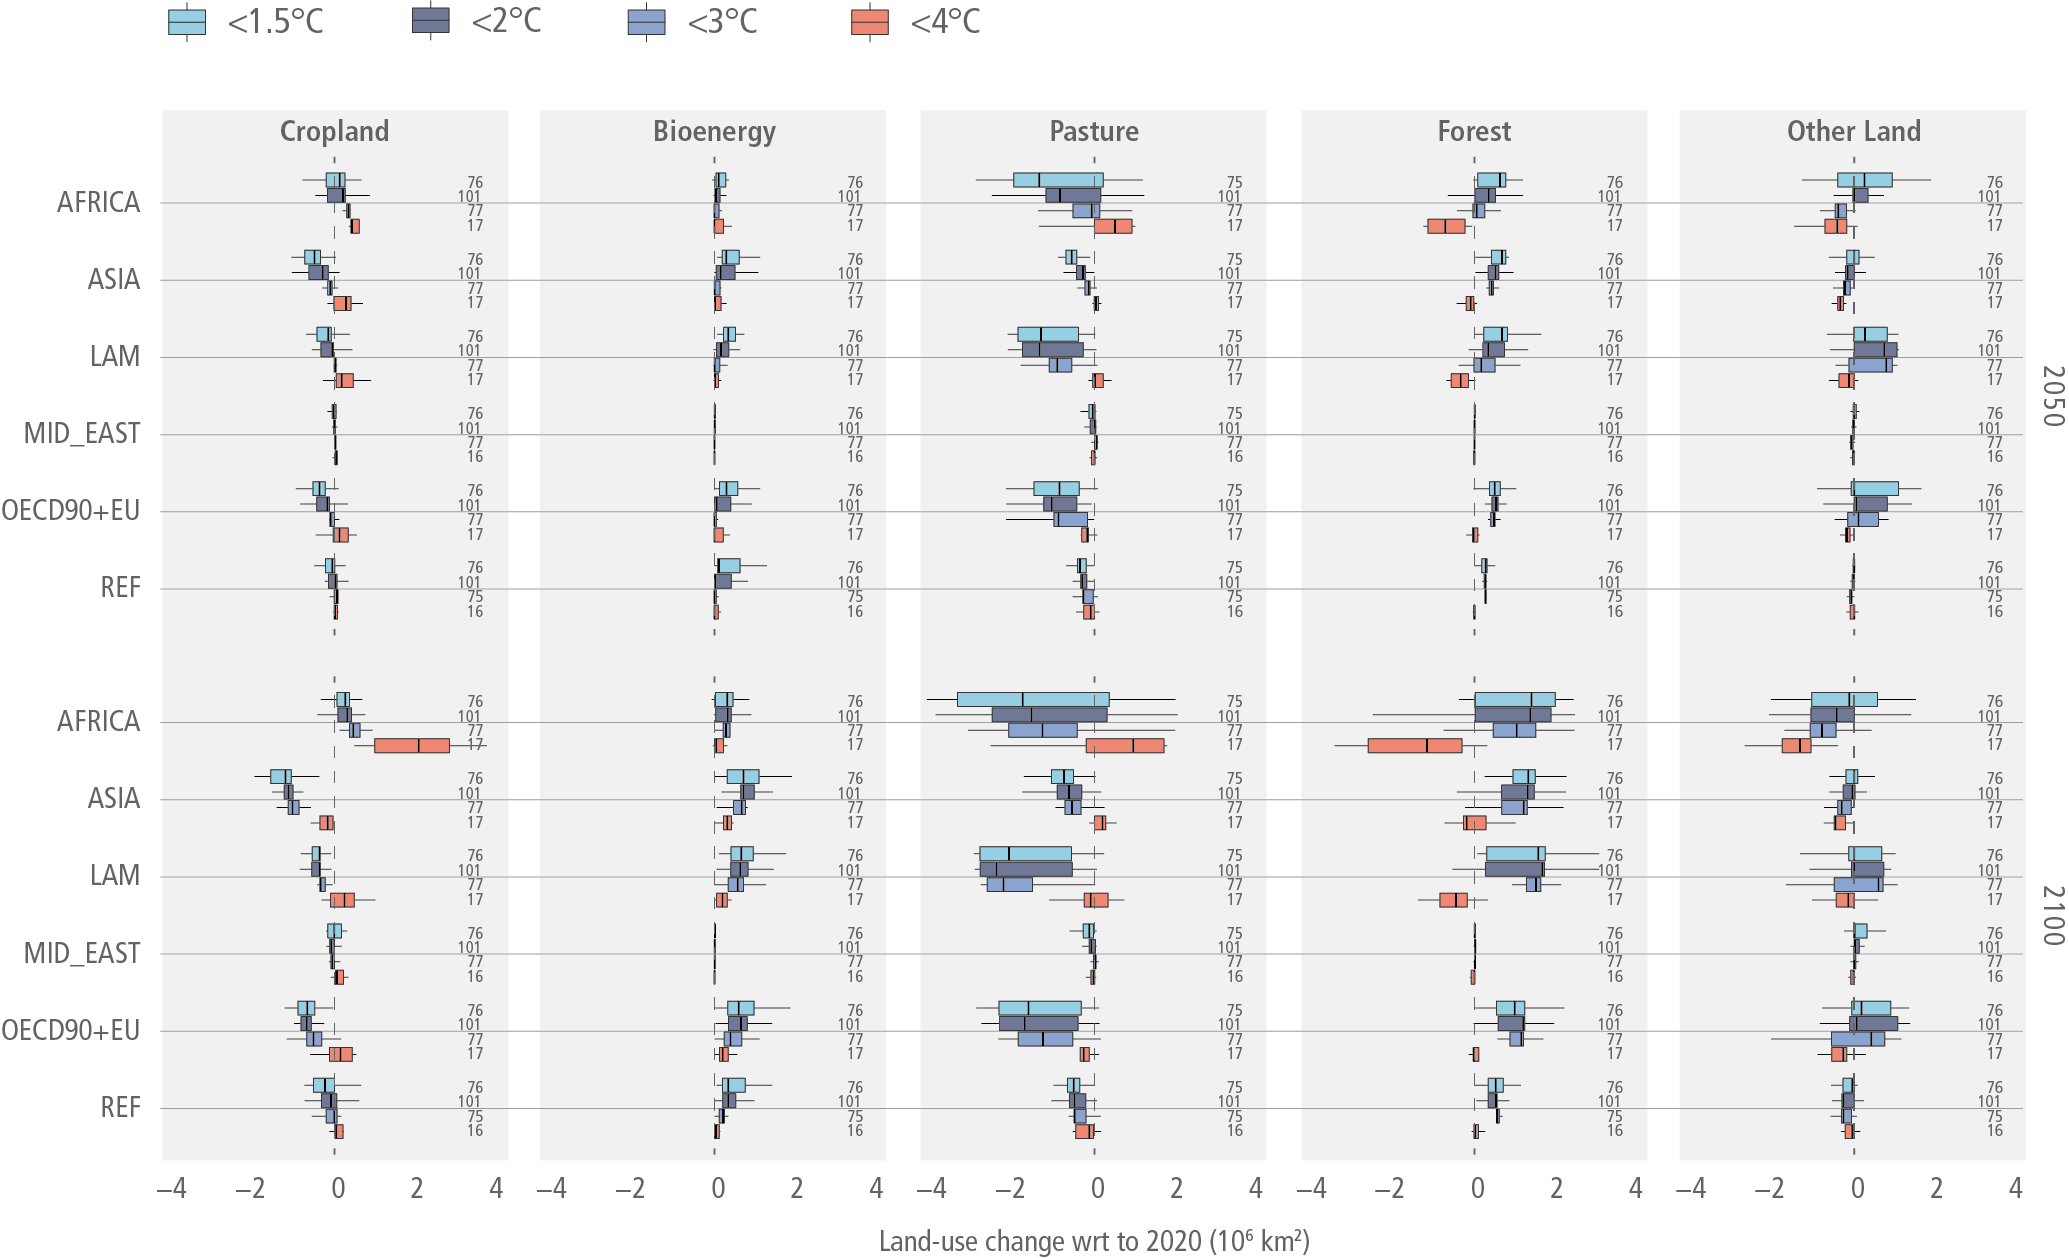
Figure 7.14 | Regional change of major land cover types by 2050 (top) and 2100 (bottom) relative to 2020 for scenarios from the AR6 Database with <1. 5°C (C1, C2), <2°C (C3, C4), <3°C (C5, C6) and <4°C (C7) global warming in 2100 (scenario type is indicated by colour). The data is summarised in boxplots (Tukey style), which show the median (vertical line), the interquartile range (IQR box) and the range of values within 1.5×IQR at either end of the box (horizontal lines) across all models and scenarios. The number of data points available for each land cover type, scenario type, region and year is shown at the right edge of each panel. Regional definitions: AFRICA = sub-Saharan Africa, ASIA = Asia, LAM = Latin America and Caribbean, MID_EAST = Middle East, OECD90+EU = OECD 90 and EU, REF = Reforming Economies of Eastern Europe and the Former Soviet Union.
The overall land dynamics in <1.5°C, <2°C and <3°C mitigation pathways are shaped by land-demanding mitigation options such as bioenergy and afforestation, in addition to the demand for other agricultural and forest commodities. Bioenergy production and afforestation take place largely in the (partly) tropical regions ASIA, LAM and AFRICA, but also in OECD90+EU. Land for dedicated second generation bioenergy crops and afforestation displace agricultural land for food production (cropland and pasture) and other natural land. For instance, in the <1.5°C mitigation pathway in ASIA, bioenergy and forest area together increased by about 2.1 million km 2 between 2020 and 2100, mostly at the cost of cropland and pasture (median values). Such large-scale transformations of land use have repercussions on biogeochemical cycles (e.g., fertiliser and water) but also on the economy (e.g., food prices) and potential socio-political conditions.
7.5.2Marginal Abatement Costs According to Integrated Assessments
In this section, Integrated Assessment Model (IAM) results from the AR6 database are used to derive marginal abatement costs which indicate the economic mitigation potential for the different gases (N2O, CH4, CO2) related to the AFOLU sector, at the global level and at the level of five world regions. This review provides a complementary view on the economic mitigation potentials estimated in Section 7.4 by implicitly taking into account the interlinkages between the land-based mitigation options themselves as well as the interlinkages with mitigation options in the other sectors such as BECCS. The review systematically evaluates a range of possible economic potential estimates across gases, time, and carbon prices.
For different models and scenarios from the AR6 database, the amount of mitigated emissions is presented together with the respective carbon price (Figure 7.15). To determine mitigation potentials, scenarios are compared to a benchmark scenario which usually assumes business-as-usual trends and no explicit additional mitigation efforts. Scenarios have been excluded, if they do not have an associated benchmark scenario or fail the vetting according to the AR6 scenario database, or if they do not report carbon prices and CO2 emissions from AFOLU. Scenarios with contradicting assumptions (for example, fixing some of the emissions to baseline levels) are excluded. Furthermore, only scenarios with consistent 3 regional and global level results are considered. Mitigation potentials are computed by subtracting scenario specific emissions and sequestration amounts from their respective benchmark scenario values. This difference accounts for the mitigation that can be credited to the carbon price which is applied in a scenario. A few benchmark scenarios, however, apply already low carbon prices. For consistency reasons, a carbon price that is applied in a benchmark scenario is subtracted from the respective scenario specific carbon price. This may generate a bias because low carbon prices tend to have a stronger marginal impact on mitigation than high carbon prices. Scenarios with carbon prices which become negative due to the correction are not considered. The analysis considers all scenarios from the AR6 database which pass the criteria and should be considered as an ensemble of opportunity (Huppmann et al. 2018).
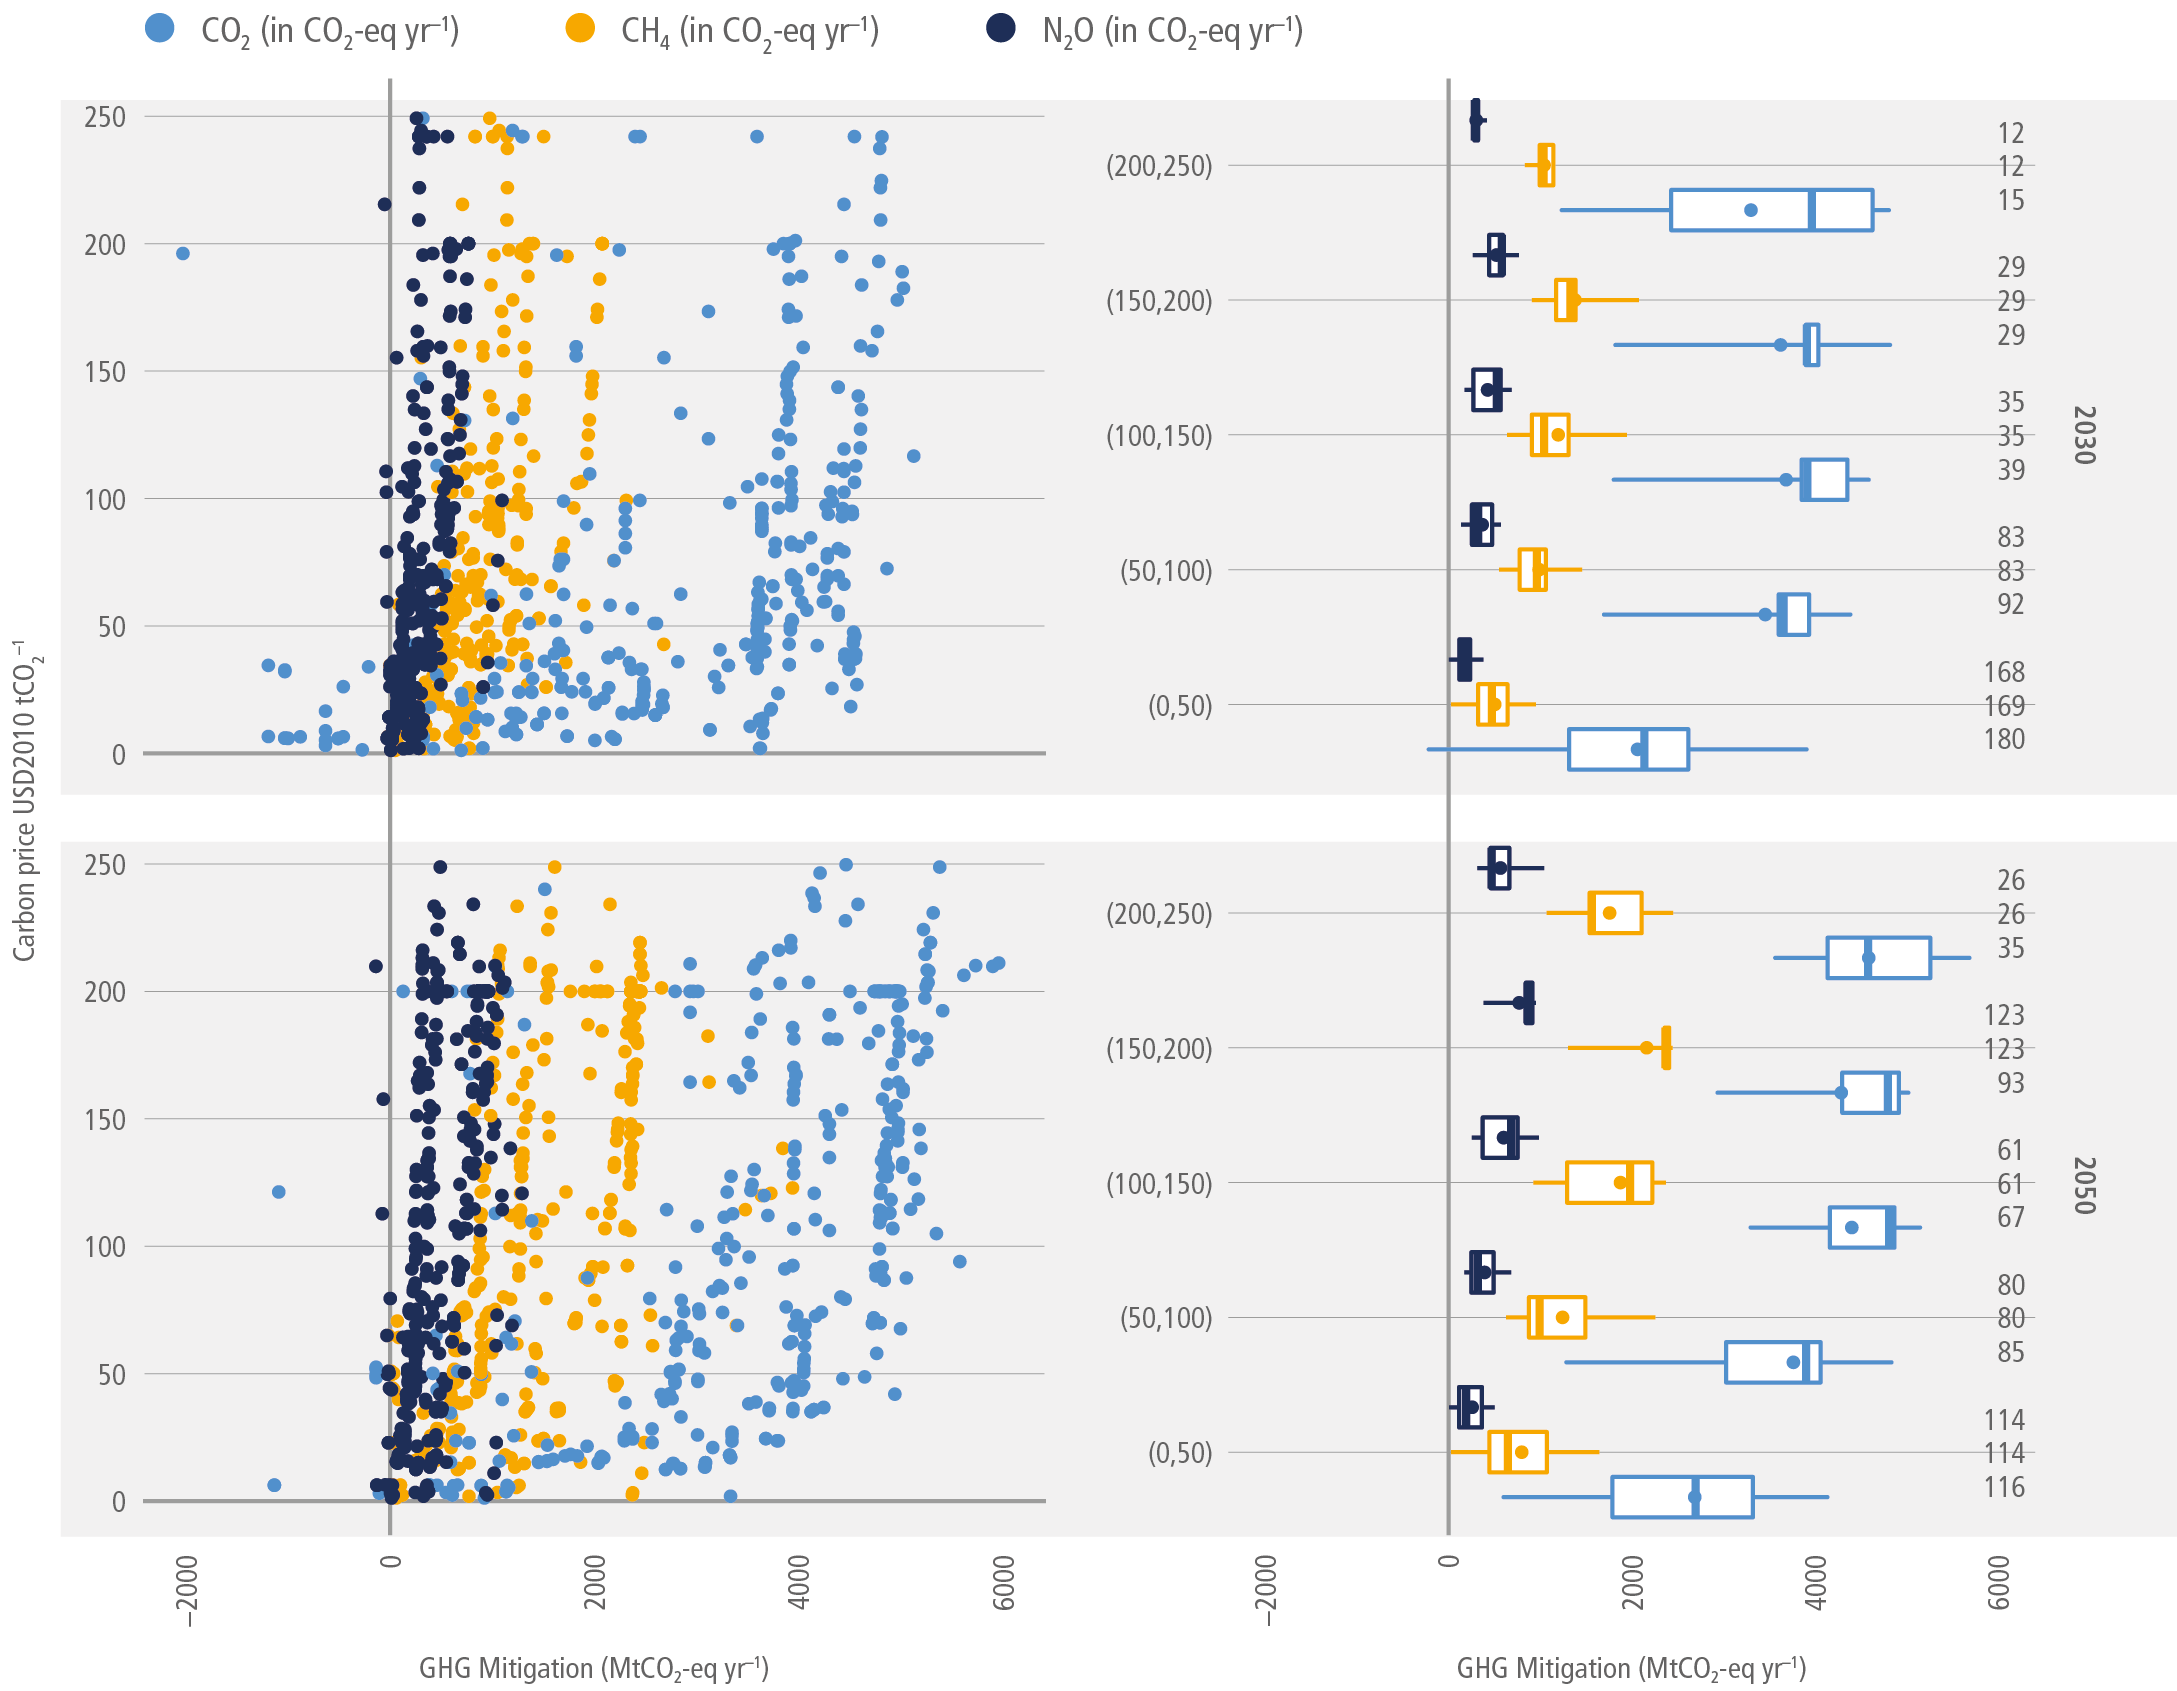
Figure 7.15 | Mitigation of CO2, CH4and N2O emissions (in CO2-eq yr–1using IPCC AR6 GWP100 values) from the AFOLU sector for increasing carbon price levels for 2030 and 2050. In the left-hand panels, single data points are generated by comparing emissions between a policy scenario and a related benchmark scenario, and mapping these differences with the respective carbon price difference. Plots only show the price range of up to 250 USD2010 tCO2-eq –1 and the mitigation range between –2000 and 6000 MtCO2-eq yr –1 for better visibility. At the right-hand side, based on the same data as left-hand side panels, boxplots show medians (vertical line within the boxes), means (dots), 33%–66% intervals (box) and 10%–90% intervals (horizontal lines). Numbers on the very right indicate the number of observations falling into the respective price range per variable. A wide range of carbon price induced mitigation options (such as technical, structural and behavioural options in the agricultural sector, afforestation, reforestation, natural re-growth or avoided deforestation in the LULUCF sector, excluding carbon capture and sequestration from BECCS) are reflected in different scenarios.
This approach is close to integrated assessment marginal abatement cost curves (MACCs) as described in the literature (Fujimori et al. 2016; Frank et al. 2018, 2019; Harmsen et al. 2019) in the sense that it incorporates besides the technical mitigation options also structural options, as well as behavioural changes and market feedbacks. Furthermore, indirect emission changes and interactions with other sectors can be highly relevant (Daioglou et al. 2019; Kalt et al. 2020) and are also accounted for in the presented potentials. Hereby, some sequestration efforts can occur in other sectors, while leading to less mitigation in the AFOLU sector. For instance, as an integral part of many scenarios, BECCS deployment will lead to overall emissions reductions, and even provision of CDR as a result of the interplay between three direct components (i) LULUCF emissions/sinks, (ii) reduction of fossil fuel use/emissions, (iii) carbon capture and sequestration. Since the latter two effects can compensate for the LULUCF effect, BECCS deployment in ambitious stabilisation scenarios may lead to reduced sink/increased emissions in LULUCF (Kalt et al. 2020). The same holds for trade-offs between carbon sequestration in forests versus harvested wood products both for enhancing the HWP pool and for material substitution. The strengths of the competition between biomass use and carbon sequestration will depend on the biomass feedstocks considered (Lauri et al. 2019).
In the individual cases, the accounting of all these effects is dependent on the respective underlying model and its coverage of inter-relations of different sectors and sub-sectors. The presented potentials cover a wide range of models, and additionally, a wide range of background assumptions on macro-economic, technical, and behavioural developments as well as policies, which the models have been fed with. Subsequently, the range of the resulting marginal abatement costs is relatively wide, showing the full range of expected contributions from land-use sector mitigation and sequestration in applied mitigation pathways.
At the global level, the analysis of the economic mitigation potentials from N2O and CH4 emissions from AFOLU (which mainly can be related to agricultural activities) and CO2 emissions (which mainly can be related to LULUCF emissions) revealsa relatively good agreement of models and scenarios in terms of ranking between the gases. On the right-hand side panels of Figure 7.15, only small overlaps between the ranges (showing the 10–90% intervals of observations) and mainly for lower price levels, can be observed, despite all differences in underlying model structure and scenario assumptions.
N2O emissions show the smallest economic potential of the three different gases in 2030 as well as in 2050. The mitigation potential increases until a price range of USD150–200 and to a median value of around 0.6 GtCO2-eq yr –1 mitigation in 2030 and 0.9 GtCO2-eq yr –1 in 2050, respectively, while afterwards with higher prices the expansion is very limited. Mitigation of CH4 emissions has a higher potential, also with increasing mitigation potentials until a price range of USD150–200 in both years, with median mitigation of around 1.3 GtCO2-eq yr –1 in 2030 and around 2.4 GtCO2-eq yr –1 in 2050, respectively. The highest mitigation potentials are observed for CO2, but also the highest ranges of observations among the three gases. In 2030, a median of 4 GtCO2-eq yr –1 mitigation potential is reported for the price range of USD200–250. In 2050, for the carbon price range of between USD100 and USD200, a median of around 4.8 GtCO2-eq yr –1 can be observed.
When compared with the sectoral estimates from Harmsen et al. (2019), the integrated assessment median potentials are broadly comparable for the N2O mitigation potential; Harmsen et al. 2050 mitigation potential at USD125 is 0.6 GtCO2-eq yr –1 while the integrated assessment estimate for the same price range is 0.7 GtCO2-eq yr –1. The difference is substantially larger for the CH4 mitigation potential; 0.9 GtCO2-eq yr –1 in Harmsen et al. while 2 GtCO2-eq yr –1 the median integrated assessment estimate. While the Harmsen et al. MACCs consider only technological mitigation options, integrated assessments typically include also demand side response to the carbon price and GHG efficiency improvements through structural change and international trade. These additional mitigation options can represent more than 60% of the total non-CO2 mitigation potential in the agricultural sector, where they are more important in the livestock sector, and thus the difference between sectoral and integrated assessments is more pronounced for the CH4 emissions (Frank et al. 2019).
Economic CO2 mitigation potentials from land-use change and forestry are larger compared to potentials from non-CO2 gases, and at the same time reveal high levels of variation in absolute terms. The 66th percentile in 2050 goes up to 5.2 GtCO2-eq yr –1 mitigation, while the lowest observations are even negative, indicating higher CO2 emissions from land use in scenarios with carbon price compared to scenarios without (counterintuitive dynamics explained below).
Land use is at the centre of the interdependencies with other sectors, including energy. Some models see a strong competition between BECCS deployment with its respective demand for biomass, and CO2 mitigation/sequestration potentials in the land sector. Biomass demand may lead to an increase in CO2 emissions from land use despite the application of a carbon price when land-use expansion for dedicated biomass production, such as energy plantations, comes from carbon rich land use/land cover alternatives, or when increased extraction of biomass from existing land uses, such as forest management, leads to reduction of the carbon sink (Daioglou 2019; Luderer et al. 2018) and can explain the high variety of observations in some cases. Overall, the large variety of observations shows a large variety of plausible results, which can go back to different model structures and assumptions, showing a robust range of plausible outcomes (Kriegler et al. 2015).
7.5.3Interaction Between Mitigation in the AFOLU Sector and Other SDGs in the Context of Integrated Assessments
Besides the level of biomass supply for bioenergy, the adoption of SDGs may also significantly impact AFOLU emissions and the land-use sector’s ability for GHG abatement (Frank et al. 2021). Selected SDGs are found to have positive synergies for AFOLU GHG abatement and to consistently decrease GHG emissions for both agriculture and forestry, thereby allowing for even more rapid and deeper emissions cuts. In particular, the decreased consumption of animal products and less food waste (SDG 12), and the protection of high biodiversity ecosystems such as primary forests (SDG 15) deliver high synergies with GHG abatement. On the other hand, protection of highly biodiverse ecosystems from conversion (SDG 15) limits the global biomass potentials for bioenergy (Frank et al. 2021), and while several forestry measures enhancing woody biomass supply for bioenergy may have synergies with improving ecosystems conditions, many represent a threat to biodiversity (Camia et al. 2020) (Sections 7.6.5 and 17.3.3.7, Figure 17.1 and Supplementary Material Table 17.SM.1).
7.5.4Regional AFOLU Abatement for Different Carbon Prices
At the regional level (Figure 7.16), the highest potential from non-CO2 emissions abatement, and mostly from CH4, is reported for ASIA with the median of mitigation potential observations from CH4 increasing up to a price of USD200 in the year 2050, reaching a median of 1.2 GtCO2-eq yr –1. In terms of economic potential, ASIA is followed by LAM, AFRICA, and OECD+EU, where emission reduction mainly is achieved in the livestock sector.
The highest potentials from land-related CO2 emissions, including avoided deforestation as well as afforestation, can be observed in LAM and AFRICA with strong responses of mitigation (indicated by the median value) to carbon prices mainly in the lower range of displayed carbon prices. In general, CO2 mitigation potentials show a wide range of results in comparison to non-CO2 mitigation potentials, but mostly also a higher median value. The most extreme ranges are reported for the regions LAM and AFRICA. A medium potential is reported for ASIA and OECD+EU, while REF has the smallest potential according to model submissions. These estimates reflect techno-economic potentials and do not necessarily include feasibility constraints which are discussed in Chapter 7.6.

Figure 7.16 | Regional mitigation efforts for CO2, CH4and N2O emissions (in CO2-eq yr–1using IPCC AR6 GWP100 values) from the AFOLU sector for increasing carbon price levels for 2030 and 2050. Underlying datapoints are generated by comparing emissions between a policy scenario and a related benchmark scenario, mapping these differences with the respective carbon price differences. Boxplots show Medians (vertical line within the boxes), Means (dots), 33%–66% intervals (box) and 10%–90% intervals (horizontal lines) for respective scenarios of carbon prices implemented in intervals of USD50 from a price of USD0 to USD250. Regions: Asia (ASIA), Latin America and Caribbean (LAM), Middle East (MIDDLE_EAST), Africa (AFRICA), Developed Countries (OECD 90 and EU) (OECD+EU) and Reforming Economies of Eastern Europe and the Former Soviet Union (REF).
7.5.5Illustrative Mitigation Pathways
Different mitigation strategies can achieve the net emission reductions that would be required to follow a pathway limiting global warming, with very different consequences for the land system. Figure 7.17 shows Illustrative Mitigation Pathways (IMPs) for achieving different climate targets highlighting AFOLU mitigation strategies, resulting GHG and land-use dynamics as well as the interaction with other sectors. For consistency this chapter discusses IMPs as described in detail in chapters 1 and 3 of this report but focusing on the land-use sector. All pathways are assessed by different IAM realisations and do not only reduce GHG emissions but also use CDR options, whereas the amount and timing varies across pathways, as do the relative contributions of different land-based CDR options.

Figure 7.17 | Evolution and breakdown of (a) global land-based GHG emissions and removals and (b) global land-use dynamics under four Illustrative Mitigation Pathways, which illustrate the differences in timing and magnitude of land-based mitigation approaches including afforestation and BECCS. All pathways are based on different IAM realisations: ModAct scenario (below 3.0°C, C6) from IMAGE 3.0; IMP Neg-2.0 (limit warming to 2°C (>67%), C3) from AIM/CGE 2.2; IMP Ren (1.5°C with no or low overshoot, C1) from REMIND-MAgPIE 2.1–4.3; IMP SP (1.5°C with no or low overshoot, C1) from REMIND-MAgPIE 2.1–4.2. In panel A the categories CO2AFOLU, CH4AFOLU and N2O AFOLU include GHG emissions from land-use change and agricultural land use (including emissions related to bioenergy production). In addition, the category CO2Land includes removals due to afforestation/reforestation. BECCS reflects the CO2 emissions captured from bioenergy use and stored in geological deposits. CH4 and N2O emissions are converted to CO2-eq using GWP100 factors of 27 and 273 respectively.
The scenario ModAct (limit warming to 3°C (>50%), C6) is based on the prolongation of current trends (SSP2) but contains measures to strengthen policies for the implementation of National Determined Contributions (NDCs) in all sectors including AFOLU (Grassi et al. 2018). This pathway shows a strong decrease of CO2 emissions from land-use change in 2030, mainly due to reduced deforestation, as well as moderately decreasing N2O and CH4 emissions from agricultural production due to improved agricultural management and dietary shifts away from emissions-intensive livestock products. However, in contrast to CO2 emissions, which turn net-negative around 2050 due to afforestation/reforestation, CH4 and N2O emissions persist throughout the century due to difficulties of eliminating these residual emissions based on existing agricultural management methods (Frank et al. 2017; Stevanović et al. 2017). Comparably small amounts of BECCS are applied by the end of the century. Forest area increases at the cost of other natural vegetation.
IMP-Neg is similar to ModAct scenario in terms of socio-economic setting (SSP2) but differs strongly in terms of the mitigation target (limit warming to 2°C (>67%), C3) and its strong focus on the supply side of mitigation measures with strong reliance on net-negative emissions. Consequently, all GHG emission reductions as well as afforestation/reforestation and BECCS-based CDR start earlier in time at a higher rate of deployment. However, in contrast to CO2 emissions, which turn net-negative around 2030 due to afforestation/reforestation, CH4 and N2O emissions persist throughout the century, similar to ModAct , due to ongoing increasing demand for total calories and animal-based commodities (Bodirsky et al. 2020) and difficulties of eliminating these residual emissions based on existing agricultural management methods (Stevanović et al. 2017; Frank et al. 2017). In addition to abating land-related GHG emissions as well as increasing the terrestrial sink, this example also shows the potential importance of the land sector in providing biomass for BECCS and hence CDR in the energy sector. Cumulative CDR (2020–2100) amounts to 502 GtCO2 for BECCS and 121 GtCO2 for land-use change (including afforestation and reduced deforestation). In consequence, compared to ModAct scenario , competition for land is increasing and much more other natural land as well as agricultural land (cropland and pasture land) is converted to forest or bioenergy cropland with potentially severe consequences for various sustainability dimensions such as biodiversity (Hof et al. 2018) and food security (Fujimori et al. 2019).
IMP-Ren is similar to IMP Neg-2.0 in terms of socio-economic setting (SSP2) but differs substantially in terms of mitigation target and mitigation efforts in the energy sector. Even under the more ambitious climate change mitigation target (1.5°C with no or low overshoot (OS), C1), the high share of renewable energy in IMP Ren strongly reduces the need for large-scale land-based CDR, which is reflected in smaller bioenergy and afforestation areas compared to IMP Neg-2.0. However, CH4 and N2O emissions from AFOLU persist throughout the century, similar to ModAct scenario and IMP Neg-2.0.
In contrast to IMPs Neg-2.0 and Ren, IMP SP (Soergel et al. 2021; 1.5°C with no or low OS, C1) displays a future of generally low resource and energy consumption (including healthy diets with low animal-calorie shares and low food waste) as well as significant but sustainable agricultural intensification in combination with high levels of nature protection. This pathway shows a strong near-term decrease of CO2 emissions from land-use change, mainly due to reduced deforestation, and in difference to all other IMPs described in this chapter strongly decreasing N2O and CH4 emissions from agricultural production due to improved agricultural management but also based on dietary shifts away from emissions-intensive livestock products as well as lower shares of food waste. In consequence, comparably small amounts of land are needed for land demanding mitigation activities such as BECCS and afforestation. In particular, the amount of agricultural land converted to bioenergy cropland is smaller compared to other mitigation pathways. Forest area increases either by regrowth of secondary vegetation following the abandonment of agricultural land or by afforestation/reforestation at the cost of agricultural land.
7.6Assessment of Economic, Social and Policy Responses
7.6.1Retrospective in Policy Efforts and Achieved Mitigation Within AFOLU
Since the establishment of the UNFCCC, international agencies, countries, sub-national units and NGO’s have developed policies to facilitate and encourage GHG mitigation within AFOLU (Figure 7.18). Early guidance and policies focused on developing GHG inventory methodology with some emphasis on afforestation and reforestation projects, but the Clean Development Mechanism (CDM) in the Kyoto Protocol focused attention on emission reduction projects, mostly outside of AFOLU. As successive IPCC AR6 WGIII reports illustrated large potential for AFOLU mitigation, methods to quantify and verify carbon emission reductions emerged within several projects in the early 2000s, through both voluntary (e.g., the Chicago Climate Exchange (CCX)) and regulated (e.g., New South Wales and California) markets. The CDM dedicated large attention to LULUCF, including dedicated methodologies and bodies. The reasons for limited uptake of CDM afforestation/reforestation projects were multiple and not limited to the regulatory constraints, but also due to the low abatement potential (poor cost/performance ratio) compared to other mitigation opportunities.

Figure 7.18 | Milestones in policy development for AFOLU measures. ‘ag.’ and ‘agri.’ = agriculture.
Following COP 13 in Bali, effort shifted to advancing policies to reduce deforestation and forest degradation (REDD+) in developing countries. According to Simonet et al. (2019), nearly 65 Mha have been enrolled in REDD+ type programmes or projects funded through a variety of sources, including United Nations Programme on Reducing Emissions from Deforestation and Forest Degradation (UN-REDD), the World Bank Forest Carbon Partnership Facility, and bi-lateral agreements between countries with Norway being the largest donor. While there has been considerable focus on forest and agricultural project-based mitigation actions, national governments were encouraged to incorporate project-based approaches with other sectoral strategies in their Nationally Appropriate Mitigation Actions (NAMAs) after 2012. NAMAs reflect the country’s proposed strategy to reduce net emissions across various sectors within their economy (e.g., forests or agriculture). More recently, Nationally Determined Contributions (NDCs) indicate whether individual countries plan to use forestry and agricultural policies or related projects amongst a set of measures in other sectors, to reduce their net emissions as part of the Paris Agreement (e.g., Forsell et al. 2016; Fyson and Jeffery 2019).
The many protocols now available can be used to quantify the potential mitigation to date resulting from various projects or programs. For instance, carbon registries issue credits using protocols that typically account for additionality, permanence and leakage, thus providing evidence that the projects are a net carbon benefit to the atmosphere. Protocol development engages the scientific community, project developers, and the public over a multi-year period. Some protocols have been revised multiple times, such as the USA State of California’s forest carbon protocol, which is in its fifth revision, with the latest in 2019 (see http://www.climateactionreserve.org/how/protocols/forest/). Credits from carbon registries feed into regulatory programs, such as the cap and trade programme in California, or voluntary offset markets (Hamrick and Gallant 2017a). Although AFOLU measures have been deployed across a range of projects and programmes globally to reduce net carbon emissions, debate about the net carbon benefits of some projects continues (e.g., Krug 2018).
A new assessment of projects over the last two decades finds emission reductions or offsets of at least 7.9 GtCO2-eq (using GWP100 and a mix of IPCC values for CH4 and N2O) over the last 12 years due to agricultural and forestry activities (Table 7.4). More than 80% of these emission reductions or offsets have been generated by forest-based activities. The total amounts to 0.66 GtCO2 yr –1 for the period 2010–2019, which is 1.2% of total global, and 5.5% of AFOLU emissions reported in Table 7.1, over the same time period (high confidence).
The array of activities in Table 7.4 includes the Clean Development Mechanism, REDD+ activities reported in technical annexes of country biennial update reports to the UNFCCC, voluntary market transactions, and carbon stored as a result of carbon markets in Australia, New Zealand and California in the USA. Although other countries and sub-national units have developed programmes and policies, these three regions are presented due to their focus on forest and agricultural carbon mitigation, their use of generally accepted protocols or measures and the availability of data to quantify outcomes.
The largest share of emission reductions or carbon offsets in Table 7.4 has been from slowing deforestation and REDD+, specifically from efforts in Brazil (86% of total), which substantially reduced deforestation rates between 2004 and 2012 (Nepstad et al. 2014), as well as other countries in Latin America. With the exception of Roopsind et al. (2019), estimated reductions in carbon emissions from REDD+ in Table 7.4 are measured relative to a historical baseline. As noted in Brazil’s Third Biennial Update Report (Ministry of Foreign Affairs 2019), estimates are made in accordance with established methodologies to determine the benefits of results-based REDD+ payments to Brazil. REDD+ estimates from other countries also have been derived from biennial update reports.
Regulatory markets provide the next largest share of carbon removal to date. Data from the Australia Emissions Reduction Fund are carbon credits issued in for agricultural, and vegetation and savanna burning projects. In the case of California, offset credits from forest and agricultural activities, using methods approved by a third-party certification authority (Climate Action Reserve), have been allowed as part of their state-wide cap and trade system. Transaction prices for forest and agricultural credits in California were around USD13 tCO2–1 in 2018, and represented 7.4% of total market compliance. By the end of 2018, 80 MtCO2 had been used for compliance purposes.
For New Zealand, the carbon reduction in Table 7.4 represents forest removals that were surrendered from post-1989 forests between 2008 and the 2020. Unlike offsets in voluntary markets or in California, where permanence involves long-term contracts or insurance pools, forests in the New Zealand market liable for emissions when harvested or following land-use change. This means sellers account for future emission risks related to harvesting when they enter forests into carbon contracts. Offset prices were around USD13 tCO2–1 in 2016 but have risen to more than USD20 tCO2–1 in 2020.
The voluntary market data in Table 7.4 are offsets developed under the major standard-setting organisations, and issued from 2008–2018 (e.g., Hamrick and Gallant 2018). Note that there is some potential for double counting of voluntary offsets that may have been transacted in the California compliance market, however this would only have applied to transactions of US-issued offsets, and the largest share of annual transactions of voluntary AFOLU credits occurs with credits generated in Latin America, followed by Africa, Asia and North America. Europe and Oceania have few voluntary carbon market transactions. Within forestry and agriculture, most of the voluntary offsets were generated by forestry projects. Using historical transaction data from various Forest Trends reports, the offsets generated were valued at USD46.9 million yr –1. Prices for voluntary offset transactions in the period 2014–2016 ranged from USD4.90 to USD5.40 tCO2–1 (Hamrick and Gallant 2017a).
Voluntary finance has amounted to USD0.5 billion over a 10-year period for development of forest and agricultural credits. The three regulatory markets quantified amount to USD2.7 billion in funding from 2010 to 2019. For the most part, this funding has focused on forest projects and programs, with agricultural projects accounting for 5–10% of the total. In total, reported funding for AFOLU projects and programmes has been USD4.4 billion over the past decade, or about USD569 million yr –1 (low confidence). The largest share of the total carbon includes efforts in the Amazon by Brazil. Government expenditures on regulatory programmes and business expenditures on voluntary programmes in Brazil (e.g., the soy or cattle moratoriums) were not included in financing estimates due to difficulties obtaining that data. If Brazil and CDM (for which we have no cost estimates) are left out of the calculation, average cost per ton has been USD3.20 tCO2–1.
The large number of policy approaches described in Table 7.4 combined with efforts by other international actors, such as the Global Environmental Facility (GEF), as well as non-state actors (e.g., eco-labelling programmes and corporate social responsibility initiatives) illustrate significant policy experimentation over the last several decades. Despite widespread effort, AFOLU measures have thus far failed to achieve the large potential for climate mitigation described in earlier IPCC WG III reports ( high confidence). The limited gains from AFOLU to date appear largely to result from lack of investment and other institutional and social barriers, rather than methodological concerns (high confidence).
Table 7.4 | Estimates of achieved emission offsets or reductions in AFOLU through 2018. Data include CDM, voluntary carbon standards, compliance markets, and reduced deforestation from official UNFCCC reports. Carbon sequestration due to other government policies not included.
Fund/mechanism | Total emission reductions or offsets (MtCO2-eq) | Time frame | MtCO2-eq yr–1 | Financing (million USD yr–1) |
CDM-forest a | 11.3 | 2007–2015 | 1.3 | – |
CDM-agriculture a | 21.8 | 2007–2015 | 2.4 | – |
REDD+ (Guyana)b | 12.8 | 2010–2015 | 2.1 | 33.0 |
Reduced Deforestation/REDD+ Brazil c | 6894.5 | 2006–2017 | 574.5 | 49.2 |
REDD+ Indonesia c | 244.9 | 2013–2017 | 49.0 | 13.4 |
REDD+ Argentina c | 165.2 | 2014–2015 | 55.1 | 1.4 |
REDD+ Others c | 211.8 | 2010–2017 | 26.5 | 46.0 |
Voluntary Market d | 95.3 | 2009–2018 | 9.5 | 46.9 |
Australia ERFe | 42.7 | 2012—2019h | 6.1 | 53.6 |
California f | 122.2 | 2013–2018 | 20.4 | 227.1 |
New Zealand carbon trading g | 83.9 | 2010–2019 | 8.4 | 101.7 |
Total | 7,897.4 | 2007–2018 | 658.1 h | 569.1 |
aClean Development Mechanism Registry: (accessed 22 June 2021).
cUNFCCC REDD+ Web Platform (https://redd.unfccc.int/submissions.html) and UNFCCC Biennial Update Report database (https://unfccc.int/BURs).
d (Hamrick and Gallant 2017a). State of Forest Carbon Finance. Forest Trends Ecosystem Marketplace. Washington, DC, USA.
eData for Australia carbon credit units (ACCUs) from Australia Emissions Reduction Fund Registry for agricultural and vegetation and savanna burning projects through FY2018/19 (downloaded on 24/10/2019): (http://www.cleanenergyregulator.gov.au/ERF/project-and-contracts-registers/project-register) and from Emissions Reduction Fund auction results to December 2018: (http://www.cleanenergyregulator.gov.au/ERF/auctions-results/december-2018).
f Data from the California Air Resources Board Offset Issuance registry (https://ww2.arb.ca.gov/our-work/programs/compliance-offset-program) for forestry and agricultural early action and compliance credits.
g Surrendered forest carbon credits from post-1989 forests in New Zealand. Obtained from New Zealand Environmental Protection Authority. ETS Unit Movement interactive report (Excel based). https://www.epa.govt.nz/industry-areas/emissions-trading-scheme/ets-reports/unit-movement/.
hObtained 13/08/2020. All non-CO2 gases are converted to CO2-eq using IPCC GWP100 values recommended at the time the project achieved approval by the relevant organisation or agency.
7.6.2Review of Observed Policies and Policy Instruments
7.6.2.1Economic Incentives
Emissions Trading/Carbon Taxes. While emissions trading programmes have been developed across the globe, forest and agriculture have not been included as part of the cap in any of the existing systems. However, offsets from forestry and agriculture have been included in several of the trading programs. New Zealand has a hybrid programme where carbon storage in forests can be voluntarily entered into the carbon trading program, but once entered, forests are counted both as a sink for carbon if net gains are positive, and a source when harvesting occurs. New Zealand is considering rules to include agricultural GHG emissions under a future cap (Henderson et al. 2020; see: https://www.agmatters.nz/topics/he- waka-eke-noa/).
The state of California has developed a formal cap and trade programme that allows a limited number of forest and agricultural offset credits to be used under the cap. All offsets must meet protocols to account for additionality, permanence and leakage. Forest projects used as offsets in California currently are located in the USA, but the California Air Resources Board adopted a tropical forest carbon standard, allowing for avoided deforestation projects from outside the USA to enter the California market (CARB 2019).
Canadian provinces have developed a range of policy options that can include carbon offsets. Quebec has an emissions trading programme that plans to allow forest and agricultural offsets generated within the province to be utilised. Alberta also allows offsets to be utilised by regulated sectors while British Columbia allows offsets to be utilised by the government for its carbon neutrality goals (Government of Alberta, 2021). Over 20 countries and regions have adopted explicit carbon taxes on carbon emission sources and fossil fuels, however, the charges have not been applied to non-CO2 agricultural emissions (OECD 2021a). California may implement regulations on methane emissions from cattle, however, regulations if approved, will not go into effect until 2024. Institutional and trade-related barriers (e.g., leakage) likely will limit widespread implementation of taxes on emissions in the food sector globally. Many countries exempt purchases of fuels used in agricultural or fishery production from fuel or carbon taxes, thus lowering the effective tax rate imposed on those sectors (OECD 2021a). Furthermore, bioenergy, produced from agricultural products, agricultural waste, and wood is often exempted from explicit carbon taxes. Colombia recently implemented a carbon tax on liquid fuels but allowed domestically produced forestry credits to offset the tax. Colombia also is in the process of developing an emissions trading scheme (OECD 2021a).
REDD+/Payment for Ecosystem Services (PES). PES programmes for a variety of ecosystem services have long been utilised for conservation (e.g., Wunder 2007) and may now be as large as USD42 billion yr –1 (Salzman et al. 2018). REDD+ emerged in the early 2000s and is a widely recognised example of PES programme focused on conservation of tropical forests (Table 7.4). However, our summation of actually paid funds in Table 7.4 is much smaller than what is portrayed by Salzman et al. (2018). REDD+ may operate at the country level, or for specific programmes or forests within a country. As with other PES programs, REDD+ has evolved towards a results-based programme that involves payments that are conditioned on meeting certain successes or milestones, such as rates of deforestation (Angelsen 2017).
A large literature has investigated whether PES programmes have successfully protected habitats. Studies in the USA found limited additionality for programmes that encouraged conservation tillage practices, but stronger additionality for programmes that encouraged set-asides for grasslands or forests (Woodward et al. 2016; Claassen et al. 2018), although the set-asides led to estimated leakage of 20 up to 100% (Pfaff and Robalino 2017; Kallio et al. 2018; Wu 2000). Evidence from the EU similarly suggests that payments for some agroenvironmental practices may be additional, while others are not (Chabé-Ferret and Subervie 2013). Other studies, in particular in Latin America where many PES programmes have been implemented, have found a wide range of estimates of effectiveness (e.g., Honey-Rosés et al. 2011; Robalino and Pfaff 2013; Alix-Garcia et al. 2015; Robalino et al. 2015; Mohebalian and Aguilar 2016; Jayachandran et al. 2017; Börner et al. 2017; Burivalova et al. 2019). Despite concerns, the many lessons learned from PES programme implementation provide critical information that will help policymakers refine future PES programmes to increase their effectiveness (medium confidence).
While expectations that carbon-centred REDD+ would be a simple and efficient mechanism for climate mitigation have not been met (Turnhout et al. 2017; Arts et al. 2019), progress has nonetheless occurred. Measuring, monitoring and verification systems have been developed and deployed, REDD readiness programmes have improved capacity to implement REDD+ on the ground in over 50 countries, and a number of countries now have received results-based payments.
Empirical evidence that REDD+ funding has slowed deforestation is starting to emerge. Simonet et al. (2019) showed that a REDD+ project in Brazil reduced deforestation certainly until 2018, while Roopsind et al. (2019) showed that country-level REDD+ payments to Guyana encouraged reduced deforestation and increased carbon storage. Although more impact evaluation (IE) analysis needs to be conducted on REDD+ payments, these studies support the country-level estimates of carbon benefits from REDD+ shown in Table 7.4. Nearly all of the analysis of PES and REDD+ to date has focused on the presence or absence of forest cover, with little to no analysis having been conducted on forest degradation, conservation, or enhancement of forest stocks.
Agroenvironmental Subsidy Programs/PES. Climate policy for agriculture has developed more slowly than in other sectors due to concerns with food security and livelihoods, political interests, and difficulties in coordinating diffuse and diverse activities and stakeholders (e.g., nutritional health, rural development, and biodiversity conservation) (Leahy et al. 2020). However, a review of the National Adaptation Programme of Action (NAPAs), National Adaptation Plans (NAPs), NAMAs, and NDCs in the Paris Agreement suggest an increasing focus of policy makers on agriculture and food security. The vast majority of parties to the Paris Agreement recognise the significant role of agriculture in supporting a secure sustainable development pathway (Richards and VanWey 2015) with the inclusion of agriculture mitigation in 103 NDCs from a total of 160 NDC submissions. Livestock is the most frequently cited specific agricultural sub-sector, with mitigation activities generally focusing on increasing efficiency and productivity.
Agriculture is one of the most subsidised industries globally, especially in the European Union and the USA. While subsidy payments over the last 20 years have shifted modestly to programmes designed to reduce the environmental impact of the agricultural sector, only 15–20% of the more than USD700 billion spent globally on subsidies are green payments (OECD 2021b). Under the Common Agricultural Policy in the EU, up to 30% of the direct payments to farmers (Pillar 1) have been green payments (Henderson et al. 2020), including some actions that could increase carbon storage or reduce emissions. Similarly, at least 30% of the rural development payments (Pillar 2) are used for measures that reduce environmental impact, including reduction of GHG emissions and carbon storage. There is limited evidence that these policies contributed to the 20% reduction in GHG emissions from the agricultural sector in the EU between 1990 and 2018 (Baudrier et al. 2015; Eurostat 2020).
The USA spends USD4 billion yr –1 on conservation programs, or 12% of net farm income (Department of Agriculture 2020). In real terms, this expenditure has remained constant for 15 years, supporting 12 Mha of permanent grass or woodland cover in the Conservation Reserve Program (CRP), which has increased soil carbon sequestration by 3 tCO2 ha –1 yr –1 (Conant et al. 2017; Paustian et al. 2019), as well as other practices that could lower net emissions. Gross GHG emissions from the agricultural sector in the US, however, have increased since 1990 (USEPA 2020) due to reductions in the area of land in the US CRP programme and changes in crop rotations, both of which caused soil carbon stocks to decline (USEPA 2020). When combined with increased non-CO2 gas emissions, the emission intensity of US agriculture increased from 1.5 to 1.7 tCO2 ha –1 between 2005 and 2018 (high confidence).
China has implemented large conservation programmes that have influenced carbon stocks. For example, the Sloping Land Conversion Program, combined with other programs, has increased forest cover and carbon stocks, reduced erosion and increased other ecosystem services in China in recent years (Ouyang et al. 2016). As part of Brazil’s national strategy, numerous practices to reduce GHG emissions from agriculture, and in particular from the animal agriculture industry, have been subsidised. Estimates by Manzatto et al. (2020) suggest that the programme may have reduced agricultural emissions by 169 MtCO2 between 2010 and 2020. Given the large technical and economic potential for agroforestry to be deployed in Africa, subsidy approaches could be deployed along with other polices to enhance carbon through innovative practices such as regreening (Box 7.10).
7.6.2.2Regulatory Approaches
Regulations on land use include direct controls on how land is used, zoning, or legally set limits on converting land from one use to another. Since the early 2000s, Brazil has deployed various regulatory measures to slow deforestation, including enforcement of regulations on land-use change in the legal Amazon area. Enforcement of these regulations, among other approaches is credited with encouraging the large-scale reduction in deforestation and associated carbon emissions after 2004 (Nepstad et al. 2014). Empirical evidence has found that regulations reduced deforestation in Brazil (Arima et al. 2014) but over time, reversals occurred when enforcement was not consistent (Azevedo et al. 2017) (Box 7.9).
Many OECD countries have strong legal frameworks that influence agricultural and forest management on both public and private land. These include for example, legal requirements to protect endangered species, implement conservation tillage, protect riparian areas, replant forests after harvest, maintain historical species composition, forest certification, and other approaches. Increasingly, laws support more widespread implementation of nature-based solutions for a range of environmental issues (e.g., see European Commission-EU 2021). The extent to which the combined influence of these regulations has enhanced carbon storage in ecosystems is not quantified although they are likely to explain some of the persistent carbon sink that has emerged in temperate forests of OECD countries ( high confidence). In the least developed and developing countries, regulatory approaches face challenges in part because environmental issues are a lower priority than many other socio-economic issues (e.g., poverty, opportunity, essential services), and weak governance (Mayer Pelicice 2019; Walker et al. 2020) (Box 7.2).
Set asides and protected areas have been a widely utilised approach for conservation, and according to (FAO 2020d), 726 Mha (18%) of forests are in protected areas globally. A review of land sparing and land sharing policies in developing countries indicated that most of them follow land sparing models, sometimes in combination with land sharing approaches. However, there is still no clear evidence of which policy provides the best results for ecosystem services provision, conservation, and livelihoods (Mertz and Mertens 2017). The literature contains a wide range of results on the effectiveness of protected areas to reduce deforestation (Burivalova et al. 2019), with studies suggesting that protected areas provide significant protection of forests (e.g., Blackman 2015), modest protection (Andam et al. 2008), as well as increases in deforestation (Blackman 2015) and possible leakage of harvesting to elsewhere (Kallio et al. 2018). An estimate of the contributions of protected areas to mitigation between 2000 and 2012, showed that in the tropics, PAs reduced carbon emissions from deforestation by 4.88 PgC, or around 29%, when compared to the expected rates of deforestation (Bebber and Butt 2017). In that study, the tropical Americas (368.8 TgC yr −1) had the largest contribution, followed by Asia (25.0 TgC yr −1) and Africa (12.7 TgC yr −1). The authors concluded that local factors had an important influence on the effectiveness of protected areas. For example, in the Brazilian Amazon, protected area effectiveness is affected by the government agency controlling the land (federal indigenous lands, federal PAs, and state PAs) (Herrera et al. 2019). Because protected areas limit not just land-use change, but also logging or harvesting non-timber forest products, they may be relatively costly approaches for forest conservation (medium confidence).
Community forest management (CFM) allows less intensive use of forest resources, while at the same time providing carbon benefits by protecting forest cover. Community forest management provides property rights to communities to manage resources in exchange for their efforts to protect those resources. In many cases, the local communities are indigenous people who otherwise would have insecure tenure due to an advancing agricultural frontier or mining activity. Other examples are forest owner associations like those discussed in Box 7.8. According to the Rights and Resources Initiative (2018), the area of forests under community management increased globally by 152 Mha from 2002 to 2017, with over 500 Mha under community management in 2017. Studies have now shown that improved property rights with community forest management can reduce deforestation and increase carbon storage (Deininger and Minten 2002; Alix-Garcia et al. 2005; Alix-Garcia 2007; Bowler et al. 2012; Blackman 2015; Fortmann et al. 2017; Burivalova et al. 2019). Efforts to expand property rights, especially community forest management, have reduced carbon emissions from deforestation in tropical forests in the last two decades ( high confidence), although the extent of carbon savings has not been quantified globally.
Bioenergy targets. Multiple policies have been enacted at national and supra-national levels to promote the use of bioenergy in the transport sector, and for bioelectricity production. Existing policies mandate or subsidise the production and use of bioenergy. In the past few years, policies have been proposed, put in place or updated in Australia (Renewable Energy Target), Brazil (RenovaBio, Nationally Determined Contribution), Canada (Clean Fuel Standard), China (Biodiesel Industrial Development Policy, Biodiesel Fuel Blend Standard), the European Union (Renewable Energy Directive II), the USA (Renewable Fuel Standards), Japan (FY2030), Russia (Energy Strategy Bill 2035), India (Revised National Policy on Biofuels), and South Africa (Biofuels Regulatory Framework).
While current policies focus on bioenergy to decarbonise the energy system, some also contain provisions to minimise the potential environmental and social trade-offs from bioenergy production. For instance, the EU Renewable Energy Directive (EU-RED II) and US Renewable Energy Standard (US-RFS) assign caps on the use of biofuels, which are associated with indirect land-use change and food-security concerns. The Netherlands has a stringent set of 36 sustainability criteria to which the certified biomass needs to comply. The EU-RED II also sets a timeline for the complete phase-out of high-risk biofuels (Section 7.4.4).
7.6.2.3Voluntary Actions and Agreements
Forest certification programs, such as Forest Sustainability Council (FSC) or Programme for the Endorsement of Forest Certification (PEFC), are consumer driven, voluntary programmes that influence timber harvesting practices, and may reduce emissions from forest degradation with reduced impact logging and other approaches (medium confidence). Forest certification has expanded globally to over 440 Mha (Kraxner et al. 2017). As the area of land devoted to certification has increased, the amount of timber produced from certified land has increased. In 2018, FSC accounted for harvests of 427 million m 3 and jointly FSC and PEFC accounted for 689 million m 3 in 2016 or around 40% of total industrial wood production (FAO 2018c). There is evidence that reduced impact logging can reduce carbon losses in tropical regions (Pearson et al. 2014; Ellis et al. 2019). However, there is conflicting evidence about whether forest certification reduces deforestation (e.g., Blackman et al. 2018; Tritsch et al. 2020).
Supply chain management in the food sector encourages more widespread use of conservation measures in agriculture ( high confidence). The number of private commitments to reduce deforestation from supply chains has greatly increased in recent years, with at least 865 public commitments by 447 producers, processors, traders, manufacturers and retailers as of December, 2020 (New York Declaration on Forests 2021). Industry partnerships with NGOs, such as the Roundtable on Sustainable Palm Oil (RSPO), have become more widespread and visible in agricultural production. For example, RSPO certifies members all along the supply chain for palm oil and claims around 19% of total production. Similar sustainability efforts exist for many of the world’s major agricultural products, including soybeans, rice, sugar cane, and cattle.
There is evidence that the Amazon Soy Moratorium (ASM), an industry-NGO effort whereby large industry consumers agreed voluntarily not to purchase soybeans grown on land deforested after 2006, reduced deforestation in the legal Amazon (Nepstad et al. 2014; Gibbs et al. 2015). However, recent studies have shown that some deforestation from the Amazon was displaced to the Cerrado (Brazilian savannas) region (Moffette and Gibbs 2021), which is a global hotspot for biodiversity, and has significant carbon stocks. These results illustrate the importance of broadening the scope of supply chain management to minimise or eliminate displacement (Lima et al. 2019). In addition, while voluntary efforts may improve environmental outcomes for a time, it is not clear that they are sufficient to deliver long-term reductions in deforestation, given the increases in deforestation that have occurred in the Amazon in recent years (Box 7.9). Voluntary efforts would be more effective at slowing deforestation if they present stronger linkages to regulatory or other approaches (Lambin et al. 2018).
Box 7.8 | Management of Native Forests by the Menominee people in North America and Lessons From Forest Owner Associations
Summary of the case. Indigenous peoples include more than 5000 different peoples, with over 370 million people, in 70 countries on five continents (UNIPP 2012). For example, in Latin America and Caribbean, forests cover more than 80% of the area occupied by indigenous peoples (330 million hectares) (FAO and FILAC, 2021) which points to their critical role for forest governance (Garnett et al. 2018; Fa et al. 2020). The Menominee people (Wisconsin, USA) practice sustainable forestry on their reservation according to a land ethic integral to the tribal identity. The Tribe calls themselves ‘The Forest Keepers’, recognising that the connection of their future to the sustainable management of the forest that allowed the forest volume standing today to be higher than when timber harvesting began more than 160 years ago. Management practices are based on continuous forest inventories (Mausel et al. 2017).
Introduction to the case. Forest management and timber harvesting operations began shortly after the Menominee Indian Reservation was created by treaty in 1854. The Menominee reservation sits on about 95,000 ha of land in Wisconsin that spans multiple forest types and is more diverse than adjacent forests. The collectively maintained reservation has 87% of its land under sustained yield forestry.
Case description. The Tribe, in the 19th century, had already mastered vegetation manipulation with fire, sustainable forestry, multiple-use, ecosystem, and adaptive management. The centrepiece of the Tribe’s economy has been its forest product industry, Menominee Tribal Enterprises (MTE) (Pecore 1992). A balance between growth and removals and continuous forest inventories (CFI) are central for forest management for the past 160 years, aiming not at very large volumes, but at very high-quality trees. During this same period, more than 2.3 billion board feet have been harvested from the same area, equivalent to 0.3 m 3 ha –1 yr –1.
Interactions and limitations. In 2013, the Menominee Tribe started a collaboration with the US Forest Service to implement climate adaptation measures. The Tribe actively works to reduce the risk of forest damage and decided to further promote diversity by planting tree seedlings adapted to a warming climate (https://toolkit.climate.gov/case-studies/and-trees-will-last-forever). However, new challenges are related to increasing pressures on forest ecosystems such as non-native insects, pathogens, weed invasions, and the costs for continuous forest inventories to support long-term forest management.
Identified lessons. The elements of sustainability are intertwined with Menominee history, culture, spirituality, and ethics. The balance between the environment, community, and economy for the short term as well as future generations is an example of protecting the entire environment as the Menominee land is a non-fragmented remnant of the prehistoric Lake States forest which has been dramatically reduced all around the reserve (Schabel and Pecore 1997). These and other types of community forest owner associations exist all over the world. Examples are Södra in Sweden (with 52,000 forest owners) (Södra, 2021) or Waldbauernverband in North-Rhine Westphalia (with 150,000 forest owners and covering 585,000 ha) (AGDW-The Forest Owners, 2021). These are ways for small forest owners to educate, jointly put wood on the market, employ better forest management, use machinery together, and apply certification jointly. In this manner and with all their diversity of goals, they manage to maintain carbon sinks and stocks, while preserving biodiversity and producing wood.
Box 7.9 | Case Study: Deforestation Control in the Brazilian Amazon
Summary
Between 2000 and 2004, deforestation rates in the Brazilian Legal Amazon (is a socio-geographic division containing all nine Brazilian states in the Amazon basin) increased from 18,226 to 27,772 km 2 yr –12008 (INPE, 2021). A set of public policies designed in participatory process involving federal government, states, municipalities, and civil society successfully reduced deforestation rates until 2012. However, deforestation rates increased after 2013, and particularly between 2019 and 2020. Successful deforestation control policies are being negatively affected by changes in environmental governance, weak law enforcement, and polarisation of the national politics.
Box 7.9 (Continued)
Background
In 2004, the Brazilian federal government started the Action Plan for Prevention and Control of Deforestation in the Legal Amazon (PPCDAm) (Ministry of Environment, Government of Brazil, 2018).
The PPCDAm was a benchmark for the articulation of forest conservation policies that included central and state governments, prosecutor offices, and the civil society. The decline in deforestation after 2008 is mostly attributed to these policy options. In 2012, deforestation rates decreased to 4,571 km 2 yr –1.
Case description
Combating deforestation was a theme in several programs, government plans, and projects not being more restricted to the environmental agenda. This broader inclusion resulted from a long process of insertion and articulation in the government dating back to 2003 while elaborating on the Sustainable Amazon Plan. In May 2003, a historic meeting took place in an Amazonian city, with the president of the Republic, state governors, ministers, and various business leaders, civil institutions, and social movements. It was presented and approved the document entitled ‘Sustainable Amazonia – Guidelines and Priorities of the Ministry of Environment for the Sustainable Development of the Amazon Brazilian’, containing several guidelines for conservation and sustainable use in the region. At the meeting, the Union and some states signed a Cooperation Agreement aiming to elaborate a plan for the Amazon, to be widely discussed with the various sectors of the regional and national society (Ministerio do Meio Ambiente, MMA, 2013).
Interactionsand limitations
The PPCDAm had three main lines of action: (i) territorial management and land use; (ii) command and control; and (iii) promotion of sustainable practices. During the execution of the 1st and 2nd phases of the PPCDAm (2004–2011), important results in the territorial management and land-use component included, for example, the creation of 25 Mha of federal Protected Areas (PAs) located mainly in front of the expansion of deforestation, as well as the homologation of 10 Mha of Indigenous Lands. Also, states and municipalities created approximately 25 Mha, so that all spheres of government contributed to the expansion of PAs in the Brazilian Amazon. In the ‘command and control’ component, agencies performed hundreds of inspection operations against illegal activities (e.g., illegal logging) under strategic planning based on technical and territorial priorities. Besides, there was a significant improvement of the environmental monitoring systems, involving the analysis of satellite images to guide actions on the ground. Another policy was the restriction of public credit to enterprises linked to illegal deforestation following a resolution of the Brazilian Central Bank (2008) (Ministerio do Meio Ambiente, MMA, 2013). Also, in 2008, Brazil created the Amazon Fund, a REDD+ mechanism (Government of Brazil, n.d.).
However, the country’s political polarisation has gradually eroded environmental governance, especially after the Brazilian Forest Code changes in 2012 (major environmental law in Brazil), the presidential impeachment in 2016, presidential elections in 2018, and the start of the new federal administration in 2019. Successful deforestation control policies are being negatively affected by critical changes in the political context, and weakening the environmental rule of law, forest conservation, and sustainable development programmes (for example, changes in the Amazon Fund governance in disagreement with the main donors). In 2019, the annual deforestation rate reached 10,129 km 2 being the first time it surpassed 10,000 km 2 since 2008 (INPE, 2021). Besides, there has been no effective transition from the historical economic model to a sustainable one. The lack of clarity in the ownership of land is still a major unresolved issue in the Amazon.
Lessons
The reduction of deforestation in the Brazilian Amazon was possible due to effective political and institutional support for environmental conservation. The initiatives of the Action Plan included the expansion of the protected areas network (conservation unities and indigenous lands), improvement of deforestation monitoring to the enforcement of environmental laws, and the use of economic instruments, for example, by cutting off public credit for municipalities with higher deforestation rates (Ricketts et al. 2010; Souza et al. 2013; Nepstad et al. 2014; Arima et al. 2014; Blackman and Veit 2018).
The array of public policies and social engagement was a historical and legal breakthrough in global protection. However, the broader political and institutional context and actions to reduce the representation and independent control of civil society movements in decision-making bodies weaken this structure with significant increases in deforestation rates, burnings, and forest fires.
Box 7.10 | Regreening the Sahel, Northern Africa
Case description
More than 200 million trees have regenerated on more than 5 Mha in the Sahel (Sendzimir et al. 2011). The Maradi/Zinder region of Niger is the epicentre of experimentation and scale up. This vast geographic extent generates significant mitigation potential despite the relatively modest per unit area increase in carbon of about 0.4 MgC ha –1 a –1 (Luedeling and Neufeldt 2012). In addition to the carbon benefits, these agroforestry systems decrease erosion, provide animal fodder, recharge groundwater, generate nutrition and income benefits and act as safety nets for vulnerable rural households during climate and other shocks (Bayala et al. 2014, 2015; Binam et al. 2015; Sinare and Gordon 2015; Ilstedt et al. 2016).
Lessons
A mélange of factors contributed to regreening in the Sahel. Increased precipitation, migration, community development, economic volatility and local policy reform have all likely played a role (Haglund et al. 2011; Sendzimir et al. 2011; Brandt et al. 2019a; Garrity and Bayala 2019); the easing of forestry regulations has been particularly critical in giving farmers greater control over the management and use of trees on their land (Garrity et al. 2010). This policy shift was catalysed by greater regional autonomy resulting from economic decline and coincided with successful pilots and NGO-led experimentation, cash-for-work, and training efforts to support changes in land management (Sendzimir et al. 2011). Participation of farmers in planning and implementation helped align actions with local knowledge and goals as well as market opportunities.
Regreening takes place when dormant seed or tree stumps sprout and are cultivated through the technique, called Farmer Managed Natural Regeneration (FMNR). Without planting new trees, FMNR is presumed to be cheaper than other approaches to restoration, though comparative economic analysis has yet to be conducted (Chomba et al. 2020). Relatively lower investment costs are believed to have contributed to the replication across the landscape. These factors worked together to contribute to a groundswell of action that affected rights, access, and use of local resources (Tougiani et al. 2009).
Regreening in the Sahel and the consequent transformation of the landscape has resulted from the actions of hundreds of thousands of individuals responding to social and biophysical signals (Hanan 2018). This is an example for climate change mitigation, where eliminating regulations – versus increasing them – has led to carbon dioxide removal.
7.6.2.4Mitigation Effectiveness: Additionality, Permanence and Leakage
Additionality, permanence and leakage have been widely discussed in the forestry and agricultural mitigation literature (Murray et al. 2007), including in AR5 (Section 11.3.2 of the AR5WGIII report) and earlier assessment reports. Since the earlier assessment reports, new studies have emerged to provide new insights on the effect of these issues on the credibility of forest and agricultural mitigation. This assessment also provides additional context not considered in earlier assessments.
Typically, carbon registries will require that project developers show additionality by illustrating that the project is not undertaken as a result of a legal requirement, and that the project achieves carbon reductions above and beyond a business as usual. The protocols developed by the California Air Resources Board to ensure permanence and additionality are strong standards and may even limit participation (e.g., Ruseva et al. 2017). The business as usual is defined as past management actions by the same entity that can be verified. Additionality can thus be observed in the future as a difference from historical actions. This approach has been used by several countries in their UNFCCC Biennial Update reports to establish reductions in carbon emissions from avoided deforestation (e.g., Brazil and Indonesia).
However, alternative statistical approaches have been deployed in the literature to assess additionality with a quasi-experimental method that rely on developing a counterfactual (e.g., Andam et al. 2008; Blackman 2015; Sills et al. 2015; Fortmann et al. 2017; Roopsind et al. 2019). In several studies, additionality in avoided deforestation was established after the project had been developed by comparing land-use change in treated plots where the policy or programme was in effect with land-use change in similar untreated plot. Alternatively, synthetic matching statistically compares trends in a treated region (i.e., a region with a policy) to trends in a region without the policy, and has been applied in a region in Brazil (e.g., Sills et al. 2015), and at the country level in Guyana (Roopsind et al. 2019). While these analyses establish that many projects to reduce deforestation have overcome hurdles related to additionality ( high confidence), there has not been a systematic assessment of the elements of project or programme design that lead to high levels of additionality. Such assessment could help developers design projects to better meet additionality criteria.
The same experimental methods have been applied to analyse additionality of the adoption of soil conservation and nutrient management practices in agriculture. Claassen et al. (2018) find that programmes to promote soil conservation are around 50% additional across the USA (i.e., 50% of the land enrolled in soil conservation programmes would not have been enrolled if not for the programme), while Woodward et al. (2016) find that adoption of conservation tillage is rarely additional. Claassen et al. (2018) find that payments for nutrient management plans are nearly 100% additional, although there is little evidence that farmers reduce nutrient inputs when they adopt plans. It is not clear if the same policy approaches would lead to additionality in other regions.
Permanence focuses on the potential for carbon sequestered in offsets to be released in the future due to natural or anthropogenic disturbances. Most offset registries have strong permanence requirements, although they vary in their specific requirements. The Verified Carbon Standard (VCS) from the Verra programme requires a pool of additional carbon credits that provides a buffer against inadvertent losses. The Climate Action Reserve (CAR) protocol for forests requires carbon to remain on the site for 100 years. The carbon on the site will be verified at pre-determined intervals over the life of the project. If carbon is diminished on a given site, the credits for the site have to be relinquished and the project developer has to use credits from their reserve fund (either other projects or purchased credits) to make up for the loss. Estimates of leakage in forestry projects in AR5 suggest that it can range from 10% to over 90% in the USA (Murray et al. 2004), and 20–50% in the tropics (Sohngen and Brown 2004) for forest set-asides and reduced harvesting. Carbon offset protocols have made a variety of assumptions. The Climate Action Reserve (CAR) assumes it is 20% in the USA. One of the voluntary protocols (Verra) uses specific information about the location of the project to calculate a location specific leakage factor.
More recent literature has developed explicit estimates of leakage based on statistical analysis of carbon projects or programs. The literature suggests that there are two economic pathways for leakage (e.g., (Roopsind et al. 2019), either through a shift in output price that occurs when outputs are affected by the policy or programme implementation, as described in (Wear and Murray 2004; Murray et al. 2004; Sohngen and Brown 2004; Gan and McCarl 2007), or through a shift in input prices and markets, such as for labour or capital, as analysed in (Andam et al. 2008; Alix-Garcia et al. 2012; Honey-Rosés et al. 2011; Fortmann et al. 2017). Estimates of leakage through product markets (e.g., timber prices) have suggested leakage of up to 90% (Sohngen and Brown 2004; Murray et al. 2004; Gan and McCarl 2007; Kallio et al. 2018), while studies that consider shifts in input markets are considerably smaller. The analysis of leakage for the Guyana programme by Roopsind et al. (2019) revealed no statistically significant leakage in Suriname. A key design feature for any programme to reduce leakage is to increase incentives for complementary mitigation policies to be implemented in areas where leakage may occur. Efforts to continue to draw more forests into carbon policy initiatives will reduce leakage over time Roopsind et al. (2019), suggesting that if NDCs continue to encompass a broader selection of policies, measures and forests over time, leakage will decline.
7.6.3Assessment of Current Policies and Potential Future Approaches
The Paris Agreement encourages a wide range of policy approaches, including REDD+, sustainable management of forests, joint mitigation and adaptation, and emphasises the importance of non-carbon benefits and equity for sustainable development (Martius et al. 2016). Around USD0.7 billion yr –1 has been invested in land-based carbon offsets (Table 7.4), but as noted in Streck (2012), there is a large funding gap between these efforts and the scale of efforts necessary to meet 1.5 or 2.0°C targets outlined in SR1.5. As Box 7.12 discusses, forestry actions could achieve up to 5.8 GtCO2 yr –1 with costs rising from USD178 billion yr –1 to USD400 billion yr –1 by 2050. Over half of this investment is expected to occur in Latin America, with 13% in SE Asia and 17% in sub-Saharan Africa (Austin et al. 2020). Other studies have suggested that similar sized programmes are possible, although they do not quantify total costs (e.g., Griscom et al. 2017 ; Busch et al. 2019). The currently quantified efforts to reduce net emissions with forests and agricultural actions are helpful, but society will need to quickly ramp up investments to achieve carbon sequestration levels consistent with high levels of mitigation. Only 2.5% of climate mitigation funding goes to land-based mitigation options, an order of magnitude below the potential proportional contribution (Buchner et al. 2015).
To date, there has been significantly less investment in agricultural projects than forestry projects to reduce net carbon emissions (Table 7.4). For example, the economic potential (available up to USD100 tCO2–1) for soil carbon sequestration in croplands is 1.9 (0.4–6.8) GtCO2 yr –1 (Section 7.4.3.1), however, less than 2% of the carbon in Table 7.4 is derived from soil carbon sequestration projects. While reductions in CH4 emissions due to enteric fermentation constitute a large share of potential agricultural mitigation reported in Section 7.4, agricultural CH4 emission reductions so far have been relatively modest compared to forestry sequestration. The protocols to quantify emission reductions in the agricultural sector are available and have been tested, and the main limitation appears to be the lack of available financing or the unwillingness to re-direct current subsidies (medium confidence).
Although quantified emission reductions in agricultural projects are limited to date, a number of OECD and economy in transition parties have reduced their net emissions through carbon storage in cropland soils since 2000. These reductions in emissions have typically resulted from policy innovations outside of the climate space, or market trends. For example, in the USA, there has been widespread adoption of conservation tillage in the last 30 years as a labour-saving crop management technique. In Europe, agricultural N2O and CH4 emissions have declined due to reductions in nutrient inputs and cattle numbers (Henderson et al. 2020). These reductions may be attributed to mechanism within the Common Agricultural Policy (Section 7.6.2.1), but could also be linked to higher nutrient prices in the 2000–2014 period. Other environmental policies could play a role, for example, efforts to reduce water pollution from phosphorus in The Netherlands, may ultimately reduce cattle numbers, also lowering CH4 emissions.
Numerous developing countries have established policy efforts to abate agricultural emissions or increase carbon storage. Brazil, for instance, developed a subsidy programme in 2010 to promote sustainable development in agriculture, and practices that would reduce GHG emissions. Henderson et al. (2020) report that this programme reduced GHG emission in agricultural by up to 170 MtCO2 between 2010 and 2018. However, the investments in low-carbon agriculture in Brazil amounted only 2% of the total funds for conventional agriculture in 2019. Programmes on deforestation in Brazil had successes and failures, as described in Box 7.9. Indonesia has engaged in a wide range of programmes in the REDD+ space, including a moratorium implemented in 2011 to prevent the conversion of primary forests and peatlands to oil palm and logging concessions (Wijaya et al. 2017; Tacconi and Muttaqin 2019; Henderson et al. 2020). Efforts to restore peatlands and forests have also been undertaken. Indonesia reports that results-based REDD+ programmes have been successful and have led to lower rates of deforestation (Table 7.4).
Existing policies focused on GHG management in agriculture and forestry is less advanced in Africa than in Latin American and Asia, however, Henderson et al. (2020) report on 10 countries in sub-Saharan Africa that have included explicit policy proposals for reducing AFOLU GHG emissions through their NDCs. These include efforts to reduce N2O emission, increase implementation of conservation agriculture, improve livestock management, and implement forestry and grassland practices, including agroforestry (Box 7.10). Within several of the NDCs, countries have explicitly suggested intensification as an approach to reduce emission in the livestock sector. However, it is important to note caveats associated with pursuing mitigation via intensification (Box 7.11).
The agricultural sector throughout the world is influenced by many policies that affect production practices, crop choices and land use. It is difficult to quantify the effect of these policies on reference level GHG emissions from the sector, as well as the cost estimates presented in Sections 7.4 and 7.5. The presence of significant subsidy programmes intended to improve farmer welfare and rural livelihoods makes it more difficult to implement regulatory programmes aimed at reducing net emissions in agriculture, however, it may increase the potential to implement new subsidy programmes that encourage practices aimed at reducing net emissions (medium confidence). For instance, in the USA, crop insurance can influence both crop choices and land use (Miao et al. 2016; Claassen et al. 2017), both of which will affect emission trends. Regulations to limit nutrient applications have not been widely considered, however, federal subsidy programmes have been implemented to encourage farmers to conduct nutrient management planning.
A factor that will influence future carbon storage in so-called land-based reservoirs involves considering short- and long-term climate benefits, as well as interactions among various natural climate solution options. The benefits of various natural climate solutions depend on a variety of spatially dependent issues as well as institutional factors, including their management status (managed or unmanaged systems), their productivity, opportunity costs, technical difficulty of implementation, local willingness to consider, property rights and institutions, among other factors. Biomass energy, as described elsewhere in this chapter and in (Cross-Working Group Box 3 in Chapter 12), is a potential example of an option with trade-offs that emerge when policies favour one type of mitigation strategy over another. Bioenergy production needs safeguards to limit negative impacts on carbon stocks on the land base as is already in place in the EU Renewable Energy Directive and several national schemes in Netherlands, UK and Denmark (Buchholz et al. 2016; Khanna et al. 2017; DeCicco and Schlesinger 2018; Favero et al. 2020). It is argued that a carbon tax on only fossil fuel derived emissions, may lead to massive deployment of bioenergy, although the effects of such a policy can be mitigated when combined with policies that encourage sustainable forest management and protection of forest carbon stocks as well as forest management certification ( high confidence) (Nabuurs et al. 2017, Baker et al. 2019 and Favero et al. 2020).
If biomass energy production expands and shifts to carbon capture and storage (e.g., BECCS) during the century, there could be a significant increase in the area of crop and forestland used for biomass energy production (Sections 7.4 and 7.5). BECCS is not projected to be widely implemented for several decades, but in the meantime, policy efforts to advance land-based measures including reforestation and restoration activities (Strassburg et al. 2020) combined with sustainable management and provision of agricultural and wood products are widely expected to increase the terrestrial pool of carbon (Cross-Working Group Box 3 in Chapter 12). Carbon sequestration policies, sustainable land management (forest and agriculture), and biomass energy policies can be complementary (Favero et al. 2017; Baker et al. 2019). However, if private markets emerge for biomass and BECCS on the scale suggested in the SR1.5, policy efforts must ramp up to substantially value, encourage, and protect terrestrial carbon stocks and ecosystems to avoid outcomes inconsistent with many SDGs ( high confidence).
Box 7.12 | Financing AFOLU Mitigation; What Are the Cost s and Who Pays?
Achieving the large contribution to mitigation that the AFOLU sector can make requires public and private investment. Austin et al. (2020) estimate that in forestry, USD178 billion yr –1 is needed over the next decade to achieve 5 GtCO2 yr –1, and investments need to ramp up to USD400 billion yr –1 by 2050 to expand effort to 6 GtCO2 yr –1. Other land-based options, such as mangrove protection, peatland restoration, and agricultural options would increase this total cost estimate, but have smaller to negligible opportunity costs.
Financing needs in AFOLU, and in particular in forestry, include both the direct effects of any changes in activities – costs of planting or managing trees, net revenues from harvesting, costs of thinning, costs of fire management, and so on – as well as the opportunity costs associated with land-use change. Opportunity costs are a critical component of AFOLU finance, and must be included in any estimate of the funds necessary to carry out projects. They are largest, as share of total costs, in forestry because they play a prominent role in achieving high levels of afforestation, avoided deforestation, and improved forest management. In case of increasing soil carbon in croplands through reduced tillage, there are often cost savings associated with increased residues because there is less effort tilling, but the carbon effects per hectare are also modest. There could, however, be small opportunity costs in cases where residues may otherwise be marketed to a biorefinery. The effect of reduced tillage on yields varies considerably across sites and crop types, but tends to enhance yields modestly in the longer-run.
Opportunity costs are a direct financing costs for activities that require land uses to change. For instance a government can encourage planting forests on agricultural land by (a) requiring it, (b) setting up a market or market-based incentives, or (c) buying the land and doing it themselves. In each case, the required investment is the same – the planting cost plus the net foregone returns of agricultural rents – even though a different entity pays the cost. Private entities that pay for carbon credits will also bear the direct costs of planting plus the opportunity costs. In the case of avoided deforestation, opportunity costs similarly must be paid to individual actors to avoid the deforestation.
Box 7.11 | Sustainable Intensification Within Agriculture: Evidence and Caveats
Introduction
Sustainable intensification (SI) has received considerable attention as a suggested means of pursuing increased overall production, reducing associated environmental externalities, and potentially releasing agricultural land for alternative uses, such as forestry or rewilding (Godfray and Garnett 2014; Pretty 2018). The concept was explored within the SRCCL (SRCCL (Mbow et al. 2019), Section 5.6.4.4 and Cross-Chapter Box 6 in Chapter 5). SI is context specific and dynamic, with no universally prescribed methodology (HLPE 2019). Equal importance is given to enhancing sustainability as to achieving agricultural intensification. The former aspect is often challenging to realise, measure and maintain.
The extent of sustainableintensification
Total global agricultural land area has remained relatively stable while overall production has increased in recent decades (Section 7.3), indicating that agricultural intensification, as judged by production per unit of land (Petersen and Snapp 2015; OECD and FAO 2019) has taken place. However, changes in agricultural land use and degradation of natural resources (UNEP 2019; IPBES 2019b) suggests that not all of this intensification is sustainable. Although agricultural intensification has led to less GHG emissions compared to a scenario where that intensification had not taken place (Burney et al. 2010), absolute agriculture related emissions have continued to increase (Section 7.2). Active pursuit of SI was found to be expanding, with implementation on an increasing area, notably in developing countries (Pretty et al. 2018), yet regional agricultural area expansion at the expense of native habitat also continues in such regions (Section 7.3). Although there are specific examples of SI (Box 7.13) global progress in achieving SI is acknowledged as slow (Cassman and Grassini 2020) with potentially multiple, context specific geophysical and socio-economic barriers to implementation (Firbank et al. 2018; da Silva et al. 2021 ).
Preconditions to ensure sustainableintensification
Increasing the total amount of product produced by improving production efficiency (output per unit of input) does not guarantee SI. It will only be successful if increased production efficiency translates into reduced environmental and social impacts as well as increased production. For example, AR5 highlighted a growing emphasis on reducing GHG emissions per unit of product via increasing production efficiency (Smith et al. 2014), but reductions in absolute GHG emissions will only occur when production efficiency increases at a greater rate than the rate at which production increases (Clark et al. 2005).
Defined indicators are required. Measurement of SI requires multiple indicators and metrics. It can be assessed at farm, regional or global scales and temporal aspect must be considered. SI may warrant whole system redesign or land reallocation (Garnett et al. 2013; Pretty et al. 2018). Accordingly, there is high agreement concerning the need to consider multiple environmental and social outcomes
at wider spatial scales, such as catchments or regions (Weltin et al. 2018; Bengochea Paz et al. 2020; Cassman and Grassini 2020). Impacts may be considered in relative terms (per area or product unit), with relationships potentially antagonistic. Both area- and product unit-based metrics are valid, relevant under different contexts and useful in approaching SI, but do not capture overall impacts and trade-offs (Garnett 2014). To reduce the risk of unsustainable intensification, quantitative data and selection of appropriate metrics to identify and guide strategies are paramount (Garnett et al. 2013; Gunton et al. 2016; Cassman and Grassini 2020).
Avoiding unsustainableintensification
It is critical that intensification does not drive expansion of unsustainable practices. Increased productivity with associated economic reward could incentivise and reward agricultural land expansion, or environmentally and socially damaging practices on existing and former agricultural land (Ceddia et al. 2013; Phalan 2018). Accordingly, coordinated policies are crucial to ensuring desired outcomes (Godfray and Garnett 2014; Reddy et al. 2020; Kassam and Kassam 2020). Barretto et al. (2013) found that in agriculturally consolidated areas, land-use intensification coincided with either a contraction of both cropland and pasture areas, or cropland expansion at the expense of pastures, both resulting in a stable farmed area. In contrast, in agricultural frontier areas, land-use intensification coincided with expansion of agricultural lands.
In conclusion, SI within agriculture is needed given the rising global population and the need to address multiple environmental and social externalities associated with agricultural activities. However, implementation requires strong stakeholder engagement, appropriate regulations, rigorous monitoring and verification and comprehensive outreach and knowledge exchange programmes.
7.6.4Barriers and Opportunities for AFOLU Mitigation
The AR5 and other assessments have acknowledged many barriers and opportunities to effective implementation of AFOLU measures. Many of these barriers and opportunities focus on the context in developing countries, where a significant portion of the world’s cost-effective mitigation exists, but where domestic financing for implementation is likely to be limited. The SSPs capture some of this context, and as a result, IAMs (Section 7.5) exhibit a wide range of land-use outcomes, as well as mitigation potential. Potential mitigation, however, will be influenced by barriers and opportunities that are not considered by IAMs or by bottom-up studies reviewed here. For example, more efficient food production systems, or sustainable intensification within agriculture, and globalised trade could enhance the extent of natural ecosystems leading to lower GHG emissions from the land system and lower food prices (Popp et al. 2017), but this (or any) pathway will create new barriers to implementation and encourage new opportunities, negating potential benefits (Box 7.11). It is critically important to consider the current context in any country.
7.6.4.1 Socio-economic Barriers and Opportunities
Design and coverage of financing mechanisms. The lack of resources thus far committed to implementing AFOLU mitigation, income and access to alternative sources of income in rural households that rely on agriculture or forests for their livelihoods remains a considerable barrier to adoption of AFOLU ( high confidence). Section 7.6.1 illustrates that to date only USD0.7 billion yr –1 has been spent on AFOLU mitigation, well short of the more than USD400 billion yr –1 that would be needed to achieve the economic potential described in Section 7.4. Despite long-term recognition that AFOLU can play an important role in mitigation, the economic incentives necessary to achieve AFOLU aspirations as part of the Paris Agreement or to maintain temperatures below 2.0°C have not emerged. Without quickly ramping up spending, the lack of funding to implement projects remains a substantial barrier ( high confidence). Investments are critically important in the livestock sector, which has the highest emissions reduction potential among options because actions in the sector influence agriculture specific activities, such as enteric fermentation, as well as deforestation (Mayberry et al. 2019). In many countries with export-oriented livestock industries, livestock farmers control large swaths of forests or re-forestable areas. Incentive mechanisms and funding can encourage adoption of mitigation strategies, but funding is currently too low to make consistent progress.
Scale and accessibility of financing. The largest share of funding to date has been for REDD+, and many of the commitments to date suggest that there will be significant funding in this area for the foreseeable future. Funding for conservation programmes in OECD countries and China affects carbon, but has been driven by other objectives such as water quality and species protection. Considerably less funding has been available for agricultural projects aimed at reducing carbon emissions, and outside of voluntary markets, there do not appear to be large sources of funding emerging either through international organisations, or national programs. In the agricultural sector, funding for carbon must be obtained by redirecting existing resources from non-GHG conservation to GHG measures, or by developing new funding streams (Henderson et al. 2020).
Risk and uncertainty. Most approaches to reduce emissions, especially in agriculture, require new or different technologies that involve significant time or financial investments by the implementing landholders. Adoption rates are often slow due to risk aversion among agricultural operators. Many AFOLU measures require carbon to be compensated to generate positive returns, reducing the likelihood of implementation without clear financial incentives. Research to show costs and benefits is lacking in most parts of the world.
Poverty. Mitigation and adaptation can have important implications for vulnerable people and communities, for example, mitigation activities consistent with scenarios examined in the SR1.5 could raise food and fiber prices globally (Section. 7.5). In the NDCs, 82 Parties included references to social issues (e.g., poverty, inequality, human well-being, marginalisation), with poverty the most cited factor (70 Parties). The number of hungry and food insecure people in the world is growing, reaching 821 million in 2017, or one in every nine people (FAO 2018b), and two-thirds live in rural areas (Laborde Debucquet et al. 2020). Consideration of rural poverty and food insecurity is central in AFOLU mitigation because there are a large number of farms in the world (about 570 million), and most are smaller than 2 hectares. It is important to better understand how different mitigation policies affect the poor.
Cultural values and social acceptance. Barriers to adoption of AFOLU mitigation will be strongest where historical practices represent long-standing traditions ( high confidence). Adoption of new mitigation practices, however, may proceed quickly if the technologies can be shown to improve crop yields, reduce costs, or otherwise improve livelihoods (Ranjan 2019). AR6 presents new estimates of the mitigation potential for shifts in diets and reductions in food waste, but given long-standing dietary traditions within most cultures, some of the strongest barriers exist for efforts to change diets (medium confidence). Furthermore, the large number of undernourished who may benefit from increased calories and meat will complicate efforts to change diets. Regulatory or tax approaches will face strong resistance, while efforts to use educational approaches and voluntary measures have limited potential to slow changes in consumption patterns due to free-riders, rebound effects, and other limitations. Food loss and waste occurs across the supply chain, creating significant challenges to reduce it (FAO 2019c). Where food loss occurs in the production stage, in other words, in fields at harvest, there may be opportunities to align reductions in food waste with improved production efficiency, however, adoption of new production methods often requires new investments or changes in labour practices, both of which are barriers.
7.6.4.2Institutional Barriers and Opportunities
Transparent and accountable governance. Good governance and accountability are crucial for implementation of forest and agriculture mitigation. Effective nature-based mitigation will require large-scale estimation, modelling, monitoring, reporting and verification of GHG inventories, mitigation actions, as well as their implications for sustainable development goals and their interactions with climate change impacts and adaptation. Efforts must be made to integrate the accounting from projects to the country level. While global datasets have emerged to measure forest loss, at least temporarily (e.g., Hansen et al. 2013), similar datasets do not yet exist for forest degradation and agricultural carbon stocks or fluxes. Most developing countries have insufficient capacity to address research needs, modelling, monitoring, reporting and data requirements (Ravindranath et al. 2017), compromising transparency, accuracy, completeness, consistency and comparability.
Opportunity for political participation of local stakeholders is barrier in most places where forest ownership rights are not sufficiently documented (Essl et al. 2018). Since incentives for self-enforcement can have an important influence on deforestation rates (Fortmann et al. 2017), weak governance and insecure property rights are significant barriers to introduction of forest carbon offset projects in developing countries, where many of the low-cost options for such projects exist (Gren and Zeleke 2016). Governance challenges exist at all levels of government, with poor coordination, insufficient information sharing, and concerns over accountability playing a prominent role within REDD+ projects and programmes (Ravikumar et al. 2015). In some cases, governments are increasingly centralising REDD+ governance and limiting the distribution of governance functions between state and non-state actors (Zelli et al. 2017; Phelps et al. 2010). Overlap and duplication in Forest Law Enforcement, Governance and Trade (FLEGT) and REDD+ also limits governance effectiveness (Gupta et al. 2016).
Clear land tenure and land-use rights. Unclear property rights and tenure insecurity undermine the incentives to improve forest and agricultural productivity, lead to food insecurity, undermine REDD+ objectives, discourage adoption of farm conservation practices, discourage tree planting and forest management, and exacerbate conflict between different land users (Antwi-Agyei et al. 2015; Felker et al. 2017; Sunderlin et al. 2018; Borras and Franco 2018; Riggs et al. 2018; Kansanga and Luginaah 2019). Some positive signs exist as over 500 million hectares of forests have been converted to community management with clear property rights in the past two decades (Rights and Resources Initiative 2018), but adoption of forest and agricultural mitigation practices will be limited in large remaining areas with unclear property rights (Gupta et al. 2016).
Lack of institutional capacity. Institutional complexity, or lack thereof, represents a major challenge when implementing large and complex mitigation programmes (e.g., REDD+) in agriculture, forest and other land uses (Bäckstrand et al. 2017). Without sufficient capacity, many synergies between agricultural and forest programs, or mitigation and adaptation opportunities, may be missed (Duguma et al. 2014). Another aspect of institutional complexity is the different biophysical and socio-economic circumstances as well as the public and private financial means involved in the architecture and implementation of REDD+ and other initiatives (Zelli et al. 2017).
7.6.4.3Ecological Barriers and Opportunities
Availability of land and water. Climate mitigation scenarios in the two recent special reports (SR1.5 and SRCCL) that aim to limit global temperature increase to 2°C or less involve carbon dioxide (CO2) removal from the atmosphere. To support large-scale CDR, these scenarios involve significant land-use change, due to afforestation/reforestation, avoided deforestation, and deployment of biomass energy with carbon capture and storage (BECCS). While a considerable amount of land is certainly available for new forests or new bioenergy crops, that land has current uses that will affect not only the costs, but also the willingness of current users or owners, to shift uses. Regions with private property rights and a history of market-based transactions may be the most feasible for land-use change or land management change to occur. Areas with less secure tenure or a land market with fewer transactions in general will likely face important hurdles that limit the feasibility of implementing novel nature-based solutions.
Implementation of nature-based solution may have local or regionally important consequences for other ecosystem services, some of which may be negative ( high confidence). Land-use change has important implications for the hydrological cycle, and the large land-use shifts suggested for BECCS when not carried out in a carefully planned manner, are expected to increase water demands substantially across the globe (Stenzel et al. 2019; Rosa et al. 2020). Afforestation can have minor to severe consequences for surface water acidification, depending on site-specific factors and exposure to air pollution and sea-salts (Futter et al. 2019). The potential effects of coastal afforestation on sea-salt related acidification could lead to re-acidification and damage on aquatic biota.
Specific soil conditions, water availability, GHG emission-reduction potential as well as natural variability and resilience. Recent analysis by (Cook-Patton et al. 2020) illustrates large variability in potential rates of carbon accumulation for afforestation and reforestation options, both within biomes/ecozones and across them. Their results suggest that while there is large potential for afforestation and reforestation, the carbon uptake potential in land-based climate change mitigation efforts is highly dependent on the assumptions related to climate drivers, land use and land management, and soil carbon responses to land-use change. Less analysis has been conducted on bioenergy crop yields, however, bioenergy crop yields are also likely to be highly variable, suggesting that bioenergy supply could exceed or fall short of expectations in a given region, depending on site conditions.
The effects of climate change on ecosystems, including changes in crop yields, shifts in terrestrial ecosystem productivity, vegetation migration, wildfires, and other disturbances also will affect the potential for AFOLU mitigation. Climate is expected to reduce crop yields, increase crop and livestock prices, and increase pressure on undisturbed forest land for food production creating new barriers and increasing costs for implementation of many nature-based mitigation techniques (medium confidence) (IPCC AR6 WGII Chapter 5).
The observed increase in the terrestrial sink over the past half century can be linked to changes in the global environment, such as increased atmospheric CO2 concentrations, N deposition, or changes in climate (Ballantyne et al. 2012), though not always proven from ground-based information (Vandersleen et al. 2015). While the terrestrial sink relies on regrowth in secondary forests (Houghton and Nassikas 2017), there is emerging evidence that the sink will slow in the Northern Hemisphere as forests age (Nabuurs et al. 2013), although saturation may take decades (Zhu et al. 2018). Forest management through replanting, variety selection, fertilisation, and other management techniques, has increased the terrestrial carbon sink over the last century (Mendelsohn and Sohngen 2019). Saturation of the sink in situ may not occur when, for example, substitution effects of timber usage are also considered.
Increasing concentrations of CO2 are expected to increase carbon stocks globally, with the strongest effects in the tropics (Schimel et al. 2015; Kim et al. 2017a) (IPCC AR6 WGII Chapter 5) and economic models suggest that future sink potential may be robust to the impacts of climate change (Tian et al. 2018). However, it is uncertain if this large terrestrial carbon sink will continue in the future (Aragão et al. 2018), as it is increasingly recognised that gains due to CO2 fertilisation are constrained by climate and increasing disturbances (Schurgers et al. 2018; Duffy et al. 2021) (IPCC AR6 WGII Chapter 5). Further, negative synergies between local impacts like deforestation and forest fires may interact with global drivers like climate change and lead to tipping points (Lovejoy and Nobre 2018). Factors that reduce permanence or slow forest growth will drive up costs of forest mitigation measures, suggesting that climate change presents a formidable challenge to implementation of nature-based solutions beyond 2030 (high confidence).
In addition to climate change, Dooley and Kartha (2018) also note that technological and social factors could ultimately limit the feasibility of agricultural and forestry mitigation options, especially when deployed at large scale. Concern is greatest with widespread use of bioenergy crops, which could lead to forest losses (Harper et al. 2018). Deployment of BECCS and forest-based mitigation can be complementary (Favero et al. 2017; Baker et al. 2019), but inefficient policy approaches could lead to net carbon emissions if BECCS replaces high-carbon content ecosystems with crops.
Adaptation benefits and biodiversity conservation. Biodiversity may improve resilience to climate change impacts as more-diverse systems could be more resilient to climate change impacts, thereby maintaining ecosystem function and preserving biodiversity (Hisano et al. 2018). However, losses in ecosystem functions due species shifts or reductions in diversity may impair the positive effects of biodiversity on ecosystems. Forest management strategies based on biodiversity and ecosystems functioning interactions can augment the effectiveness of forests in reducing climate change impacts on ecosystem functioning ( high confidence). In spite of the many synergies between climate policy instruments and biodiversity conservation, however, current policies often fall short of realising this potential (Essl et al. 2018).
7.6.4.4Technological Barriers and Opportunities
Monitoring, reporting, and verification. Development of satellite technologies to assess potential deforestation has grown in recent years with the release of 30 m data by Hansen et al. (2013), however, this data only captures tree cover loss, and increasing accuracy over time may limit its use for trend analysis (Ceccherini et al. 2020; Palahí et al. 2021). Datasets on forest losses are less well developed for reforestation and afforestation. As Mitchell et al. (2017) point out, there has been significant improvement in the ability to measure changes in tree and carbon density on sites using satellite data, but these techniques are still evolving and improving and they are not yet available for widespread use.
Ground-based forest inventory measurements have been developed in many countries, most prominently in the Northern Hemisphere, but more and more countries are starting to develop and collect national forest inventories. Training and capacity building is going on in many developing countries under UNREDD and FAO programmes. Additional efforts to harmonise data collection methods and to make forest inventory data available to the scientific community would improve confidence in forest statistics, and changes in forest statistics over time. To some extent the Global Forest Biodiversity Initiative fills in this data gap (https://gfbi.udl.cat/).
7.6.5Linkages to Ecosystem Services, Human Well-being and Adaptation (including SDGs)
The linkage between biodiversity, ecosystem services, human well-being and sustainable development is widely acknowledged (Millenium Ecosystem Assesment 2005; UNEP 2019). Loss of biodiversity and ecosystem services will have an adverse impact on quality of life, human well-being and sustainable development (IPBES 2019a). Such losses will not only affect current economic growth but also impede the capacity for future economic growth.
Population growth, economic development, urbanisation, technology, climate change, global trade and consumption, policy and governance are key drivers of global environmental change over recent decades (Kram et al. 2014; UNEP 2019; WWF 2020). Changes in biodiversity and ecosystem services are mainly driven by habitat loss, climate change, invasive species, over-exploitation of natural resources, and pollution (Millenium Ecosystem Assesment 2005). The relative importance of these drivers varies across biomes, regions, and countries. Climate change is expected to be a major driver of biodiversity loss in the coming decades, followed by commercial forestry and bioenergy production (OECD 2012; UNEP 2019). Population growth along with rising incomes and changes in consumption and dietary patterns, will exert immense pressure on land and other natural resources (IPCC 2019). Current estimates suggest that 75% of the land surface has been significantly anthropogenically altered, with 66% of the ocean area experiencing increasing cumulative impacts and over 85% of wetland area lost (IPBES 2019a). As discussed, in Section 7.3, land-use change is driven amongst others by agriculture, forestry (logging and fuelwood harvesting), infrastructural development and urbanisation, all of which may also generate localised air, water, and soil pollution (IPBES 2019a). Over a third of the world’s land surface and nearly three-quarters of available freshwater resources are devoted to crop or livestock production (IPBES 2019a). Despite a slight reduction in global agricultural area since 2000, regional agricultural area expansion has occurred in Latin America and the Caribbean, Africa and the Middle East (FAO 2019c; OECD and FAO 2019). The degradation of tropical forests and biodiversity hotspots, endangers habitat for many threatened and endemic species, and reduces valuable ecosystem services. However, trends vary considerably by region. As noted in Section 7.3, global forest area declined by roughly 178 Mha between 1990 and 2020 (FAO 2020a), though the rate of net forest loss has decreased over the period, due to reduced deforestation in some countries and forest gains in others. Between 1990 to 2015, forest cover fell by almost 13% in South-East Asia, largely due to an increase in timber extraction, large-scale biofuel plantations and expansion of intensive agriculture and shrimp farms, whereas in North-East Asia and South Asia it increased by 23% and 6% respectively, through policy instruments such as joint forest management, payment for ecosystem services, and restoration of degraded forests (IPBES 2018b). It is lamenting that the area under natural forests which are rich in biodiversity and provide diverse ecosystem services decreased by 301 Mha between 1990 and 2020, decreasing in most regions except Europe and Oceania with largest losses reported in sub-Saharan Africa (FAO 2020a). The increasing trend of mining in forest and coastal areas, and in river basins for extracting has had significant negative impacts on biodiversity, air and water quality, water distribution, and on human health (Section 7.3). Freshwater ecosystems equally face a series of combined threats including from land-use change, water extraction, exploitation, pollution, climate change and invasive species (IPBES 2019a).
7.6.5.1Ecosystem Services
An evaluation of eighteen ecosystem services over the past five decades (1970–2019) found only four (agricultural production, fish harvest, bioenergy production and harvest of materials) to demonstrate increased performance, while the remaining fourteen, mostly concerning regulating and non-material contributions, were found to be in decline (IPBES 2019a). The value of global agricultural output (over USD3.54 trillion in 2018) had increased approximately threefold since 1970, and roundwood production (industrial roundwood and fuelwood) by 27%, between 1980 to 2018, reaching some 4 billion m 3 in 2018. However, the positive trends in these four ecosystem services does not indicate long-term sustainability. If increases in agricultural production are realised through forest clearance or through increasing energy-intensive inputs, gains are likely to be unsustainable in the long run. Similarly, an increase in fish production may involve overfishing, leading to local species declines which also impacts fish prices, fishing revenues, and the well-being of coastal and fishing communities (Sumaila and Lam 2020). Climate change and other drivers are likely to affect future fish catch potential, although impacts will differ across regions (Sumaila et al. 2017; Domke et al. 2019).
The increasing trend in aquaculture production especially in South and South-East Asia through intensive methods affects existing food production and ecosystems by diverting rice fields or mangroves (Bhattacharya and Ninan 2011). Although extensive traditional fish farming of carp in central Europe can contribute to landscape management, enhance biodiversity and provide ecosystem services, there are several barriers to scale up production due to strict EU environmental regulations, vulnerability to extreme weather events, and to avian predators that are protected by EU laws, and disadvantages faced by small-scale enterprises that dominate the sector (European-Commission 2021). Bioenergy production may have high opportunity costs in land-scarce areas and compete with land used for food production which threatens food security and affects the poor and vulnerable. But these impacts will differ across scale, contexts and other factors.
Currently, land degradation is estimated to have reduced productivity in 23% of the global terrestrial area, and between USD235 billion and USD577 billion in annual global crop output is at risk because of pollinator loss (IPBES 2019a). The global trends reviewed above are based on data from 2000 studies. It is not clear whether the assessment included a quality control check of the studies evaluated and suffer from aggregation bias. For instance, a recent meta-analysis of global forest valuation studies noted that many studies reviewed had shortcomings such as failing to clearly mention the methodology and prices used to value the forest ecosystem services, double counting, data errors, and so on (Ninan and Inoue 2013). Furthermore, the criticisms against the paper by (Costanza et al. 1997), such as ignoring ecological feedbacks and non-linearities that are central to the processes that link all species to each other and their habitats, ignoring substitution effects may also apply to the global assessment (Smith 1997; Bockstael et al. 2000; Loomis et al. 2000). Land degradation has had a pronounced impact on ecosystem functions worldwide (IPBES 2018e). Net primary productivity of ecosystem biomass and of agriculture is presently lower than it would have been under a natural state on 23% of the global terrestrial area, amounting to a 5% reduction in total global net primary productivity (IPBES 2018e). Over the past two centuries, soil organic carbon, an indicator of soil health, has seen an estimated 8% loss globally (176 GtC) from land conversion and unsustainable land management practices (IPBES 2018e). Projections to 2050 predict further losses of 36 GtC from soils, particularly in sub-Saharan Africa. These losses are projected to come from the expansion of agricultural land into natural areas (16 GtC), degradation due to inappropriate land management (11 GtC) and the draining and burning of peatlands (9 GtC) and melting of permafrost (IPBES 2018e). Trends in biodiversity measured by the global living planet index between 1970 to 2016 indicate a 68% decline in monitored population of mammals, birds, amphibians, reptiles, and fish (WWF 2020). FAO’s recent report on the state of the world’s biodiversity for food and agriculture points to an alarming decline in biodiversity for food and agriculture including associated biodiversity such as pollination services, microorganisms which are essential for production systems (FAO 2019d). These suggest that overall ecosystem health is consistently declining with adverse consequences for good quality of life, human well-being, and sustainable development.
Although numerous studies have estimated the value of ecosystem services for different sites, ecosystems, and regions, these studies mostly evaluate ecosystem services at a single point in time (Costanza et al. 1997; Xue and Tisdell 2001; Nahuelhual et al. 2007; de Groot et al. 2012; Ninan and Kontoleon 2016). The few studies that have assessed the trends in the value of ecosystem services provided by different ecosystems across regions and countries indicate a declining trend (Costanza et al. 2014; Kubiszewski et al. 2017). Land-use change is a major driver behind loss of biodiversity and ecosystem services in most regions (IPBES 2018b; IPBES 2018c, IPBES 2018d, Rice et al. 2018). Projected impacts of land-use change and climate change on biodiversity and ecosystem services (material and regulating services) between 2015 to 2050 were assessed to have relatively less negative impacts under global sustainability scenarios as compared to regional competition and economic optimism scenarios (IPBES 2019a). The projected impacts were based on a subset of Shared Socio-economic Pathway (SSP) scenarios and GHG emissions trajectories (RCP) developed in support of IPCC assessments. There are synergies, trade-offs and co-benefits between ecosystem services and mitigation options with impacts on ecosystem services differing by scale and contexts ( high confidence). Measures such as conservation agriculture, agroforestry, soil and water conservation, afforestation, adoption of silvopastoral systems, can help minimise trade-offs between mitigations options and ecosystem services (Duguma et al. 2014). Climate-smart agriculture (CSA) is being promoted to enable farmers to make agriculture more sustainable and adapt to climate change (Box 7.4). However, experience with CSA in Africa has not been encouraging. For instance, a study of climate-smart cocoa production in Ghana shows that due to lack of tenure (tree) rights, bureaucratic and legal hurdles in registering trees in cocoa farms, and other barriers small cocoa producers could not realise the project benefits (Box 7.13). Experience of CSA in some other sub-Saharan African countries and other countries such as Belize too has been constrained by weak extension systems and policy implementation, and other barriers (Arakelyan et al. 2017; Kongsager 2017).
7.6.5.2Human Well-being and Sustainable Development Goals
Conservation of biodiversity and ecosystem services is part of the larger objective of building climate resilience and promoting good quality of life, human well-being and sustainable development. While two of the 17 SDGs directly relate to nature (SDGs 14 and 15 covering marine and terrestrial ecosystems and biodiversity), most other SDGs relating to poverty, hunger, inequality, health and well-being, clean sanitation and water, energy, and so on, are directly or indirectly linked to nature (Blicharska et al. 2019). A survey among experts to assess how 16 ecosystem services could help in achieving the SDGs relating to good environment and human well-being suggested that ecosystem services could contribute to achieving about 41 targets across 12 SDGs (Wood et al. 2018). They also indicated cross-target interactions and synergetic outcomes across many SDGs. Conservation of biodiversity and ecosystem services is critical to sustaining the well-being and livelihoods of poor and marginalised people, and indigenous communities who depend on natural resources ( high confidence). Nature provides a broad array of goods and services that are critical to good quality of life and human well-being. Healthy and diverse ecosystems can play an important role in reducing vulnerability and building resilience to disasters and extreme weather events (SCBD 2009; The Royal Society Science Policy Centre 2014; Ninan and Inoue 2017).
Current negative trends in biodiversity and ecosystem services will undermine progress towards achieving 80% (35 out of 44) of the assessed targets of SDGs related to poverty, hunger, health, water, cities, climate, oceans and land (IPBES 2019a). However, Reyers and Selig (2020) note that the assessment by (IPBES 2019a) could only assess the consequences of trends in biodiversity and ecosystem services for 35 out of the 169 SDG targets due to data and knowledge gaps, and lack of clarity about the relationship between biodiversity, ecosystem services and SDGs.
Progress in achieving the 20 Aichi Biodiversity targets which are critical for realising the SDGs has been poor with most of the targets not being achieved or only partially realised (SCBD 2020). There could be synergies and trade-offs between ecosystem services and human well-being. For instance, a study notes that although policy interventions and incentives to enhance supply of provisioning services (e.g., agricultural production) have led to higher GDP, it may have an adverse effect on the regulatory services of ecosystems (Kirchner et al. 2015). However, we are aware of the inadequacies of traditional GDP as an indicator of well-being. In this context the Dasgupta Biodiversity Review argues for using the inclusive wealth approach to accurately measure social well-being by tracking the changes in produced, human and natural capital (Dasgupta 2021). Targets for nature (biodiversity and ecosystem services) should be refined so as to fit in with the metrics tracked by the SDGs (IPBES 2016; Rosa et al. 2017).
7.6.5.3Land-based Mitigation and Adaptation
Combined mitigation and adaptation approaches have been highlighted throughout Section 7.4 regarding specific measures. Land-based mitigation and adaptation to the risks posed by climate change and extreme weather events can have several co-benefits as well as help promote development and conservation goals. Land-based mitigation and adaptation will not only help reduce GHG emissions in the AFOLU sector, but measures are required to closely link up with adaptation. In the central 2°C scenario, improved management of land and more efficient forest practices, a reduction in deforestation and an increase in afforestation, would account for 10% of the total mitigation effort over 2015–2050 (Keramidas et al. 2018). If managed and regulated appropriately, the Land sector could become carbon-neutral as early as 2030–2035, being a key sector for emissions reductions beyond 2025 (Keramidas et al. 2018). Nature-based solutions (NBS) with safeguards has immense potential for cost-effective adaptation to climate change; but their impacts will vary by scale and contexts ( high confidence). Griscom et al. 2017 estimate this potential to provide 37% of cost-effective CO2 mitigation until 2030 needed to meet 2°C goals with likely co-benefits for biodiversity. However, due to the time lag for technology deployment and natural carbon gain this mitigation potential of NBS by 2030 or 2050 can be delayed or much lower than the estimated potential (Qin et al. 2021).
Box 7.13 | Case Study: Climate-smart Cocoa Production in Ghana
Policy objectives
i. To promote sustainable intensification of cocoa production and enhance the adaptive capacity of small cocoa producers.
ii. To reduce cocoa-induced deforestation and GHG emissions.
iii. To improve productivity, incomes, and livelihoods of smallholder cocoa producers.
Policy mix
The climate-smart cocoa (CSC) production programme in Ghana involved distributing shade tree seedlings that can protect cocoa plants from heat and water stress, enhance soil organic matter and water holding capacity of soils, and provide other assistance with agroforestry, giving access to extension services such as agronomic information and agrochemical inputs. The shade tree seedlings were distributed by NGOs, government extension agencies, and the private sector free of charge or at subsidised prices and was expected to reduce pressure on forests for growing cocoa plants. The CSC programme was mainly targeted at small farmers who constitute about 80% of total farm holdings in Ghana. Although the government extension agency (Cocobod) undertook mass spraying or pruning of cocoa farms they found it difficult to access the 800,000 cocoa smallholders spread across the tropical south of the country. The project brought all stakeholders together, in other words, the government, private sector, local farmers and civil society or NGOs to facilitate the sustainable intensification of cocoa production in Ghana. Creation of a community-based governance structure was expected to promote benefit sharing, forest conservation, adaptation to climate change, and enhanced livelihood opportunities.
Governance context
Critical enablers
The role assigned to local government mechanisms such as Ghana’s Community Resource Management Area Mechanisms (CREMAs) was expected to give a voice to smallholders who are an important stakeholder in Ghana’s cocoa sector. CREMAs are inclusive because authority and ownership of natural resources are devolved to local communities who can thus have a voice in influencing CSC policy thereby ensuring equity and adapting CSC to local contexts. However, ensuring the long-term sustainability of CREMAs will help to make them a reliable mechanism for farmers to voice their concerns and aspirations, and ensure their independence as a legitimate governance structure in the long run. The private sector was assigned an important role to popularise climate-smart cocoa production in Ghana. However, whether this will work to the advantage of smallholder cocoa producers needs to be seen.
Critical barriers
The policy intervention overlooks the institutional constraints characteristic of the cocoa sector in Ghana where small farmers are dominant and have skewed access to resources and markets. Lack of secure tenure (tree rights) where the ownership of shade trees and timber vests with the state, bureaucratic and legal hurdles to register trees in their cocoa farms are major constraints that impede realisation of the expected benefits of the CSC programme. This is a great disincentive for small cocoa producers to implement CSC initiatives and nurture the shade tree seedlings and undertake land improvement measures. The state marketing board has the monopoly in buying and marketing of cocoa beans including exports which impeded CREMAs or farming communities from directly selling their produce to MNCs and traders. However, many MNCs have been involved in setting up of CREMA or similar structures, extending premium prices and non-monetary benefits (access to credit, shade tree seedlings, agrochemicals) thus indirectly securing their cocoa supply chains. A biased ecological discourse about the benefits of climate-smart agriculture and sustainable intensive narrative, complexities regarding the optimal shade levels for growing cocoa, and dependence on agrochemicals are issues that affect the success and sustainability of the project intervention. Dominance of private sector players especially MNCs in the sector may be detrimental to the interests of smallholder cocoa producers (Nasser et al. 2020).
7.7Knowledge Gaps
Closing knowledge gaps and narrowing uncertainties are crucial to advance AFOLU mitigation. Knowledge gaps exist across a range of areas, from emissions accounting and mitigation measure development to integration of scientific and traditional knowledge and development and sustainable implementation strategies. The following are identified as priorities:
•Uncertainty in contemporary emissions and sinks within AFOLU is still high. There is ongoing need to develop and refine emission factors, improve activity data and facilitate knowledge exchange, concerning inventories and accounting. For example, insufficient knowledge on CO2 emissions relating to forest management and burning or draining of organic soils (wetlands and peatlands), limits certainty on CO2 and CH4 fluxes.
•Improved monitoring of the land CO2 balance is urgently needed, including impacts of land degradation and restoration efforts (e.g., in tropical and boreal regions), making use of combined remote sensing, artificial intelligence, ground-based and modelling tools (Grassi et al. 2021). Improved estimates would provide more reliable projections of nationally determined contributions to emissions reduction and enhancement of sinks, and reconciliation of national accounting and modelling results (Nabuurs et al. 2019).
•The future impacts of climate change on land systems are highly uncertain, for example, the role of permafrost thaw, tipping points, increased disturbances and enhanced CO2 fertilisation (Friedlingstein et al. 2020). Further research into these mechanisms is critical to better understand the permanence of mitigation measures in land sector.
•There is need to understand the role of forest management, carbon and nitrogen fertilisation and associated interactions in the current forest carbon sink that has emerged in the last 50 to 70 years. These aspects are likely to explain much of the difference between bookkeeping models and other methodologies.
•Continued research into novel and emerging mitigation measures and associated cost efficiency (e.g., CH4 inhibitors or vaccines for ruminants) is required. In addition to developing specific measures, research is also needed into best practice regarding implementation and optimal agricultural land and livestock management at regional and country level. Further research into the feasible mitigation potential of sustainable intensification in terms of absolute GHG emissions and appropriate policy mechanisms, is required to implement and advance this strategy.
•Research into accounting systems and policy options that will enable agricultural soil and forest carbon to be utilised as offsets (voluntary or regulatory) is needed to increase financing for land-based CDR. Design of incentives that consider local institutions and novel frameworks for cooperation between private finance and public governance can encourage investment. Equally, research to adjust or remove regulations and subsidy schemes that may hamper land-based mitigation efforts, is urgently required.
•Improving mitigation potential estimates, whether derived from sectoral studies or IAMs to account for biophysical climate effects, and impacts of future climate change (e.g., mitigation permanence), biodiversity loss and corresponding feedbacks is needed. IAM ‘usability’ can be enhanced by integrating a wider set of measures and incorporating sustainability considerations.
•Research into the feasibility of improving and enhancing sustainable agricultural and forestry value chains, provision of renewable products (building with wood) and the sustainability of bioenergy is critically important. Modelled scenarios do not examine many poverty, employment and development trade-offs, which are highly context specific and vary enormously by region. Trade-off analysis and cost-benefit analysis can assist decision-making and policy.
•In-depth understanding of mitigation-SDG interactions is critical for identifying mitigation options that maximise synergies and minimise trade-offs. Mitigation measures have important synergies, trade-offs and co-benefits, impacting biodiversity and resource-use, human well-being, ecosystem services, adaptation capacity and many SDGs. In addition to exploring localised economic implementation costs, studies are needed to understand how measures will impact and interact with wider environmental and social factors across localities and contexts.
Frequently Asked Questions (FAQs)
FAQ 7.1 | Why is the Agriculture, Forestry and Other Land Uses (AFOLU) sector unique when considering GHG mitigation?
There are three principal reasons that make the AFOLU sector unique in terms of mitigation:
In contrast to other sectors, AFOLU can facilitate mitigation in several different ways. Specifically, AFOLU can (i) reduce emissions as a sector in its own right, (ii) remove meaningful quantities of carbon from the atmosphere and relatively cheaply, and (iii) provide raw materials to enable mitigation within other sectors, such as energy, industry or the built environment.
The emissions profile of AFOLU differs from other sectors, with a greater proportion of non-CO2 gases (N2O and CH4). The impacts of mitigation efforts within AFOLU can vary according to which gases are targeted, as a result of the differing atmospheric lifetime of the gases and differing global temperature responses to the accumulation of the specific gases in the atmosphere.
In addition to tackling climate change, AFOLU mitigation measures have capacity, where appropriately implemented, to help address some critical, wider challenges, as well as contributing to climate change adaptation. AFOLU is inextricably linked with some of the most serious challenges that are suggested to have ever faced humanity, such as large-scale biodiversity loss, environmental degradation and the associated consequences. As AFOLU concerns land management and utilises a considerable portion of the Earth’s terrestrial area, the sector greatly influences soil, water and air quality, biological and social diversity, the provision of natural habitats, and ecosystem functioning, consequently impacting many SDGs.
FAQ 7.2 | What AFOLU measures have the greatest economic mitigation potential?
Economic mitigation potential refers to the mitigation estimated to be possible at an annual cost of up to USD100 tCO2–1 mitigated. This cost is deemed the price at which society is willing to pay for mitigation and is used as a proxy to estimate the proportion of technical mitigation potential that could realistically be implemented. Between 2020 and 2050, measures concerning forests and other ecosystem are estimated to have an average annual mitigation potential of 7.3 (3.9–13.1) GtCO2-eq yr –1 at USD100 tCO2–1. At the same cost, agricultural measures are estimated to have a potential of 4.1 (1.7–6.7) GtCO2-eq yr –1. Emerging technologies, such as CH4 vaccines and inhibitors, could sustainably increase agricultural mitigation potential in future. The diverted production effects of changes in demand (reduced food losses, diet changes and improved and enhanced wood products use), is estimated to have an economic potential of 2.2 (1.1–3.6) GtCO2-eq yr –1. However, cost forms only one constraint to mitigation, with realisation of economic potential dependent on multiple context-specific environmental and socio-cultural factors.
FAQ 7.3 | What are potential impacts of large-scale establishment of dedicated bioenergy plantations and crops and why is it so controversial?
The potential of bioenergy with carbon capture and storage (BECCS) remains a focus of debate with several studies evaluating the level at which BECCS could be sustainably implemented, published since AR5. BECCS involves sequestering carbon through plant growth (i.e., in trees or crops) and capturing the carbon generated when this biomass is processed for power or fuel. The captured carbon then requires long-term storage in for example, geological, terrestrial or ocean reservoirs, or in products. While appearing to create a net removal of carbon from the atmosphere, BECCS requires land, water and energy which can create adverse side effects at scale. Controversy has arisen because some of the models calculating the energy mix required to keep the temperature to 1.5°C have included BECCS at very large scales as a means of both providing energy and removing carbon from the atmosphere to offset emissions from industry, power, transport or heat. For example, studies have calculated that for BECCS to achieve 11.5 GtCO2-eq per year of carbon removal in 2100, as envisaged in one scenario, 380–700 Mha or 25–46% of all the world’s arable and cropland would be needed. In such a situation, competition for agricultural land seriously threatens food production and food security, while also impacting biodiversity, water and soil quality, and landscape aesthetic value. More recently however, the scenarios for BECCS have become much more realistic, though concerns regarding impacts on food security and the environment remain, while the reliability of models is uncertain due to methodological flaws. Improvements to models are required to better capture wider environmental and social impacts of BECCS in order to ascertain its sustainable contribution in emissions pathways. Additionally, the opportunity for other options that could negate very large-scale deployment of BECCS, such as other carbon dioxide removal measures or more stringent emission reductions in other sectors, could be explored within models.
References
Abatzoglou, J.T. and A.P. Williams, 2016: Impact of anthropogenic climate change on wildfire across western US forests. Proc. Natl. Acad. Sci. , 113(42) , 11770–11775, doi:10.1073/pnas.1607171113.
Abbott, D.W. et al., 2020: Seaweed and Seaweed Bioactives for Mitigation of Enteric Methane: Challenges and Opportunities. Animals, 10(12) , 2432, doi:10.3390/ani10122432.
Abrahão, G.M. and M.H. Costa, 2018: Evolution of rain and photoperiod limitations on the soybean growing season in Brazil: The rise (and possible fall) of double-cropping systems. Agric. For. Meteorol. , 256–257, 32–45, doi:10.1016/j.agrformet.2018.02.031.
Achard, F. et al., 2014: Determination of tropical deforestation rates and related carbon losses from 1990 to 2010. Glob. Change Biol. , 20(8) , 2540–2554, doi:10.1111/gcb.12605.
Ackrill, R. and H. Abdo, 2020: On-farm anaerobic digestion uptake barriers and required incentives: A case study of the UK East Midlands region. J. Clean. Prod. , 264, 121727, doi:10.1016/j.jclepro.2020.121727.
Acosta-Alba, I., E. Chia, and N. Andrieu, 2019: The LCA4CSA framework: Using life cycle assessment to strengthen environmental sustainability analysis of climate smart agriculture options at farm and crop system levels. Agric. Syst. , 171, 155–170, doi:10.1016/j.agsy.2019.02.001.
Adam, M. et al., 2020: Which is more important to sorghum production systems in the Sudano-Sahelian zone of West Africa: Climate change or improved management practices?Agric. Syst. , 185, 102920, doi:10.1016/j.agsy.2020.102920.
Adger, W.N. et al., 2015: Focus on environmental risks and migration: causes and consequences. Environ. Res. Lett. , 10(6) , 060201, doi:10.1088/1748-9326/10/6/060201.
Adghim, M. et al., 2020: Comparative life cycle assessment of anaerobic co-digestion for dairy waste management in large-scale farms. J. Clean. Prod. , 256, 120320, doi:10.1016/j.jclepro.2020.120320.
Adhikari, S. and B. Ozarska, 2018: Minimizing environmental impacts of timber products through the production process “From Sawmill to Final Products”. Environ. Syst. Res. , 7(1) , 6, doi:10.1186/s40068-018-0109-x.
AGDW – The Forest Owners, 2021: The Working Group of German Forest Owner Associations. https://www.waldeigentuemer.de/verband/mitglieder sverbaende_agdw/#nrw (Accessed October 6, 2021).
Aggarwal, P.K. et al., 2018: The climate-smart village approach: framework of an integrative strategy for scaling up adaptation options in agriculture. Ecol. Soc. , 23(1) , art14, doi:10.5751/ES-09844-230114.
Agostini, A., J. Giuntoli, and A. Boulamanti, 2014: Carbon accounting of forest bioenergy. Publications Office of the European Union, Luxembourg, 88 pp.
Aguilera, E. et al., 2020: Agroecology for adaptation to climate change and resource depletion in the Mediterranean region. A review. Agric. Syst. , 181, 102809, doi:10.1016/j.agsy.2020.102809.
Aguirre-Villegas, H.A., R.A. Larson, and M.A. Sharara, 2019: Anaerobic digestion, solid-liquid separation, and drying of dairy manure: Measuring constituents and modeling emission. Sci. Total Environ. , 696, 134059, doi:10.1016/j.scitotenv.2019.134059.
Agyarko-Mintah, E. et al., 2017: Biochar increases nitrogen retention and lowers greenhouse gas emissions when added to composting poultry litter. Waste Manag. , 61, 138–149, doi:10.1016/j.wasman.2016.11.027.
Ahlering, M., J. Fargione, and W. Parton, 2016: Potential carbon dioxide emission reductions from avoided grassland conversion in the northern Great Plains. Ecosphere, 7 (12) , e01625, doi:10.1002/ecs2.1625.
Ai, Z., N. Hanasaki, V. Heck, T. Hasegawa, and S. Fujimori, 2021: Global bioenergy with carbon capture and storage potential is largely constrained by sustainable irrigation. Nat. Sustain. , 4(10) , 884–891, doi:10.1038/s41893-021-00740-4.
Ajonina, G.N. et al., 2014: Assessment of Mangrove Carbon Stocks in Cameroon, Gabon, the Republic of Congo (RoC) and the Democratic Republic of Congo (DRC) Including their Potential for Reducing Emissions from Deforestation and Forest Degradation (REDD+). In: The Land/Ocean Interactions in the Coastal Zone of West and Central Africa[Diop, S., J.-P. Barusseau, and C. Descamps (eds.)]. Springer, Cham, Switzerland, pp. 177–189.
Akiyama, H., K. Yagi, and X. Yan, 2005: Direct N2O emissions from rice paddy fields: Summary of available data. Global Biogeochem. Cycles, 19(1) , doi:10.1029/2004GB002378.
Al‐Haj, A.N. and R.W. Fulweiler, 2020: A synthesis of methane emissions from shallow vegetated coastal ecosystems. Glob. Change Biol. , 26(5) , 2988–3005, doi:10.1111/gcb.15046.
Alamgir, M. et al., 2017: Economic, Socio-Political and Environmental Risks of Road Development in the Tropics. Curr. Biol. , 27(20) , R1130–R1140, doi:10.1016/j.cub.2017.08.067.
Alamgir, M., M.J. Campbell, S. Sloan, W.E. Phin, and W.F. Laurance, 2018: Road risks & environmental impact assessments in Malaysian road infrastructure projects. Jurutera, 13–16.
Alary, V. et al., 2015: Roles of small ruminants in rural livelihood improvement – Comparative analysis in Egypt. Rev Elev Med Vet Pays Trop, 68(2–3) , 79–85, doi: https://doi.org/10.19182/remvt.20592.
Albers, A., P. Collet, A. Benoist, and A. Hélias, 2020: Back to the future: dynamic full carbon accounting applied to prospective bioenergy scenarios. Int. J. Life Cycle Assess. , 25 (7) , 1242–1258, doi:10.1007/s11367-019-01695-7.
Aleksandrowicz, L. et al., 2019: Environmental impacts of dietary shifts in India: A modelling study using nationally-representative data. Environ. Int. , 126, 207–215, doi:10.1016/j.envint.2019.02.004.
Alix-Garcia, J., 2007: A spatial analysis of common property deforestation. J. Environ. Econ. Manage. , 53(2) , 141–157, doi:10.1016/j.jeem.2006.09.004.
Alix-Garcia, J., A. de Janvry, E. Sadoulet, and J.M. Torres, 2005: An Assessment of Mexico’s Payment for Environmental Services Program. Food and Agriculture Organiation of the United Nations, Rome, 85 pp.
Alix-Garcia, J.M., E.N. Shapiro, and K.R.E. Sims, 2012: Forest Conservation and Slippage: Evidence from Mexico’s National Payments for Ecosystem Services Program. Land Econ. , 88(4) , 613–638, doi:10.3368/le.88.4.613.
Alix-Garcia, J.M., K.R.E. Sims, and P. Yañez-Pagans, 2015: Only One Tree from Each Seed? Environmental Effectiveness and Poverty Alleviation in Mexico’s Payments for Ecosystem Services Program. Am. Econ. J. Econ. Policy, 7(4) , 1–40, doi:10.1257/pol.20130139.
Alkama, R. and A. Cescatti, 2016: Biophysical climate impacts of recent changes in global forest cover. Science, 351 (6273), 600–604, doi:10.1126/science.aac8083.
Alongi, D.M., 2020: Blue Carbon Coastal Sequestration for Climate Change. Springer Briefs in Climate Studies. 88p. https://doi.org/10.1007/ 978-3-319-91698-9
Alter, R.E., E.-S. Im, and E.A.B. Eltahir, 2015: Rainfall consistently enhanced around the Gezira Scheme in East Africa due to irrigation. Nat. Geosci. , 8(10) , 763–767, doi:10.1038/ngeo2514.
Altieri, M.A. and C.I. Nicholls, 2017: The adaptation and mitigation potential of traditional agriculture in a changing climate. Clim. Change, 140(1) , 33–45, doi:10.1007/s10584-013-0909-y.
Altieri, M.A., C.I. Nicholls, A. Henao, and M.A. Lana, 2015: Agroecology and the design of climate change-resilient farming systems. Agron. Sustain. Dev. , 35(3) , 869–890, doi:10.1007/s13593-015-0285-2.
Alvarez-Berrios, N.L. and T. Mitchell Aide, 2015: Global demand for gold is another threat for tropical forests. Environ. Res. Lett. , 10(1) , 014006, doi:10.1088/1748-9326/10/1/014006.
Alvarez-Hess, P.S. et al., 2019: A partial life cycle assessment of the greenhouse gas mitigation potential of feeding 3-nitrooxypropanol and nitrate to cattle. Agric. Syst. , 169, 14–23, doi:10.1016/j.agsy.2018.11.008.
Amadu, F.O., D.C. Miller, and P.E. McNamara, 2020: Agroforestry as a pathway to agricultural yield impacts in climate-smart agriculture investments: Evidence from southern Malawi. Ecol. Econ. , 167, 106443, doi:10.1016/j.ecolecon.2019.106443.
Amouzou, K.A. et al., 2019: Climate change impact on water- and nitrogen-use efficiencies and yields of maize and sorghum in the northern Benin dry savanna, West Africa. F. Crop. Res. , 235, 104–117, doi:10.1016/j.fcr. 2019.02.021.
Andam, K.S., P.J. Ferraro, A. Pfaff, G.A. Sanchez-Azofeifa, and J.A. Robalino, 2008: Measuring the effectiveness of protected area networks in reducing deforestation. Proc. Natl. Acad. Sci. , 105(42) , 16089–16094, doi:10.1073/pnas.0800437105.
Andela, N. et al., 2017: A human-driven decline in global burned area. Science, 356(6345) , 1356–1362, doi:10.1126/science.aal4108.
Andela, N. et al., 2019: The Global Fire Atlas of individual fire size, duration, speed and direction. Earth Syst. Sci. Data, 11(2) , 529–552, doi:10.5194/essd-11-529-2019.
Anderegg, W.R.L. et al., 2020: Climate-driven risks to the climate mitigation potential of forests. Science, 368(6497) , doi:10.1126/science.aaz7005.
Andersen, R. et al., 2017: An overview of the progress and challenges of peatland restoration in Western Europe. Restor. Ecol. , 25(2) , 271–282, doi:10.1111/rec.12415.
Anderson, R., P.E. Bayer, and D. Edwards, 2020: Climate change and the need for agricultural adaptation. Curr. Opin. Plant Biol. , 56, 197–202, doi:10.1016/j.pbi.2019.12.006.
Anderson, R.G. et al., 2011: Biophysical considerations in forestry for climate protection. Front. Ecol. Environ. , 9(3) , 174–182, doi:10.1890/090179.
Angelo, M.J. and A. du Plessis, 2017: Research Handbook on Climate Change and Agricultural Law. Edward Elgar Publishing, Cheltenham and Northampton, UK, 488 pp.
Angelsen, A., 2017: REDD+ as Result-based Aid: General Lessons and Bilateral Agreements of Norway. Rev. Dev. Econ. , 21 (2) , 237–264, doi:10.1111/rode.12271.
Antwi-Agyei, P., A.J. Dougill, and L.C. Stringer, 2015: Barriers to climate change adaptation: evidence from northeast Ghana in the context of a systematic literature review. Clim. Dev. , 7(4) , 297–309, doi:10.1080/17565529.2014.951013.
Aragão, L.E.O.C. et al., 2018: 21st Century drought-related fires counteract the decline of Amazon deforestation carbon emissions. Nat. Commun. , 9(1) , 536, doi:10.1038/s41467-017-02771-y.
Arakelyan, I., A. Wreford, and D. Moran, 2017: Can agriculture be climate smart? In: Building a Climate Resilient Economy and Society[Ninan, K.N. and M. Inoue (eds.)]. Edward Elgar Publishing, Cheltenham and Northampton, UK, pp. 336.
Archanjo, B.S. et al., 2017: Nanoscale analyses of the surface structure and composition of biochars extracted from field trials or after co-composting using advanced analytical electron microscopy. Geoderma, 294, 70–79, doi:10.1016/j.geoderma.2017.01.037.
Arenas-Corraliza, M.G., M.L. López-Díaz, and G. Moreno, 2018: Winter cereal production in a Mediterranean silvoarable walnut system in the face of climate change. Agric. Ecosyst. Environ. , 264, 111–118, doi:10.1016/j.agee.2018.05.024.
Arévalo, P., P. Olofsson, and C.E. Woodcock, 2020: Continuous monitoring of land change activities and post-disturbance dynamics from Landsat time series: A test methodology for REDD+ reporting. Remote Sens. Environ. , 238, 111051, doi:10.1016/j.rse.2019.01.013.
Argañaraz, J.P., G. Gavier Pizarro, M. Zak, M.A. Landi, and L. M. Bellis, 2015: Human and biophysical drivers of fires in Semiarid Chaco mountains of Central Argentina. Sci. Total Environ. , 520, 1–12, doi:10.1016/j.scitotenv.2015.02.081.
Arifanti, V.B., J.B. Kauffman, D. Hadriyanto, D. Murdiyarso, and R. Diana, 2019: Carbon dynamics and land use carbon footprints in mangrove-converted aquaculture: The case of the Mahakam Delta, Indonesia. For. Ecol. Manage. , 432, 17–29, doi:10.1016/j.foreco.2018.08.047.
Arima, E.Y., P. Barreto, E. Araújo, and B. Soares-Filho, 2014: Public policies can reduce tropical deforestation: Lessons and challenges from Brazil. Land use policy, 41, 465–473, doi:10.1016/j.landusepol.2014.06.026.
Arneth, A. et al., 2017: Historical carbon dioxide emissions caused by land-use changes are possibly larger than assumed. Nat. Geosci. , 10(2) , 79, doi:10.1038/ngeo2882.
Arora, V.K. and A. Montenegro, 2011: Small temperature benefits provided by realistic afforestation efforts. Nat. Geosci. , 4, 514–518, doi:10.1038/ngeo1182.
Arora, V.K. and J.R. Melton, 2018: Reduction in global area burned and wildfire emissions since 1930s enhances carbon uptake by land. Nat. Commun. , 9(1) , 1326, doi:10.1038/s41467-018-03838-0.
Arrieta, E.M. and A.D. González, 2018: Impact of current, National Dietary Guidelines and alternative diets on greenhouse gas emissions in Argentina. Food Policy, 79, 58–66, doi:10.1016/j.foodpol.2018.05.003.
Artés, T. et al., 2019: A global wildfire dataset for the analysis of fire regimes and fire behaviour. Sci. Data, 6(1) , 296, doi:10.1038/s41597-019-0312-2.
Arts, B., V. Ingram, and M. Brockhaus, 2019: The Performance of REDD+: From Global Governance to Local Practices. Forests, 10(10) , 837, doi:10.3390/f10100837.
Aryal, J.P., D.B. Rahut, T.B. Sapkota, R. Khurana, and A. Khatri-Chhetri, 2020: Climate change mitigation options among farmers in South Asia. Environ. Dev. Sustain. , 22(4) , 3267–3289, doi:10.1007/s10668-019-00345-0.
Aschemann-Witzel, J., 2015: Consumer perception and trends about health and sustainability: trade-offs and synergies of two pivotal issues. Curr. Opin. Food Sci. , 3, 6–10, doi:10.1016/j.cofs.2014.08.002.
Ashton, M.S., M.L. Tyrrell, D. Spalding, and B. Gentry, 2012: Managing Forest Carbon in a Changing Climate. Springer, Dordrecht, The Netherlands, 882 pp.
Asner, G.P. and R. Tupayachi, 2016: Accelerated losses of protected forests from gold mining in the Peruvian Amazon. Environ. Res. Lett. , 12 (9) , 094004, doi:10.1088/1748-9326/aa7dab.
Asner, G.P. et al., 2005: Selective Logging in the Brazilian Amazon. Science, 310(5747) , 480–482, doi:10.1126/science.1118051.
Atwood, T.B. et al., 2017: Global patterns in mangrove soil carbon stocks and losses. Nat. Clim. Change, 7(7) , 523–528, doi:10.1038/nclimate3326.
Australian Government- Clean Energy Regulator, 2021: The Emission Reduction Fund Project Maps. http://www.cleanenergyregulator.gov.au/maps/Pages/erf-projects/index.html (Accessed August 21, 2021).
Austin, K.G., et al., 2020: The economic costs of planting, preserving, and managing the world’s forests to mitigate climate change. Nat. Commun. , 11, doi:10.1038/s41467-020-19578-z.
Awad, Y.M. et al., 2018: Biochar Effects on Rice Paddy: Meta-analysis. Advances in Agronomy[Sparks, D.L. (ed.)]. 148, 1–32, doi.org/10.1016/bs.agron.2017.11.005.
Awasthi, A., K. Singh, and R.P. Singh, 2017: A concept of diverse perennial cropping systems for integrated bioenergy production and ecological restoration of marginal lands in India. Ecol. Eng. , 105, 58–65, doi:10.1016/j.ecoleng.2017.04.049.
Azevedo, A.A. et al., 2017: Limits of Brazil’s Forest Code as a means to end illegal deforestation. Proc. Natl. Acad. Sci. , 114(29) , 7653–7658, doi:10.1073/pnas.1604768114.
Ba, S., Q. Qu, K. Zhang, and J.C.J. Groot, 2020: Meta-analysis of greenhouse gas and ammonia emissions from dairy manure composting. Biosyst. Eng. , 193, 126–137, doi:10.1016/j.biosystemseng.2020.02.015.
Baccini, A. et al., 2017: Tropical forests are a net carbon source based on aboveground measurements of gain and loss. Science, 358(6360) , 230–234, doi:10.1126/science.aam5962.
Bäckstrand, K., J.W. Kuyper, B.-O. Linnér, and E. Lövbrand, 2017: Non-state actors in global climate governance: from Copenhagen to Paris and beyond. Env. Polit. , 26(4) , 561–579, doi:10.1080/09644016.2017.1327485.
Bai, X. et al., 2019: Responses of soil carbon sequestration to climate‐smart agriculture practices: A meta‐analysis. Glob. Change Biol. , 25(8) , 2591–2606, doi:10.1111/gcb.14658.
Bajželj, B. et al., 2014: Importance of food-demand management for climate mitigation. Nat. Clim. Change, 4(10) , 924–929, doi:10.1038/nclimate2353.
Baka, J., 2014: What wastelands? A critique of biofuel policy discourse in South India. Geoforum, 54, 315–323, doi:10.1016/j.geoforum.2013.08.007.
Baker, E., V. Bosetti, L.D. Anadon, M. Henrion, and L. Aleluia Reis, 2015: Future costs of key low-carbon energy technologies: Harmonization and aggregation of energy technology expert elicitation data. Energy Policy, 80, 219–232, doi:10.1016/j.enpol.2014.10.008.
Baker, J.S., C.M. Wade, B.L. Sohngen, S. Ohrel, and A.A. Fawcett, 2019: Potential complementarity between forest carbon sequestration incentives and biomass energy expansion. Energy Policy, 126, 391–401, doi:10.1016/j.enpol.2018.10.009.
Bakkaloglu, S. et al., 2021: Quantification of methane emissions from UK biogas plants. Waste Manag. , 124, 82–93, doi:10.1016/j.wasman.2021.01.011.
Ballantyne, A.P., C.B. Alden, J.B. Miller, P.P. Tans, and J.W.C. White, 2012: Increase in observed net carbon dioxide uptake by land and oceans during the past 50 years. Nature, 488(7409) , 70–72, doi:10.1038/nature11299.
Balmford, A. et al., 2016: Getting Road Expansion on the Right Track: A Framework for Smart Infrastructure Planning in the Mekong. PLOS Biol. , 14(12) , e2000266, doi:10.1371/journal.pbio.2000266.
Barber, C.P., M.A. Cochrane, C.M. Souza, and W.F. Laurance, 2014: Roads, deforestation, and the mitigating effect of protected areas in the Amazon. Biol. Conserv. , 177, 203–209, doi:10.1016/j.biocon.2014.07.004.
Barbier, E.B. et al., 2011: The value of estuarine and coastal ecosystem services. Ecol. Monogr. , 81(2) , 169–193.
Barger, N.N., et al., 2018, Chapter 3: Direct and indirect drivers of land degradation and restoration. In: The IPBES assessment report on land degradation and restoration[Montanarella, L., R. Scholes, and A. Brainich (eds.)]. Secretariat of the Intergovernmental Science-Policy Platform on Biodiversity and Ecosystem Services, Bonn, Germany, pp. 137–218.
Bargués‐Tobella, A. et al., 2020: Trees in African drylands can promote deep soil and groundwater recharge in a future climate with more intense rainfall. L. Degrad. Dev. , 31(1) , 81–95, doi:10.1002/ldr.3430.
Baritz, R., L. Wiese, I. Verbeke, and R. Vargas, 2018: Voluntary Guidelines for Sustainable Soil Management: Global Action for Healthy Soils. In: International Yearbook of Soil Law and Policy 2017[Ginzky, H., E. Dooley, I.L. Heuser, E. Kasimbazi, T. Markus, and T. Qin (eds.)]. Springer, Cham, Switzerland, pp. 17–36.
Barlow, J., E. Berenguer, R. Carmenta, and F. França, 2020: Clarifying Amazonia’s burning crisis. Glob. Change Biol. , 26(2) , 319–321, doi:10.1111/gcb.14872.
Barretto, A.G.O.P., G. Berndes, G. Sparovek, and S. Wirsenius, 2013: Agricultural intensification in Brazil and its effects on land-use patterns: an analysis of the 1975-2006 period. Glob. Change Biol. , 19(6) , 1804–1815, doi:10.1111/gcb.12174.
Bastin, J.-F. et al., 2019: The global tree restoration potential. Science, 365(6448) , 76–79, doi:10.1126/science.aax0848.
Bastos, A. et al., 2020: Sources of Uncertainty in Regional and Global Terrestrial CO2Exchange Estimates. Global Biogeochem. Cycles, 34(2) , e2019GB006393, doi:10.1029/2019GB006393.
Bationo, A. et al., 2012: Knowing the African Soils to Improve Fertilizer Recommendations. In: Improving Soil Fertility Recommendations in Africa using the Decision Support System for Agrotechnology Transfer (DSSAT) [Kihara, J., D. Fatondji, J.W. Jones, G. Hoogenboom, R. Tabo, and A. Bationo (eds.)]. Springer Netherlands, Dordrecht, The Netherlands, pp. 19–42.
Batlle-Bayer, L. et al., 2020: Food affordability and nutritional values within the functional unit of a food LCA. An application on regional diets in Spain. Resour. Conserv. Recycl. , 160, 104856, doi:10.1016/j.resconrec.2020.104856.
Baudrier, M., V. Bellassen, and C. Foucherot, 2015: Previous Agricultural Emissions Policy (2003-2013) reduced French agricultural emissions. Climate Brief No. 49, IAEA. pp. 1–31. INIS-FR--16-1150, Paris, France.
Baumgartner, R.J., 2019: Sustainable Development Goals and the Forest Sector—a Complex Relationship. Forests, 10(2) , 152, doi:10.3390/f10020152.
Bayala, J., J. Sanou, Z. Teklehaimanot, A. Kalinganire, and S. Ouédraogo, 2014: Parklands for buffering climate risk and sustaining agricultural production in the Sahel of West Africa. Curr. Opin. Environ. Sustain. , 6, 28–34, doi:10.1016/j.cosust.2013.10.004.
Bayala, J. et al., 2015: Advances in knowledge of processes in soil–tree–crop interactions in parkland systems in the West African Sahel: A review. Agric. Ecosyst. Environ. , 205, 25–35, doi:10.1016/j.agee.2015.02.018.
Beach, R.H. et al., 2015: Global mitigation potential and costs of reducing agricultural non-CO2 greenhouse gas emissions through 2030. J. Integr. Environ. Sci. , 12(sup1) , 87–105, doi:10.1080/1943815X.2015.1110183.
Beauchemin, K.A., E.M. Ungerfeld, R.J. Eckard, and M. Wang, 2020: Review: Fifty years of research on rumen methanogenesis: lessons learned and future challenges for mitigation. Animal, 14, 2–16, doi:10.1017/S1751731119003100.
Bebber, D.P. and N. Butt, 2017: Tropical protected areas reduced deforestation carbon emissions by one third from 2000–2012. Sci. Rep. , 7(1) , 14005, doi:10.1038/s41598-017-14467-w.
Bedulli, C., P.S. Lavery, M. Harvey, C.M. Duarte, and O. Serrano, 2020: Contribution of Seagrass Blue Carbon Toward Carbon Neutral Policies in a Touristic and Environmentally-Friendly Island. Front. Mar. Sci. , 7, 1–12, doi:10.3389/fmars.2020.00001.
Bellassen, V. et al., 2021: The Carbon and Land Footprint of Certified Food Products. J. Agric. Food Ind. Organ. , 19(2) , 113–126, doi:10.1515/jafio-2019-0037.
Ben-Arye, T. and S. Levenberg, 2019: Tissue Engineering for Clean Meat Production. Front. Sustain. Food Syst. , 3, 1–19, doi:10.3389/fsufs.2019.00046.
Bengochea Paz, D., K. Henderson, and M. Loreau, 2020: Agricultural land use and the sustainability of social-ecological systems. Ecol. Modell. , 437, 109312, doi:10.1016/j.ecolmodel.2020.109312.
Bengtsson, J., et al., 2019: Grasslands—more important for ecosystem services than you might think. Ecosphere, 10(2) , 1–20, doi:10.1002/ecs2.2582.
Benson, T. and T. Mogues, 2018: Constraints in the fertilizer supply chain: evidence for fertilizer policy development from three African countries. Food Secur. , 10(6) , doi:10.1007/s12571-018-0863-7.
Bessou, C. et al., 2020: Accounting for soil organic carbon role in land use contribution to climate change in agricultural LCA: which methods? Which impacts?Int. J. Life Cycle Assess. , 25(7) , 1217–1230, doi:10.1007/s11367-019-01713-8.
Bhattacharya, P. and K.N. Ninan, 2011: Social cost-benefit analysis of intensive versus traditional shrimp farming: A case study from India. Nat. Resour. Forum, 35 (4) , 321–333, doi:10.1111/j.1477-8947.2011.01385.x.
Bhattarai, B., 2011: Assessment of mangrove forests in the Pacific region using Landsat imagery. J. Appl. Remote Sens. , 5(1) , 053509, doi:10.1117/1.3563584.
Bhomia, R.K. et al., 2019: Impacts of Mauritia flexuosa degradation on the carbon stocks of freshwater peatlands in the Pastaza-Marañón river basin of the Peruvian Amazon. Mitig. Adapt. Strateg. Glob. Change, 24(4) , 645–668, doi:10.1007/s11027-018-9809-9.
Biernat, L., F. Taube, R. Loges, C. Kluß, and T. Reinsch, 2020: Nitrous Oxide Emissions and Methane Uptake from Organic and Conventionally Managed Arable Crop Rotations on Farms in Northwest Germany. Sustainability, 12(8) , 3240, doi:10.3390/su12083240.
Binam, J.N. et al., 2015: Effects of farmer managed natural regeneration on livelihoods in semi-arid West Africa. Environ. Econ. Policy Stud. , 17 (4) , 543–575, doi:10.1007/s10018-015-0107-4.
Blackman, A., 2015: Strict versus mixed-use protected areas: Guatemala’s Maya Biosphere Reserve. Ecol. Econ. , 112, 14–24, doi:10.1016/j.ecolecon.2015.01.009.
Blackman, AP. Veit, 2018: Titled Amazon Indigenous Communities Cut Forest Carbon Emissions. Ecol. Econ. , 153, 56–67, doi:10.1016/j.ecolecon.2018.06.016.
Blackman, A., L. Goff, and M. Rivera Planter, 2018: Does eco-certification stem tropical deforestation? Forest Stewardship Council certification in Mexico. J. Environ. Econ. Manage. , 89, 306–333, doi:10.1016/j.jeem.2018.04.005.
Blaser, J. and C. Küchli, 2011: Globale Walderhaltung und -bewirtschaftung und ihre Finanzierung: eine Bestandesaufnahme (Global forest conservation and management and its financing: an appraisal). Schweizerische Zeitschrift fur Forstwes. , 162(4) , 107–116, doi:10.3188/szf.2011.0107.
Blaser, W.J. et al., 2018: Climate-smart sustainable agriculture in low-to-intermediate shade agroforests. Nat. Sustain. , 1(5) , 234–239, doi:10.1038/s41893-018-0062-8.
Blicharska, M. et al., 2019: Biodiversity’s contributions to sustainable development. Nat. Sustain. , 2(12) , 1083–1093, doi:10.1038/s41893- 019-0417-9.
Blok, K. et al., 2020: Assessment of Sectoral Greenhouse Gas Emission Reduction Potentials for 2030. Energies, 13(4) , 943, doi:10.3390/en13040943.
Bockstael, N.E., A.M. Freeman, R.J. Kopp, P.R. Portney, and V.K. Smith, 2000: On Measuring Economic Values for Nature. Environ. Sci. Technol. , 34(8) , 1384–1389, doi:10.1021/es990673l.
Bodirsky, B.L. et al., 2020: The ongoing nutrition transition thwarts long-term targets for food security, public health and environmental protection. Sci. Rep. , 10(1) , 19778, doi:10.1038/s41598-020-75213-3.
Bolinder, M.A., et al., 2020: The effect of crop residues, cover crops, manures and nitrogen fertilization on soil organic carbon changes in agroecosystems: a synthesis of reviews. Mitig. Adapt. Strateg. Glob. Change, 25, 929–952, doi:10.1007/s11027-020-09916-3.
Bonan, G.B., 2016: Forests, Climate, and Public Policy: A 500-Year Interdisciplinary Odyssey. Annu. Rev. Ecol. Evol. Syst. , 47(1) , 97–121, doi:10.1146/annurev-ecolsys-121415-032359.
Bond, W.J., N. Stevens, G.F. Midgley, and C.E.R. Lehmann, 2019: The Trouble with Trees: Afforestation Plans for Africa. Trends Ecol. Evol. , 34(11) , 963–965, doi:10.1016/j.tree.2019.08.003.
Boone Kauffman, J. et al., 2017: The jumbo carbon footprint of a shrimp: carbon losses from mangrove deforestation. Front. Ecol. Environ. , 15(4) , 183–188, doi:10.1002/fee.1482.
Bora, R.R., M. Lei, J.W. Tester, J. Lehmann, and F. You, 2020a: Life Cycle Assessment and Technoeconomic Analysis of Thermochemical Conversion Technologies Applied to Poultry Litter with Energy and Nutrient Recovery. ACS Sustain. Chem. Eng. , 8(22) , 8436–8447, doi:10.1021/acssuschemeng.0c02860.
Bora, R.R. et al., 2020b: Techno-Economic Feasibility and Spatial Analysis of Thermochemical Conversion Pathways for Regional Poultry Waste Valorization. ACS Sustain. Chem. Eng. , 8(14) , 5763–5775, doi:10.1021/acssuschemeng.0c01229.
Borchard, N. et al., 2019: Biochar, soil and land-use interactions that reduce nitrate leaching and N2O emissions: A meta-analysis. Sci. Total Environ. , 651, 2354–2364, doi:10.1016/j.scitotenv.2018.10.060.
Börner, J. et al., 2017: The Effectiveness of Payments for Environmental Services. World Dev. , 96, 359–374, doi:10.1016/J.WORLDDEV.2017.03.020.
Borras, S.M. and J.C. Franco, 2018: The challenge of locating land-based climate change mitigation and adaptation politics within a social justice perspective: towards an idea of agrarian climate justice. Third World Q. , 39(7) , 1308–1325, doi:10.1080/01436597.2018.1460592.
Bos, A.B., 2020: Towards performance assessment of subnational forest-based climate change mitigation initiatives. PhD Thesis synthesis 24 p., Wageningen University, Wageningen, The Netherlands.
Bossio, D.A. et al., 2020: The role of soil carbon in natural climate solutions. Nat. Sustain. , 3(5) , 391–398, doi:10.1038/s41893-020-0491-z.
Bowler, D.E. et al., 2012: Does community forest management provide global environmental benefits and improve local welfare?Front. Ecol. Environ. , 10(1) , 29–36, doi:10.1890/110040.
Bowman, D.M.J.S. et al., 2019: Human–environmental drivers and impacts of the globally extreme 2017 Chilean fires. Ambio, 48(4) , 350–362, doi:10.1007/s13280-018-1084-1.
Bowman, D.M.J.S. et al., 2020a: Vegetation fires in the Anthropocene. Nat. Rev. Earth Environ. , 1(10) , 500–515, doi:10.1038/s43017-020-0085-3.
Bowman, D.M.J.S., G.J. Williamson, O.F. Price, M.N. Ndalila, and R.A. Bradstock, 2020b: Australian forests, megafires and the risk of dwindling carbon stocks. Plant. Cell Environ. , 44(2) , 347–355, doi:10.1111/pce.13916.
Brandão, M., M.U.F. Kirschbaum, A.L. Cowie, and S. V. Hjuler, 2019: Quantifying the climate change effects of bioenergy systems: Comparison of 15 impact assessment methods. GCB Bioenergy, 11(5) , 727–743, doi:10.1111/gcbb.12593.
Brando, P.M. et al., 2014: Abrupt increases in Amazonian tree mortality due to drought-fire interactions. Proc. Natl. Acad. Sci. , 111(17) , 6347–6352, doi:10.1073/pnas.1305499111.
Brandt, M. et al., 2019a: Changes in rainfall distribution promote woody foliage production in the Sahel. Commun. Biol. , 2(1) , 133, doi:10.1038/s42003-019-0383-9.
Brandt, P., G. Yesuf, M. Herold, and M.C. Rufino, 2019b: Intensification of dairy production can increase the GHG mitigation potential of the land use sector in East Africa. Glob. Change Biol. , 26(2) , 568–585, doi:10.1111/gcb.14870.
Braun, M. et al., 2016: A holistic assessment of greenhouse gas dynamics from forests to the effects of wood products use in Austria. Carbon Manag. , 7(5–6) , 271–283, doi:10.1080/17583004.2016.1230990.
Bristow, M. et al., 2016: Quantifying the relative importance of greenhouse gas emissions from current and future savanna land use change across northern Australia. Biogeosciences, 13(22) , 6285–6303, doi:10.5194/bg-13-6285-2016.
Brown, B., R. Fadillah, Y. Nurdin, I. Soulsby, and R. Ahmad, 2014: Community Based Ecological Mangrove Rehabilitation (CBEMR) in Indonesia. S.a.p.i.en.s, 7(2) , 1–13.
Brunet-Navarro, P., H. Jochheim, and B. Muys, 2017: The effect of increasing lifespan and recycling rate on carbon storage in wood products from theoretical model to application for the European wood sector. Mitig. Adapt. Strateg. Glob. Change, 22(8) , 1193–1205, doi:10.1007/s11027-016-9722-z.
Buchholz, T., M.D. Hurteau, J. Gunn, and D. Saah, 2016: A global meta-analysis of forest bioenergy greenhouse gas emission accounting studies. GCB Bioenergy, 8(2) , 281–289, doi:10.1111/gcbb.12245.
Buchner, B.K., C. Trabacchi, F. Mazza, D. Abramskiehn, and D. Wang, 2015: A CPI Report –Global Landscape of Climate Finance 2015. Climate Policy Initiative (CPI), London, UK, 17 pp.
Buchspies, B., M. Kaltschmitt, and M. Junginger, 2020: Straw utilization for biofuel production: A consequential assessment of greenhouse gas emissions from bioethanol and biomethane provision with a focus on the time dependency of emissions. GCB Bioenergy, 12(10) , 789–805, doi:10.1111/gcbb.12734.
Burivalova, Z. et al., 2019: What works in tropical forest conservation, and what does not: Effectiveness of four strategies in terms of environmental, social, and economic outcomes. Conserv. Sci. Pract. , 1(6) , e28, doi:10.1111/csp2.28.
Burney, J.A., S.J. Davis, and D.B. Lobell, 2010: Greenhouse gas mitigation by agricultural intensification. Proc. Natl. Acad. Sci. , 107(26) , 12052–12057, doi:10.1073/pnas.0914216107.
Busch, J. and K. Ferretti-Gallon, 2017: What drives deforestation and what stops it? A meta-analysis. Rev. Environ. Econ. Policy, 11, 3–23, doi:10.1093/reep/rew013.
Busch, J. et al., 2019: Potential for low-cost carbon dioxide removal through tropical reforestation. Nat. Clim. Change, 9(6) , 463–466, doi:10.1038/s41558-019-0485-x.
Butsic, V., M. Baumann, A. Shortland, S. Walker, and T. Kuemmerle, 2015: Conservation and conflict in the Democratic Republic of Congo: The impacts of warfare, mining, and protected areas on deforestation. Biol. Conserv. , 191, 266–273, doi:10.1016/j.biocon.2015.06.037.
Cabral, R.P., M. Bui, and N. Mac Dowell, 2019: A synergistic approach for the simultaneous decarbonisation of power and industry via bioenergy with carbon capture and storage (BECCS). Int. J. Greenh. Gas Control, 87, 221–237, doi:10.1016/j.ijggc.2019.05.020.
Cadier, C., E. Bayraktarov, R. Piccolo, and M.F. Adame, 2020: Indicators of Coastal Wetlands Restoration Success: A Systematic Review. Front. Mar. Sci. , 7, Art 600220. doi:10.3389/fmars.2020.600220.
Calvin, K. et al., 2021: Bioenergy for climate change mitigation: Scale and sustainability. GCB Bioenergy, 13(9) , 1346–1371, doi:10.1111/gcbb.12863.
Cameron, C., L.B. Hutley, D.A. Friess, and B. Brown, 2019: Community structure dynamics and carbon stock change of rehabilitated mangrove forests in Sulawesi, Indonesia. Ecol. Appl. , 29(1) , e1810 doi:10.1002/eap.1810.
Camia, A. et al., 2020: The use of woody biomass for energy production in the EU. Publications Office of the European Union, Luxembourg, 182 pp.
Campbell, M., M. Alamgir, and W. Laurance, 2017: Roads to ruin: Can we build roads that benefit people while not destroying nature?Australas. Sci. , 38(2) , 40–41.
Carattini, S., A. Baranzini, and R. Lalive, 2018: Is Taxing Waste a Waste of Time? Evidence from a Supreme Court Decision. Ecol. Econ. , 148, 131–151, doi:10.1016/j.ecolecon.2018.02.001.
CARB, 2019: California Tropical Forest Standard: Criteria for Assessing Jurisdiction-Scale Programs that Reduce Emissions from Tropical Deforestation. California Air Resources Board, California, USA, 49 pp.
Cardinael, R. et al., 2018: Revisiting IPCC Tier 1 coefficients for soil organic and biomass carbon storage in agroforestry systems. Environ. Res. Lett. , 13(12) , 124020, doi:10.1088/1748-9326/aaeb5f.
Caro, D., E. Kebreab, and F.M. Mitloehner, 2016: Mitigation of enteric methane emissions from global livestock systems through nutrition strategies. Clim. Change, 137(3–4) , 467–480, doi:10.1007/s10584-016-1686-1.
Caro Torres, P., W. de Jong, A. Denvir, D. Humphreys, and K. McGinley, 2016:Can Legality Verification enhance local rights to forest resources? Piloting the policy learning protocol in the Peruvian forest context . International Union of Forest Research Organizations (IUFRO) and Yale University’s Governance, Environment and Markets (GEM) Initiative, IUFRO, Vienna, Austria, 113 pp. http://www.iufro.org/science/divisions/division-9/90000/90500/90505/publications/.
Carrijo, D.R., M.E. Lundy, and B.A. Linquist, 2017: Rice yields and water use under alternate wetting and drying irrigation: A meta-analysis. F. Crop. Res. , 203, 173–180, doi:10.1016/j.fcr.2016.12.002.
Carroll, J. and A.J. Daigneault, 2019: Achieving ambitious climate targets: Is it economical for New Zealand to invest in agricultural GHG mitigation?Environ. Res. Lett. , 14: 124064 doi:10.1088/1748-9326/ab542a.
Carvalho, J.L.N. et al., 2014: Crop-pasture rotation: A strategy to reduce soil greenhouse gas emissions in the Brazilian Cerrado. Agric. Ecosyst. Environ. , 183, 167–175, doi:10.1016/j.agee.2013.11.014.
Carvalho, J.L.N., T.W. Hudiburg, H.C.J. Franco, and E.H. DeLucia, 2017: Contribution of above‐ and belowground bioenergy crop residues to soil carbon. GCB Bioenergy, 9(8) , 1333–1343, doi:10.1111/gcbb.12411.
Cassman, K. and P. Grassini, 2020: A global perspective on sustainable intensification research. Nat. Sustain. , 3(4) , 262–268, doi:10.1038/s41893-020-0507-8.
Cayuela, M.L. et al., 2014: Biochar’s role in mitigating soil nitrous oxide emissions: A review and meta-analysis. Agric. Ecosyst. Environ. , 191(0) , 5–16, doi:10.1016/j.agee.2013.10.009.
Cayuela, M.L., S. Jeffery, and L. van Zwieten, 2015: The molar H:Corg ratio of biochar is a key factor in mitigating N2O emissions from soil. Agric. Ecosyst. Environ. , 202, 135–138, doi:10.1016/j.agee.2014.12.015.
CBI, 2020: Climate Bonds Initiative: Certification Ecoagro-Rizoma Agro, Brazil. https://www.climatebonds.net/certification/ecoagro-rizoma. (Accessed April 15, 2021).
Ceccherini, G. et al., 2020: Abrupt increase in harvested forest area over Europe after 2015. Nature, 583(7814) , 72–77, doi:10.1038/s41586-020-2438-y.
Ceddia, M.G., S. Sedlacek, N.O. Bardsley, and S. Gomez-y-Paloma, 2013: Sustainable agricultural intensification or Jevons paradox? The role of public governance in tropical South America. Glob. Environ. Change, 23(5) , 1052–1063, doi:10.1016/j.gloenvcha.2013.07.005.
Chabé-Ferret, S. and J. Subervie, 2013: How much green for the buck? Estimating additional and windfall effects of French agro-environmental schemes by DID-matching. J. Environ. Econ. Manage. , 65 (1) , 12–27, doi:10.1016/j.jeem.2012.09.003.
Chagas, J.C., M. Ramin, and S.J. Krizsan, 2019: In Vitro Evaluation of Different Dietary Methane Mitigation Strategies. Animals, 9(12) , 1120, doi:10.3390/ani9121120.
Chapman, M. et al., 2020: Large climate mitigation potential from adding trees to agricultural lands. Glob. Change Biol. , 26(8) , 4357–4365, doi:10.1111/gcb.15121.
Chen, K., Y. Wang, R. Zhang, H. Zhang, and C. Gao, 2019: CRISPR/Cas Genome Editing and Precision Plant Breeding in Agriculture. Annu. Rev. Plant Biol. , 70(1) , 667–697, doi:10.1146/annurev-arplant-050718-100049.
Cherubini, F. et al., 2009: Energy- and greenhouse gas-based LCA of biofuel and bioenergy systems: Key issues, ranges and recommendations. Resour. Conserv. Recycl. , 53 (8) , 434–447, doi:10.1016/j.resconrec.2009.03.013.
Chevallier, F. et al., 2005: Inferring CO2 sources and sinks from satellite observations: Method and application to TOVS data. J. Geophys. Res. , 110(D24) , D24309, doi:10.1029/2005JD006390.
Chiaramonti, D and C. Panoutsou, 2018: Low-ILUC biofuel production in marginal areas: Can existing EU policies support biochar deployment in EU MED arid lands under desertification?Chem. Eng. Trans. , 65, 841–846, doi:10.3303/CET1865141.
Chidthaisong, A. et al., 2018: Evaluating the effects of alternate wetting and drying (AWD) on methane and nitrous oxide emissions from a paddy field in Thailand. Soil Sci. Plant Nutr. , 64(1) , 31–38, doi:10.1080/00380768.2017.1399044.
Chimner, R.A., D.J. Cooper, F.C. Wurster, and L. Rochefort, 2017: An overview of peatland restoration in North America: where are we after 25 years?Restor. Ecol. , 25(2) , 283–292, doi:10.1111/rec.12434.
Chisholm, R.A., L.S. Wijedasa, and T. Swinfield, 2016: The need for long-term remedies for Indonesia’s forest fires. Conserv. Biol. , 30(1) , 5–6, doi:10.1111/cobi.12662.
Chomba, S., F. Sinclair, P. Savadogo, M. Bourne, and M. Lohbeck, 2020: Opportunities and Constraints for Using Farmer Managed Natural Regeneration for Land Restoration in Sub-Saharan Africa. Front. For. Glob. Change, 3, 571679 . doi:10.3389/ffgc.2020.571679.
Chriki, S. and J.-F. Hocquette, 2020: The Myth of Cultured Meat: A Review. Front. Nutr. , 7 (February), 1–9, doi:10.3389/fnut.2020.00007.
Chum, H., A. Faaij, J. Moreira, G. Berndes, P. Dhamija, H. Dong, B. Gabrielle, A. Goss Eng, W. Lucht, M. Mapako, O. Masera Cerutti, T. McIntyre, T. Minowa, and K. Pingoud, 2011: Bioenergy. In: IPCC Special Report on Renewable Energy Sources and Climate Change Mitigation[Edenhofer, O., R. Pichs-Madruga, Y. Sokona, K. Seyboth, P. Matschoss, S. Kadner, T. Zwickel, P. Eickemeier, G. Hansen, S. Schlömer, and C. von Stechow (eds.)]. Cambridge University Press, Cambridge, UK, and New York, NY, USA, pp. 209–332.
Churkina, G. et al., 2020: Buildings as a global carbon sink. Nat. Sustain. , 3(4) , 269–276, doi:10.1038/s41893-019-0462-4.
Claassen, R., F. Carriazo, and K. Ueda, 2010: Grassland Conversion for Crop Production in the United States: Defining Indicators for Policy Analysis. OECD Agri-environmental Indicators: Lessons Learned and Future Directions. Organisation for Economic Co-operation and Development (OECD), Washington, DC, USA, 27.
Claassen, R., C. Langpap, and J. Wu, 2017: Impacts of Federal Crop Insurance on Land Use and Environmental Quality. Am. J. Agric. Econ. , 99(3) , 592–613, doi:10.1093/ajae/aaw075.
Claassen, R., E.N. Duquette, and D.J. Smith, 2018: Additionality in U.S. Agricultural Conservation Programs. Land Econ. , 94(1) , 19–35, doi:10.3368/le.94.1.19.
Clark, H., C. Pinares-Patiño, and C. DeKlein, 2005: Relationships between biodiversity and production in grasslands at local and regional scales. In: Grassland: a global resource[McGilloway, D.A. (ed.)]. Wageningen Academic Publishers, Wageningen, The Netherlands, 279–293 pp.
Clark, M. and D. Tilman, 2017: Comparative analysis of environmental impacts of agricultural production systems, agricultural input efficiency, and food choice. Environ. Res. Lett. , 12(6) , 064016, doi:10.1088/1748-9326/aa6cd5.
Clark, M.A. et al., 2020: Global food system emissions could preclude achieving the 1.5° and 2°C climate change targets. Science, 370(6517) , 705–708, doi:10.1126/science.aba7357.
Climate Smart Forest and Nature Management, 2021: European Network, Climate-Smart Forestry in Europe. https://www.vbne.nl/klimaatslimbosen natuurbeheer/projecten-europa (Accessed April 15, 2021).
Cohn, A.S. et al., 2019: Forest loss in Brazil increases maximum temperatures within 50 km. Environ. Res. Lett. , 14(8) , 084047, doi:10.1088/1748-9326/ab31fb.
Colley, T.A., S.I. Olsen, M. Birkved, and M.Z. Hauschild, 2020: Delta Life Cycle Assessment of Regenerative Agriculture in a Sheep Farming System. Integr. Environ. Assess. Manag. , 16(2) , 282–290, doi:10.1002/ieam.4238.
Conant, R.T., C.E.P. Cerri, B.B. Osborne, and K. Paustian, 2017: Grassland management impacts on soil carbon stocks: a new synthesis. Ecol. Appl. , 27(2) , 662–668, doi:10.1002/eap.1473.
Conchedda, G. and F.N. Tubiello, 2020: Drainage of organic soils and GHG emissions: validation with country data. Earth Syst. Sci. Data, 12(4) , 3113–3137, doi:10.5194/essd-12-3113-2020.
Contreras-Negrete, G. et al., 2014: Genetic diversity and structure of wild and managed populations of Polaskia chende (Cactaceae) in the Tehuacán-Cuicatlán Valley, Central Mexico: insights from SSR and allozyme markers. Genet. Resour. Crop Evol. , 62(1) , 85–101, doi:10.1007/s10722-014-0137-y.
Cook-Patton, S.C. et al., 2020: Mapping carbon accumulation potential from global natural forest regrowth. Nature, 585(7826) , 545–550, doi:10.1038/s41586-020-2686-x.
Corbeels, M., R. Cardinael, K. Naudin, H. Guibert, and E. Torquebiau, 2019: The 4 per 1000 goal and soil carbon storage under agroforestry and conservation agriculture systems in sub-Saharan Africa. Soil Tillage Res. , 188, 16–26, doi:10.1016/j.still.2018.02.015.
Corbeels, M., R. Cardinael, D. Powlson, R. Chikowo, and B. Gerard, 2020: Carbon sequestration potential through conservation agriculture in Africa has been largely overestimated. Soil Tillage Res. , 196, 104300, doi:10.1016/j.still.2019.104300.
Costanza, R. et al., 1997: The value of the world’s ecosystem services and natural capital. Nature, 387(6630) , 253–260, doi:10.1038/387253a0.
Costanza, R. et al., 2014: Changes in the global value of ecosystem services. Glob. Environ. Change, 26, 152–158, doi:10.1016/j.gloenvcha.2014.04.002.
Couwenberg, J., R. Dommain, and H. Joosten, 2010: Greenhouse gas fluxes from tropical peatlands in south-east Asia. Glob. Change Biol. , 16(6) , 1715–1732, doi:10.1111/j.1365-2486.2009.02016.x.
Cowie, A.L. et al., 2021: Applying a science‐based systems perspective to dispel misconceptions about climate effects of forest bioenergy. GCB Bioenergy, 13(8) , 1210–1231, doi:10.1111/gcbb.12844.
Creutzig, F. et al., 2018: Towards demand-side solutions for mitigating climate change. Nat. Clim. Change, 8(4) , 260–263, doi:10.1038/s41558-018-0121-1.
Crippa, M. et al., 2021: EDGAR v6.0 Greenhouse Gas Emissions. European Commission, Joint Research Centre (JRC), Ispra, Italy. https://edgar.jrc.ec.europa.eu/dataset_ghg60 (Accessed May 1, 2021).
Crooks, S., D. Herr, J. Tamelander, D. Laffoley, and J. Vandever, 2011: Mitigating climate change through restoration and management of coastal wetlands and near-shore marine ecosystems: challenges and opportunities. The World Bank, Washington, DC, 69 pp, https://openknowledge.worldbank.org/handle/10986/18318.
Crusius, J., 2020: “Natural” Climate Solutions Could Speed Up Mitigation, With Risks. Additional Options Are Needed. Earth’s Futur. , 8(4) , doi:10.1029/2019EF001310.
da Silva, S.S. et al., 2021: Burning in southwestern Brazilian Amazonia, 2016–2019. J. Environ. Manage. , 286, 112189, doi:10.1016/j.jenvman.2021.112189.
Daioglou, V., B. Wicke, A.P.C. Faaij, and D.P. van Vuuren, 2015: Competing uses of biomass for energy and chemicals: implications for long-term global CO2 mitigation potential. GCB Bioenergy, 7(6) , 1321–1334, doi:10.1111/gcbb.12228.
Daioglou, V. et al., 2017: Greenhouse gas emission curves for advanced biofuel supply chains. Nat. Clim. Change, 7(12) , 920–924, doi:10.1038/s41558-017-0006-8.
Daioglou, V., J.C. Doelman, B. Wicke, A. Faaij, and D.P. van Vuuren, 2019: Integrated assessment of biomass supply and demand in climate change mitigation scenarios. Glob. Environ. Change, 54, 88–101, doi:10.1016/j.gloenvcha.2018.11.012.
Daioglou et al., 2020b: Bioenergy technologies in long-run climate change mitigation: results from the EMF-33 study. Clim. Change, 163, 1603–1620, doi:10.1007/s10584-020-02799-y.
Dargie, G.C. et al., 2017: Age, extent and carbon storage of the central Congo Basin peatland complex. Nature, 542(7639) , 86–90, doi:10.1038/nature21048.
Dargie, G.C. et al., 2019: Congo Basin peatlands: threats and conservation priorities. Mitig. Adapt. Strateg. Glob. Change, 24(4) , 669–686, doi:10.1007/s11027-017-9774-8.
Dasgupta, P., 2021: The Economics of Biodiversity: The Dasgupta Review. HM Treasury, UK Government, London, UK, 126–145 pp.
Dass, P., B.Z. Houlton, Y. Wang, and D. Warlind, 2018: Grasslands may be more reliable carbon sinks than forests in California. Environ. Res. Lett. , 13(7) , 074027, doi:10.1088/1748-9326/aacb39.
Davin, E.L. and N. de Noblet-Ducoudré, 2010: Climatic Impact of Global-Scale Deforestation: Radiative versus Nonradiative Processes. J. Clim. , 23(1) , 97–112, doi:10.1175/2009JCLI3102.1.
de Figueiredo, E.B. et al., 2017: Greenhouse gas balance and carbon footprint of beef cattle in three contrasting pasture-management systems in Brazil. J. Clean. Prod. , 142, 420–431, doi:10.1016/j.jclepro.2016.03.132.
de Groot, R. et al., 2012: Global estimates of the value of ecosystems and their services in monetary units. Ecosyst. Serv. , 1(1) , 50–61, doi:10.1016/j.ecoser.2012.07.005.
de Klein, C.A.M., T.J. van der Weerden, J. Luo, K.C. Cameron, and H.J. Di, 2020: A review of plant options for mitigating nitrous oxide emissions from pasture-based systems. New Zeal. J. Agric. Res. , 63(1) , 29–43, doi:10.1080/00288233.2019.1614073.
de los Santos, C.B. et al., 2019: Recent trend reversal for declining European seagrass meadows. Nat. Commun. , 10(1) , 3356, doi:10.1038/s41467-019-11340-4.
de Oliveira Garcia, W., T. Amann, and J. Hartmann, 2018: Increasing biomass demand enlarges negative forest nutrient budget areas in wood export regions. Sci. Rep. , 8(1) , 5280, doi:10.1038/s41598-018-22728-5.
de Ponti, T., B. Rijk, and M.K. van Ittersum, 2012: The crop yield gap between organic and conventional agriculture. Agric. Syst. , 108, 1–9, doi:10.1016/j.agsy.2011.12.004.
De Stefano, A., M.G. Jacobson, 2017: Soil carbon sequestration in agroforestry systems: a meta-analysis. Agrofor. Syst. , 92(2) , 285–299, doi:10.1007/s10457-017-0147-9.
de Vrese, P., S. Hagemann, and M. Claussen, 2016: Asian irrigation, African rain: Remote impacts of irrigation. Geophys. Res. Lett. , 43(8) , 3737–3745, doi:10.1002/2016GL068146.
DeCicco, J.M. and W.H. Schlesinger, 2018: Opinion: Reconsidering bioenergy given the urgency of climate protection. Proc. Natl. Acad. Sci. , 115(39) , 9642–9645, doi:10.1073/pnas.1814120115.
DeCiucies, S., T. Whitman, D. Woolf, A. Enders, and J. Lehmann, 2018: Priming mechanisms with additions of pyrogenic organic matter to soil. Geochim. Cosmochim. Acta, 238, 329–342, doi:10.1016/j.gca.2018.07.004.
Deininger, K. and B. Minten, 2002: Determinants of Deforestation and the Economics of Protection: An Application to Mexico. Am. J. Agric. Econ. , 84(4) , 943–960, doi:10.1111/1467-8276.00359.
Department of Agriculture, 2020: Farm Income and Wealth Statistics.U.S. Department of Agriculture, https://www.ers.usda.gov/data-products/farm-income-and-wealth-statistics/data-files-us-and-state-level-farm-income-and-wealth-statistics (Accessed March 23, 2021).
Descheemaeker, K. et al., 2016: Climate change adaptation and mitigation in smallholder crop–livestock systems in sub-Saharan Africa: a call for integrated impact assessments. Reg. Environ. Change, 16(8) , 2331–2343, doi:10.1007/s10113-016-0957-8.
Devaraju, N., N. de Noblet-Ducoudré, B. Quesada, and G. Bala, 2018: Quantifying the Relative Importance of Direct and Indirect Biophysical Effects of Deforestation on Surface Temperature and Teleconnections. J. Clim. , 31(10) , 3811–3829, doi:10.1175/JCLI-D-17-0563.1.
Dezécache, C. et al., 2017: Gold-rush in a forested El Dorado: deforestation leakages and the need for regional cooperation. Environ. Res. Lett. , 12(3) , 034013, doi:10.1088/1748-9326/aa6082.
Di, H.J and K.C. Cameron, 2016: Inhibition of nitrification to mitigate nitrate leaching and nitrous oxide emissions in grazed grassland: a review. J. Soils Sediments, 16(5) , 1401–1420, doi:10.1007/s11368-016-1403-8.
Dickie, A. et al., 2014a: Strategies for Mitigating Climate Change in Agriculture: Recommendations for Philanthropy – Executive Summary. Climate Focus and California Environmental Associate, Climate and Land Use Alliance, San Francisco, USA. 17 pp.
Dickie, I.A. et al., 2014b: Conflicting values: ecosystem services and invasive tree management. Biol. Invasions, 16(3) , 705–719, doi:10.1007/s10530-013-0609-6.
Dioha, M.O. and A. Kumar, 2020: Exploring greenhouse gas mitigation strategies for agriculture in Africa: The case of Nigeria. Ambio, 49(9) , 1549–1566, doi:10.1007/s13280-019-01293-9.
Doelman, J.C. et al., 2018: Exploring SSP land-use dynamics using the IMAGE model: Regional and gridded scenarios of land-use change and land-based climate change mitigation. Glob. Environ. Change, 48, 119–135, doi:10.1016/j.gloenvcha.2017.11.014.
Doelman, J.C. et al., 2020: Afforestation for climate change mitigation: Potentials, risks and trade‐offs. Glob. Change Biol. , 26(3) , 1576–1591, doi:10.1111/gcb.14887.
Domke, G., A. Brandon, R. Diaz-Lasco, S. Federici, E. Garcia-Apaza, G. Grassi, T. Gschwantner, M. Herold, Y. Hirata, Å. Kasimir, M.J. Kinyanjui, H. Krisnawati, A. Lehtonen, R.E. Malimbwi, S. Niinistö, S.M. Ogle, T. Paul, N.H. Ravindranath, J. Rock, C.R. Sanquetta, M.J.S. Sanchez, M. Vitullo, S.J. Wakelin, and J. Zhu., 2019: Refinement to the 2006 IPCC Guidelines for National Greenhouse Gas Inventories. Vol. 4, Agriculture, Forestry and Other Land Use, Chapter 4, Forest Land [Calvo Buendia, E., K. Tanabe, A. Kranjc, J. Baasansuren, M. Fukuda, S. Ngarize, A. Osako, Y. Pyrozhenko, P. Shermanau, and S. Federici (eds.)]. Intergovernmental Panel on Climate Change (IPCC), Geneva, Switzerland, 71 pp.
Domke, G.M., S.N. Oswalt, B.F. Walters, and R.S. Morin, 2020: Tree planting has the potential to increase carbon sequestration capacity of forests in the United States. Proc. Natl. Acad. Sci. , 117(40) , 24649–24651, doi:10.1073/pnas.2010840117.
Donato, D.C., J.B. Kauffman, R.A. Mackenzie, A. Ainsworth, and A.Z. Pfleeger, 2012: Whole-island carbon stocks in the tropical Pacific: Implications for mangrove conservation and upland restoration. J. Environ. Manage. , 97, 89–96, doi:10.1016/j.jenvman.2011.12.004.
Donnison, C. et al., 2020: Bioenergy with Carbon Capture and Storage (BECCS): Finding the win–wins for energy, negative emissions and ecosystem services—size matters. GCB Bioenergy, 12(8) , 586–604, doi:10.1111/gcbb.12695.
Dooley, K. and S. Kartha, 2018: Land-based negative emissions: risks for climate mitigation and impacts on sustainable development. Int. Environ. Agreements Polit. Law Econ. , 18(1) , 79–98, doi:10.1007/s10784-017-9382-9.
Drew, J., C. Cleghorn, A. Macmillan, and A. Mizdrak, 2020: Healthy and Climate-Friendly Eating Patterns in the New Zealand Context. Environ. Health Perspect. , 128(1) , 017007, doi:10.1289/EHP5996.
Drews, M., M.A.D. Larsen, and J.G. Peña Balderrama, 2020: Projected water usage and land-use-change emissions from biomass production (2015–2050). Energy Strateg. Rev. , 29, 100487, doi:10.1016/j.esr.2020.100487.
Du, Y.-D. et al., 2018: Crop yield and water use efficiency under aerated irrigation: A meta-analysis. Agric. Water Manag. , 210, 158–164, doi:10.1016/j.agwat.2018.07.038.
Duarte, C.M. et al., 2020: Rebuilding marine life. Nature, 580(7801) , 39–51, doi:10.1038/s41586-020-2146-7.
Duffy, K.A. et al., 2021: How close are we to the temperature tipping point of the terrestrial biosphere?Sci. Adv. , 7(3) , doi:10.1126/sciadv.aay1052.
Duguma, L.A., P.A. Minang, and M. van Noordwijk, 2014: Climate Change Mitigation and Adaptation in the Land Use Sector: From Complementarity to Synergy. Environ. Manage. , 54(3) , 420–432, doi:10.1007/s00267-014-0331-x.
Dulac, J., 2013: Global land transport infrastructure requirements. Estimating road and railway infrastructure capacity and costs to 2050. 54p. International Energy Agency (IEA), Paris, France.
Dunic, J.C., C.J. Brown, R.M. Connolly, M.P. Turschwell, and I.M. Côté, 2021: Long‐term declines and recovery of meadow area across the world’s seagrass bioregions. Glob. Change Biol. , 27(17) , 4096–4109, doi:10.1111/gcb.15684.
Eckard, R. and H. Clark, 2020: Potential solutions to the major greenhouse-gas issues facing Australasian dairy farming. Anim. Prod. Sci. , 60(1) , 10, doi:10.1071/AN18574.
Ekholm, T., 2020: Optimal forest rotation under carbon pricing and forest damage risk. For. Policy Econ. , 115, 102131, doi:10.1016/j.forpol.2020.102131.
Elbersen, B. et al., 2020: Definition and classification of marginal lands suitable for industrial crops in Europe. Wageningen University, Wageningen, The Netherlands, 62 pp.
Elevitch, C., D. Mazaroli, and D. Ragone, 2018: Agroforestry Standards for Regenerative Agriculture. Sustainability, 10 (9) , 3337, doi:10.3390/su10093337.
Elliott, M. et al., 2016: Ecoengineering with Ecohydrology: Successes and failures in estuarine restoration. Estuar. Coast. Shelf Sci. , 176, 12–35, doi:10.1016/j.ecss.2016.04.003.
Ellis, P.W. et al., 2019: Reduced-impact logging for climate change mitigation (RIL-C) can halve selective logging emissions from tropical forests. For. Ecol. Manage. , 438, 255–266, doi:10.1016/j.foreco.2019.02.004.
Ellison, D. et al., 2017: Trees, forests and water: Cool insights for a hot world. Glob. Environ. Change, 43, 51–61, doi:10.1016/j.gloenvcha.2017.01.002.
Elshout, P.M.F. et al., 2015: Greenhouse-gas payback times for crop-based biofuels. Nat. Clim. Change, 5(6) , 604–610, doi:10.1038/nclimate2642.
Emenike, O. et al., 2020: Initial techno-economic screening of BECCS technologies in power generation for a range of biomass feedstock. Sustain. Energy Technol. Assessments, 40, 100743, doi:10.1016/j.seta.2020.100743.
Emery, I., S. Mueller, Z. Qin, and J.B. Dunn, 2017: Evaluating the Potential of Marginal Land for Cellulosic Feedstock Production and Carbon Sequestration in the United States. Environ. Sci. Technol. , 51(1) , 733–741, doi:10.1021/acs.est.6b04189.
Engel, R.A., M.E. Marlier, and D.P. Lettenmaier, 2019: On the causes of the summer 2015 Eastern Washington wildfires. Environ. Res. Commun. , 1(1) , 011009, doi:10.1088/2515-7620/ab082e.
Eory, V. et al., 2015: Review and update the UK agriculture MACC to assess the abatement potential for the 5th carbon budget period and to 2050: Final report submitted for the project contract “Provision of services to review and update the UK agriculture MACC and to assess abatement potential for the 5th carbon budget period and to 2050”. Prepared for the Climate Change Committee. 274 pp. https://www.theccc.org.uk/publication/scotlands-rural-collage-sruc-ricardo-energy-and-environment2015-review-and-update-of-the-uk-agriculture-macc-to-assess-abatement-potential-for-the-fifth-carbon-budgetperiod-and-to-2050/.
Erb, K.-H., H. Haberl, and C. Plutzar, 2012: Dependency of global primary bioenergy crop potentials in 2050 on food systems, yields, biodiversity conservation and political stability. Energy Policy, 47, 260–269, doi:10.1016/j.enpol.2012.04.066.
Erb, K.-H. et al., 2013: Bias in the attribution of forest carbon sinks. Nat. Clim. Change, 3(10) , 854–856, doi:10.1038/nclimate2004.
Erb, K.-H. et al., 2017: Land management: data availability and process understanding for global change studies. Glob. Change Biol. , 23(2) , 512–533, doi:10.1111/gcb.13443.
Erb, K.-H. et al., 2018: Unexpectedly large impact of forest management and grazing on global vegetation biomass. Nature, 553(7686) , 73–76, doi:10.1038/nature25138.
Ericksen, P. and T. Crane, 2018: The feasibility of low emissions development interventions for the East African livestock sector: Lessons from Kenya and Ethiopia. International Livestock Research Institute, Nairobi, Kenya, 25 pp.
Espejo, J.C. et al., 2018: Deforestation and Forest Degradation Due to Gold Mining in the Peruvian Amazon: A 34-Year Perspective. Remote Sens. , 10(12) , 1903, doi:10.3390/rs10121903.
Essl, F., K. Erb, S. Glatzel, and A. Pauchard, 2018: Climate change, carbon market instruments, and biodiversity: focusing on synergies and avoiding pitfalls. WIREs Clim. Change, 9(1) , doi:10.1002/wcc.486.
Esteve-Llorens, X., A.C. Dias, M.T. Moreira, G. Feijoo, and S. González-García, 2020: Evaluating the Portuguese diet in the pursuit of a lower carbon and healthier consumption pattern. Clim. Change, 162(4) , 2397–2409, doi:10.1007/s10584-020-02816-0.
European Commission, 2021: Freshwater Aquaculture in the EU. Publications Office of the European Union, Luxembourg, 83 pp.
European Commission-EU, 2021: New EU Forest Strategy for 2030.https://ec.europa.eu/environment/strategy/forest-strategy_en (Accessed October 1, 2021).
European Environment Agency, 2020: Annual European Union greenhouse gas inventory 1990-2018 and inventory report 2020. https://www.eea.europa.eu/publications/european-union-greenhouse-gas-inventory-2020. European Environment Agency Copenhagen, Denmark (Accessed Oct 1, 2021).
Eurostat, 2020: Greenhouse gas emissions by source sector. Eurostat Metadata, Source EEA,. https://ec.europa.eu/eurostat/cache/metadata/en/env_air_gge_esms.htm (Accessed March 23, 2021).
Fa, J.E. et al., 2020: Importance of Indigenous Peoples’ lands for the conservation of Intact Forest Landscapes. Front. Ecol. Environ. , 18(3) , 135–140, doi:10.1002/fee.2148.
Faber, I., N.A. Castellanos-Feijoó, L. Van de Sompel, A. Davydova, and F.J.A. Perez-Cueto, 2020: Attitudes and knowledge towards plant-based diets of young adults across four European countries. Exploratory survey. Appetite, 145, 104498, doi:10.1016/j.appet.2019.104498.
Fajardy, M., S. Chiquier, and N. Mac Dowell, 2018: Investigating the BECCS resource nexus: delivering sustainable negative emissions. Energy Environ. Sci. , 11(12) , 3408–3430, doi:10.1039/C8EE01676C.
Falconnier, G.N. et al., 2020: Modelling climate change impacts on maize yields under low nitrogen input conditions in sub‐Saharan Africa. Glob. Change Biol. , 26(10) , 5942–5964, doi:10.1111/gcb.15261.
Falk, D.A., 2017: Restoration Ecology, Resilience, and the Axes of Change. Ann. Missouri Bot. Gard. , 102(2) , 201–216, doi:10.3417/2017006.
Falk, D.A. et al., 2011: Multi-scale controls of historical forest-fire regimes: new insights from fire-scar networks. Front. Ecol. Environ. , 9(8) , 446–454, doi:10.1890/100052.
Fan, L. et al., 2019: Satellite-observed pantropical carbon dynamics. Nat. Plants, 5(9) , 944–951, doi:10.1038/s41477-019-0478-9.
Fang, Y., B. Singh, and B.P. Singh, 2015: Effect of temperature on biochar priming effects and its stability in soils. Soil Biol. Biochem. , 80, 136–145, doi:10.1016/j.soilbio.2014.10.006.
Fang, Y. et al., 2019: Interactive carbon priming, microbial response and biochar persistence in a Vertisol with varied inputs of biochar and labile organic matter. Eur. J. Soil Sci. , 70(5), 960-974, ejss.12808, doi:10.1111/ejss.12808.
FAO, 2007: State of the World’s Forests 2007. Food and Agriculture Organization of the United Nations (FAO), Rome, Italy, 157 pp.
FAO, 2013: FAOSTAT-Statistical Database. Food and Agriculture Organization of the United Nations (FAO), Rome, Italy. http://www.fao.org/faostat/en/#home (Accessed September 13, 2021).
FAO, 2015: Global Forest Resources Assessment 2015. UN-FAO, Rome, Italy. https://www.fao.org/forest-resources-assessment/en/ (Accessed November 1, 2021).
FAO, 2016: The State of Food and Agriculture: Climate change, agriculture and food security. Food and Agriculture Organization of the United Nations (FAO), Rome, Italy. https://www.fao.org/3/i6030e/i6030e.pdf . (Accessed November 1, 2021).
FAO, 2017a: Agroforestry for landscape restoration: Exploring the potential of agroforestry to enhance the sustainability and resilience of degraded landscapes. Food and Agriculture Organization of the United Nations (FAO), Rome, Italy.
FAO, 2017b: FAO Statistics: Food Balances (-2013, old methodology and population). Food and Agriculture Organization of the United Nations (FAO), Rome, Italy. http://www.fao.org/faostat /en/#data/FBSH.
FAO, 2018a: Food supply – livestock and fish primary equivalent. Food and Agriculture Organization of the United Nations (FAO), Rome, Italy. http://www.fao.org/faost at/en/#data/CL.
FAO, 2018b: The future of food and agriculture – Alternative pathways to 2050. Global Perspectives Studies. Food and Agriculture Organization of the United Nations (FAO), Rome, Italy. 224 pp.
FAO, 2018c: The State of the World’s Forests 2018: Forest Pathways to Sustainable Development . Food and Agriculture Organization of the United Nations (FAO), Rome, Italy, 28 pp.
FAO, 2019a: FAO Statistics, Emissions – Agriculture. Food and Agriculture Organization of the United Nations (FAO), Rome, Italy. http://www.fao.org/faostat/en/#data/GT (Accessed March 1, 2021).
FAO, 2019b: FAO Statistics, Annual population. Food and Agriculture Organization of the United Nations (FAO), Rome, Italy. http://www.fao.org/faostat/en/#data/OA.UN-FAO (Accessed October 11, 2021).
FAO, 2019c: The State of Food and Agriculture 2019: Moving forward on food loss and waste reduction. Food and Agriculture Organization of the United Nations (FAO), Rome, Italy, 182 pp.
FAO, 2019d: The State of the World’s Biodiversity for Food and Agriculture. Food and Agriculture Organization of the United Nations (FAO), Rome, Italy. https://www.fao.org/3/CA3129EN/CA3129EN.pdf (Accessed June 15, 2021).
FAO, 2020a: Global Forest Resources Assessment 2020. Food and Agriculture Organization of the United Nations (FAO), Rome, Italy. https://www.fao.org/forest-resources-assessment/2020/en/ (Accessed October 11, 2021).
FAO, 2020b: FAO Statistics: Land use. Food and Agriculture Organization of the United Nations (FAO), Rome, Italy. http://www.fao.org/faostat/en/#data/RL.
FAO, 2020c: FAO Statistics. Emissions – Biomass burning. Food and Agriculture Organization of the United Nations (FAO), Rome, Italy. http://www.fao.org/faost at/en/#data/GI.
FAO, 2020d: Global Forest Resources Assessment 2020 - Key Findings. Food and Agriculture Organization of the United Nations (FAO), Rome, Italy, 16 pp. https://www.fao.org/3/CA8753EN/CA8753EN.pdf (Accessed October 11, 2021).
FAO, 2020e: Global Forest Resources Assessment 2020: Terms and Definition. Food and Agriculture Organization of the United Nations (FAO), Rome, Italy, 32 pp.
FAO, 2021a: FAO Statistics, Emissions-Total. Food and Agriculture Organization of the United Nations (FAO), Rome, Italy. http://www.fao.org/faost at/en/#data/GT.
FAO, 2021b: FAO Statistics, Land use. Food and Agriculture Organization of the United Nations (FAO), Rome, Italy. http://www.fao.org/faost at/en/#data/RL.
FAO, 2021c: FAO Statistics: Crops and Livestock products. Food and Agriculture Organization of the United Nations (FAO), Rome, Italy. http://www.fao.org/faostat/en/#data/QCL.
FAO, 2021d: FAO Statistics: Food Balances (2014–).Food and Agriculture Organization of the United Nations (FAO), Rome, Italy. http://www.fao.org/faostat/en/#data/FBS.
FAO, 2021e: FAO Statistics: Fertilizers by Nutrient. Food and Agriculture Organization of the United Nations (FAO), Rome, Italy. http://www.fao.org/faostat/en/#data/RFN (Accessed July 21, 2021).
FAO and FILAC, 2021: Forest governance by indigenous and tribal peoples. An opportunity for climate action in Latin America and the Caribbean. Santiago. FAO. https://doi.org/10. 4060/cb2953en.
FAO and ITPS, 2015: Status of the World’s Soil Resources. Food and Agriculture Organization of the United Nations (FAO), Rome, Italy.
FAO and UNEP, 2020 : The State of the World’s Forests 2020. Forests, biodiversity and people. Food and Agriculture Organization of the United Nations (FAO), Rome, Italy.
FAO and WHO, 2019: Sustainable Healthy Diets Guiding Principles. Food and Agriculture Organization of the United Nations (FAO), Rome, Italy.
Fargione, J.E. et al., 2018: Natural climate solutions for the United States. Sci. Adv. , 4(11) , doi:10.1126/sciadv.aat1869.
Fauzi et al., 2019: Contextualizing Mangrove Forest Deforestation in Southeast Asia Using Environmental and Socio-Economic Data Products. Forests, 10(11) , 952, doi:10.3390/f10110952.
Favero, A., R. Mendelsohn, and B. Sohngen, 2017: Using forests for climate mitigation: sequester carbon or produce woody biomass?Clim. Change, 144(2) , 195–206, doi:10.1007/s10584-017-2034-9.
Favero, A., A. Daigneault, and B. Sohngen, 2020: Forests: Carbon sequestration, biomass energy, or both?Sci. Adv. , 6(13) , doi:10.1126/sciadv.aay6792.
Fearnside, P.M., 2000: Global Warming and Tropical Land-Use Change: Greenhouse Gas Emissions from Biomass Burning, Decomposition and Soils in Forest Conversion, Shifting Cultivation and Secondary Vegetation. Clim. Change, 46, 115–158, doi.org/10.1023/A:1005569915357.
Fearnside, P.M., 2015: Highway Construction as a Force in the Destruction of the Amazon Forest. In: Handbook of Road Ecology[van der Ree, R., D.J. Smith, and C. Grilo (eds.)]. John Wiley & Sons, New Jersey, USA, pp. 414–424.
Fearnside, P.M. et al., 2009: Biomass and greenhouse-gas emissions from land-use change in Brazil’s Amazonian “arc of deforestation”: The states of Mato Grosso and Rondônia. For. Ecol. Manage. , 258(9) , 1968–1978, doi:10.1016/j.foreco.2009.07.042.
Feliciano, D., A. Ledo, J. Hillier, and D.R. Nayak, 2018: Which agroforestry options give the greatest soil and above ground carbon benefits in different world regions?Agric. Ecosyst. Environ. , 254 (July 2017), 117–129, doi:10.1016/j.agee.2017.11.032.
Felker, M.E., I.W. Bong, W.H. DePuy, and L.F. Jihadah, 2017: Considering land tenure in REDD+ participatory measurement, reporting, and verification: A case study from Indonesia. PLoS One, 12(4) , e0167943, doi:10.1371/journal.pone.0167943.
Feng, L. et al., 2016: Estimates of European uptake of CO2 inferred from GOSAT XCO2 retrievals: sensitivity to measurement bias inside and outside Europe. Atmos. Chem. Phys. , 16(3) , 1289–1302, doi:10.5194/acp-16-1289-2016.
Fernando, A.L., J. Costa, B. Barbosa, A. Monti, and N. Rettenmaier, 2018: Environmental impact assessment of perennial crops cultivation on marginal soils in the Mediterranean Region. Biomass and Bioenergy, 111, 174–186, doi:10.1016/j.biombioe.2017.04.005.
Ferretti-Gallon, K. and J. Busch, 2014: What Drives Deforestation and What Stops it? A Meta-Analysis of Spatially Explicit Econometric Studies. SSRN Electron. J. , 11(1) , Working Paper 361, Ctr for Global Development. Doi:10.2139/ssrn.2458040.
Fetzel, T. et al., 2017: Quantification of uncertainties in global grazing systems assessment. Global Biogeochem. Cycles, 31(7) , 1089–1102, doi:10.1002/2016GB005601.
Firbank, L.G. et al., 2018: Grand Challenges in Sustainable Intensification and Ecosystem Services. Front. Sustain. Food Syst. , 2,7: 2018.00007. doi:10.3389/fsufs.2018.00007.
Fischer, T.B., 2007: The Theory and Practice of Strategic Environmental Assessment . Routledge, Abingdon, Oxfordshire, UK, 218 pp.
FitzGerald, D.M. and Z. Hughes, 2019: Marsh Processes and Their Response to Climate Change and Sea-Level Rise. Annu. Rev. Earth Planet. Sci. , 47(1) , 481–517, doi:10.1146/annurev-earth-082517-010255.
Fixen, P.E., 2020: A brief account of the genesis of 4R nutrient stewardship. Agron. J. , 112(5) , 4511–4518, doi:10.1002/agj2.20315.
Flanagan, S.A. et al., 2019: Quantifying carbon and species dynamics under different fire regimes in a southeastern U.S. pineland. Ecosphere, 10(6) , doi:10.1002/ecs2.2772.
Fleischman, F. et al., 2020: Pitfalls of Tree Planting Show Why We Need People-Centered Natural Climate Solutions. Bioscience, 70(11) , 947–950, doi:10.1093/biosci/biaa094.
Flyvbjerg, B., 2009: Survival of the unfittest: why the worst infrastructure gets built—and what we can do about it. Oxford Rev. Econ. Policy, 25(3) , 344–367, doi:10.1093/oxrep/grp024.
Forest Trends Ecosystem Marketplace, 2021: State of Forest Carbon Finance 2021. Forest Trends Ecosystem Marketplace, Washington, DC, USA, 78 pp.
Forsell, N. et al., 2016: Assessing the INDCs’ land use, land use change, and forest emission projections. Carbon Balance Manag. , 11(1) , 26, doi:10.1186/s13021-016-0068-3.
Fortmann, L., B. Sohngen, and D. Southgate, 2017: Assessing the Role of Group Heterogeneity in Community Forest Concessions in Guatemala’s Maya Biosphere Reserve. Land Econ. , 93 (3) , 503–526, doi:10.3368/le.93.3.503.
Frank, S. et al., 2017: Reducing greenhouse gas emissions in agriculture without compromising food security?Environ. Res. Lett. , 12(10) , 105004, doi:10.1088/1748-9326/aa8c83.
Frank, S. et al., 2018: Structural change as a key component for agricultural non-CO2 mitigation efforts. Nat. Commun. , 9(1) , 1060, doi:10.1038/s41467-018-03489-1.
Frank, S. et al., 2019: Agricultural non-CO2 emission reduction potential in the context of the 1.5°C target. Nat. Clim. Change, 9(1) , 66–72, doi:10.1038/s41558-018-0358-8.
Frank, S. et al., 2020: Land-based climate change mitigation potentials within the agenda for sustainable development. Environ. Res. Lett. , 16(2) , 024006, doi:10.1088/1748-9326/abc58a.
Franzluebbers, A.J., G. Lemaire, P.C. de Faccio Carvalho, R.M. Sulc, and B. Dedieu, 2014: Toward agricultural sustainability through integrated crop–livestock systems. II. Production responses. Eur. J. Agron. , 57, 1–3, doi:10.1016/j.eja.2014.05.004.
Friedlingstein, P. et al., 2020: Global Carbon Budget 2019. Earth Syst. Sci. Data, 11(4) , 1783–1838, doi:10.5194/essd-11-1783-2019.
Friess, D.A. et al., 2019: The State of the World’s Mangrove Forests: Past, Present, and Future. Annu. Rev. Environ. Resour. , 44(1) , 89–115, doi:10.1146/annurev-environ-101718-033302.
Fritsche, U.R. et al., 2017: Energy and Land Use Disclaimer – Global Land Outlook Working Paper. United Nations Convention to Combat Desertification (UNCCD), Bonn, Germany, 60 pp.
Fujimori, S. et al., 2016: Implication of Paris Agreement in the context of long-term climate mitigation goals. Springerplus, 5(1) , 1620, doi:10.1186/s40064-016-3235-9.
Fujimori, S. et al., 2019: A multi-model assessment of food security implications of climate change mitigation. Nat. Sustain. , 2(5) , 386–396, doi:10.1038/s41893-019-0286-2.
Furumo, P.R. and T.M. Aide, 2017: Characterizing commercial oil palm expansion in Latin America: land use change and trade. Environ. Res. Lett. , 12(2) , 024008, doi:10.1088/1748-9326/aa5892.
Fuss, S. et al., 2018: Negative emissions—Part 2: Costs, potentials and side effects. Environ. Res. Lett. , 13 (6) , 063002, doi:10.1088/1748-9326/aabf9f.
Futter, M., N. Clarke, Ø. Kaste, and S. Valinia, 2019: The potential effects on water quality of intensified forest management for climate mitigation in Norway. Norwegian Institute for Water Research, Oslo, Norway, 7363–2019 pp.
Fyson, C.L. and M.L. Jeffery, 2019: Ambiguity in the Land Use Component of Mitigation Contributions Toward the Paris Agreement Goals. Earth’s Futur. , 7(8) , 873–891, doi:10.1029/2019EF001190.
Galford, G.L. et al., 2020: Agricultural development addresses food loss and waste while reducing greenhouse gas emissions. Sci. Total Environ. , 699, 134318, doi:10.1016/j.scitotenv.2019.134318.
Galik, C.S., 2020: A continuing need to revisit BECCS and its potential. Nat. Clim. Change, 10(1) , 2–3, doi:10.1038/s41558-019-0650-2.
Gallagher, R.V. et al., 2021: High fire frequency and the impact of the 2019–2020 megafires on Australian plant diversity. Divers. Distrib. , 27(7) , 1166–1179, doi:10.1111/ddi.13265.
Galli, F. et al., 2020: How can policy processes remove barriers to sustainable food systems in Europe? Contributing to a policy framework for agri-food transitions. Food Policy, 96, 101871, doi:10.1016/j.foodpol.2020.101871.
Gan, J. and B.A. McCarl, 2007: Measuring transnational leakage of forest conservation. Ecol. Econ. , 64(2) , 423–432, doi:10.1016/j.ecolecon.2007.02.032.
Gao, Y. et al., 2020: Effects of biochar application on crop water use efficiency depend on experimental conditions: A meta-analysis. F. Crop. Res. , 249, 107763, doi:10.1016/j.fcr.2020.107763.
Gardiner, C.A., T.J. Clough, K.C. Cameron, H.J. Di, and G.R. Edwards, 2020: Ruminant urine patch nitrification and N2O flux: effects of urine aucubin rate in a laboratory trial. New Zeal. J. Agric. Res. , 63(1) , 65–72, doi:10.1080/00288233.2019.1626743.
Garnett, S.T. et al., 2018: A spatial overview of the global importance of Indigenous lands for conservation. Nat. Sustain. , 1(7) , 369–374, doi:10.1038/s41893-018-0100-6.
Garnett, T., 2014: Three perspectives on sustainable food security: efficiency, demand restraint, food system transformation. What role for life cycle assessment?J. Clean. Prod. , 73, 10–18, doi:10.1016/j.jclepro.2013.07.045.
Garnett, T. et al., 2013: Sustainable intensification in agriculture: Premises and policies. Science, 341(6161) , 33, doi:10.1126/science.1234485.
Garrett, R.D. et al., 2020: Drivers of decoupling and recoupling of crop and livestock systems at farm and territorial scales. Ecol. Soc. , 25 (1) , 24, doi:10.5751/ES-11412-250124.
Garrity, D.P and J. Bayala, 2019. Zinder: farmer-managed natural regeneration of Sahelian parklands in Niger. In: van Noordwijk M, ed. Sustainable development through trees on farms: agroforestry in its fifth decade. Bogor, Indonesia: World Agroforestry (ICRAF) Southeast Asia Regional Program, pp. 153–174.
Garrity, D.P. et al., 2010: Evergreen Agriculture: a robust approach to sustainable food security in Africa. Food Secur. , 2(3) , 197–214, doi:10.1007/s12571-010-0070-7.
Gasser, T. et al., 2020: Historical CO2 emissions from land use and land cover change and their uncertainty. Biogeosciences, 17(15) , 4075–4101, doi:10.5194/bg-17-4075-2020.
Gattinger, A. et al., 2012: Enhanced top soil carbon stocks under organic farming. Proc. Natl. Acad. Sci. , 109(44) , 18226–18231, doi:10.1073/pnas.1209429109.
Gattuso, J. et al., 2018: Ocean Solutions to Address Climate Change and Its Effects on Marine Ecosystems. Front. Mar. Sci. , 5 (October), art337, doi:10.3389/fmars.2018.00337.
Geng, A., H. Yang, J. Chen, and Y. Hong, 2017: Review of carbon storage function of harvested wood products and the potential of wood substitution in greenhouse gas mitigation. For. Policy Econ. , 85, 192–200, doi:10.1016/j.forpol.2017.08.007.
Gerssen-Gondelach, S., B. Wicke, and A. Faaij, 2015: Assessment of driving factors for yield and productivity developments in crop and cattle production as key to increasing sustainable biomass potentials. Food Energy Secur. , 4(1) , 36–75, doi:10.1002/fes3.53.
Gibbs, H.K. et al., 2015: Brazil’s Soy Moratorium. Science, 347(6220) , 377–378, doi:10.1126/science.aaa0181.
Gil, J., M. Siebold, and T. Berger, 2015: Adoption and development of integrated crop–livestock–forestry systems in Mato Grosso, Brazil. Agric. Ecosyst. Environ. , 199, 394–406, doi:10.1016/j.agee.2014.10.008.
Gil, J.D.B., A.S. Cohn, J. Duncan, P. Newton, and S. Vermeulen, 2017: The resilience of integrated agricultural systems to climate change. WIREs Clim. Change, 8(4) , doi:10.1002/wcc.461.
Giller, K. and F. Ewert, 2019: Australian wheat beats the heat. Nat. Clim. Change, 9(3) , 189–190, doi:10.1038/s41558-019-0427-7.
Gingrich, S. et al., 2019: Hidden emissions of forest transitions: a socio-ecological reading of forest change. Curr. Opin. Environ. Sustain. , 38, 14–21, doi:10.1016/j.cosust.2019.04.005.
Ginsburg, CS. Keene, 2020: At a crossroads: consequential trends in recognition of community-based forest tenure from 2002-2017. China Econ. J. , 13 (2) , 223–248, doi:10.1080/17538963.2020.1755129.
Giri, C. et al., 2015: Distribution and dynamics of mangrove forests of South Asia. J. Environ. Manage. , 148, 101–111, doi:10.1016/j.jenvman.2014.01.020.
Gitz, V. and P. Ciais, 2003: Amplifying effects of land-use change on future atmospheric CO2 levels. Global Biogeochem. Cycles, 17(1) , 1024 doi:10.1029/2002GB001963.
Gliessman, S., 2013: Agroecology: Growing the Roots of Resistance. Agroecol. Sustain. Food Syst. , 1(37) , 14, doi.org/10.1080/10440046.2012.736927.
Godfray, H.C.J. and T. Garnett, 2014: Food security and sustainable intensification. Philos. Trans. R. Soc. B Biol. Sci. , 369(1639) , 20120273, doi:10.1098/rstb.2012.0273.
Godfray, H.C.J. et al., 2018: Meat consumption, health, and the environment. Science, 361(6399) , doi:10.1126/science.aam5324.
Goh, K.M., 2011: Greater Mitigation of Climate Change by Organic than Conventional Agriculture: A Review. Biol. Agric. Hortic. , 27(2) , 205–229, doi:10.1080/01448765.2011.9756648.
Goldammer, J.G., 2016: Fire Management in Tropical Forests. In: Tropical Forestry Handbook[Pancel, L. and M. Köhl (eds.)]. Springer Berlin Heidelberg, Berlin, Heidelberg, Germany, pp. 2659–2710.
Goldewijk, K.K., A. Beusen, J. Doelman, and E. Stehfest, 2017: Anthropogenic land use estimates for the Holocene – HYDE 3.2. Earth Syst. Sci. Data, 9(2) , 927–953, doi:10.5194/essd-9-927-2017.
Goldstein, A. et al., 2020: Protecting irrecoverable carbon in Earth’s ecosystems. Nat. Clim. Change, 10(4) , 287–295, doi:10.1038/s41558-020-0738-8.
Gonzalez-Sanchez, E.J. et al., 2019: Meta-analysis on carbon sequestration through Conservation Agriculture in Africa. Soil Tillage Res. , 190, 22–30, doi:10.1016/j.still.2019.02.020.
Goodwin, M.J., M.P. North, H.S.J. Zald, and M.D. Hurteau, 2020: Changing climate reallocates the carbon debt of frequent‐fire forests. Glob. Change Biol. , 26(11) , 6180–6189, doi:10.1111/gcb.15318.
Goss, M. et al., 2020: Climate change is increasing the likelihood of extreme autumn wildfire conditions across California. Environ. Res. Lett. , 15(9) , 094016, doi:10.1088/1748-9326/ab83a7.
Govaerts, B., K.D. Sayre, and J. Deckers, 2005: Stable high yields with zero tillage and permanent bed planting?F. Crop. Res. , 94 (1) , 33–42, doi:10.1016/j.fcr.2004.11.003.
Government of Alberta, 2021: Alberta Emission Offset System. https://www.alberta.ca/alberta-emission-offset-system.aspx. Edmonton, Alberta, Canada.
Government of Brazil, Amazon Fund. Brasilia, Brazil. http://www.amazon fund.gov.br/en/home/.
Grace, J., E. Mitchard, and E. Gloor, 2014: Perturbations in the carbon budget of the tropics. Glob. Change Biol. , 20(10) , 3238–3255, doi:10.1111/gcb.12600.
Grassi, G. et al., 2017: The key role of forests in meeting climate targets requires science for credible mitigation. Nat. Clim. Change, 7(3) , 220–226, doi:10.1038/nclimate3227.
Grassi, G. et al., 2018: Reconciling global-model estimates and country reporting of anthropogenic forest CO2 sinks. Nat. Clim. Change, 8(10) , 914–920, doi:10.1038/s41558-018-0283-x.
Grassi, G. et al., 2021: Critical adjustment of land mitigation pathways for assessing countries’ climate progress. Nat. Clim. Change, 11(5) , 425–434, doi:10.1038/s41558-021-01033-6.
Gren, I.-M. and A.Z. Aklilu, 2016: Policy design for forest carbon sequestration: A review of the literature. For. Policy Econ. , 70, 128–136, doi:10.1016/j.forpol.2016.06.008.
Griscom, B.W. et al., 2017: Natural climate solutions. Proc. Natl. Acad. Sci. , 114(44) , 11645–11650, doi:10.1073/pnas.1710465114.
Griscom, B.W. et al., 2020: National mitigation potential from natural climate solutions in the tropics. Philos. Trans. R. Soc. B Biol. Sci. , 375(1794) , 20190126, doi:10.1098/rstb.2019.0126.
Gromko, D. and G. Abdurasalova, 2019: Climate change mitigation and food loss and waste reduction: Exploring the business case. CGIAR Research Program on Climate Change, Agriculture and Food Security (CCAFS), Wageningen, The Netherlands, 46 pp. https://hdl.handle.net/10568/100165.
Grossi, G., P. Goglio, A. Vitali, and A.G. Williams, 2019: Livestock and climate change: impact of livestock on climate and mitigation strategies. Anim. Front. , 9(1) , 69–76, doi:10.1093/af/vfy034.
Grubler, A. et al., 2018: A low energy demand scenario for meeting the 1.5°C target and sustainable development goals without negative emission technologies. Nat. Energy, 3(6) , 515–527, doi:10.1038/s41560-018-0172-6.
Guan, Z., Y. Xu, P. Gong, and J. Cao, 2018: The impact of international efforts to reduce illegal logging on the global trade in wood products. Int. Wood Prod. J. , 9(1) , 28–38, doi:10.1080/20426445.2017.1419541.
Guenet, B. et al., 2021: Can N2O emissions offset the benefits from soil organic carbon storage?Glob. Change Biol. , 27 (2) , 237–256, doi:10.1111/gcb.15342.
Gunsch, M.J. et al., 2018: Ubiquitous influence of wildfire emissions and secondary organic aerosol on summertime atmospheric aerosol in the forested Great Lakes region. Atmos. Chem. Phys. , 18(5) , 3701–3715, doi:10.5194/acp-18-3701-2018.
Günther, A. et al., 2020: Prompt rewetting of drained peatlands reduces climate warming despite methane emissions. Nat. Commun. , 11(1) , 1644, doi:10.1038/s41467-020-15499-z.
Gunton, R.M., L.G. Firbank, A. Inman, and D.M. Winter, 2016: How scalable is sustainable intensification?Nat. Plants, 2(5) , 16065, doi:10.1038/nplants.2016.65.
Guo, K. et al., 2020: Establishment of an integrated decision-making method for planning the ecological restoration of terrestrial ecosystems. Sci. Total Environ. , 741, 139852, doi:10.1016/j.scitotenv.2020.139852.
Gupta, A., T. Pistorius, and M.J. Vijge, 2016: Managing fragmentation in global environmental governance: the REDD+ Partnership as bridge organization. Int. Environ. Agreements Polit. Law Econ. , 16(3) , 355–374, doi:10.1007/s10784-015-9274-9.
Gustavsson, L. et al., 2017: Climate change effects of forestry and substitution of carbon-intensive materials and fossil fuels. Renew. Sustain. Energy Rev. , 67, 612–624, doi:10.1016/j.rser.2016.09.056.
Gütschow, J., L. Jeffery, R. Gieseke, and A. Günther, 2019: The PRIMAP-hist national historical emissions time series v2.1 (1850-2017). Earth Syst. Sci. Data, 8, 571–603, doi.org/10.5194/essd-8-571-2016.
Gwenzi, W., N. Chaukura, F.N.D. Mukome, S. Machado, and B. Nyamasoka, 2015: Biochar production and applications in sub-Saharan Africa: Opportunities, constraints, risks and uncertainties. J. Environ. Manage. , 150, 250–261, doi:10.1016/j.jenvman.2014.11.027.
Haberlie, A.M., W.S. Ashley, and T.J. Pingel, 2015: The effect of urbanisation on the climatology of thunderstorm initiation. Q.J.R. Meteorol. Soc. , 141 (688), 663–675, doi:10.1002/qj.2499.
Habib, G. and A.A. Khan, 2018: Assessment and Mitigation of Methane Emissions from Livestock Sector in Pakistan. Earth Syst. Environ. , 2(3) , 601–608, doi:10.1007/s41748-018-0076-4.
Haddad, N.M. et al., 2015: Habitat fragmentation and its lasting impact on Earth’s ecosystems. Sci. Adv. , 1(2) , doi:10.1126/sciadv.1500052.
Hagemann, N. et al., 2017: Organic coating on biochar explains its nutrient retention and stimulation of soil fertility. Nat. Commun. , 8(1) , 1089, doi:10.1038/s41467-017-01123-0.
Haglund, E., J. Ndjeunga, L. Snook, and D. Pasternak, 2011: Dry land tree management for improved household livelihoods: Farmer managed natural regeneration in Niger. J. Environ. Manage. , 92(7) , 1696–1705, doi:10.1016/j.jenvman.2011.01.027.
Hamilton, S.E. and D. Casey, 2016: Creation of a high spatio-temporal resolution global database of continuous mangrove forest cover for the 21st century (CGMFC-21). Glob. Ecol. Biogeogr. , 25(6) , 729–738, doi:10.1111/geb.12449.
Hammar, T. and F. Levihn, 2020: Time-dependent climate impact of biomass use in a fourth generation district heating system, including BECCS. Biomass and Bioenergy, 138, 105606, doi:10.1016/j.biombioe.2020.105606.
Hamrick, K. and M. Gallant, 2017a: State of Forest Carbon Finance. Forest Trends Ecosystem Marketplace. Forest Trends’ Ecosystem Marketplace, Washington, DC, USA, 88 pp. https://www.forest-trends.org/wp-content/uploads/2018/01/doc_5715.pdf (Accessed November 21, 2021).
Hamrick, K. and M. Gallant, 2017b: Unlocking potential: State of the Voluntary Carbon Markets 2017. Forest Trends’ Ecosystem Marketplace, Washington, DC, USA, 52 pp.
Hamrick, K. and M. Gallant, 2018: Voluntary Carbon Markets Outlooks and Trends. https://www.forest-trends.org/publications/voluntary-carbon-markets/ (Accessed September 12, 2021).
Han Weng, Z. et al., 2017: Biochar built soil carbon over a decade by stabilizing rhizodeposits. Nat. Clim. Change, 7(5) , 371–376, doi:10.1038/nclimate3276.
Hanan, N.P., 2018: Agroforestry in the Sahel. Nat. Geosci. , 11(5) , 296–297, doi:10.1038/s41561-018-0112-x.
Hansen, J.H., L. Hamelin, A. Taghizadeh‐Toosi, J.E. Olesen, and H. Wenzel, 2020: Agricultural residues bioenergy potential that sustain soil carbon depends on energy conversion pathways. GCB Bioenergy, 12(11) , 1002–1013, doi:10.1111/gcbb.12733.
Hansen, M.C. et al., 2013: High-Resolution Global Maps of 21st-Century Forest Cover Change. Science, 342(6160) , 850–853, doi:10.1126/science.1244693.
Hanssen, S.V. et al., 2020: The climate change mitigation potential of bioenergy with carbon capture and storage. Nat. Clim. Change, 10(11) , 1023–1029, doi:10.1038/s41558-020-0885-y.
Hansis, E., S.J. Davis, and J. Pongratz, 2015: Relevance of methodological choices for accounting of land use change carbon fluxes. Global Biogeochem. Cycles, 29, 1230–1246, doi:10.1002/2014GB004997.
Harmsen, J.H.M. et al., 2019: Long-term marginal abatement cost curves of non-CO2 greenhouse gases. Environ. Sci. Policy, 99 (March), 136–149, doi:10.1016/j.envsci.2019.05.013.
Harper, A.B. et al., 2018: Land-use emissions play a critical role in land-based mitigation for Paris climate targets. Nat. Commun. , 9(1) , 2938, doi:10.1038/s41467-018-05340-z.
Harris, N.L. et al., 2021: Global maps of twenty-first century forest carbon fluxes. Nat. Clim. Change, 11(3) , 234–240, doi:10.1038/s41558-020-00976-6.
Hasegawa, T. and Y. Matsuoka, 2012: Greenhouse gas emissions and mitigation potentials in agriculture, forestry and other land use in Southeast Asia. J. Integr. Environ. Sci. , 9(sup1) , 159–176, doi:10.1080/1943815X.2012.701647.
Hasegawa, T., S. Fujimori, R. Boer, G. Immanuel, and T. Masui, 2016: Land-Based Mitigation Strategies under the Mid-Term Carbon Reduction Targets in Indonesia. Sustainability, 8(12) , 1283, doi:10.3390/su8121283.
Hasegawa, T. et al., 2018: Risk of increased food insecurity under stringent global climate change mitigation policy. Nat. Clim. Change, 8(8) , 699–703, doi:10.1038/s41558-018-0230-x.
Hasegawa, T. et al., 2020: Food security under high bioenergy demand toward long-term climate goals. Clim. Change, 163(3) , 1587–1601, doi:10.1007/s10584-020-02838-8.
Hasegawa, T. et al., 2021: Land-based implications of early climate actions without global net-negative emissions. Nat. Sustain. , 4(12) , 1052–1059, doi:10.1038/s41893-021-00772-w.
Hawken, P., 2017: Drawdown: the most comprehensive plan ever proposed to reverse global warming. Penguin, Washington, DC, USA. https://drawdown.org/the-book (Accessed September 12, 2020).
He, Y. et al., 2017: Effects of biochar application on soil greenhouse gas fluxes: a meta-analysis. GCB Bioenergy, 9(4) , 743–755, doi:10.1111/gcbb.12376.
Hedley, C., 2015: The role of precision agriculture for improved nutrient management on farms. J. Sci. Food Agric. , 95(1) , 12–19, doi:10.1002/jsfa.6734.
Heilmayr, R., C. Echeverría, and E.F. Lambin, 2020: Impacts of Chilean forest subsidies on forest cover, carbon and biodiversity. Nat. Sustain. , 3(9) , 701–709, doi:10.1038/s41893-020-0547-0.
Heinrich, V.H.A. et al., 2021: Large carbon sink potential of secondary forests in the Brazilian Amazon to mitigate climate change. Nat. Commun. , 12(1) , 1785, doi:10.1038/s41467-021-22050-1.
Henderson, B., C. Frezal, and E. Flynn, 2020: A survey of GHG mitigation policies for the agriculture, forestry and other land use sector. OECD Publishing, Paris, France, 88 pp.
Henderson, B.B. et al., 2015: Greenhouse gas mitigation potential of the world’s grazing lands: Modeling soil carbon and nitrogen fluxes of mitigation practices. Agric. Ecosyst. Environ. , 207, 91–100, doi:10.1016/j.agee.2015.03.029.
Hendrickson, J.R., J.D. Hanson, D.L. Tanaka, and G. Sassenrath, 2008: Principles of integrated agricultural systems: Introduction to processes and definition. Renew. Agric. Food Syst. , 23(04) , 265–271, doi:10.1017/S1742170507001718.
Herr, D., M. von Unger, D. Laffoley, and A. McGivern, 2017: Pathways for implementation of blue carbon initiatives. Aquat. Conserv. Mar. Freshw. Ecosyst. , 27(sup1) , 116–129, doi:10.1002/aqc.2793.
Herrera, D., A. Pfaff, and J. Robalino, 2019: Impacts of protected areas vary with the level of government: Comparing avoided deforestation across agencies in the Brazilian Amazon. Proc. Natl. Acad. Sci. , 116(30) , 14916–14925, doi:10.1073/pnas.1802877116.
Herrero, M. et al., 2013: Biomass use, production, feed efficiencies, and greenhouse gas emissions from global livestock systems. Proc. Natl. Acad. Sci. , 110(52) , 20888–20893, doi:10.1073/pnas.1308149110.
Herrero, M. et al., 2016: Greenhouse gas mitigation potentials in the livestock sector. Nat. Clim. Change, 6(5) , 452–461, doi:10.1038/nclimate2925.
Hijbeek, R., M. van Loon, and M. van Ittersum, 2019: Fertiliser use and soil carbon sequestration: trade-offs and opportunities. CGIAR Research Program on Climate Change, Agriculture and Food Security, Wageningen, The Netherlands, 23 pp.
Hirales-Cota, M., J. Espinoza-Avalos, B. Schmook, A. Ruiz-Luna, and R. Ramos-Reyes, 2010: Drivers of mangrove deforestation in Mahahual-Xcalak, Quintana Roo, southeast Mexico. Ciencias Mar. , 36(2) , doi:10.7773/cm.v36i2.1653.
Hirsch, A.L. et al., 2018: Modelled biophysical impacts of conservation agriculture on local climates. Glob. Change Biol. , 24(10) , 4758–4774, doi:10.1111/gcb.14362.
Hisano, M., E.B. Searle, and H.Y.H. Chen, 2018: Biodiversity as a solution to mitigate climate change impacts on the functioning of forest ecosystems. Biol. Rev. , 93(1) , 439–456, doi:10.1111/brv.12351.
Hlásny, T. et al., 2021: Bark Beetle Outbreaks in Europe: State of Knowledge and Ways Forward for Management. Curr. For. Reports, 7(3) , 138–165, doi:10.1007/s40725-021-00142-x.
HLPE, 2014: Food losses and waste in the context of sustainable food systems. A report by the High Level Panel of Experts (HLPE) on Food Security and Nutrition of the Committee on World Food Security, Rome Italy, 117 pp. http://www.fao.org/3/a-i3901e.pdf (Accessed October 12, 2021).
HLPE, 2019: Agroecological and other innovative approaches for sustainable agriculture and food systems that enhance food security and nutrition. Committee on World Food Security, Rome, Italy, 1–9 pp.
Hoa, N.T., T. Hasegawa, and Y. Matsuoka, 2014: Climate change mitigation strategies in agriculture, forestry and other land use sectors in Vietnam. Mitig. Adapt. Strateg. Glob. Change, 19, 15–32, doi:10.1007/s11027-012-9424-0.
Hochard, J.P., S. Hamilton, and E.B. Barbier, 2019: Mangroves shelter coastal economic activity from cyclones. Proc. Natl. Acad. Sci. , 116(25) , 12232–12237, doi:10.1073/pnas.1820067116.
Hof, C. et al., 2018: Bioenergy cropland expansion may offset positive effects of climate change mitigation for global vertebrate diversity. Proc. Natl. Acad. Sci. , 115(52) , 13294–13299, doi:10.1073/pnas.1807745115.
Holl, K.D. and P.H.S. Brancalion, 2020: Tree planting is not a simple solution. Science, 368(6491) , 580–581, doi:10.1126/science.aba8232.
Honan, M., X. Feng, J.M. Tricarico, and E. Kebreab, 2021: Feed additives as a strategic approach to reduce enteric methane production in cattle: modes of action, effectiveness and safety. Anim. Prod. Sci. , doi:10.1071/AN20295.
Honey-Roses, J., K. Baylis, and M.I. Ramirez, 2011: A Spatially Explicit Estimate of Avoided Forest Loss. Conserv. Biol. , 25(5) , 1032–1043, doi:10.1111/j.1523-1739.2011.01729.x.
Hooijer, A. et al., 2010: Current and future CO2 emissions from drained peatlands in Southeast Asia. Biogeosciences, 7(5) , 1505–1514, doi:10.5194/bg-7-1505-2010.
Houghton, R.A and A.A. Nassikas, 2017: Global and regional fluxes of carbon from land use and land cover change 1850-2015. Global Biogeochem. Cycles, 31(3) , 456–472, doi:10.1002/2016GB005546.
Howard, J. et al., 2017: Clarifying the role of coastal and marine systems in climate mitigation. Front. Ecol. Environ. , 15(1) , 42–50, doi:10.1002/fee.1451.
Hristov, A.N. et al., 2013: Mitigation of Greenhouse gas emissions in livestock production: A review of technical options for non-CO2 emissions[Gerber, P.J., B. Henderson, and H.P.S. Makkar (eds.)]. FAO, Rome, Italy, 352 pp. https://dialnet.unirioja.es/servlet/libro?codigo=317825.
Hristov, A.N. et al., 2015: An inhibitor persistently decreased enteric methane emission from dairy cows with no negative effect on milk production. Proc. Natl. Acad. Sci. , 112(34) , 10663–10668, doi:10.1073/pnas.1504124112.
Hugelius, G. et al., 2020: Large stocks of peatland carbon and nitrogen are vulnerable to permafrost thaw. Proc. Natl. Acad. Sci. , 117(34) , 20438–20446, doi:10.1073/pnas.1916387117.
Humpenöder, F. et al., 2018: Large-scale bioenergy production: how to resolve sustainability trade-offs?Environ. Res. Lett. , 13(2) , 024011, doi:10.1088/1748-9326/aa9e3b.
Humpenöder, F. et al., 2020: Peatland protection and restoration are key for climate change mitigation. Environ. Res. Lett. , 15(10) , 104093, doi:10.1088/1748-9326/abae2a.
Hund, K., D. La Porta, T.P. Fabregas, T. Laing, and J. Drexhage, 2020: Minerals for Climate Action: The Mineral Intensity of the Clean Energy Transition. World Bank, Washington, DC, USA, 112 pp.
Hunt, D., S. Bittman, M. Chantigny, and R. Lemke, 2019: Year-Round N2O Emissions From Long-Term Applications of Whole and Separated Liquid Dairy Slurry on a Perennial Grass Sward and Strategies for Mitigation. Front. Sustain. Food Syst. , 3, 2019:00086 doi:10.3389/fsufs.2019.00086.
Huppmann, D., J. Rogelj, E. Kriegler, V. Krey, and K. Riahi, 2018: A new scenario resource for integrated 1.5°C research. Nat. Clim. Change, 8(12) , 1027–1030, doi:10.1038/s41558-018-0317-4.
Hurlbert, M., J. Krishnaswamy, E. Davin, F.X. Johnson, C.F. Mena, J. Morton, S. Myeong, D. Viner, K. Warner, A. Wreford, S. Zakieldeen, and Z. Zommers, 2019: Risk Management and Decision making in Relation to Sustainable Development. In: Climate Change and Land: an IPCC special report on climate change, desertification, land degradation, sustainable land management, food security, and greenhouse gas fluxes in terrestrial ecosystems[Shukla, P.R., J. Skea, E. Calvo Buendia, V. Masson-Delmotte, H.-O. Pörtner, D.C. Roberts, P. Zhai, R. Slade, S. Connors, R. van Diemen, M. Ferrat, E. Haughey, S. Luz, S. Neogi, M. Pathak, J. Petzold, J. Portugal Pereira, P. Vyas, E. Huntley, K. Kissick, M. Belkacemi, and J. Malley (eds.)]. Cambridge University Press, Cambridge, UK, and New York, NY, USA, pp. 673–800.
Hurmekoski, E. et al., 2020: Impact of structural changes in wood‐using industries on net carbon emissions in Finland. J. Ind. Ecol. , 24(4) , 899–912, doi:10.1111/jiec.12981.
Hurteau, M.D. and M.L. Brooks, 2011: Short- and Long-term Effects of Fire on Carbon in US Dry Temperate Forest Systems. Bioscience, 61(2) , 139–146, doi:10.1525/bio.2011.61.2.9.
Hurteau, M.D., J.B. Bradford, P.Z. Fulé, A.H. Taylor, and K.L. Martin, 2014: Climate change, fire management, and ecological services in the southwestern US. For. Ecol. Manage. , 327, 280–289, doi:10.1016/j.foreco.2013.08.007.
Hurteau, M.D., M.P. North, G.W. Koch, and B.A. Hungate, 2019: Opinion: Managing for disturbance stabilizes forest carbon. Proc. Natl. Acad. Sci. , 116(21) , 10193–10195, doi:10.1073/pnas.1905146116.
Hurtt, G.C. et al., 2020: Harmonization of global land use change and management for the period 850–2100 (LUH2) for CMIP6. Geosci. Model Dev. , 13 (11) , 5425–5464, doi:10.5194/gmd-13-5425-2020.
Hussain, S. et al., 2015: Rice management interventions to mitigate greenhouse gas emissions: a review. Environ. Sci. Pollut. Res. , 22(5) , 3342–3360, doi:10.1007/s11356-014-3760-4.
Hwang, O. et al., 2018: Efficacy of Different Biochars in Removing Odorous Volatile Organic Compounds (VOCs) Emitted from Swine Manure. ACS Sustain. Chem. Eng. , 6(11) , 14239–14247, doi:10.1021/acssuschemeng.8b02881.
ICFPA, 2021: ICFPA2020–2021Sustainability Progress Report . International Council of Forest & Paper Associations, 19 pp.
IEA, 2019: World Energy Outlook 2019 – Analysis – IEA. International Energy Agency, Paris, France, 810 pp. https://www.iea.org/reports/world-energy-outlook-2019.
IFOAM, 2016: Organic Farming, climate change mitigation and beyond reducing the environmental impacts of eu agriculture. IFOAM EU, Brussels, Belgium, 5 pp.
Ilstedt, U. et al., 2016: Intermediate tree cover can maximize groundwater recharge in the seasonally dry tropics. Sci. Rep. , 6(1) , 21930, doi:10.1038/srep21930.
Im, S., S.O. Petersen, D. Lee, and D.-H. Kim, 2020: Effects of storage temperature on CH4 emissions from cattle manure and subsequent biogas production potential. Waste Manag. , 101, 35–43, doi:10.1016/j.wasman.2019.09.036.
Ingalls, M.L., P. Meyfroidt, P.X. To, M. Kenney-Lazar, and M. Epprecht, 2018: The transboundary displacement of deforestation under REDD+: Problematic intersections between the trade of forest-risk commodities and land grabbing in the Mekong region. Glob. Environ. Change, 50, 255–267, doi:10.1016/j.gloenvcha.2018.04.003.
INPE, 2021: PRODES, Amazon, Monitoring of Deforestation in the Brazilian Amazon Forest by Satellite, Earth Observation, National Institute for Space Research, Government of Brazil. http://www.obt.inpe.br/OBT/assuntos/programas/amazonia/prodes (Accessed April 12, 2021).
IPBES 2016: The methodological assessment report on scenarios and models of biodiversity and ecosystem services[S. Ferrier, K.N. Ninan, P. Leadley, R. Alkemade, and L.A. Acosta, et al. (eds.)]. IPBES Secretariat, Bonn, Germany, 348 pp.
IPBES, 2018a: The IPBES assessment report on land degradation and restoration of the Intergovernmental Science-Policy Platform on Biodiversity and Ecosystem Services[Montanarella, L., R. Scholes, and A. Brainich (eds.)]. IPBES Secretariat, Bonn, Germany, 744pp.
IPBES, 2018b: Summary for policymakers of the regional assessment report on biodiversity and ecosystem services for Asia and the Pacific of the Intergovernmental Science-Policy Platform on Biodiversity and Ecosystem Services[Karki M., S. Senaratna Sellamuttu, S. Okayasu, W. Suzuki, L.A. Acosta, et al. (eds.)]. IPBES secretariat, Bonn, Germany, 41 pp.
IPBES, 2018c: Summary for policymakers of the regional assessment report on biodiversity and ecosystem services for Africa of the Intergovernmental Science-Policy Platform on Biodiversity and Ecosystem Services[E. Archer, L.E. Dziba, K.J. Mulongoy, M.A. Maoela, M. Walters, et al. (eds.)]. IPBES secretariat, Bonn, Germany, 49 pp.
IPBES, 2018d: Summary for policymakers of the regional assessment report on biodiversity and ecosystem services for Europe and Central Asia of the Intergovernmental Science-Policy Platform on Biodiversity and Ecosystem Services[Fischer M., M. Rounsevell, A. Torre-Marin Rando, A. Mader, A. Church, et al. (eds.)]. IPBES secretariat, Bonn, Germany, 48pp.
IPBES, 2018e: Summary for Policy Makers of the Assessment Report on Land Degradation and Restoration of the Intergovernmental Science-Policy Platform on Biodiversity and Ecosystem Services[Scholes, R., L. Montanarella, A. Brainich, N. Barger, B. ten Brink et al., (eds.)]. Intergovernmental Science-Policy Platform on Biodiversity and Ecosystem Services (IPBES), Bonn, Germany.
IPBES, 2019a: Summary for policymakers of the global assessment report on biodiversity and ecosystem services of the Intergovernmental Science-Policy Platform on Biodiversity and Ecosystem Services[Díaz, S., J. Settele, E.S. Brondízio, H.T. Ngo, M. Guèze, et al. (eds.)]. IPBES secretariat, Bonn, Germany, 56 pp.
IPBES, 2019b: Global assessment report on biodiversity and ecosystem services of the Intergovernmental Science-Policy Platform on Biodiversity and Ecosystem Services[Brondízio E.S, J. Settele, S. Díaz, and H.T. Ngo (eds.)]. IPBES secretariat, Bonn, Germany, 1144 pp.
IPBES-IPCC, 2021: IPBES-IPCC co-sponsored workshop report on biodiversity and climate change. IPBES and IPCC, Bonn, Germany, 28 pp.
IPCC, 1996: Revised 1996 IPCC Guidelines for National Greenhouse Gas Inventories. IPCC, Geneva, Switzerland, 190 pp.
IPCC, 2006: 2006 IPCC – Guidelines for National Greenhouse Gas Inventories[Eggleston H.S., L. Buendia, K. Miwa, T. Ngara, and K. Tanabe K. (eds.)]. Prepared by the National Greenhouse Gas Inventories Programme. Institute for Global Environmental Strategies (IGES), Kanagawa, Japan.
IPCC, 2010: Revisiting the use of managed land as a proxy for estimating national anthropogenic emissions and removals. [Eggleston, H.S., N. Srivastava, K.Tanabe, and J. Baasansuren (eds.)]. Institute for Global Environmental Strategies (IGES), Kanagawa, Japan, 56 pp.
IPCC, 2018: Global Warming of 1.5°C. An IPCC Special Report on the impacts of global warming of 1.5°C above pre-industrial levels and related global greenhouse gas emission pathways, in the context of strengthening the global response to the threat of climate change, sustainable development, and efforts to eradicate poverty. [Masson-Delmotte, V., P. Zhai, H.-O. Pörtner, D. Roberts, J. Skea, P.R. Shukla, A. Pirani, W. Moufouma-Okia, C. Péan, R. Pidcock, S. Connors, J.B.R. Matthews, Y. Chen, X. Zhou, M.I. Gomis, E. Lonnoy, T. Maycock, M. Tignor, and T. Waterfield (eds.)]. Cambridge University Press, Cambridge, UK and New York, NY, USA.
IPCC, 2019: Climate Change and Land: an IPCC special report on climate change, desertification, land degradation, sustainable land management, food security, and greenhouse gas fluxes in terrestrial ecosystems. [Shukla, P.R., J. Skea, E. Calvo Buendia, V. Masson-Delmotte, H.-O. Pörtner, D.C. Roberts, P. Zhai, R. Slade, S. Connors, R. van Diemen, M. Ferrat, E. Haughey, S. Luz, S. Neogi, M. Pathak, J. Petzold, J. Portugal Pereira, P. Vyas, E. Huntley, K. Kissick, M. Belkacemi, and J. Malley (eds.)]. Cambridge University Press, Cambridge, UK and New York, NY, USA.
Islam, S.M.M. et al., 2018: Nitrous oxide and nitric oxide emissions from lowland rice cultivation with urea deep placement and alternate wetting and drying irrigation. Sci. Rep. , 8(1) , 17623, doi:10.1038/s41598-018-35939-7.
Ivanova, D. et al., 2020: Quantifying the potential for climate change mitigation of consumption options. Environ. Res. Lett. , 15(9) , 093001, doi:10.1088/1748-9326/ab8589.
Jackson, R.B. et al., 2020: Increasing anthropogenic methane emissions arise equally from agricultural and fossil fuel sources. Environ. Res. Lett. , 15(7) , 071002, doi:10.1088/1748-9326/ab9ed2.
Jaganathan, D., K. Ramasamy, G. Sellamuthu, S. Jayabalan, and G. Venkataraman, 2018: CRISPR for Crop Improvement: An Update Review. Front. Plant Sci. , 9, doi:10.3389/fpls.2018.00985.
Jamnadass, R. et al., 2020: Enhancing African orphan crops with genomics. Nat. Genet. , 52(4) , 356–360, doi:10.1038/s41588-020-0601-x.
Janssen, A., 2020: These farmers deserve support . Wageningen World, Wageningen, The Netherlands, 44–45 pp. https://edepot .wur.nl/530828.
Janssens-Maenhout, G. et al., 2019: EDGAR v4.3.2 Global Atlas of the three major greenhouse gas emissions for the period 1970–2012. Earth Syst. Sci. Data, 11(3) , 959–1002, doi:10.5194/essd-11-959-2019.
Jasinevičius, G., M. Lindner, P. Verkerk, and M. Aleinikovas, 2017: Assessing Impacts of Wood Utilisation Scenarios for a Lithuanian Bioeconomy: Impacts on Carbon in Forests and Harvested Wood Products and on the Socio-Economic Performance of the Forest-Based Sector. Forests, 8(4) , 133, doi:10.3390/f8040133.
Jauhiainen, J., S. Limin, H. Silvennoinen, and H. Vasander, 2008: Carbon Dioxide and Methane Fluxes in Drained Tropical Peat Before and After Hydrological Restoration. Ecology, 89(12) , 3503–3514, doi:10.1890/07-2038.1.
Jayachandran, S. et al., 2017: Cash for carbon: A randomized trial of payments for ecosystem services to reduce deforestation. Science, 357(6348) , 267–273, doi:10.1126/science.aan0568.
Jayanegara, A. et al., 2018: Use of 3-nitrooxypropanol as feed additive for mitigating enteric methane emissions from ruminants: a meta-analysis. Ital. J. Anim. Sci. , 17(3) , 650–656, doi:10.1080/1828051X.2017.1404945.
Jayasundara, S., J.A.D. Ranga Niroshan Appuhamy, E. Kebreab, and C. Wagner-Riddle, 2016: Methane and nitrous oxide emissions from Canadian dairy farms and mitigation options: An updated review. Can. J. Anim. Sci. , 96(3) , 306–331, doi:10.1139/cjas-2015-0111.
Jeffery, S. et al., 2017: Biochar boosts tropical but not temperate crop yields. Environ. Res. Lett. , 12(5) , 053001, doi:10.1088/1748-9326/aa67bd.
Jennerjahn, T.C. et al., 2017: Mangrove Ecosystems under Climate Change. In: Mangrove Ecosystems: A Global Biogeographic Perspective. Springer International Publishing, Cham, Switzerland, pp. 211–244.
Jensen, E.S., G. Carlsson, and H. Hauggaard-Nielsen, 2020: Intercropping of grain legumes and cereals improves the use of soil N resources and reduces the requirement for synthetic fertilizer N: A global-scale analysis. Agron. Sustain. Dev. , 40(1) , 5, doi:10.1007/s13593-020-0607-x.
Jia, G., E. Shevliakova, P. Artaxo, N. De Noblet-Ducoudré, R. Houghton, J. House, K. Kitajima, C. Lennard, A. Popp, A. Sirin, R. Sukumar, and L. Verchot, 2019: Land–climate interactions. In: Climate Change and Land: an IPCC special report on climate change, desertification, land degradation, sustainable land management, food security, and greenhouse gas fluxes in terrestrial ecosystems[Shukla, P.R., J. Skea, E. Calvo Buendia, V. Masson-Delmotte, H.-O. Pörtner, D.C. Roberts, P. Zhai, R. Slade, S. Connors, R. van Diemen, M. Ferrat, E. Haughey, S. Luz, S. Neogi, M. Pathak, J. Petzold, J. Portugal Pereira, P. Vyas, E. Huntley, K. Kissick, M. Belkacemi, and J. Malley (eds.)]. Cambridge University Press, Cambridge, UK and New York, NY, USA, pp. 131–247.
Jiang, C., K. Guan, M. Khanna, L. Chen, and J. Peng, 2021: Assessing Marginal Land Availability Based on Land Use Change Information in the Contiguous United States. Environ. Sci. Technol. , 55(15) , 10794–10804, doi:10.1021/acs.est.1c02236.
Jiang, W., M.G. Jacobson, and M.H. Langholtz, 2019: A sustainability framework for assessing studies about marginal lands for planting perennial energy crops. Biofuels, Bioprod. Biorefining, 13(1) , 228–240, doi:10.1002/bbb.1948.
Jilani, T., T. Hasegawa, and Y. Matsuoka, 2015: The future role of agriculture and land use change for climate change mitigation in Bangladesh. Mitig. Adapt. Strateg. Glob. Change, 20(8) , 1289–1304, doi:10.1007/s11027-014-9545-8.
Joffre, R., J. Vacher, C. de los Llanos, and G. Long, 1988: The dehesa: an agrosilvopastoral system of the Mediterranean region with special reference to the Sierra Morena area of Spain. Agrofor. Syst. , 6(1–3) , 71–96, doi:10.1007/BF02344747.
Johnson, N. et al., 2019: Integrated Solutions for the Water-Energy-Land Nexus: Are Global Models Rising to the Challenge?Water, 11(11) , 2223, doi:10.3390/w11112223.
Johnsson, F., F. Normann, and E. Svensson, 2020: Marginal Abatement Cost Curve of Industrial CO2Capture and Storage – A Swedish Case Study. Front. Energy Res. , 8, doi:10.3389/fenrg.2020.00175.
Johnston, A.M. and T.W. Bruulsema, 2014: 4R Nutrient Stewardship for Improved Nutrient Use Efficiency. Procedia Eng. , 83, 365–370, doi:10.1016/j.proeng.2014.09.029.
Johnston, C.M.T. and V.C. Radeloff, 2019: Global mitigation potential of carbon stored in harvested wood products. Proc. Natl. Acad. Sci. , 116(29) , 14526–14531, doi:10.1073/pnas.1904231116.
Jolly, W.M. et al., 2015: Climate-induced variations in global wildfire danger from 1979 to 2013. Nat. Commun. , 6(1) , 7537, doi:10.1038/ncomms8537.
Jonker, A. et al., 2018: Genetic parameters of methane emissions determined using portable accumulation chambers in lambs and ewes grazing pasture and genetic correlations with emissions determined in respiration chambers1. J. Anim. Sci. , 96(8) , 3031–3042, doi:10.1093/jas/sky187.
Joosten, H., 2009: The Global Peatland CO2Picture. Wetlands International, Wageningen, The Netherlands, 36 pp.
Junginger, H.M. et al., 2019: The future of biomass and bioenergy deployment and trade: a synthesis of 15 years IEA Bioenergy Task 40 on sustainable bioenergy trade. Biofuels, Bioprod. Biorefining, 13(2) , 247–266, doi:10.1002/bbb.1993.
Kalies, E. and L.L. Yocom Kent, 2016: Tamm Review: Are fuel treatments effective at achieving ecological and social objectives? A systematic review. For. Ecol. Manage. , 375, 84–95, doi:10.1016/j.foreco.2016.05.021.
Kalliokoski, T. et al., 2020: Mitigation Impact of Different Harvest Scenarios of Finnish Forests That Account for Albedo, Aerosols, and Trade-Offs of Carbon Sequestration and Avoided Emissions. Front. For. Glob. Change, 3, doi:10.3389/ffgc.2020.562044.
Kallio, I., A. Marrit and B. Solberg, 2018: Leakage of forest harvest changes in a small open economy: case Norway. Scand. J. For. Res. , 33(5) , 502–510, doi:10.1080/02827581.2018.1427787.
Kalt, G. et al., 2019: Natural climate solutions versus bioenergy: Can carbon benefits of natural succession compete with bioenergy from short rotation coppice?GCB Bioenergy, 11(11) , 1283–1297, doi:10.1111/gcbb.12626.
Kalt, G. et al., 2020: Greenhouse gas implications of mobilizing agricultural biomass for energy: a reassessment of global potentials in 2050 under different food-system pathways. Environ. Res. Lett. , 15(3) , 034066, doi:10.1088/1748-9326/ab6c2e.
Kammann, C. et al., 2017: Biochar as a Tool to Reduce the Agricultural Greenhouse Gas Burden – Knowns, Unknowns and Future Research Needs. J. Environ. Eng. Landsc. Manag. , 25(2) , 114–139, doi:10.3846/16486897.2017.1319375.
Kansanga, M.M. and I. Luginaah, 2019: Agrarian livelihoods under siege: Carbon forestry, tenure constraints and the rise of capitalist forest enclosures in Ghana. World Dev. , 113, 131–142, doi:10.1016/j.worlddev.2018.09.002.
Kaparaju, P. and J. Rintala, 2011: Mitigation of greenhouse gas emissions by adopting anaerobic digestion technology on dairy, sow and pig farms in Finland. Renew. Energy, 36(1) , 31–41, doi:10.1016/j.renene.2010.05.016.
Karlsson, M., E. Alfredsson, and N. Westling, 2020: Climate policy co-benefits: a review. Clim. Policy, 20(3) , 292–316, doi:10.1080/14693062.2020.1724070.
Kashangaki, J. and P. Ericksen, 2018: Cost–benefit analysis of fodder production as a low emissions development strategy for the Kenyan dairy sector. ILRI, Nairobi, Kenya, 40 pp. http://cgspace.cgiar.org/rest/bitstreams/158438/retrieve.
Kassam, AL. Kassam, 2020: Rethinking Food and Agriculture: New Ways Forward. Woodhead Publishing, 476 pp.
Kastner, T., K.-H. Erb, and S. Nonhebel, 2011: International wood trade and forest change: A global analysis. Glob. Environ. Change, 21(3) , 947–956, doi:10.1016/j.gloenvcha.2011.05.003.
Kätterer, T. et al., 2019: Biochar addition persistently increased soil fertility and yields in maize-soybean rotations over 10 years in sub-humid regions of Kenya. F. Crop. Res. , 235, 18–26, doi:10.1016/j.fcr.2019.02.015.
Katwijk, M.M. et al., 2016: Global analysis of seagrass restoration: the importance of large‐scale planting. J. Appl. Ecol. , 53(2) , 567–578, doi:10.1111/1365-2664.12562.
Kauffman, J.B. et al., 2020: Total ecosystem carbon stocks of mangroves across broad global environmental and physical gradients. Ecol. Monogr. , 90(2) , doi:10.1002/ecm.1405.
Kavanagh, I. et al., 2019: Mitigation of ammonia and greenhouse gas emissions from stored cattle slurry using acidifiers and chemical amendments. J. Clean. Prod. , 237, 117822, doi:10.1016/j.jclepro.2019.117822.
Keeley, J.E., P. van Mantgem, and D.A. Falk, 2019: Fire, climate and changing forests. Nat. Plants, 5(8) , 774–775, doi:10.1038/s41477-019-0485-x.
Kelleway, J.J. et al., 2017: Review of the ecosystem service implications of mangrove encroachment into salt marshes. Glob. Change Biol. , 23 (10) , 3967–3983, doi:10.1111/gcb.13727.
Kennedy, H., D.M. Alongi, A. Karim, G. Chen, G.L. Chmura, S. Crooks, J.G. Kairo, B. Liao, and G. Lin, 2014: Chapter 4: Coastal Wetlands. In: 2013 Supplement to the 2006 IPCC Guidelines for National Greenhouse Gas Inventories: Wetlands. [Hiraishi, T., T. Krug, K. Tanabe, N. Srivastava, J. Baasansuren, M. Fukuda, and T. Troxler (eds.)]. IPCC, Geneva, Switzerland, pp. 1–55.
Keramidas, K. et al., 2018: Global Energy and Climate Outlook 2018: Sectoral mitigation options towards a low-emissions economy – Global context to the EU strategy for long-term greenhouse gas emissions reduction. European Union (EU), Luxembourg, 200 pp.
Khanna, M., P. Dwivedi, and R. Abt, 2017: Is Forest Bioenergy Carbon Neutral or Worse than Coal? Implications of Carbon Accounting Methods. Int. Rev. Environ. Resour. Econ. , 10(3–4) , 299–346, doi:10.1561/101.00000089.
Kiggundu, N. et al., 2019: Greenhouse gas emissions from Uganda’s cattle corridor farming systems. Agric. Syst. , 176, 102649, doi:10.1016/j.agsy.2019.102649.
Killeen, T.J., 2007: A Perfect Storm in the Amazon Wilderness: Success and Failure in the Fight to Save an Ecosystem of Critical Importance to the Planet . The White Horse Press, Cambridgeshire, UK. 160 p.
Kim, J., G. Yoo, D. Kim, W. Ding, and H. Kang, 2017a: Combined application of biochar and slow-release fertilizer reduces methane emission but enhances rice yield by different mechanisms. Appl. Soil Ecol. , 117–118, 57–62, doi:10.1016/j.apsoil.2017.05.006.
Kim, J.B. et al., 2017b: Assessing climate change impacts, benefits of mitigation, and uncertainties on major global forest regions under multiple socioeconomic and emissions scenarios. Environ. Res. Lett. , 12(4) , 045001, doi:10.1088/1748-9326/aa63fc.
Kinley, R.D. et al., 2020: Mitigating the carbon footprint and improving productivity of ruminant livestock agriculture using a red seaweed. J. Clean. Prod. , 259, 120836, doi:10.1016/j.jclepro.2020.120836.
Kirchmann, H., 2019: Why organic farming is not the way forward. Outlook Agric. , 48(1) , 22–27, doi:10.1177/0030727019831702.
Kirchmeier‐Young, M.C., N.P. Gillett, F.W. Zwiers, A.J. Cannon, and F.S. Anslow, 2019: Attribution of the Influence of Human‐Induced Climate Change on an Extreme Fire Season. Earth’s Futur. , 7 (1) , 2–10, doi:10.1029/2018EF001050.
Kirchner, M. et al., 2015: Ecosystem services and economic development in Austrian agricultural landscapes — The impact of policy and climate change scenarios on trade-offs and synergies. Ecol. Econ. , 109, 161–174, doi:10.1016/j.ecolecon.2014.11.005.
Klein, D., C. Wolf, C. Schulz, and G. Weber-Blaschke, 2015: 20 years of life cycle assessment (LCA) in the forestry sector: state of the art and a methodical proposal for the LCA of forest production. Int. J. Life Cycle Assess. , 20(4) , 556–575, doi:10.1007/s11367-015-0847-1.
Kleinschroth, F. and J.R. Healey, 2017: Impacts of logging roads on tropical forests. Biotropica, 49(5) , 620–635, doi:10.1111/btp.12462.
Kongsager, R., 2017: Barriers to the Adoption of Alley Cropping as a Climate-Smart Agriculture Practice: Lessons from Maize Cultivation among the Maya in Southern Belize. Forests, 8(7) , 260, doi:10.3390/f8070260.
Koornneef, J. et al., 2012: Global potential for biomass and carbon dioxide capture, transport and storage up to 2050. Int. J. Greenh. Gas Control, 11, 117–132, doi:10.1016/j.ijggc.2012.07.027.
Kösler, J.E., O.C. Calvo, J. Franzaring, and A. Fangmeier, 2019: Evaluating the ecotoxicity of nitrification inhibitors using terrestrial and aquatic test organisms. Environ. Sci. Eur. , 31(1) , 91, doi:10.1186/s12302-019-0272-3.
Kram, T., D. van Vuuren, and E. Stehfest, 2014: Drivers, Chapter 3, In: Integrated Assessment of Global Environmental Change with IMAGE 3.0. Model description and policy applications. [Stehfest, E., D. Van Vuuren, T. Kram, and L. Bouwman (eds.)]. PBL Netherlands Environmental Assessment Agency, The Hague, The Netherlands. 370p.
Krause, A. et al., 2017: Global consequences of afforestation and bioenergy cultivation on ecosystem service indicators. Biogeosciences, 14(21) , 4829–4850, doi:10.5194/bg-14-4829-2017.
Kraxner, F. et al., 2017: Mapping certified forests for sustainable management – A global tool for information improvement through participatory and collaborative mapping. For. Policy Econ. , 83, 10–18, doi:10.1016/j.forpol.2017.04.014.
Kreidenweis, U. et al., 2016: Afforestation to mitigate climate change: impacts on food prices under consideration of albedo effects. Environ. Res. Lett. , 11(8) , 085001, doi:10.1088/1748-9326/11/8/085001.
Kriegler, E. et al., 2015: Diagnostic indicators for integrated assessment models of climate policy. Technol. Forecast. Soc. Change, 90(PA) , 45–61, doi:10.1016/j.techfore.2013.09.020.
Kritee, K. et al., 2018: High nitrous oxide fluxes from rice indicate the need to manage water for both long- and short-term climate impacts. Proc. Natl. Acad. Sci. , 115(39) , 9720–9725, doi:10.1073/pnas.1809276115.
Krofcheck, D.J., M.D. Hurteau, R.M. Scheller, and E.L. Loudermilk, 2018: Prioritizing forest fuels treatments based on the probability of high‐severity fire restores adaptive capacity in Sierran forests. Glob. Change Biol. , 24(2) , 729–737, doi:10.1111/gcb.13913.
Krofcheck, D.J., C.C. Remy, A.R. Keyser, and M.D. Hurteau, 2019: Optimizing Forest Management Stabilizes Carbon Under Projected Climate and Wildfires. J. Geophys. Res. Biogeosciences, 124(10) , 3075–3087, doi:10.1029/2019JG005206.
Krug, J.H.A., 2018: Accounting of GHG emissions and removals from forest management: a long road from Kyoto to Paris. Carbon Balance Manag. , 13(1) , 1, doi:10.1186/s13021-017-0089-6.
Ku-Vera, J.C. et al., 2020: Review: Strategies for enteric methane mitigation in cattle fed tropical forages. Animal, 14, s453–s463, doi:10.1017/S1751731120001780.
Kubiszewski, I., R. Costanza, S. Anderson, and P. Sutton, 2017: The future value of ecosystem services: Global scenarios and national implications. Ecosyst. Serv. , 26, 289–301, doi:10.1016/j.ecoser.2017.05.004.
Kumar, B.M. and P.K.R. Nair, 2011: Carbon Sequestration Potential of Agroforestry Systems. [Kumar, B.M. and P.K.R. Nair (eds.)]. Springer Netherlands, Dordrecht, The Netherlands. 298 p.
Kupper, T. et al., 2020: Ammonia and greenhouse gas emissions from slurry storage – A review. Agric. Ecosyst. Environ. , 300, 106963, doi:10.1016/j.agee.2020.106963.
Kurz, W.A. et al., 2008: Mountain pine beetle and forest carbon feedback to climate change. Nature, 452(7190) , 987–990, doi:10.1038/nature06777.
Kuyah, S. et al., 2019: Agroforestry delivers a win-win solution for ecosystem services in sub-Saharan Africa. A meta-analysis. Agron. Sustain. Dev. , 39(5) , 47, doi:10.1007/s13593-019-0589-8.
Laborde, D., S. Murphy, M. Parent, J. Porciello, and S.C, 2020: Ceres2030: Sustainable Solutions to End Hunger – Summary Report . Cornell University, IFPRI and IISD, New York, USA, 40 pp.
Lai, L. et al., 2016: Carbon emissions from land-use change and management in China between 1990 and 2010. Sci. Adv. , 2 (11) , doi:10.1126/sciadv.1601063.
Lal, R., 2015: Sequestering carbon and increasing productivity by conservation agriculture. J. Soil Water Conserv. , 70(3) , 55A-62A, doi:10.2489/jswc.70.3.55A.
Lal, R., 2020: Integrating Animal Husbandry With Crops and Trees. Front. Sustain. Food Syst. , 4, doi:10.3389/fsufs.2020.00113.
Lal, R. et al., 2018: The carbon sequestration potential of terrestrial ecosystems. J. Soil Water Conserv. , 73(6) , 145A-152A, doi:10.2489/jswc.73.6.145A.
Lambin, E.F. et al., 2018: The role of supply-chain initiatives in reducing deforestation. Nat. Clim. Change, 8(2) , 109–116, doi:10.1038/s41558-017-0061-1.
Lampkin, N.H., et al., 2017: The role of agroecology in sustainable intensification. Asp. Appl. Biol. , 136, 53–62.
Landholm, D.M. et al., 2019: Reducing deforestation and improving livestock productivity: greenhouse gas mitigation potential of silvopastoral systems in Caquetá. Environ. Res. Lett. , 14(11) , 114007, doi:10.1088/1748-9326/ab3db6.
Lanigan, G.J. et al., 2018: An Analysis of Abatement Potential of Greenhouse Gas Emissions in Irish Agriculture 2021-2030. Agriculture and Food Development Authority, Carlow, Ireland, 1–80 pp.
Lark, T.J., J. Meghan Salmon, and H.K. Gibbs, 2015: Cropland expansion outpaces agricultural and biofuel policies in the United States. Environ. Res. Lett. , 10(4) , 044003, doi:10.1088/1748-9326/10/4/044003.
Latka, C. et al., 2021: Paying the price for environmentally sustainable and healthy EU diets. Glob. Food Sec. , 28, 100437, doi:10.1016/j.gfs.2020.100437.
Laurance, W. and A. Balmford, 2013: A global map for road building. Nature, 495(7441) , 308–309, doi:10.1038/495308a.
Laurance, W.F. and I.B.B. Arrea, 2017: Roads to riches or ruin?Science, 358(6362) , 442–444, doi:10.1126/science.aao0312.
Laurance, W.F. et al., 2001: The Future of the Brazilian Amazon. Science, 291(5503) , 438–439, doi:10.1126/science.291.5503.438.
Laurance, W.F., M. Goosem, and S.G.W. Laurance, 2009: Impacts of roads and linear clearings on tropical forests. Trends Ecol. Evol. , 24(12) , 659–669, doi:10.1016/j.tree.2009.06.009.
Laurance, W.F. et al., 2014a: A global strategy for road building. Nature, 513(7517) , 229–232, doi:10.1038/nature13717.
Laurance, W.F., J. Sayer, and K.G. Cassman, 2014b: Agricultural expansion and its impacts on tropical nature. Trends Ecol. Evol. , 29(2) , 107–116, doi:10.1016/j.tree.2013.12.001.
Laurance, W.F. et al., 2015a: Reducing the global environmental impacts of rapid infrastructure expansion. Curr. Biol. , 25(7) , R259–R262, doi:10.1016/j.cub.2015.02.050.
Laurance, W.F., S. Sloan, L. Weng, and J.A. Sayer, 2015b: Estimating the Environmental Costs of Africa’s Massive “Development Corridors”. Curr. Biol. , 25(24) , 3202–3208, doi:10.1016/j.cub.2015.10.046.
Lauri, P. et al., 2019: Global Woody Biomass Harvest Volumes and Forest Area Use Under Different SSP-RCP Scenarios. J. For. Econ. , 34(3–4) , 285–309, doi:10.1561/112.00000504.
Le Noë, J. et al., 2020: Modeling and empirical validation of long‐term carbon sequestration in forests (France, 1850–2015). Glob. Change Biol. , 26(4) , 2421–2434, doi:10.1111/gcb.15004.
Leahy, S., H. Clark, and A. Reisinger, 2020: Challenges and Prospects for Agricultural Greenhouse Gas Mitigation Pathways Consistent With the Paris Agreement. Front. Sustain. Food Syst. , 4, doi:10.3389/fsufs.2020.00069.
Leahy, S.C., L. Kearney, A. Reisinger, and H. Clark, 2019: Mitigating greenhouse gas emissions from New Zealand pasture-based livestock farm systems. J. New Zeal. Grasslands, 81101–110, doi:10.33584/jnzg.2019.81.417.
Leal Filho, W., U.M. Azeiteiro, A.L. Salvia, B. Fritzen, and R. Libonati, 2021: Fire in Paradise: Why the Pantanal is burning. Environ. Sci. Policy, 123, 31–34, doi:10.1016/j.envsci.2021.05.005.
Lechner, A.M., F.K.S. Chan, and A. Campos-Arceiz, 2018: Biodiversity conservation should be a core value of China’s Belt and Road Initiative. Nat. Ecol. Evol. , 2(3) , 408–409, doi:10.1038/s41559-017-0452-8.
Lee, J.W. and D.M. Day, 2013: Smokeless biomass pyrolysis for producing biofuels and biochar as a possible arsenal to control climate change. In: Advanced Biofuels and Bioproducts[Lee, J.W. (ed.)]. Springer, New York, USA, pp. 23–34.
Lefcheck, J.S. et al., 2018: Long-term nutrient reductions lead to the unprecedented recovery of a temperate coastal region. Proc. Natl. Acad. Sci. , 115(14) , 3658–3662, doi:10.1073/pnas.1715798115.
Lehmann, J. and S. Joseph, 2012: Biochar for Environmental Management . [Lehmann, J. and S. Joseph (eds.)]. Routledge, Abingdon, Oxfordshire, UK, 976 pp.
Lehmann, J. and M. Rillig, 2014: Distinguishing variability from uncertainty. Nat. Clim. Change, 4 (3) , 153–153, doi:10.1038/nclimate2133.
Leifeld, J., 2016: Current approaches neglect possible agricultural cutback under large-scale organic farming. A comment to Ponisio et al. Proc. R. Soc. B Biol. Sci. , 283(1824) , 20151623, doi:10.1098/rspb.2015.1623.
Leifeld, J. and L. Menichetti, 2018: The underappreciated potential of peatlands in global climate change mitigation strategies. Nat. Commun. , 9(1) , 1071, doi:10.1038/s41467-018-03406-6.
Leifeld, J. et al., 2013: Organic farming gives no climate change benefit through soil carbon sequestration. Proc. Natl. Acad. Sci. , 110(11) , E984–E984, doi:10.1073/pnas.1220724110.
Leifeld, J., C. Wüst-Galley, and S. Page, 2019: Intact and managed peatland soils as a source and sink of GHGs from 1850 to 2100. Nat. Clim. Change, 9(12) , 945–947, doi:10.1038/s41558-019-0615-5.
Lejeune, Q., E.L. Davin, L. Gudmundsson, J. Winckler, and S.I. Seneviratne, 2018: Historical deforestation locally increased the intensity of hot days in northern mid-latitudes. Nat. Clim. Change, 8(5) , 386–390, doi:10.1038/s41558-018-0131-z.
Lemaire, G., A. Franzluebbers, P.C. de F. Carvalho, and B. Dedieu, 2014: Integrated crop–livestock systems: Strategies to achieve synergy between agricultural production and environmental quality. Agric. Ecosyst. Environ. , 190, 4–8, doi:10.1016/j.agee.2013.08.009.
Lenton, T.M., 2010: The potential for land-based biological CO2 removal to lower future atmospheric CO2 concentration. Carbon Manag. , 1(1) , 145–160, doi:10.4155/cmt.10.12.
Lenton, T.M., 2014: The global potential for carbon dioxide removal. In: Geoengineering of the Climate System[Harrison, R.M. and R.E. Hester (eds.)]. Royal Society of Chemistry, Cambridge, UK, pp. 52–79.
Leonardi, S., F. Magnani, A. Nolè, T. Van Noije, and M. Borghetti, 2015: A global assessment of forest surface albedo and its relationships with climate and atmospheric nitrogen deposition. Glob. Change Biol. , 21(1) , 287–298, doi:10.1111/gcb.12681.
Leskinen, P. et al., 2018: Substitution effects of wood-based products in climate change mitigation. European Forest Institute (EFI), Joensuu, Finland, 28 pp.
Leskinen, P. et al., 2020: Russian forests and climate change. European Forest Institute, Joensuu, Finland, 136 pp.
Levang, P., G. Lescuyer, D. Noumbissi, C. Déhu, and L. Broussolle, 2015: Does gathering really pay? Case studies from forest areas of the East and South regions of Cameroon. For. Trees Livelihoods, 24(2) , 128–143, doi:10.1080/14728028.2014.1000980.
Lewis, S.L., C.E. Wheeler, E.T.A. Mitchard, and A. Koch, 2019: Restoring natural forests is the best way to remove atmospheric carbon. Nature, 568(7750) , 25–28, doi:10.1038/d41586-019-01026-8.
Li, D. and E. Bou-Zeid, 2013: Synergistic Interactions between Urban Heat Islands and Heat Waves: The Impact in Cities Is Larger than the Sum of Its Parts. J. Appl. Meteorol. Climatol. , 52(9) , 2051–2064, doi:10.1175/JAMC-D-13-02.1.
Li, W. et al., 2020: Mapping the yields of lignocellulosic bioenergy crops from observations at the global scale. Earth Syst. Sci. Data, 12(2) , 789–804, doi:10.5194/essd-12-789-2020.
Li, Y. et al., 2015: Local cooling and warming effects of forests based on satellite observations. Nat. Commun. , 6(1) , 6603, doi:10.1038/ncomms7603.
Lima, M., C.A. da Silva Junior, L. Rausch, H.K. Gibbs, and J.A. Johann, 2019: Demystifying sustainable soy in Brazil. Land use policy, 82, 349–352, doi:10.1016/j.landusepol.2018.12.016.
Lin, Z. et al., 2017: Overview of Ecological Restoration Technologies and Evaluation Systems. J. Resour. Ecol. , 8(4) , 315–324, doi:10.5814/j.issn.1674-764x.2017.04.002.
Lipper, L., C. Dutilly-Diane, and N. McCarthy, 2010: Supplying Carbon Sequestration From West African Rangelands: Opportunities and Barriers. Rangel. Ecol. Manag. , 63(1) , 155–166, doi:10.2111/REM-D-09-00009.1.
Lipsett-Moore, G.J., N.H. Wolff, and E.T. Game, 2018: Emissions mitigation opportunities for savanna countries from early dry season fire management. Nat. Commun. , 9(1) , 2247, doi:10.1038/s41467-018-04687-7.
Liu, Q. et al., 2018: How does biochar influence soil N cycle? A meta-analysis. Plant Soil, 426(1–2) , 211–225, doi:10.1007/s11104-018-3619-4.
Liu, Q. et al., 2019: Biochar application as a tool to decrease soil nitrogen losses NH3 volatilization, N2O emissions, and N leaching from croplands: Options and mitigation strength in a global perspective. Glob. Change Biol. , 25(6) , 2077–2093, doi:10.1111/gcb.14613.
Liu, T. et al., 2017: Bioenergy production on marginal land in Canada: Potential, economic feasibility, and greenhouse gas emissions impacts. Appl. Energy, 205, 477–485, doi:10.1016/j.apenergy.2017.07.126.
Liu, Z. and Y. Liu, 2018: Mitigation of greenhouse gas emissions from animal production. Greenh. Gases Sci. Technol. , 8(4) , 627–638, doi:10.1002/ghg.1785.
Locatelli, B. et al., 2015: Tropical reforestation and climate change: beyond carbon. Restor. Ecol. , 23(4) , 337–343, doi:10.1111/rec.12209.
Löf, M., P. Madsen, M. Metslaid, J. Witzell, and D.F. Jacobs, 2019: Restoring forests: regeneration and ecosystem function for the future. New For. , 50(2) , 139–151, doi:10.1007/s11056-019-09713-0.
Loisel, J. et al., 2014: A database and synthesis of northern peatland soil properties and Holocene carbon and nitrogen accumulation. The Holocene, 24(9) , 1028–1042, doi:10.1177/0959683614538073.
Loomis, J., P. Kent, L. Strange, K. Fausch, and A. Covich, 2000: Measuring the total economic value of restoring ecosystem services in an impaired river basin: results from a contingent valuation survey. Ecol. Econ. , 33(1) , 103–117, doi:10.1016/S0921-8009(99)00131-7.
López-Paredes, J. et al., 2020: Mitigation of greenhouse gases in dairy cattle via genetic selection: 1. Genetic parameters of direct methane using noninvasive methods and proxies of methane. J. Dairy Sci. , 103(8) , 7199–7209, doi:10.3168/jds.2019-17597.
López‐Aizpún, M. et al., 2020: Meta‐analysis of global livestock urine‐derived nitrous oxide emissions from agricultural soils. Glob. Change Biol. , 26(4) , 2002–2013, doi:10.1111/gcb.15012.
Loudermilk, E.L., R.M. Scheller, P.J. Weisberg, and A. Kretchun, 2017: Bending the carbon curve: fire management for carbon resilience under climate change. Landsc. Ecol. , 32(7) , 1461–1472, doi:10.1007/s10980-016-0447-x.
Lovejoy, T.E. and C. Nobre, 2018: Amazon Tipping Point. Sci. Adv. , 4(2) , eaat2340, doi:10.1126/sciadv.aat2340.
Lovelock, C. and R. Reef, 2020: Variable Impacts of Climate Change on Blue Carbon. One Earth, 3(2) , 195–211, doi:10.1016/j.oneear.2020.07.010.
Lovelock, C.E., J.W. Fourqurean, and J.T. Morris, 2017: Modeled CO2 Emissions from Coastal Wetland Transitions to Other Land Uses: Tidal Marshes, Mangrove Forests, and Seagrass Beds. Front. Mar. Sci. , 4, doi:10.3389/fmars.2017.00143.
Lovelock, C.E., Daniel A. Friess, J.B.K.J.W.F., 2018: A Blue Carbon Primer. [Windham-Myers, L., S. Crooks, and T.G. Troxler (eds.)]. CRC Press, Boca Raton. 507 pp.
Luedeling, E. and H. Neufeldt, 2012: Carbon sequestration potential of parkland agroforestry in the Sahel. Clim. Change, 115(3–4) , 443–461, doi:10.1007/s10584-012-0438-0.
Luttrell, C., E. Sills, R. Aryani, A.D. Ekaputri, and M.F. Evinke, 2018: Beyond opportunity costs: who bears the implementation costs of reducing emissions from deforestation and degradation?Mitig. Adapt. Strateg. Glob. Change, 23(2) , 291–310, doi:10.1007/s11027-016-9736-6.
Luyssaert, S. et al., 2018: Trade-offs in using European forests to meet climate objectives. Nature, 562 (7726) , 259–262, doi:10.1038/s41586-018-0577-1.
Luderer, G., et al., 2021: Impact of declining renewable energy costs on electrification in low emisison scenarios. Nat. Energy 7:32-42, doi:10.1038/s41560-021-00937-z.
Lynch, D., J. Russell-Smith, A.C. Edwards, J. Evans, and C. Yates, 2018: Incentivising fire management in Pindan (Acacia shrubland): A proposed fuel type for Australia’s Savanna burning greenhouse gas emissions abatement methodology. Ecol. Manag. Restor. , 19(3) , 230–238, doi:10.1111/emr.12334.
Lynch, J. and R. Pierrehumbert, 2019: Climate Impacts of Cultured Meat and Beef Cattle. Front. Sustain. Food Syst. , 3, doi:10.3389/fsufs.2019.00005.
Ma, S., D.D. Baldocchi, L. Xu, and T. Hehn, 2007: Inter-annual variability in carbon dioxide exchange of an oak/grass savanna and open grassland in California. Agric. For. Meteorol. , 147(3–4) , 157–171, doi:10.1016/j.agrformet.2007.07.008.
Maaz, T.M. et al., 2021: Meta‐analysis of yield and nitrous oxide outcomes for nitrogen management in agriculture. Glob. Change Biol. , 27(11) , 2343–2360, doi:10.1111/gcb.15588.
Macdiarmid, J.I., 2013: Is a healthy diet an environmentally sustainable diet?Proc. Nutr. Soc. , 72(1) , 13–20, doi:10.1017/S0029665112002893.
MacLeod, M. et al., 2018: Assessing the Greenhouse Gas Mitigation Effect of Removing Bovine Trypanosomiasis in Eastern Africa. Sustainability, 10(5) , 1633, doi:10.3390/su10051633.
Macreadie, P.I. et al., 2019: The future of Blue Carbon science. Nat. Commun. , 10(1) , 3998, doi:10.1038/s41467-019-11693-w.
Magkos, F. et al., 2020: A Perspective on the Transition to Plant-Based Diets: a Diet Change May Attenuate Climate Change, but Can It Also Attenuate Obesity and Chronic Disease Risk?Adv. Nutr. , 11(1) , 1–9, doi:10.1093/advances/nmz090.
Mahmood, R. et al., 2014: Land cover changes and their biogeophysical effects on climate. Int. J. Climatol. , 34(4) , 929–953, doi:10.1002/joc.3736.
Mäkelä, M., 2017: Environmental impacts and aspects in the forest industry: What kind of picture do corporate environmental reports provide?For. Policy Econ. , 80, 178–191, doi:10.1016/j.forpol.2017.03.018.
Mancini, L.D., P. Corona, and L. Salvati, 2018: Ranking the importance of Wildfires’ human drivers through a multi-model regression approach. Environ. Impact Assess. Rev. , 72, 177–186, doi:10.1016/j.eiar.2018.06.003.
Maneepitak, S. et al., 2019: Effects of water and rice straw management practices on water savings and greenhouse gas emissions from a double-rice paddy field in the Central Plain of Thailand. Eur. J. Agron. , 107, 18–29, doi:10.1016/j.eja.2019.04.002.
Mantyka-Pringle, C.S. et al., 2017: Bridging science and traditional knowledge to assess cumulative impacts of stressors on ecosystem health. Environ. Int. , 102, 125–137, doi:10.1016/j.envint.2017.02.008.
Marlon, J.R. et al., 2012: Long-term perspective on wildfires in the western USA. Proc. Natl. Acad. Sci. , 109(9) , E535–E543, doi:10.1073/pnas.1112839109.
Martínez-Mena, M. et al., 2019: Fluvial sedimentary deposits as carbon sinks: organic carbon pools and stabilization mechanisms across a Mediterranean catchment. Biogeosciences, 16(5) , 1035–1051, doi:10.5194/bg-16-1035-2019.
Martius, C. et al., 2016: How to achieve reliable, transparent and independent monitoring of greenhouse gas emissions from land activities for policy support . 2016 Berlin Conference on Global Transformative Climate Governance, 7 pp.
Mašek, O. et al., 2018: Consistency of biochar properties over time and production scales: A characterisation of standard materials. J. Anal. Appl. Pyrolysis, 132, 200–210, doi:10.1016/j.jaap.2018.02.020.
Mausel, D.L., A. Waupochick, and M. Pecore, 2017: Menominee Forestry: Past, Present, Future. J. For. , 115(5) , 366–369, doi:10.5849/jof.16-046.
Mayberry, D., H. Bartlett, J. Moss, T. Davison, and M. Herrero, 2019: Pathways to carbon-neutrality for the Australian red meat sector. Agric. Syst. , 175, 13–21, doi:10.1016/j.agsy.2019.05.009.
Mayer Pelicice, F., 2019: Weak Democracies, Failed Policies, and the Demise of Ecosystems in Poor and Developing Nations. Trop. Conserv. Sci. , 12, 194008291983990, doi:10.1177/1940082919839902.
Mbow, C., C. Rosenzweig, L.G. Barioni, T.G. Benton, M. Herrero, M. Krishnapillai, E. Liwenga, P. Pradhan, M.G. Rivera-Ferre, T. Sapkota, F.N. Tubiello, Y. Xu, 2019: Food Security. In: Climate Change and Land: an IPCC special report on climate change, desertification, land degradation, sustainable land management, food security, and greenhouse gas fluxes in terrestrial ecosystems[Shukla, P.R., J. Skea, E. Calvo Buendia, V. Masson-Delmotte, H.-O. Pörtner, D.C. Roberts, P. Zhai, R. Slade, S. Connors, R. van Diemen, M. Ferrat, E. Haughey, S. Luz, S. Neogi, M. Pathak, J. Petzold, J. Portugal Pereira, P. Vyas, E. Huntley, K. Kissick, M. Belkacemi, and J. Malley (eds.)]. Cambridge University Press, Cambridge, UK and New York, NY, USA, pp. 131–248.
Mbow, C. et al., 2020: Agroforestry as a solution for multiple climate change challenges in Africa. In: Climate Change and Agriculture[Deryng, D. (ed.)]. Burleigh Dodds Science Publishing Limited, Cambridge, UK.
McCarty, J.L., T.E.L. Smith, and M.R. Turetsky, 2020: Arctic fires re-emerging. Nat. Geosci. , 13(10) , 658–660, doi:10.1038/s41561-020-00645-5.
McDermott, J.J., S.J. Staal, H.A. Freeman, M. Herrero, and J.A. Van de Steeg, 2010: Sustaining intensification of smallholder livestock systems in the tropics. Livest. Sci. , 130(1–3) , 95–109, doi:10.1016/j.livsci.2010.02.014.
McGinn, S.M., T.K. Flesch, K.A. Beauchemin, A. Shreck, and M. Kindermann, 2019: Micrometeorological Methods for Measuring Methane Emission Reduction at Beef Cattle Feedlots: Evaluation of 3‐Nitrooxypropanol Feed Additive. J. Environ. Qual. , 48(5) , 1454–1461, doi:10.2134/jeq2018.11.0412.
McKenzie, L.J. et al., 2020: The global distribution of seagrass meadows. Environ. Res. Lett. , 15 (7) , 074041, doi:10.1088/1748-9326/ab7d06.
McLaren, D., 2012: A comparative global assessment of potential negative emissions technologies. Process Saf. Environ. Prot. , 90(6) , 489–500, doi:10.1016/j.psep.2012.10.005.
McMullin, S. et al., 2019: Developing fruit tree portfolios that link agriculture more effectively with nutrition and health: a new approach for providing year-round micronutrients to smallholder farmers. Food Secur. , 11(6) , 1355–1372, doi:10.1007/s12571-019-00970-7.
Mcowen, C. et al., 2017: A global map of saltmarshes. Biodivers. Data J. , 5, e11764, doi:10.3897/BDJ.5.e11764.
Meemken, E.-M. and M. Qaim, 2018: Organic Agriculture, Food Security, and the Environment. Annu. Rev. Resour. Econ. , 10(1) , 39–63, doi:10.1146/annurev-resource-100517-023252.
Mei, K. et al., 2018: Stimulation of N2O emission by conservation tillage management in agricultural lands: A meta-analysis. Soil Tillage Res. , 182, 86–93, doi:10.1016/j.still.2018.05.006.
Meier, M.S. et al., 2015: Environmental impacts of organic and conventional agricultural products – Are the differences captured by life cycle assessment?J. Environ. Manage. , 149, 193–208, doi:10.1016/j.jenvman.2014.10.006.
Meier, R. et al., 2021: Empirical estimate of forestation-induced precipitation changes in Europe. Nat. Geosci. , 14(7) , 473–478, doi:10.1038/s41561-021-00773-6.
Melgar, A. et al., 2020: Dose-response effect of 3-nitrooxypropanol on enteric methane emissions in dairy cows. J. Dairy Sci. , 103(7) , 6145–6156, doi:10.3168/jds.2019-17840.
Mendelsohn, R. and B. Sohngen, 2019: The Net Carbon Emissions from Historic Land Use and Land Use Change. J. For. Econ. , 34 (3–4), 263–283, doi:10.1561/112.00000505.
Mertz, O. and C.F. Mertens, 2017: Land Sparing and Land Sharing Policies in Developing Countries – Drivers and Linkages to Scientific Debates. World Dev. , 98, 523–535, doi:10.1016/j.worlddev.2017.05.002.
Meybeck, A. and V. Gitz, 2017: Sustainable diets within sustainable food systems. Proc. Nutr. Soc. , 76(1) , 1–11, doi:10.1017/S0029665116000653.
Meyer, S., R.M. Bright, D. Fischer, H. Schulz, and B. Glaser, 2012: Albedo Impact on the Suitability of Biochar Systems To Mitigate Global Warming. Environ. Sci. Technol. , 46(22) , 12726–12734, doi:10.1021/es302302g.
Miao, R., D.A. Hennessy, and H. Feng, 2016: The Effects of Crop Insurance Subsidies and Sodsaver on Land-Use Change. J. Agric. Resour. Econ. , 41(2) , 247–265, doi.org/10.22004/ag.econ.235189.
Millennium Ecosystem Assessment, 2005: Ecosystems and Human Well-being:Synthesis- a report on the e Millenium Ecosystem Assessment .Island Press, Washington, DC, USA. 155 pp.
Miller, D.C., J.C. Muñoz-Mora, L. V Rasmussen, and A. Zezza, 2020: Do Trees on Farms Improve Household Well-Being? Evidence From National Panel Data in Uganda. Front. For. Glob. Change, 3, doi:10.3389/ffgc.2020.00101.
Minasny, B. et al., 2019: Digital mapping of peatlands – A critical review. Earth-Science Rev. , 196, 102870, doi:10.1016/j.earscirev.2019.05.014.
Miner, R., 2010: Impact of the global forest industry on atmospheric greenhouse gases. Food and Agriculture Organization of the United Nations (FAO), Rome, Italy, 86 pp.
Ministerio do Meio Ambiente (MMA), 2013: Plano De Acao Para Prevencao E Controle Do Desmatamento Na Amazonia Legal (PPCDAm) Pelo uso sustentável e conservacao da floresta 3aFase (2012-2015). https://www.researchgate.net/publication/273756502_Plano_de_Acao_para_prevencao_e_controle_do_desmatamento_na_Amazonia_Legal_PPCDAm_3_fase_2012-2015_pelo_uso_sustentavel_e_conservacao_da_Floresta (Accessed March 21, 2021).
Ministry of Environment Government of Brazil, 2018: The Action Plan for the Prevention and Control of Deforestation in the Legal Amazon (PPCDAm). http://redd.mma.gov.br/en/legal-and-public-policy-framework/ppcdam (Accessed October 11, 2021).
Ministry of Foreign Affairs, 2019: Brazil’s third biennial update report to the United Nations framework convention on climate change. Brasilia, Brazil
Minx, J.C. et al., 2021: A comprehensive dataset for global, regional and national greenhouse gas emissions by sector 1970-2019 (Dataset). Zenodo, doi:10.5281/zenodo.5053056.
Mirzabaev, A., J. Wu, J. Evans, F. García-Oliva, I.A.G. Hussein, M.H. Iqbal, J. Kimutai, T. Knowles, F. Meza, D. Nedjraoui, F. Tena, M. Türkeş, R.J. Vázquez, M. Weltz, 2019: Desertification. In: Climate Change and Land: an IPCC special report on climate change, desertification, land degradation, sustainable land management, food security, and greenhouse gas fluxes in terrestrial ecosystems[Shukla, P.R., J. Skea, E. Calvo Buendia, V. Masson-Delmotte, H.-O. Pörtner, D.C. Roberts, P. Zhai, R. Slade, S. Connors, R. van Diemen, M. Ferrat, E. Haughey, S. Luz, S. Neogi, M. Pathak, J. Petzold, J. Portugal Pereira, P. Vyas, E. Huntley, K. Kissick, M. Belkacemi, and J. Malley (eds.)]. Cambridge University Press, Cambridge, UK and New York, NY, USA, pp. 249–343.
Mitchell, A.L., A. Rosenqvist, and B. Mora, 2017: Current remote sensing approaches to monitoring forest degradation in support of countries measurement, reporting and verification (MRV) systems for REDD+. Carbon Balance Manag. , 12(1) , 9, doi:10.1186/s13021-017-0078-9.
Moffette, F. and H.K. Gibbs, 2021: Agricultural Displacement and Deforestation Leakage in the Brazilian Legal Amazon. Land Econ. , 97(1) , 155–179, doi:10.3368/wple.97.1.040219-0045R.
Mohebalian, P.M. and F.X. Aguilar, 2016: Additionality and design of forest conservation programs: Insights from Ecuador’s Socio Bosque Program. For. Policy Econ. , 71, 103–114, doi:10.1016/j.forpol.2015.08.002.
Mondelaers, K., J. Aertsens, and G. Van Huylenbroeck, 2009: A meta‐analysis of the differences in environmental impacts between organic and conventional farming. Br. Food J. , 111(10) , 1098–1119, doi:10.1108/00070700910992925.
Moreira, F. et al., 2020a: Wildfire management in Mediterranean-type regions: paradigm change needed. Environ. Res. Lett. , 15(1) , 011001, doi:10.1088/1748-9326/ab541e.
Moreira, M.M.R. et al., 2020b: Socio-environmental and land-use impacts of double-cropped maize ethanol in Brazil. Nat. Sustain. , 3(3) , 209–216, doi:10.1038/s41893-019-0456-2.
Moser, S.C., S. Jeffress Williams, and D.F. Boesch, 2012: Wicked Challenges at Land’s End: Managing Coastal Vulnerability Under Climate Change. Annu. Rev. Environ. Resour. , 37(1) , 51–78, doi:10.1146/annurev-environ-021611-135158.
Mosnier, C. et al., 2019: Greenhouse gas abatement strategies and costs in French dairy production. J. Clean. Prod. , 236, 117589, doi:10.1016/j.jclepro.2019.07.064.
Mostafa, E., A. Selders, R.S. Gates, and W. Buescher, 2020: Pig barns ammonia and greenhouse gas emission mitigation by slurry aeration and acid scrubber. Environ. Sci. Pollut. Res. , 27(9) , 9444–9453, doi:10.1007/s11356-020-07613-x.
Mottet, A. et al., 2017a: Livestock: On our plates or eating at our table? A new analysis of the feed/food debate. Glob. Food Sec. , 14, 1–8, doi:10.1016/j.gfs.2017.01.001.
Mottet, A. et al., 2017b: Climate change mitigation and productivity gains in livestock supply chains: insights from regional case studies. Reg. Environ. Change, 17(1) , 129–141, doi:10.1007/s10113-016-0986-3.
Mouratiadou, I. et al., 2020: Sustainable intensification of crop residue exploitation for bioenergy: Opportunities and challenges. GCB Bioenergy, 12(1) , 71–89, doi:10.1111/gcbb.12649.
Muchane, M.N. et al., 2020: Agroforestry boosts soil health in the humid and sub-humid tropics: A meta-analysis. Agric. Ecosyst. Environ. , 295, 106899, doi:10.1016/j.agee.2020.106899.
Mueller, N.D. et al., 2012: Closing yield gaps through nutrient and water management. Nature, 490(7419) , 254–257, doi:10.1038/nature11420.
Mueller, N.D. et al., 2016: Cooling of US Midwest summer temperature extremes from cropland intensification. Nat. Clim. Change, 6 (3) , 317–322, doi:10.1038/nclimate2825.
Muller, A. et al., 2017: Strategies for feeding the world more sustainably with organic agriculture. Nat. Commun. , 8(1) , 1290, doi:10.1038/s41467-017-01410-w.
Munkholm, L.J. et al., 2020: Vidensyntese Om Conservation Agriculture. Aarhus Universitet, Tjele, Denmark, 134 pp.
Murdiyarso, D., E. Lilleskov, and R. Kolka, 2019: Tropical peatlands under siege: the need for evidence-based policies and strategies. Mitig. Adapt. Strateg. Glob. Change, 24(4) , 493–505, doi:10.1007/s11027-019-9844-1.
Muri, H., 2018: The role of large—scale BECCS in the pursuit of the 1.5°C target: an Earth system model perspective. Environ. Res. Lett. , 13(4) , 044010, doi:10.1088/1748-9326/aab324.
Murray, B.C., B.A. McCarl, and H.-C. Lee, 2004: Estimating Leakage from Forest Carbon Sequestration Programs. Land Econ. , 80(1) , 109–124, doi:10.2307/3147147.
Murray, B.C., B. Sohngen, and M.T. Ross, 2007: Economic consequences of consideration of permanence, leakage and additionality for soil carbon sequestration projects. Clim. Change, 80(1–2) , 127–143, doi:10.1007/s10584-006-9169-4.
Nabuurs, G.J., O. Masera, K. Andrasko, P. Benitez-Ponce, R. Boer, M. Dutschke, E. Elsiddig, J. Ford-Robertson, P. Frumhoff, T. Karjalainen, O. Krankina, W.A. Kurz, M. Matsumoto, W. Oyhantcabal, N.H. Ravindranath, M.J. Sanz Sanchez, X. Zhang, 2007: Forestry. In Climate Change 2007: Mitigation. Contribution of Working Group III to the Fourth Assessment Report of the Intergovernmental Panel on Climate Change[Metz, B., O.R. Davidson, P.R. Bosch, R. Dave, L.A. Meyer (eds.)]. Cambridge University Press, Cambridge, UK and New York, NY, USA, pp. 541–584.
Nabuurs, G.-J. et al., 2013: First signs of carbon sink saturation in European forest biomass. Nat. Clim. Change, 3(9) , 792–796, doi:10.1038/nclimate1853.
Nabuurs, G.-J. et al., 2017: By 2050 the Mitigation Effects of EU Forests Could Nearly Double through Climate Smart Forestry. Forests, 8(12) , 484, doi:10.3390/f8120484.
Nabuurs, G.-J. et al., 2019: Next-generation information to support a sustainable course for European forests. Nat. Sustain. , 2(9) , 815–818, doi:10.1038/s41893-019-0374-3.
Næss, J.S., O. Cavalett, and F. Cherubini, 2021: The land–energy–water nexus of global bioenergy potentials from abandoned cropland. Nat. Sustain. , 4(6) , 525–536, doi:10.1038/s41893-020-00680-5.
Nahuelhual, L. et al., 2007: Valuing Ecosystem Services of Chilean Temperate Rainforests. Environ. Dev. Sustain. , 9(4) , 481–499, doi:10.1007/s10668-006-9033-8.
Namatsheve, T., R. Cardinael, M. Corbeels, and R. Chikowo, 2020: Productivity and biological N2-fixation in cereal-cowpea intercropping systems in sub-Saharan Africa. A review. Agron. Sustain. Dev. , 40(4) , 30, doi:10.1007/s13593-020-00629-0.
Nasser, F., V.A. Maguire-Rajpaul, W.K. Dumenu, and G.Y. Wong, 2020: Climate-Smart Cocoa in Ghana: How Ecological Modernisation Discourse Risks Side-Lining Cocoa Smallholders. Front. Sustain. Food Syst. , 4, 1–17. Doi:10.3389/fsufs.2020.00073.
Naudts, K. et al., 2016: Europe’s forest management did not mitigate climate warming. Science, 351(6273) , 597–600, doi:10.1126/science.aad7270.
Ndambi, O.A., D.E. Pelster, J.O. Owino, F. de Buisonjé, and T. Vellinga, 2019: Manure Management Practices and Policies in Sub-Saharan Africa: Implications on Manure Quality as a Fertilizer. Front. Sustain. Food Syst. , 3, doi:10.3389/fsufs.2019.00029.
Ndung’u, P.W. et al., 2019: Improved region-specific emission factors for enteric methane emissions from cattle in smallholder mixed crop: livestock systems of Nandi County, Kenya. Anim. Prod. Sci. , 59(6) , 1136, doi:10.1071/AN17809.
Nemecek, T., D. Dubois, O. Huguenin-Elie, and G. Gaillard, 2011: Life cycle assessment of Swiss farming systems: I. Integrated and organic farming. Agric. Syst. , 104(3) , 217–232, doi:10.1016/j.agsy.2010.10.002.
Neogi, S., 2020a: Short Communication Ecosystem Sustainability for Coastal Wetlands. COJRR, 2, 16–17, doi.org/10.31031/COJRR.2020.02.000546
Neogi, S., 2020b: Understanding soil carbon processes in the Indian Sundarbans to abate climate change. Int. J. Sci. Eng. Res. , 11(04) , 1193–1195, doi:10.14299/ijser.2020.04.03.
Nepstad, D. et al., 2014: Slowing Amazon deforestation through public policy and interventions in beef and soy supply chains. Science, 344(6188) , 1118–1123, doi:10.1126/science.1248525.
Nepstad, D.C., C.M. Stickler, B.S.- Filho, and F. Merry, 2008: Interactions among Amazon land use, forests and climate: prospects for a near-term forest tipping point. Philos. Trans. R. Soc. B Biol. Sci. , 363(1498) , 1737–1746, doi:10.1098/rstb.2007.0036.
New York Declaration on Forests, 2021: Progress Report. Update on Goal 2. Prog. Report. Updat. Goal 2. , https://forestdeclaration.org/goals/goal-2 (Accessed May 14, 2021).
Niles, M.T. and S. Wiltshire, 2019: Tradeoffs in US dairy manure greenhouse gas emissions, productivity, climate, and manure management strategies. Environ. Res. Commun. , 1(7) , 075003, doi:10.1088/2515-7620/ab2dec.
Ninan, K. N. and M. Inoue, 2017: Building a Climate Resilient Economy and Society-Challenges and Opportunities. Edward Elgar Publishing, Cheltenham, UK and Northampton, USA, 336 pp.
Ninan, K.N. and M. Inoue, 2013: Valuing forest ecosystem services: What we know and what we don’t. Ecol. Econ. , 93, 137–149, doi:10.1016/j.ecolecon.2013.05.005.
Ninan, K.N. and A. Kontoleon, 2016: Valuing forest ecosystem services and disservices – Case study of a protected area in India. Ecosyst. Serv. , 20, 1–14, doi:10.1016/j.ecoser.2016.05.001.
Niwa, Y. et al., 2017: A 4D-Var inversion system based on the icosahedral grid model (NICAM-TM 4D-Var v1.0) – Part 2: Optimization scheme and identical twin experiment of atmospheric CO2 inversion. Geosci. Model Dev. , 10(6) , 2201–2219, doi:10.5194/gmd-10-2201-2017.
Novita, N. et al., 2021: Carbon Stocks from Peat Swamp Forest and Oil Palm Plantation in Central Kalimantan, Indonesia. In: Climate Change Research, Policy and Actions in Indonesia[Djalante, R., J. Jupesta, and E. Aldrian (eds.)]. Springer, Cham, Switzerland, pp. 203–227.
Nowicki, R., J. Thomson, D. Burkholder, J. Fourqurean, and M. Heithaus, 2017: Predicting seagrass recovery times and their implications following an extreme climate event. Mar. Ecol. Prog. Ser. , 567, 79–93, doi:10.3354/meps12029.
Nugent, K.A. et al., 2019: Prompt active restoration of peatlands substantially reduces climate impact. Environ. Res. Lett. , 14(12) , 124030, doi:10.1088/1748-9326/ab56e6.
Nunes, A.N., L. Lourenço, and A.C.C. Meira, 2016: Exploring spatial patterns and drivers of forest fires in Portugal (1980–2014). Sci. Total Environ. , 573, 1190–1202, doi:10.1016/j.scitotenv.2016.03.121.
NYDF Assessment Partners, 2019: Protecting and Restoring Forests: A Story of Large Commitments yet Limited Progress. New York Declaration on Forests Five-Year Assessment Report . Climate Focus, Amsterdam, The Netherlands, 96 pp.
O’Halloran, T.L. et al., 2012: Radiative forcing of natural forest disturbances. Glob. Change Biol. , 18(2) , 555–565, doi:10.1111/j.1365-2486.2011.02577.x.
Obersteiner, M. et al., 2016: Assessing the land resource–food price nexus of the Sustainable Development Goals. Sci. Adv. , 2(9) , e1501499, doi:10.1126/sciadv.1501499.
OECD, 2012: OECD environmental outlook to 2050: the consequences of inaction. Int. J. Sustain. High. Educ. , 13(3) , ijshe.2012.24913caa.010, doi:10.1108/ijshe.2012.24913caa.010.
OECD, 2021a: Effective Carbon Rates 2021. OECD Publishing, Paris, France.
OECD, 2021b: Making Better Policies for Food Systems. OECD Publishing, Paris, France, 280 pp.
OECD/FAO, 2019: OECD-FAO Agricultural Outlook 2019-2028, OECD Publishing, Paris/Food and Agriculture Organization of the United Nations, Rome. https://doi.org/10.4060/CA4076EN.
Ogle, S.M. et al., 2019: Climate and Soil Characteristics Determine Where No-Till Management Can Store Carbon in Soils and Mitigate Greenhouse Gas Emissions. Sci. Rep. , 9(1) , 11665, doi:10.1038/s41598-019-47861-7.
Ojanen, P. and K. Minkkinen, 2020: Rewetting Offers Rapid Climate Benefits for Tropical and Agricultural Peatlands But Not for Forestry‐Drained Peatlands. Global Biogeochem. Cycles, 34(7) , doi:10.1029/2019GB006503.
Olsson, L., H. Barbosa, S. Bhadwal, A. Cowie, K. Delusca, D. Flores-Renteria, K. Hermans, E. Jobbagy, W. Kurz, D. Li, D.J. Sonwa, L. Stringer, 2019: Land Degradation. In: Climate Change and Land: an IPCC special report on climate change, desertification, land degradation, sustainable land management, food security, and greenhouse gas fluxes in terrestrial ecosystems[Shukla, P.R., J. Skea, E. Calvo Buendia, V. Masson-Delmotte, H.-O. Pörtner, D.C. Roberts, P. Zhai, R. Slade, S. Connors, R. van Diemen, M. Ferrat, E. Haughey, S. Luz, S. Neogi, M. Pathak, J. Petzold, J. Portugal Pereira, P. Vyas, E. Huntley, K. Kissick, M. Belkacemi, and J. Malley, (eds.)]. Cambridge University Press, Cambridge, UK and New York, NY, USA, pp. 345–436.
Oliver, C.D., N.T. Nassar, B.R. Lippke, and J.B. McCarter, 2014: Carbon, Fossil Fuel, and Biodiversity Mitigation With Wood and Forests. J. Sustain. For. , 33(3) , 248–275, doi:10.1080/10549811.2013.839386.
Omondi, M.O. et al., 2016: Quantification of biochar effects on soil hydrological properties using meta-analysis of literature data. Geoderma, 274, 28–34, doi:10.1016/j.geoderma.2016.03.029.
Oo, A.Z. et al., 2018: Methane and nitrous oxide emissions from conventional and modified rice cultivation systems in South India. Agric. Ecosyst. Environ. , 252, 148–158, doi:10.1016/j.agee.2017.10.014.
Oreska, M.P.J. et al., 2020: The greenhouse gas offset potential from seagrass restoration. Sci. Rep. , 10(1) , 7325, doi:10.1038/s41598-020-64094-1.
Ortega, L.A. and D. Martínez-Barón, 2018: Territorio Sostenible Adaptado al Clima – Cauca: Eje articulador del cambio climático con los instrumentos de gestión y política del departamento del Cauca. 23 (1) , 1–4.
Orth, R.J. et al., 2020: Restoration of seagrass habitat leads to rapid recovery of coastal ecosystem services. Sci. Adv. , 6 eabc6434, doi:10.1126/sciadv.abc6434.
Ouden, J. Den et al., 2020: Kan uitstel van houtoogst bijdragen aan CO2-mitigatie?Wageningen University and Research, Wageningen, The Netherlands.
Ouyang, X. and S.Y. Lee, 2020: Improved estimates on global carbon stock and carbon pools in tidal wetlands. Nat. Commun. , 11(1) , 317, doi:10.1038/s41467-019-14120-2.
Ouyang, Z. et al., 2016: Improvements in ecosystem services from investments in natural capital. Science, 352(6292) , 1455–1459, doi:10.1126/science.aaf2295.
Page, S.E. and A.J. Baird, 2016: Peatlands and Global Change: Response and Resilience. Annu. Rev. Environ. Resour. , 41(1) , 35–57, doi:10.1146/annurev-environ-110615-085520.
Page, S.E., J.O. Rieley, and C.J. Banks, 2011: Global and regional importance of the tropical peatland carbon pool. Glob. Change Biol. , 17(2) , 798–818, doi:10.1111/j.1365-2486.2010.02279.x.
Palahí, M. et al., 2021: Concerns about reported harvests in European forests. Nature, 592(7856) , E15–E17, doi:10.1038/s41586-021-03292-x.
Pandey, A. et al., 2014: Organic matter and water management strategies to reduce methane and nitrous oxide emissions from rice paddies in Vietnam. Agric. Ecosyst. Environ. , 196, 137–146, doi:10.1016/j.agee.2014.06.010.
Pape, D. et al., 2016. Managing Agricultural Land for Greenhouse Gas Mitigation within the United States. Report prepared by ICF International under USDA Contract No. AG-3144-D-14-0292. July 2016.
Papworth, S. et al., 2017: The impact of gold mining and agricultural concessions on the tree cover and local communities in northern Myanmar. Sci. Rep. , 7(1) , 46594, doi:10.1038/srep46594.
Parfitt, J., M. Barthel, and S. Macnaughton, 2010: Food waste within food supply chains: quantification and potential for change to 2050. Philos. Trans. R. Soc. B Biol. Sci. , 365(1554) , 3065–3081, doi:10.1098/rstb.2010.0126.
Parodi, A. et al., 2018: The potential of future foods for sustainable and healthy diets. Nat. Sustain. , 1(12) , 782–789, doi:10.1038/s41893-018-0189-7.
Patra, A., T. Park, M. Kim, and Z. Yu, 2017: Rumen methanogens and mitigation of methane emission by anti-methanogenic compounds and substances. J. Anim. Sci. Biotechnol. , 8(1) , 13, doi:10.1186/s40104-017-0145-9.
Patra, A.K., 2016: Recent Advances in Measurement and Dietary Mitigation of Enteric Methane Emissions in Ruminants. Front. Vet. Sci. , 3, doi:10.3389/fvets.2016.00039.
Patra, P.K. et al., 2018: Improved Chemical Tracer Simulation by MIROC4.0-based Atmospheric Chemistry-Transport Model (MIROC4-ACTM). SOLA, 14, 91–96, doi:10.2151/sola.2018-016.
Pattanayak, S.K., D.E. Mercer, E. Sills, and J.C. Yang, 2003: Taking stock of agroforestry adoption studies. Agrofor. Syst. , 57, 173–186, doi.org/10.1023/A:1024809108210.
Paustian, K. et al., 2016: Climate-smart soils. Nature, 532 (7597) , 49–57, doi:10.1038/nature17174.
Paustian, K., E. Larson, J. Kent, E. Marx, and A. Swan, 2019: Soil C Sequestration as a Biological Negative Emission Strategy. Front. Clim. , 1, doi:10.3389/fclim.2019.00008.
Pearson, T.R.H., S. Brown, and F.M. Casarim, 2014: Carbon emissions from tropical forest degradation caused by logging. Environ. Res. Lett. , 9(3) , 034017, doi:10.1088/1748-9326/9/3/034017.
Pearson, T.R.H., S. Brown, L. Murray, and G. Sidman, 2017: Greenhouse gas emissions from tropical forest degradation: an underestimated source. Carbon Balance Manag. , 12(1) , 3, doi:10.1186/s13021-017-0072-2.
Pellerin, S. et al., 2017: Identifying cost-competitive greenhouse gas mitigation potential of French agriculture. Environ. Sci. Policy, 77, 130–139, doi:10.1016/j.envsci.2017.08.003.
Pendleton, L. et al., 2012: Estimating global “blue carbon” emissions from conversion and degradation of vegetated coastal ecosystems. PLoS One, 7(9) , e43542–e43542, doi:10.1371/journal.pone.0043542.
Pendrill, F., U.M. Persson, J. Godar, and T. Kastner, 2019a: Deforestation displaced: trade in forest-risk commodities and the prospects for a global forest transition. Environ. Res. Lett. , 14(5) , 055003, doi:10.1088/1748-9326/ab0d41.
Pendrill, F. et al., 2019b: Agricultural and forestry trade drives large share of tropical deforestation emissions. Glob. Environ. Change, 56 (December 2018), 1–10, doi:10.1016/j.gloenvcha.2019.03.002.
Perugini, L. et al., 2017: Biophysical effects on temperature and precipitation due to land cover change. Environ. Res. Lett. , 12(5) , 053002, doi:10.1088/1748-9326/aa6b3f.
Peters, M. et al., 2013: Challenges and opportunities for improving eco-efficiency of tropical forage-based systems to mitigate greenhouse gas emissions. Trop. Grasslands - Forrajes Trop. , 1(2) , 156, doi:10.17138/TGFT(1)156-167.
Petersen, B. and S. Snapp, 2015: What is sustainable intensification? Views from experts. Land use policy, 46, 1–10, doi:10.1016/j.landusepol.2015.02.002.
Peterson, C.A., L. Deiss, and A.C.M. Gaudin, 2020: Commercial integrated crop-livestock systems achieve comparable crop yields to specialized production systems: A meta-analysis. PLoS One, 15(5) , e0231840, doi:10.1371/journal.pone.0231840.
Pfaff, A. and J. Robalino, 2017: Spillovers from Conservation Programs. Annu. Rev. Resour. Econ. , 9(1) , 299–315, doi:10.1146/annurev-resource-100516-053543.
Pfaff, A. et al., 2007: Road Investments, Spatial Spillovers, and Deforestation in the Brazilian Amazon. J. Reg. Sci. , 47(1) , 109–123, doi:10.1111/j.1467-9787.2007.00502.x.
Phalan, B., 2018: What Have We Learned from the Land Sparing-sharing Model?Sustainability, 10(6) , 1760, doi:10.3390/su10061760.
Phelps, J., E.L. Webb, and A. Agrawal, 2010: Does REDD+ Threaten to Recentralize Forest Governance?Science, 328(5976) , 312–313, doi:10.1126/science.1187774.
Pickering, N.K. et al., 2015: Animal board invited review: genetic possibilities to reduce enteric methane emissions from ruminants. Animal, 9(9) , 1431–1440, doi:10.1017/S1751731115000968.
Pielke, R.A. et al., 2011: Land use/land cover changes and climate: modeling analysis and observational evidence. WIREs Clim. Change, 2(6) , 828–850, doi:10.1002/wcc.144.
Pilli, R., G. Fiorese, and G. Grassi, 2015: EU mitigation potential of harvested wood products. Carbon Balance Manag. , 10(1) , 6, doi:10.1186/s13021-015-0016-7.
Piva, J.T. et al., 2014: Soil gaseous N2O and CH4 emissions and carbon pool due to integrated crop-livestock in a subtropical Ferralsol. Agric. Ecosyst. Environ. , 190, 87–93, doi:10.1016/j.agee.2013.09.008.
Podolyan, A., H.J. Di, and K.C. Cameron, 2020: Effect of plantain on nitrous oxide emissions and soil nitrification rate in pasture soil under a simulated urine patch in Canterbury, New Zealand. J. Soils Sediments, 20(3) , 1468–1479, doi:10.1007/s11368-019-02505-1.
Poeplau, C. et al., 2011: Temporal dynamics of soil organic carbon after land-use change in the temperate zone - carbon response functions as a model approach. Glob. Change Biol. , 17(7) , 2415–2427, doi:10.1111/j.1365-2486.2011.02408.x.
Pongratz, J., C.H. Reick, R.A. Houghton, and J.I. House, 2014: Terminology as a key uncertainty in net land use and land cover change carbon flux estimates. Earth Syst. Dyn. , 5(1) , 177–195, doi:10.5194/esd-5-177-2014.
Pongratz, J. et al., 2018: Models meet data: Challenges and opportunities in implementing land management in Earth system models. Glob. Change Biol. , 24(4) , 1470–1487, doi:10.1111/gcb.13988.
Poore, J. and T. Nemecek, 2018: Reducing food’s environmental impacts through producers and consumers. Science, 360(6392) , 987–992, doi:10.1126/science.aaq0216.
Popp, A. et al., 2014: Land-use transition for bioenergy and climate stabilization: model comparison of drivers, impacts and interactions with other land use based mitigation options. Clim. Change, 123(3–4) , 495–509, doi:10.1007/s10584-013-0926-x.
Popp, A. et al., 2017: Land-use futures in the shared socio-economic pathways. Glob. Environ. Change, 42, 331–345, doi:10.1016/j.gloenvcha.2016.10.002.
Post, M.J. et al., 2020: Scientific, sustainability and regulatory challenges of cultured meat. Nat. Food, 1(7) , 403–415, doi:10.1038/s43016-020-0112-z.
Potapov, P. et al., 2017: The last frontiers of wilderness: Tracking loss of intact forest landscapes from 2000 to 2013. Sci. Adv. , 3(1) , doi:10.1126/sciadv.1600821.
Powell, T.W.R. and T.M. Lenton, 2012: Future carbon dioxide removal via biomass energy constrained by agricultural efficiency and dietary trends. Energy Environ. Sci. , 5(8) , 8116, doi:10.1039/c2ee21592f.
Powlson, D.S. et al., 2014: Limited potential of no-till agriculture for climate change mitigation. Nat. Clim. Change, 4(8) , 678–683, doi:10.1038/nclimate2292.
Powlson, D.S., C.M. Stirling, C. Thierfelder, R.P. White, and M.L. Jat, 2016: Does conservation agriculture deliver climate change mitigation through soil carbon sequestration in tropical agro-ecosystems?Agric. Ecosyst. Environ. , 220, 164–174, doi:10.1016/j.agee.2016.01.005.
Pradhan, B.B., R.M. Shrestha, N.T. Hoa, and Y. Matsuoka, 2017: Carbon prices and greenhouse gases abatement from agriculture, forestry and land use in Nepal. Glob. Environ. Change, 43, 26–36, doi:10.1016/j.gloenvcha.2017.01.005.
Pradhan, B.B., A. Chaichaloempreecha, and B. Limmeechokchai, 2019: GHG mitigation in Agriculture, Forestry and Other Land Use (AFOLU) sector in Thailand. Carbon Balance Manag. , 14(1) , 3, doi:10.1186/s13021-019-0119-7.
Pratt, K. and D. Moran, 2010: Evaluating the cost-effectiveness of global biochar mitigation potential. Biomass and Bioenergy, 34(8) , 1149–1158, doi:10.1016/j.biombioe.2010.03.004.
Pretty, J., 2018: Intensification for redesigned and sustainable agricultural systems. Science, 362(6417) , doi:10.1126/science.aav0294.
Pretty, J. et al., 2018: Global assessment of agricultural system redesign for sustainable intensification. Nat. Sustain. , 1(8) , 441–446, doi:10.1038/s41893-018-0114-0.
Prosperi, P. et al., 2020: New estimates of greenhouse gas emissions from biomass burning and peat fires using MODIS Collection 6 burned areas. Clim. Change, 161(3) , 415–432, doi:10.1007/s10584-020-02654-0.
Prudhomme, R. et al., 2020: Combining mitigation strategies to increase co-benefits for biodiversity and food security. Environ. Res. Lett. , 15(11) , 114005, doi:10.1088/1748-9326/abb10a.
Puettmann, M., K. Sahoo, K. Wilson, and E. Oneil, 2020: Life cycle assessment of biochar produced from forest residues using portable systems. J. Clean. Prod. , 250, 119564, doi:10.1016/j.jclepro.2019.119564.
Pugh, T.A.M. et al., 2015: Simulated carbon emissions from land-use change are substantially enhanced by accounting for agricultural management. Environ. Res. Lett. , 10(12) , 124008, doi:10.1088/1748-9326/10/12/124008.
Pugh, T.A.M. et al., 2019: Role of forest regrowth in global carbon sink dynamics. Proc. Natl. Acad. Sci. , 116(10) , 4382–4387, doi:10.1073/pnas.1810512116.
Qin, Z. et al., 2021: Delayed impact of natural climate solutions. Glob. Change Biol. , 27(2) , 215–217, doi:10.1111/gcb.15413.
Quynh, V.D. and O. Sander, 2015: Applying and scaling up Alternate Wetting and Drying for paddy rice in Vietnam. International Rice Research Institute and the CGIAR Program on Climate Change, Agriculture and Food Security,.
Rahman, S.A. et al., 2019: Integrating bioenergy and food production on degraded landscapes in Indonesia for improved socioeconomic and environmental outcomes. Food Energy Secur. , 8(3) , e00165, doi:10.1002/fes3.165.
Ramachandran Nair, P.K., V.D. Nair, B. Mohan Kumar, and J.M. Showalter, 2010: Carbon Sequestration in Agroforestry Systems. In: Advances in Agronomy[Sparks, D.L. (ed.)]. Academic Press, Elsevier, London, UK, pp. 237–307. https://doi.org/10.1016/S0065-2113(10)08005-3 .
Ranjan, R., 2019: Assessing the impact of mining on deforestation in India. Resour. Policy, 60, 23–35, doi:10.1016/j.resourpol.2018.11.022.
Ravikumar, A., A.M. Larson, A.E. Duchelle, R. Myers, and J. Gonzales Tovar, 2015: Multilevel governance challenges in transitioning towards a national approach for REDD+: evidence from 23 subnational REDD+ initiatives. Int. J. Commons, 9(2) , 909, doi:10.18352/ijc.593.
Ravindranath, N.H., R.K. Chaturvedi, and P. Kumar, 2017: Paris Agreement; Research, Monitoring and Reporting Requirements for India. Curr. Sci. , 112(05) , 916, doi:10.18520/cs/v112/i05/916-922.
Reddy, V.R., T. Chiranjeevi, and G. Syme, 2020: Inclusive sustainable intensification of agriculture in West Bengal, India: policy and institutional approaches. Int. J. Agric. Sustain. , 18 (1) , 70–83, doi:10.1080/14735903.2019.1698489.
Reiche, J. et al., 2021: Forest disturbance alerts for the Congo Basin using Sentinel-1. Environ. Res. Lett. , 16(2) , 024005, doi:10.1088/1748-9326/abd0a8.
Reisinger, A. et al., 2021: How necessary and feasible are reductions of methane emissions from livestock to support stringent temperature goals?Philos. Trans. R. Soc. A Math. Phys. Eng. Sci. , 379(2210) , 20200452, doi:10.1098/rsta.2020.0452.
Remy, C.C. et al., 2017: Different regional climatic drivers of Holocene large wildfires in boreal forests of northeastern America. Environ. Res. Lett. , 12(3) , 035005, doi:10.1088/1748-9326/aa5aff.
Resosudarmo, I.A.P. et al., 2019: Indonesia’s land reform: Implications for local livelihoods and climate change. For. Policy Econ. , 108, 101903, doi:10.1016/j.forpol.2019.04.007.
RethinkX, 2019: Rethinking Food and Agriculture. RethinkX, 76 pp. https://www.rethinkx.com/food-and-agriculture (Accessed June 12, 2021).
Reyers, B. and E.R. Selig, 2020: Global targets that reveal the social–ecological interdependencies of sustainable development. Nat. Ecol. Evol. , 4(8) , 1011–1019, doi:10.1038/s41559-020-1230-6.
Riahi, K. et al., 2017: The Shared Socioeconomic Pathways and their energy, land use, and greenhouse gas emissions implications: An overview. Glob. Environ. Change, 42, 153–168, doi:10.1016/j.gloenvcha.2016.05.009.
Ricart, A.M. et al., 2020: High variability of Blue Carbon storage in seagrass meadows at the estuary scale. Sci. Rep. , 10(1) , 5865, doi:10.1038/s41598-020-62639-y.
Rice, J., et al., 2018: Summary for Policy Makers of the Regional Assessment Report on Biodiversity and Ecosystem Services for the Americas. Intergovernmental Science Policy Platform on Biodiversity and Ecosystem Services (IPBES), Bonn, Germany, 341–356 pp.
Richards, D.R. and D.A. Friess, 2016: Rates and drivers of mangrove deforestation in Southeast Asia, 2000-2012. Proc. Natl. Acad. Sci., 13(2) , 344–349, doi:10.1073/pnas.1510272113.
Richards, P. and L. VanWey, 2015: Where Deforestation Leads to Urbanization: How Resource Extraction Is Leading to Urban Growth in the Brazilian Amazon. Ann. Assoc. Am. Geogr. , 105(4) , 806–823, doi:10.1080/00045608.2015.1052337.
Ricketts, T.H. et al., 2010: Indigenous Lands, Protected Areas, and Slowing Climate Change. PLoS Biol. , 8(3) , e1000331, doi:10.1371/journal.pbio.1000331.
Riggs, R. et al., 2018: Governance Challenges in an Eastern Indonesian Forest Landscape. Sustainability, 10(1) , 169, doi:10.3390/su10010169.
Rights and Resources Initiative, 2018: At a Crossroads. Consequiental trends in recognition of community-based forest tenure from 2002-2017. Rights and Resources Initiative, Washington, DC, USA, 60 pp.
Rigueiro-Rodróguez, A., J. McAdam, and M.R. Mosquera-Losada, 2009: Agroforestry in Europe: Current Status and Future Prospects. Springer, Dordrecht, The Netherlands. 450p.
Rivera-Monroy, V.H., E. Kristensen, S.Y. Lee, and R.R. Twilley, 2017: Mangrove Ecosystems: A Global Biogeographic Perspective. Springer International Publishing, Cham, Switzerland. 415p.
Robalino, J. and A. Pfaff, 2013: Ecopayments and Deforestation in Costa Rica: A Nationwide Analysis of PSA’s Initial Years. Land Econ. , 89(3) , 432–448, doi:10.3368/le.89.3.432.
Robalino, J., C. Sandoval, D.N. Barton, A. Chacon, and A. Pfaff, 2015: Evaluating Interactions of Forest Conservation Policies on Avoided Deforestation. PLoS One, 10(4) , e0124910, doi:10.1371/journal.pone.0124910.
Roberts, K.G., B.A. Gloy, S. Joseph, N.R. Scott, and J. Lehmann, 2010: Life Cycle Assessment of Biochar Systems: Estimating the Energetic, Economic, and Climate Change Potential. Environ. Sci. Technol. , 44(2) , 827–833, doi:10.1021/es902266r.
Robledo-Abad, C., et al., 2017: Bioenergy production and sustainable development: science base for policymaking remains limited. GCB Bioenergy, 9, 541–556, doi:10.1111/gcbb.12338.
Rochedo, P.R.R. et al., 2018: The threat of political bargaining to climate mitigation in Brazil. Nat. Clim. Change, 8(8) , 695–698, doi:10.1038/s41558-018-0213-y.
Rödenbeck, C., S. Houweling, M. Gloor, and M. Heimann, 2003: CO2 flux history 1982–2001 inferred from atmospheric data using a global inversion of atmospheric transport. Atmos. Chem. Phys. , 3(6) , 1919–1964, doi:10.5194/acp-3-1919-2003.
Rödenbeck, C., S. Zaehle, R. Keeling, and M. Heimann, 2018: How does the terrestrial carbon exchange respond to inter-annual climatic variations? A quantification based on atmospheric CO2 data. Biogeosciences, 15(8) , 2481–2498, doi:10.5194/bg-15-2481-2018.
Rodríguez Vásquez, M.J., A. Benoist, J. ‐M. Roda, and M. Fortin, 2021: Estimating Greenhouse Gas Emissions From Peat Combustion in Wildfires on Indonesian Peatlands, and Their Uncertainty. Global Biogeochem. Cycles, 35(2) , doi:10.1029/2019GB006218.
Roe, S. et al., 2019: Contribution of the land sector to a 1.5°C world. Nat. Clim. Change, 9(11) , 817–828, doi:10.1038/s41558-019-0591-9.
Roe, S. et al., 2021: Land‐based measures to mitigate climate change: Potential and feasibility by country. Glob. Change Biol. , 27 (23) , 6025–6058, doi:10.1111/gcb.15873.
Rogelj, J. et al., 2011: Emission pathways consistent with a 2°C global temperature limit. Nat. Clim. Change, 1(8) , 413–418, doi:10.1038/nclimate1258.
Rogelj, J. et al., 2017: Understanding the origin of Paris Agreement emission uncertainties. Nat. Commun. , 8(1) , 15748, doi:10.1038/ncomms15748.
Rogelj, J. et al., 2018a: Scenarios towards limiting global mean temperature increase below 1.5°C. Nat. Clim. Change, 8(4) , 325–332, doi:10.1038/s41558-018-0091-3.
Rogelj, J., D. Shindell, K. Jiang, S. Fifita, P. Forster, V. Ginzburg, C. Handa, H. Kheshgi, S. Kobayashi, E. Kriegler, L. Mundaca, R. Séférian, and M.V. Vilariño, 2018b: Mitigation Pathways Compatible with 1.5°C in the Context of Sustainable Development. In: Global Warming of 1.5°C. An IPCC Special Report on the impacts of global warming of 1.5°C above pre-industrial levels and related global greenhouse gas emission pathways, in the context of strengthening the global response to the threat of climate change, sustainable development, and efforts to eradicate poverty[Masson-Delmotte, V., P. Zhai, H.-O. Pörtner, D. Roberts, J. Skea, P.R. Shukla, A. Pirani, W. Moufouma-Okia, C. Péan, R. Pidcock, S. Connors, J.B.R. Matthews, Y. Chen, X. Zhou, M.I. Gomis, E. Lonnoy, T. Maycock, M. Tignor, and T. Waterfield (eds.)]. Cambridge University Press, Cambridge, UK and New York, NY, USA, pp. 93–174.
Rogissart, L., C. Foucherot, and V. Bellassen, 2019: Food policies and climate: a literature review. I4CE, Institute for Climate Economics, Paris. https://www.i4ce.org/wp-core/wp-content/uploads/2019/03/0306-I4CE2984-PolitiquesAlimentairesEtClimat-Etude24p-VA_V2.pdf (Accessed March 3, 2021).
Rokityanskiy, D. et al., 2007: Geographically explicit global modeling of land-use change, carbon sequestration, and biomass supply. Technol. Forecast. Soc. Change, 74(7) , 1057–1082, doi:10.1016/j.techfore.2006.05.022.
Rolls, W. and P.M. Forster, 2020: Quantifying forest growth uncertainty on carbon payback times in a simple biomass carbon model. Environ. Res. Commun. , 2(4) , 045001, doi:10.1088/2515-7620/ab7ff3.
Romanovskaya, A.A. et al., 2020: Greenhouse gas fluxes and mitigation potential for managed lands in the Russian Federation. Mitig. Adapt. Strateg. Glob. Change, 25(4) , 661–687, doi:10.1007/s11027-019-09885-2.
Roopsind, A., B. Sohngen, and J. Brandt, 2019: Evidence that a national REDD+ program reduces tree cover loss and carbon emissions in a high forest cover, low deforestation country. Proc. Natl. Acad. Sci. , 116(49) , 24492–24499, doi:10.1073/pnas.1904027116.
Roque, B.M., J.K. Salwen, R. Kinley, and E. Kebreab, 2019: Inclusion of Asparagopsis armata in lactating dairy cows’ diet reduces enteric methane emission by over 50 percent. J. Clean. Prod. , 234, 132–138, doi:10.1016/j.jclepro.2019.06.193.
Rosa, I.M.D. et al., 2017: Multiscale scenarios for nature futures. Nat. Ecol. Evol. , 1(10) , 1416–1419, doi:10.1038/s41559-017-0273-9.
Rosa, L., J.A. Reimer, M.S. Went, and P. D’Odorico, 2020: Hydrological limits to carbon capture and storage. Nat. Sustain. , 3(8) , 658–666, doi:10.1038/s41893-020-0532-7.
Rose, S.K. et al., 2020: An overview of the Energy Modeling Forum 33rd study: assessing large-scale global bioenergy deployment for managing climate change. Clim. Change, 163(3) , 1539–1551, doi:10.1007/s10584-020-02945-6.
Rosenstock, T. et al., 2014: Agroforestry with N2-fixing trees: sustainable development’s friend or foe?Curr. Opin. Environ. Sustain. , 6, 15–21, doi:10.1016/j.cosust.2013.09.001.
Rosenstock, T.S. et al., 2019: A Planetary Health Perspective on Agroforestry in Sub-Saharan Africa. One Earth, 1(3) , 330–344, doi:10.1016/j.oneear.2019.10.017.
Rosenzweig, C. et al., 2020: Climate change responses benefit from a global food system approach. Nat. Food, 1(2) , 94–97, doi:10.1038/s43016-020-0031-z.
Rudel, T.K., R. Defries, G.P. Asner, and W.F. Laurance, 2009: Changing drivers of deforestation and new opportunities for conservation. Conserv. Biol. , 23:1396-1405 , doi:10.1111/j.1523-1739.2009.01332.x.
Ruffault, J. et al., 2020: Increased likelihood of heat-induced large wildfires in the Mediterranean Basin. Sci. Rep. , 10(1) , 13790, doi:10.1038/s41598-020-70069-z.
Rulli, M.C., D. Bellomi, A. Cazzoli, G. De Carolis, and P. D’Odorico, 2016: The water-land-food nexus of first-generation biofuels. Sci. Rep. , 6(1) , 22521, doi:10.1038/srep22521.
Ruseva, T. et al., 2017: Additionality and permanence standards in California’s Forest Offset Protocol: A review of project and program level implications. J. Environ. Manage. , 198, 277–288, doi:10.1016/j.jenvman.2017.04.082.
Russell-Smith, J. et al., 2017: Can savanna burning projects deliver measurable greenhouse emissions reductions and sustainable livelihood opportunities in fire-prone settings?Clim. Change, 140(1) , 47–61, doi:10.1007/s10584-013-0910-5.
Rust, N.A. et al., 2020: How to transition to reduced-meat diets that benefit people and the planet. Sci. Total Environ. , 718, 137208, doi:10.1016/j.scitotenv.2020.137208.
Ryals, R., M.D. Hartman, W.J. Parton, M.S. DeLonge, and W.L. Silver, 2015: Long-term climate change mitigation potential with organic matter management on grasslands. Ecol. Appl. , 25(2) , 531–545, doi:10.1890/13-2126.1.
Saderne, V. et al., 2019: Role of carbonate burial in Blue Carbon budgets. Nat. Commun. , 10(1) , 1106, doi:10.1038/s41467-019-08842-6.
Saj, S., E. Torquebiau, E. Hainzelin, J. Pages, and F. Maraux, 2017: The way forward: An agroecological perspective for Climate-Smart Agriculture. Agric. Ecosyst. Environ. , 250, 20–24, doi:10.1016/j.agee.2017.09.003.
Salmon, G.R. et al., 2018: The greenhouse gas abatement potential of productivity improving measures applied to cattle systems in a developing region. Animal, 12 (4) , 844–852, doi:10.1017/S1751731117002294.
Salzman, J., G. Bennett, N. Carroll, A. Goldstein, and M. Jenkins, 2018: The global status and trends of Payments for Ecosystem Services. Nat. Sustain. , 1(3) , 136–144, doi:10.1038/s41893-018-0033-0.
Sanchez-Monedero, M.A. et al., 2018: Role of biochar as an additive in organic waste composting. Bioresour. Technol. , 247, 1155–1164, doi:10.1016/j.biortech.2017.09.193.
Sander, B.O., M. Samson, and R.J. Buresh, 2014: Methane and nitrous oxide emissions from flooded rice fields as affected by water and straw management between rice crops. Geoderma, 235-236: 355-362, doi:10.1016/j.geoderma.2014.07.020.
Sanderman, J., T. Hengl, and G.J. Fiske, 2017: Soil carbon debt of 12,000 years of human land use. Proc. Natl. Acad. Sci. , 114(36) , 9575–9580, doi:10.1073/pnas.1706103114.
Santos, P.Z.F., R. Crouzeilles, and J.B.B. Sansevero, 2019: Can agroforestry systems enhance biodiversity and ecosystem service provision in agricultural landscapes? A meta-analysis for the Brazilian Atlantic Forest. For. Ecol. Manage. , 433, 140–145, doi:10.1016/j.foreco.2018.10.064.
Sapkota, T.B. et al., 2014: Precision nutrient management in conservation agriculture based wheat production of Northwest India: Profitability, nutrient use efficiency and environmental footprint. F. Crop. Res. , 155, 233–244, doi:10.1016/j.fcr.2013.09.001.
Sapkota, T.B. et al., 2019: Cost-effective opportunities for climate change mitigation in Indian agriculture. Sci. Total Environ. , 655, 1342–1354, doi:10.1016/j.scitotenv.2018.11.225.
Sapkota, T.B. et al., 2021: Crop nutrient management using Nutrient Expert improves yield, increases farmers’ income and reduces greenhouse gas emissions. Sci. Rep. , 11(1) , 1564, doi:10.1038/s41598-020-79883-x.
Sasmito, S.D. et al., 2019: Effect of land‐use and land‐cover change on mangrove blue carbon: A systematic review. Glob. Change Biol. , 25(12) , 4291–4302, doi:10.1111/gcb.14774.
Sathre, R. and J. O’Connor, 2010: Meta-analysis of greenhouse gas displacement factors of wood product substitution. Environ. Sci. Policy, 13(2) , 104–114, doi:10.1016/j.envsci.2009.12.005.
Satija, A. and F.B. Hu, 2018: Plant-based diets and cardiovascular health. Trends Cardiovasc. Med. , 28(7) , 437–441, doi:10.1016/j.tcm.2018.02.004.
SCBD, 2009: Connecting Biodiversity and Climate Change Mitigation and Adaptation. Secretariat of the Convention on Biological Diversity, Montreal, Canada, 127 pp.
SCBD, 2020: Global Biodiversity Outlook 5. Secretariat of the Convention on Biological Diversity, Montreal, Canada, 212 pp.
Schabel, H.G. and M. Pecore, 1997: Silviculture on Wisconsin’s Menominee Indian Reservation—Is it Dauerwald?Proceedings, XI World Forestry Congress, Antalya, Turkey. Vol. D. 97–101.
Scherhaufer, S., G. Moates, H. Hartikainen, K. Waldron, and G. Obersteiner, 2018: Environmental impacts of food waste in Europe. Waste Manag. , 77, 98–113, doi:10.1016/j.wasman.2018.04.038.
Scheutz, C. and A.M. Fredenslund, 2019: Total methane emission rates and losses from 23 biogas plants. Waste Manag. , 97, 38–46, doi:10.1016/j.wasman.2019.07.029.
Schimel, D., B.B. Stephens, and J.B. Fisher, 2015: Effect of increasing CO2 on the terrestrial carbon cycle. Proc. Natl. Acad. Sci. , 112(2) , 436–441, doi:10.1073/pnas.1407302112.
Schmidt, S.M., M. Belisle, and W.B. Frommer, 2020: The evolving landscape around genome editing in agriculture. EMBO Rep. , 21(6) , doi:10.15252/embr.202050680.
Schulze, K., Ž. Malek, and P.H. Verburg, 2020: The Impact of Accounting for Future Wood Production in Global Vertebrate Biodiversity Assessments. Environ. Manage. , 66(3) , 460–475, doi:10.1007/s00267-020-01322-4.
Schurgers, G., A. Ahlström, A. Arneth, T.A.M. Pugh, and B. Smith, 2018: Climate Sensitivity Controls Uncertainty in Future Terrestrial Carbon Sink. Geophys. Res. Lett. , 45(9) , 4329–4336, doi:10.1029/2018GL077528.
Schuur, E.A.G. et al., 2015: Climate change and the permafrost carbon feedback. Nature, 520(7546) , 171–179, doi:10.1038/nature14338.
Schwaab, J. et al., 2020: Increasing the broad-leaved tree fraction in European forests mitigates hot temperature extremes. Sci. Rep. , 10(1) , 14153, doi:10.1038/s41598-020-71055-1.
Scialabba, N.E.-H. and M. Müller-Lindenlauf, 2010: Organic agriculture and climate change. Renew. Agric. Food Syst. , 25(2) , 158–169, doi:10.1017/S1742170510000116.
Scott, A.C., D.M.J.S. Bowman, W.J. Bond, S.J. Pyne, and M.E., 2014: Fire on Earth: An Introduction. Wiley-Blackwell, 88–91 pp.
Searchinger, T.D. et al., 2009: Fixing a Critical Climate Accounting Error. Science, 326(5952) , 527–528, doi:10.1126/science.1178797.
Searchinger, T.D., T. Beringer, and A. Strong, 2017: Does the world have low-carbon bioenergy potential from the dedicated use of land?Energy Policy, 110, 434–446, doi:10.1016/j.enpol.2017.08.016.
Seddon, N. et al., 2020: Nature-based solutions in nationally determined contributions. IUCN, University of Oxford, Gland and Oxford, UK, 62 pp.
Sefeedpari, P. et al., 2019: Technical, environmental and cost-benefit assessment of manure management chain: A case study of large scale dairy farming. J. Clean. Prod. , 233, 857–868, doi:10.1016/j.jclepro.2019.06.146.
Seidl, R. et al., 2017: Forest disturbances under climate change. Nat. Clim. Change, 7(6) , 395–402, doi:10.1038/nclimate3303.
Sendzimir, J., C.P. Reij, and P. Magnuszewski, 2011: Rebuilding Resilience in the Sahel: Regreening in the Maradi and Zinder Regions of Niger. Ecol. Soc. , 16(3) , art1, doi:10.5751/ES-04198-160301.
Senf, C. and R. Seidl, 2021: Mapping the forest disturbance regimes of Europe. Nat. Sustain. , 4(1) , 63–70, doi:10.1038/s41893-020-00609-y.
Seppälä, J. et al., 2019: Effect of increased wood harvesting and utilization on required greenhouse gas displacement factors of wood-based products and fuels. J. Environ. Manage. , 247, 580–587, doi:10.1016/j.jenvman.2019.06.031.
Setyanto, P. et al., 2018: Alternate wetting and drying reduces methane emission from a rice paddy in Central Java, Indonesia without yield loss. Soil Sci. Plant Nutr. , 64 (1) , 23–30, doi:10.1080/00380768.2017.1409600.
Seufert, V. and N. Ramankutty, 2017: Many shades of gray—The context-dependent performance of organic agriculture. Sci. Adv. , 3(3) , doi:10.1126/sciadv.1602638.
Seufert, V., N. Ramankutty, and J.A. Foley, 2012: Comparing the yields of organic and conventional agriculture. Nature, 485(7397) , 229–232, doi:10.1038/nature11069.
Shin, S.-R. et al., 2019: Effects of pig slurry acidification on methane emissions during storage and subsequent biogas production. Water Res. , 152, 234–240, doi:10.1016/j.watres.2019.01.005.
Short, F.T., S. Kosten, P.A. Morgan, S. Malone, and G.E. Moore, 2016: Impacts of climate change on submerged and emergent wetland plants. Aquat. Bot. , 135, 3–17, doi:10.1016/j.aquabot.2016.06.006.
Sibayan, E.B. et al., 2018: Effects of alternate wetting and drying technique on greenhouse gas emissions from irrigated rice paddy in Central Luzon, Philippines. Soil Sci. Plant Nutr. , 64(1) , 39–46, doi:10.1080/00380768.2017.1401906.
Sida, T.S., F. Baudron, H. Kim, and K.E. Giller, 2018: Climate-smart agroforestry: Faidherbia albida trees buffer wheat against climatic extremes in the Central Rift Valley of Ethiopia. Agric. For. Meteorol. , 248, 339–347, doi:10.1016/j.agrformet.2017.10.013.
Sidik, F., M. Fernanda Adame, and C.E. Lovelock, 2019: Carbon sequestration and fluxes of restored mangroves in abandoned aquaculture ponds. J. Indian Ocean Reg. , 15(2) , 177–192, doi:10.1080/19480881.2019.1605659.
Sills, E.O. et al., 2015: Estimating the Impacts of Local Policy Innovation: The Synthetic Control Method Applied to Tropical Deforestation. PLoS One, 10(7) , e0132590, doi:10.1371/journal.pone.0132590.
Silva, J.V. et al., 2021: How sustainable is sustainable intensification? Assessing yield gaps at field and farm level across the globe. Glob. Food Sec. , 30, 100552, doi:10.1016/j.gfs.2021.100552.
Silva Junior, C.H.L. et al., 2021: The Brazilian Amazon deforestation rate in 2020 is the greatest of the decade. Nat. Ecol. Evol. , 5(2) , 144–145, doi:10.1038/s41559-020-01368-x.
Silvani, L. et al., 2019: Can biochar and designer biochar be used to remediate per- and polyfluorinated alkyl substances (PFAS) and lead and antimony contaminated soils?Sci. Total Environ. , 694, 133693, doi:10.1016/j.scitotenv.2019.133693.
Simmonds, M.B. et al., 2021: Impacts of California’s climate-relevant land use policy scenarios on terrestrial carbon emissions (CO2 and CH4) and wildfire risk. Environ. Res. Lett. , 16(1) , 014044, doi:10.1088/1748-9326/abcc8d.
Simon, P.L., C.A.M. de Klein, W. Worth, A.J. Rutherford, and J. Dieckow, 2019: The efficacy of Plantago lanceolata for mitigating nitrous oxide emissions from cattle urine patches. Sci. Total Environ. , 691, 430–441, doi:10.1016/j.scitotenv.2019.07.141.
Simon, P.L. et al., 2020: Does Brachiaria humidicola and dicyandiamide reduce nitrous oxide and ammonia emissions from cattle urine patches in the subtropics?Sci. Total Environ. , 720, 137692, doi:10.1016/j.scitotenv.2020.137692.
Simonet, G., J. Subervie, D. Ezzine‐de‐Blas, M. Cromberg, and A.E. Duchelle, 2019: Effectiveness of a REDD+ Project in Reducing Deforestation in the Brazilian Amazon. Am. J. Agric. Econ. , 101(1) , 211–229, doi:10.1093/ajae/aay028.
Sinare, H. and L.J. Gordon, 2015: Ecosystem services from woody vegetation on agricultural lands in Sudano-Sahelian West Africa. Agric. Ecosyst. Environ. , 200, 186–199, doi:10.1016/j.agee.2014.11.009.
Sinclair, F. and R. Coe, 2019: The Options by Context Approach: A Paradigm Shift in Agronomy. Exp. Agric. , 55(S1) , 1–13, doi:10.1017/S0014479719000139.
Singh, B.P., A.L. Cowie, and R.J. Smernik, 2012: Biochar Carbon Stability in a Clayey Soil As a Function of Feedstock and Pyrolysis Temperature. Environ. Sci. Technol. , 46(21) , 11770–11778, doi:10.1021/es302545b.
Singh, B.P. et al., 2015: In Situ Persistence and Migration of Biochar Carbon and Its Impact on Native Carbon Emission in Contrasting Soils under Managed Temperate Pastures. PLoS One, 10(10) , e0141560, doi:10.1371/journal.pone.0141560.
Six, J. et al., 2004: The potential to mitigate global warming with no-tillage management is only realized when practised in the long term. Glob. Change Biol. , 10(2) , 155–160, doi:10.1111/j.1529-8817.2003.00730.x.
Skinner, C. et al., 2014: Greenhouse gas fluxes from agricultural soils under organic and non-organic management — A global meta-analysis. Sci. Total Environ. , 468–469, 553–563, doi:10.1016/j.scitotenv.2013.08.098.
Sloan, S. et al., 2018: Infrastructure development and contested forest governance threaten the Leuser Ecosystem, Indonesia. Land use policy, 77, 298–309, doi:10.1016/j.landusepol.2018.05.043.
Smith, L.G., G.J.D. Kirk, P.J. Jones, and A.G. Williams, 2019: The greenhouse gas impacts of converting food production in England and Wales to organic methods. Nat. Commun. , 10(1) , 4641, doi:10.1038/s41467-019-12622-7.
Smith, P., 2014: Do grasslands act as a perpetual sink for carbon?Glob. Change Biol. , 20(9) , 2708–2711, doi:10.1111/gcb.12561.
Smith, P., 2016: Soil carbon sequestration and biochar as negative emission technologies. Glob. Change Biol. , 22(3) , 1315–1324, doi:10.1111/gcb.13178.
Smith, P., D. Powlson, M. Glendining, and J. Smith, 1997: Potential for carbon sequestration in European soils: preliminary estimates for five scenarios using results from long-term experiments. Glob. Change Biol. , 3(1) , 67–79, doi:10.1046/j.1365-2486.1997.00055.x.
Smith, P. et al., 2008: Greenhouse gas mitigation in agriculture. Philos. Trans. R. Soc. B Biol. Sci. , 363(1492) , 789–813, doi:10.1098/rstb.2007.2184.
Smith P., M. Bustamante, H. Ahammad, H. Clark, H. Dong, E.A. Elsiddig, H. Haberl, R. Harper, J. House, M. Jafari, O. Masera, C. Mbow, N.H. Ravindranath, C.W. Rice, C. Robledo Abad, A. Romanovskaya, F. Sperling, and F. Tubiello, 2014: Agriculture, Forestry and Other Land Use (AFOLU). In: Climate Change 2014: Mitigation of Climate Change. Contribution of Working Group III to the Fifth Assessment Report of the Intergovernmental Panel on Climate Change[Edenhofer, O., R. Pichs-Madruga, Y. Sokona, E. Farahani, S. Kadner, K. Seyboth, A. Adler, I. Baum, S. Brunner, P. Eickemeier, B. Kriemann, J. Savolainen, S. Schlömer, C. von Stechow, T. Zwickel, and J.C. Minx (eds.)]. Cambridge University Press, Cambridge, UK and New York, NY, USA, pp. 811–922.
Smith, P. et al., 2016: Biophysical and economic limits to negative CO2 emissions. Nat. Clim. Change, 6(1) , 42–50, doi:10.1038/nclimate2870.
Smith, P., J. Nkem, K. Calvin, D. Campbell, F. Cherubini, G. Grassi, V. Korotkov, A.L. Hoang, S. Lwasa, P. McElwee, E. Nkonya, N. Saigusa, J.-F. Soussana, and M.A. Taboada, 2019a: Interlinkages Between Desertification, Land Degradation, Food Security and Greenhouse Gas Fluxes: Synergies, Trade-offs and Integrated Response Options. In: Climate Change and Land: an IPCC special report on climate change, desertification, land degradation, sustainable land management, food security, and greenhouse gas fluxes in terrestrial ecosystems[Shukla, P.R., J. Skea, E. Calvo Buendia, V. Masson-Delmotte, H.- O. Portner, D. C. Roberts, P. Zhai, R. Slade, S. Connors, R. van Diemen, M. Ferrat, E. Haughey, S. Luz, S. Neogi, M. Pathak, J. Petzold, J. Portugal Pereira, P. Vyas, E. Huntley, K. Kissick, M. Belkacemi, and J. Malley (eds.)]. Cambridge University Press, Cambridge, UK and New York, NY, USA, pp. 551–672.
Smith, P. et al., 2019b: Land-Management Options for Greenhouse Gas Removal and Their Impacts on Ecosystem Services and the Sustainable Development Goals. Annu. Rev. Environ. Resour. , 44(1) , 255–286, doi:10.1146/annurev-environ-101718-033129.
Smith, P. et al., 2020a: Which practices co‐deliver food security, climate change mitigation and adaptation, and combat land degradation and desertification?Glob. Change Biol. , 26(3) , 1532–1575, doi:10.1111/gcb.14878.
Smith, P. et al., 2020b: How to measure, report and verify soil carbon change to realize the potential of soil carbon sequestration for atmospheric greenhouse gas removal. Glob. Change Biol. , 26(1) , 219–241, doi:10.1111/gcb.14815.
Smith, V., 1997: Mispriced Planet. Perspect. Regul. , 20, 16–17.
Smyth, C.E., Z. Xu, T.C. Lemprière, and W.A. Kurz, 2020: Climate change mitigation in British Columbia’s forest sector: GHG reductions, costs, and environmental impacts. Carbon Balance Manag. , 15(1) , 21, doi:10.1186/s13021-020-00155-2.
Snapp, S. et al., 2021: Delivering climate change outcomes with agroecology in low- and middle-income countries: evidence and actions needed. CGIAR Research Program on Climate Change, Agriculture and Food Security (CCAFS), Wageningen, The Netherlands, 16 pp.
Södra, 2021: https://www.sodra.com/sv/se/. Swedish forest owners association, Vaxjo, Sweden.
Soergel, B. et al., 2021: Combining ambitious climate policies with efforts to eradicate poverty. Nat. Commun. , 12(1) , 2342, doi:10.1038/s41467-021-22315-9.
Sohngen, BS. Brown, 2004: Measuring leakage from carbon projects in open economies: a stop timber harvesting project in Bolivia as a case study. Can. J. For. Res. , 34(4) , 829–839, doi:10.1139/x03-249.
Soimakallio, S., L. Saikku, L. Valsta, and K. Pingoud, 2016: Climate Change Mitigation Challenge for Wood Utilization—The Case of Finland. Environ. Sci. Technol. , 50(10) , 5127–5134, doi:10.1021/acs.est.6b00122.
Sokolov, V.K. et al., 2021: Dairy manure acidification reduces CH4 emissions over short and long-term. Environ. Technol. , 42(18) , 2797–2804, doi:10.1080/09593330.2020.1714744.
Somarriba, E. et al., 2013: Carbon stocks and cocoa yields in agroforestry systems of Central America. Agric. Ecosyst. Environ. , 173, 46–57, doi:10.1016/j.agee.2013.04.013.
Sombroek, W.G., F. Nachtergaele, and A. Hebel, 1993: Amounts, Dynamics and Sequestering of Carbon in Tropical and Subtropical Soils. Ambio, 7, 417–426.
Sommer, R. and D. Bossio, 2014: Dynamics and climate change mitigation potential of soil organic carbon sequestration. J. Environ. Manage. , 144, 83–87, doi:10.1016/j.jenvman.2014.05.017.
Song, X.-P. et al., 2018: Global land change from 1982 to 2016. Nature, 560(7720) , 639–643, doi:10.1038/s41586-018-0411-9.
Song, X., G. Pan, C. Zhang, L. Zhang, and H. Wang, 2016: Effects of biochar application on fluxes of three biogenic greenhouse gases: a meta‐analysis. Ecosyst. Heal. Sustain. , 2(2):e01202, doi:10.1002/ehs2.1202.
Sonntag, S., J. Pongratz, C.H. Reick, and H. Schmidt, 2016: Reforestation in a high-CO2 world – higher mitigation potential than expected, lower adaptation potential than hoped for. Geophys. Res. Lett. , 43(12) , 6546–6553, doi:10.1002/2016GL068824.
Sonter, L.J., D.J. Barrett, C.J. Moran, and B.S. Soares-Filho, 2015: Carbon emissions due to deforestation for the production of charcoal used in Brazil’s steel industry. Nat. Clim. Change, 5(4) , 359–363, doi:10.1038/nclimate2515.
Soterroni, A.C. et al., 2019: Expanding the Soy Moratorium to Brazil’s Cerrado. Sci. Adv. , 5(7) , doi:10.1126/sciadv.aav7336.
Souza, Jr, C.M. et al., 2013: Ten-Year Landsat Classification of Deforestation and Forest Degradation in the Brazilian Amazon. Remote Sens. , 5(11) , 5493–5513, doi:10.3390/rs5115493.
Springmann, M., H.C.J. Godfray, M. Rayner, and P. Scarborough, 2016: Analysis and valuation of the health and climate change cobenefits of dietary change. Proc. Natl. Acad. Sci. , 113(15) , 4146–4151, doi:10.1073/pnas.1523119113.
Springmann, M. et al., 2018: Options for keeping the food system within environmental limits. Nature, 562(7728) , 519–525, doi:10.1038/s41586-018-0594-0.
Sriphirom, P., A. Chidthaisong, and S. Towprayoon, 2019: Effect of alternate wetting and drying water management on rice cultivation with low emissions and low water used during wet and dry season. J. Clean. Prod. , 223, 980–988, doi:10.1016/j.jclepro.2019.03.212.
Sriphirom, P., A. Chidthaisong, K. Yagi, S. Tripetchkul, and S. Towprayoon, 2020: Evaluation of biochar applications combined with alternate wetting and drying (AWD) water management in rice field as a methane mitigation option for farmers’ adoption. Soil Sci. Plant Nutr. , 66 (1) , 235–246, doi:10.1080/00380768.2019.1706431.
Stanturf, J.A. et al., 2015: Forest Landscape Restoration as a Key Component of Climate Change Mitigation and Adaptation. International Union of Forest Research Organizations, Vienna, Austria, 75 pp.
Staples, M.D., R. Malina, and S.R.H. Barrett, 2017: The limits of bioenergy for mitigating global life-cycle greenhouse gas emissions from fossil fuels. Nat. Energy, 2(2) , 16202, doi:10.1038/nenergy.2016.202.
Stenzel, F., D. Gerten, C. Werner, and J. Jägermeyr, 2019: Freshwater requirements of large-scale bioenergy plantations for limiting global warming to 1.5°C. Environ. Res. Lett. , 14(8) , 084001, doi:10.1088/1748-9326/ab2b4b.
Stenzel, F., D. Gerten, and N. Hanasaki, 2020: Global scenarios of irrigation water use for bioenergy production: a systematic review. Hydrol. Earth Syst. Sci. 25, 4, 1711-1726, doi:10.5194/hess-2020-338.
Stephens, N. et al., 2018: Bringing cultured meat to market: Technical, socio-political, and regulatory challenges in cellular agriculture. Trends Food Sci. Technol. , 78 (June 2017), 155–166, doi:10.1016/j.tifs.2018.04.010.
Stephens, S.L. et al., 2020: Fire and climate change: conserving seasonally dry forests is still possible. Front. Ecol. Environ. , 18(6) , 354–360, doi:10.1002/fee.2218.
Stern, T. et al., 2018: Perceptions on the Importance of Forest Sector Innovations: Biofuels, Biomaterials, or Niche Products?Forests, 9(5) , 255, doi:10.3390/f9050255.
Stevanović, M. et al., 2017: Mitigation Strategies for Greenhouse Gas Emissions from Agriculture and Land-Use Change: Consequences for Food Prices. Environ. Sci. Technol. , 51(1) , 365–374, doi:10.1021/acs.est.6b04291.
Strandberg, G. and E. Kjellström, 2019: Climate Impacts from Afforestation and Deforestation in Europe. Earth Interact. , 23(1) , 1–27, doi:10.1175/EI-D-17-0033.1.
Strassburg, B.B.N. et al., 2020: Global priority areas for ecosystem restoration. Nature, 586(7831) , 724–729, doi:10.1038/s41586-020-2784-9.
Streck, C., 2012: Financing REDD+: matching needs and ends. Curr. Opin. Environ. Sustain. , 4(6) , 628–637, doi:10.1016/j.cosust.2012.10.001.
Strefler, J. et al., 2021: Carbon dioxide removal technologies are not born equal. Environ. Res. Lett. , 16(7) , 074021, doi:10.1088/1748-9326/ac0a11.
Sumaila, U.R. and V.W.Y. Lam, 2020: Climate change and British Columbia’s staple seafood supplies and prices. In: Environmental Assessments: Scenarios, Modelling and Policy[Ninan, K. (ed.)]. Edward Elgar Publishing, pp. 162–178.
Sumaila, U.R., W.W.L. Cheung, P.M. Cury, and T. Tai, 2017: Climate change, marine ecosystems and global fisheries. In: Building a Climate Resilient Economy and Society[Ninan, K.N. and M. Inoue, (eds.)]. Edward Elgar Publishing, Cheltenham, UK and Northampton, USA. pp. 151–163.
Sun, F. and R.T. Carson, 2020: Coastal wetlands reduce property damage during tropical cyclones. Proc. Natl. Acad. Sci. , 117(11) , 5719–5725, doi:10.1073/pnas.1915169117.
Sun, W. et al., 2020: Climate drives global soil carbon sequestration and crop yield changes under conservation agriculture. Glob. Change Biol. , 26(6) , 3325–3335, doi:10.1111/gcb.15001.
Sunderlin, W.D. et al., 2018: Creating an appropriate tenure foundation for REDD+: The record to date and prospects for the future. World Dev. , 106, 376–392, doi:10.1016/j.worlddev.2018.01.010.
Swann, A.L.S., I.Y. Fung, and J.C.H. Chiang, 2012: Mid-latitude afforestation shifts general circulation and tropical precipitation. Proc. Natl. Acad. Sci. , 109 (3) , 712–716, doi:10.1073/pnas.1116706108.
Tacconi, L. and M.Z. Muttaqin, 2019: Reducing emissions from land use change in Indonesia: An overview. For. Policy Econ. , 108, 101979, doi:10.1016/j.forpol.2019.101979.
Taillardat, P., B.S. Thompson, M. Garneau, K. Trottier, and D.A. Friess, 2020: Climate change mitigation potential of wetlands and the cost-effectiveness of their restoration. Interface Focus, 10(5) , 20190129, doi:10.1098/rsfs.2019.0129.
Takakai, F., Y. Kominami, S. Ohno, and O. Nagata, 2020: Effect of the long-term application of organic matter on soil carbon accumulation and GHG emissions from a rice paddy field in a cool-temperate region, Japan. I. Comparison of rice straw and rice straw compost. Soil Sci. Plant Nutr. , 66(1) , 84–95, doi:10.1080/00380768.2019.1609335.
Tan, Z.D., M. Lupascu, and L.S. Wijedasa, 2021: Paludiculture as a sustainable land use alternative for tropical peatlands: A review. Sci. Total Environ. , 753, 142111, doi:10.1016/j.scitotenv.2020.142111.
Tanneberger, F. et al., 2020b: Climate Change Mitigation through Land Use on Rewetted Peatlands – Cross-Sectoral Spatial Planning for Paludiculture in Northeast Germany. Wetlands, 40(6) , 2309–2320, doi:10.1007/s13157-020-01310-8.
Tanneberger, F. et al., 2020a: The Power of Nature‐Based Solutions: How Peatlands Can Help Us to Achieve Key EU Sustainability Objectives. Adv. Sustain. Syst. , 5(1) , 2000146, doi:10.1002/adsu.202000146.
Taubert, F. et al., 2018: Global patterns of tropical forest fragmentation. Nature, 554(7693) , 519–522, doi:10.1038/nature25508.
Taylor, J.S., J. Parfitt, and D. Jarosz, 2019: Regulating the role of Unfair Trading Practices in food waste generation. European Union - EU Horizon 2020 REFRESH Policy Brief, February 2019, 14 pp.
ten Berge, H.F.M. et al., 2019: Maize crop nutrient input requirements for food security in sub-Saharan Africa. Glob. Food Sec. , 23, 9–21, doi:10.1016/j.gfs.2019.02.001.
Teuling, A.J. et al., 2017: Observational evidence for cloud cover enhancement over western European forests. Nat. Commun. , 8(1) , 14065, doi:10.1038/ncomms14065.
Thakuri, S. et al., 2020: Methane emission factors and carbon fluxes from enteric fermentation in cattle of Nepal Himalaya. Sci. Total Environ. , 746, 141184, doi:10.1016/j.scitotenv.2020.141184.
The Royal Society Science Policy Centre, 2014: Resilience to extreme weather. The Royal Society, London, UK, 124 pp. https://royalsociety.org/-/media/policy/projects/resilience-climate-change/resilience-full-report.pdf (Accessed February 15, 2021).
Theurl, M.C. et al., 2020: Food systems in a zero-deforestation world: Dietary change is more important than intensification for climate targets in 2050. Sci. Total Environ. , 735, 139353, doi:10.1016/j.scitotenv.2020.139353.
Thierfelder, C. et al., 2017: How climate-smart is conservation agriculture – its potential to deliver on adaptation, mitigation and productivity on smallholder farms in southern Africa. Food Secur. , 9(3) , 537–560, doi:10.1007/s12571-017-0665-3.
Thiery, W. et al., 2017: Present‐day irrigation mitigates heat extremes. J. Geophys. Res. Atmos. , 122(3) , 1403–1422, doi:10.1002/2016JD025740.
Thomas, N. et al., 2017: Distribution and drivers of global mangrove forest change, 1996–2010. PLoS One, 12(6) , e0179302, doi:10.1371/journal.pone.0179302.
Thompson, L.R. and J.E. Rowntree, 2020: Invited Review: Methane sources, quantification, and mitigation in grazing beef systems. Appl. Anim. Sci. , 36(4) , 556–573, doi:10.15232/aas.2019-01951.
Thomson, A.M. et al., 2019: Sustainable intensification in land systems: trade-offs, scales, and contexts. Curr. Opin. Environ. Sustain. 38, 37–43, doi:10.1016/j.cosust.2019.04.011.
Thornton, P.K. and M. Herrero, 2015: Adapting to climate change in the mixed crop and livestock farming systems in sub-Saharan Africa. Nat. Clim. Change, 5(9) , 830–836, doi:10.1038/nclimate2754.
Thyagharajan, K.K. and T. Vignesh, 2019: Soft Computing Techniques for Land Use and Land Cover Monitoring with Multispectral Remote Sensing Images: A Review. Arch. Comput. Methods Eng. , 26(2) , 275–301, doi:10.1007/s11831-017-9239-y.
Tian, H. et al., 2020: A comprehensive quantification of global nitrous oxide sources and sinks. Nature, 586(7828) , 248–256, doi:10.1038/s41586-020-2780-0.
Tian, X., B. Sohngen, J. Baker, S. Ohrel, and A.A. Fawcett, 2018: Will U.S. Forests Continue to Be a Carbon Sink?Land Econ. , 94(1) , 97–113, doi:10.3368/le.94.1.97.
Tilman, D. and M. Clark, 2014: Global diets link environmental sustainability and human health. Nature, 515(7528) , 518–522, doi:10.1038/nature13959.
Tisserant, A. and F. Cherubini, 2019: Potentials, Limitations, Co-Benefits, and Trade-Offs of Biochar Applications to Soils for Climate Change Mitigation. Land, 8(12) , 179, doi:10.3390/land8120179.
Tittonell, P., 2020: Assessing resilience and adaptability in agroecological transitions. Agric. Syst. , 184, 102862, doi:10.1016/j.agsy.2020.102862.
Toensmeier, E., 2016: The carbon farming solution: a global toolkit of perennial crops and regenerative agriculture practices for climate change mitigation and food security. Chelsea Green Publishing, White River Junction, VT, USA, 480 pp.
Tougiani, A., C. Guero, and T. Rinaudo, 2009: Community mobilisation for improved livelihoods through tree crop management in Niger. GeoJournal, 74(5) , 377–389, doi:10.1007/s10708-008-9228-7.
Toumpanakis, A., T. Turnbull, and I. Alba-Barba, 2018: Effectiveness of plant-based diets in promoting well-being in the management of type 2 diabetes: a systematic review. BMJ Open Diabetes Res. Care, 6(1) , e000534, doi:10.1136/bmjdrc-2018-000534.
Tran, D.H., T.N. Hoang, T. Tokida, A. Tirol-Padre, and K. Minamikawa, 2018: Impacts of alternate wetting and drying on greenhouse gas emission from paddy field in Central Vietnam. Soil Sci. Plant Nutr. , 64(1) , 14–22, doi:10.1080/00380768.2017.1409601.
Tritsch, I. et al., 2020: Do forest-management plans and FSC certification help avoid deforestation in the Congo Basin?Ecol. Econ. , 175, 106660, doi:10.1016/j.ecolecon.2020.106660.
Tscharntke, T. et al., 2011: Multifunctional shade-tree management in tropical agroforestry landscapes – a review. J. Appl. Ecol. , 48(3) , 619–629, doi:10.1111/j.1365-2664.2010.01939.x.
Tubiello, F.N., 2019: Greenhouse Gas Emissions Due to Agriculture. In: Encyclopedia of Food Security and Sustainability, vol. 1[Ferranti, P., E.M. Berry, and J.R. Anderson (eds.)]. Elsevier, pp. 196–205.
Tubiello, F.N. et al., 2020: Carbon emissions and removals by forests: new estimates, 1990–2020. Earth Syst. Sci. Data, doi:10.5194/essd-2020-203.
Tuomisto, H.L., I.D. Hodge, P. Riordan, and D.W. Macdonald, 2012: Does organic farming reduce environmental impacts? – A meta-analysis of European research. J. Environ. Manage. , 112, 309–320, doi:10.1016/j.jenvman.2012.08.018.
Turner, P.A., C.B. Field, D.B. Lobell, D.L. Sanchez, and K.J. Mach, 2018a: Unprecedented rates of land-use transformation in modelled climate change mitigation pathways. Nat. Sustain. , 1(5) , 240–245, doi:10.1038/s41893-018-0063-7.
Turner, P.A. et al., 2018b: The global overlap of bioenergy and carbon sequestration potential. Clim. Change, 148(1–2) , 1–10, doi:10.1007/s10584-018-2189-z.
Turnhout, E. et al., 2017: Envisioning REDD+ in a post‐Paris era: between evolving expectations and current practice. WIREs Clim. Change, 8(1) , doi:10.1002/wcc.425.
Turubanova, S., P.V. Potapov, A. Tyukavina, and M.C. Hansen, 2018: Ongoing primary forest loss in Brazil, Democratic Republic of the Congo, and Indonesia. Environ. Res. Lett. , 13(7) , 074028, doi:10.1088/1748-9326/aacd1c.
Ünal, H.E., Ü. Birben, and F. Bolat, 2019: Rural population mobility, deforestation, and urbanization: case of Turkey. Environ. Monit. Assess. , 191(1) , 21, doi:10.1007/s10661-018-7149-6.
UNEP, 2019: Drivers of Environmental Change. In: Global Environment Outlook – GEO-6: Healthy Planet, Healthy People.
UNEP, 2020: Emissions Gap Report 2020. United Nations Environment Programme (UNEP), Nairobi, Kenya, 112 pp.
UNEP, 2021a: Becoming #GenerationRestoration: Ecosystem Restoration for People, Nature and Climate. United Nations Environment Programme, Nairobi, Kenya.56p.
UNEP, 2021b: Food Waste Index Report 2021. United Nations Environment Programme (UNEP), Nairobi, Kenya, 3–99 pp.
Unger, N., 2014: Human land-use-driven reduction of forest volatiles cools global climate. Nat. Clim. Change, 4(10) , 907–910, doi:10.1038/nclimate2347.
UNIPP, 2012: Delivering as One UN at the country level in partnership with indigenous peoples and governments. 9–10 pp.
USEPA, 2019: Global Non-CO2Greenhouse Gas Emission Projections & Mitigation2015–2050. US Environmental Protection Agency, Washington, DC, USA, 43 pp.
USEPA, 2020: Inventory of US greenhouse gas emissions and sinks: 1990–2018. 733 pp. United States Environmental Protection Agency. https://www.epa.gov/sites/production/files/2020-04/documents/us-ghg-inventory-2020-main-text.pdf (Accessed July 1, 2021).
van der Laan-Luijkx, I.T. et al., 2017: The CarbonTracker Data Assimilation Shell (CTDAS) v1.0: implementation and global carbon balance 2001–2015. Geosci. Model Dev. , 10(7) , 2785–2800, doi:10.5194/gmd-10-2785-2017.
van der Sleen, P. et al., 2015: No growth stimulation of tropical trees by 150 years of CO2 fertilization but water-use efficiency increased. Nat. Geosci. , 8(1) , 24–28, doi:10.1038/ngeo2313.
van der Weerden, T.J. et al., 2016: Refining the New Zealand nitrous oxide emission factor for urea fertiliser and farm dairy effluent. Agric. Ecosyst. Environ. , 222, 133–137, doi:10.1016/j.agee.2016.02.007.
van der Werf, G.R. et al., 2017: Global fire emissions estimates during 1997–2016. Earth Syst. Sci. Data, 9(2) , 697–720, doi:10.5194/essd-9-697-2017.
van der Werf, H.M.G., M.T. Knudsen, and C. Cederberg, 2020: Towards better representation of organic agriculture in life cycle assessment. Nat. Sustain. , 3(6) , 419–425, doi:10.1038/s41893-020-0489-6.
van Diggelen, J.M.H., L.P.M. Lamers, J.H.T. Loermans, W.J. Rip, and A.J.P. Smolders, 2020: Towards more sustainable hydrological management and land use of drained coastal peatlands – a biogeochemical balancing act. Mires Peat , 26, 1–12, doi.org/10.19189/MaP.2019.APG.StA.1771.
van Giesen, R.I. and I.E. de Hooge, 2019: Too ugly, but I love its shape: Reducing food waste of suboptimal products with authenticity (and sustainability) positioning. Food Qual. Prefer. , 75, 249–259, doi:10.1016/j.foodqual.2019.02.020.
van Ittersum, M.K. et al., 2013: Yield gap analysis with local to global relevance—A review. F. Crop. Res. , 143, 4–17, doi:10.1016/j.fcr.2012.09.009.
Van Loo, E.J., C. Hoefkens, and W. Verbeke, 2017: Healthy, sustainable and plant-based eating: Perceived (mis)match and involvement-based consumer segments as targets for future policy. Food Policy, 69, 46–57, doi:10.1016/j.foodpol.2017.03.001.
van Meijl, H. et al., 2018: Comparing impacts of climate change and mitigation on global agriculture by 2050. Environ. Res. Lett. , 13(6) , 064021, doi:10.1088/1748-9326/aabdc4.
van Soest, H.L. et al., 2019: Analysing interactions among Sustainable Development Goals with Integrated Assessment Models. Glob. Transitions, 1, 210–225, doi:10.1016/j.glt.2019.10.004.
van Vuuren, D.P. et al., 2018: Alternative pathways to the 1.5°C target reduce the need for negative emission technologies. Nat. Clim. Change, 8(5) , 391–397, doi:10.1038/s41558-018-0119-8.
Van Vuuren, D.P. et al., 2019: Integrated scenarios to support analysis of the food–energy–water nexus. Nat. Sustain. , 2(12) , 1132–1141, doi:10.1038/s41893-019-0418-8.
Van Wesemael, D. et al., 2019: Reducing enteric methane emissions from dairy cattle: Two ways to supplement 3-nitrooxypropanol. J. Dairy Sci. , 102(2) , 1780–1787, doi:10.3168/jds.2018-14534.
Van Zwieten, L. et al., 2015: Enhanced biological N2 fixation and yield of faba bean (Vicia faba L.) in an acid soil following biochar addition: dissection of causal mechanisms. Plant Soil, 395(1–2) , 7–20, doi:10.1007/s11104-015-2427-3.
Vainer Manzatto, C., et al., 2020: Mitigação das emissões de Gases de Efeitos Estufa pela adoção das tecnologias do Plano ABC: estimativas parciais. Brasilia, Brazil, 36 pp. https://www.embrapa.br/meio-ambiente/.Embrapa (Accessed September 1, 2021).
Varghese, A., T. Ticktin, L. Mandle, and S. Nath, 2015: Assessing the Effects of Multiple Stressors on the Recruitment of Fruit Harvested Trees in a Tropical Dry Forest, Western Ghats, India. PLoS One, 10(3) , e0119634, doi:10.1371/journal.pone.0119634.
Vaughan, N.E. et al., 2018: Evaluating the use of biomass energy with carbon capture and storage in low emission scenarios. Environ. Res. Lett. , 13(4) , 044014, doi:10.1088/1748-9326/aaaa02.
Venkatramanan, V., S. Shah, and R. Prasad, 2020: Global Climate Change: Resilient and Smart Agriculture. Springer, Singapore. https://doi.org/10.1007/978-981-32-9856-9.
Vera, I., R. Hoefnagels, M. Junginger, and F. Hilst, 2021: Supply potential of lignocellulosic energy crops grown on marginal land and greenhouse gas footprint of advanced biofuels—A spatially explicit assessment under the sustainability criteria of the Renewable Energy Directive Recast. GCB Bioenergy, 13(9) , 1425–1447, doi:10.1111/gcbb.12867.
Verhoeven, E. et al., 2017: Toward a Better Assessment of Biochar-Nitrous Oxide Mitigation Potential at the Field Scale. J. Environ. Qual. , 46(2) , 237–246, doi:10.2134/jeq2016.10.0396.
Verkerk, P.J. et al., 2020: Climate-Smart Forestry: the missing link. For. Policy Econ. , 115, 102164, doi:10.1016/j.forpol.2020.102164.
Vijn, S. et al., 2020: Key Considerations for the Use of Seaweed to Reduce Enteric Methane Emissions From Cattle. Front. Vet. Sci. , 7, Art597430 doi:10.3389/fvets.2020.597430.
Vogel, E. and R. Meyer, 2018: Climate Change, Climate Extremes, and Global Food Production—Adaptation in the Agricultural Sector. Resilience.2018: 31–49. https://doi.org/10.1016/B978-0-12-811891-7.00003-7.
Wade, C.M., J.S. Baker, G. Latta, S.B. Ohrel, and J. Allpress, 2019: Projecting the Spatial Distribution of Possible Planted Forest Expansion in the United States. J. For. , 117 (6) , 560–578, doi:10.1093/jofore/fvz054.
Walker, W.S. et al., 2020: The role of forest conversion, degradation, and disturbance in the carbon dynamics of Amazon indigenous territories and protected areas. Proc. Natl. Acad. Sci. , 117(6) , 3015–3025, doi:10.1073/pnas.1913321117.
Walkup, J., Z. Freedman, J. Kotcon, and E.M. Morrissey, 2020: Pasture in crop rotations influences microbial biodiversity and function reducing the potential for nitrogen loss from compost. Agric. Ecosyst. Environ. , 304, 107122, doi:10.1016/j.agee.2020.107122.
Wang, F. et al., 2021: Global blue carbon accumulation in tidal wetlands increases with climate change. Natl. Sci. Rev. , 8(9) , doi:10.1093/nsr/nwaa296.
Wang, J., X. Pan, Y. Liu, X. Zhang, and Z. Xiong, 2012: Effects of biochar amendment in two soils on greenhouse gas emissions and crop production. Plant Soil, 360(1–2) , 287–298, doi:10.1007/s11104-012-1250-3.
Wang, J., Z. Xiong, and Y. Kuzyakov, 2016: Biochar stability in soil: meta‐analysis of decomposition and priming effects. GCB Bioenergy, 8(3) , 512–523, doi:10.1111/gcbb.12266.
Wang, J., H. Akiyama, K. Yagi, and X. Yan, 2018: Controlling variables and emission factors of methane from global rice fields. Atmos. Chem. Phys. , 18(14) , 10419–10431, doi:10.5194/acp-18-10419-2018.
Wang, Y. et al., 2020: Upturn in secondary forest clearing buffers primary forest loss in the Brazilian Amazon. Nat. Sustain. , 3(4) , 290–295, doi:10.1038/s41893-019-0470-4.
Wanger, T.C. et al., 2020: Integrating agroecological production in a robust post-2020 Global Biodiversity Framework. Nat. Ecol. Evol. , 4(9) , 1150–1152, doi:10.1038/s41559-020-1262-y.
Ward, C. et al., 2021: Smallholder perceptions of land restoration activities: rewetting tropical peatland oil palm areas in Sumatra, Indonesia. Reg. Environ. Change, 21(1) , 1, doi:10.1007/s10113-020-01737-z.
Ward, M. et al., 2020: Impact of 2019–2020 mega-fires on Australian fauna habitat. Nat. Ecol. Evol. , 4(10) , 1321–1326, doi:10.1038/s41559-020-1251-1.
Watson, J.E.M., N. Dudley, D.B. Segan, and M. Hockings, 2014: The performance and potential of protected areas. Nature, 515(7525) , 67–73, doi:10.1038/nature13947.
Watson, J.E.M. et al., 2016: Catastrophic Declines in Wilderness Areas Undermine Global Environment Targets. Curr. Biol. , 26(21) , 2929–2934, doi:10.1016/j.cub.2016.08.049.
Wear, D.N. and B.C. Murray, 2004: Federal timber restrictions, interregional spillovers, and the impact on US softwood markets. J. Environ. Econ. Manage. , 47(2) , 307–330, doi:10.1016/S0095-0696(03)00081-0.
Webb, E.L. et al., 2014: Deforestation in the Ayeyarwady Delta and the conservation implications of an internationally-engaged Myanmar. Glob. Environ. Change, 24, 321–333, doi:10.1016/j.gloenvcha.2013.10.007.
Weindl, I. et al., 2015: Livestock in a changing climate: production system transitions as an adaptation strategy for agriculture. Environ. Res. Lett. , 10(9) , 094021, doi:10.1088/1748-9326/10/9/094021.
Weltin, M. et al., 2018: Conceptualising fields of action for sustainable intensification – A systematic literature review and application to regional case studies. Agric. Ecosyst. Environ. , 257, 68–80, doi:10.1016/j.agee.2018.01.023.
Weng, Z. (Han) et al., 2018: The accumulation of rhizodeposits in organo-mineral fractions promoted biochar-induced negative priming of native soil organic carbon in Ferralsol. Soil Biol. Biochem. , 118, 91–96, doi:10.1016/j.soilbio.2017.12.008.
Weng, Z.H. et al., 2015: Plant-biochar interactions drive the negative priming of soil organic carbon in an annual ryegrass field system. Soil Biol. Biochem. , 90, 111–121, doi:10.1016/j.soilbio.2015.08.005.
White, R.P., S. Murray, and M. Rohwede, 2000: Pilot Analysis of Global Ecosystems: Grassland Ecosystems. World Resource Institute. Washington, DC, USA, 81 pp.
Whitehead, P.J., J. Russell-Smith, and C. Yates, 2014: Fire patterns in north Australian savannas: extending the reach of incentives for savanna fire emissions abatement. Rangel. J. , 36(4) , 371, doi:10.1071/RJ13129.
Wiedinmyer, C. and M.D. Hurteau, 2010: Prescribed Fire As a Means of Reducing Forest Carbon Emissions in the Western United States. Environ. Sci. Technol. , 44(6) , 1926–1932, doi:10.1021/es902455e.
Wigneron, J.-P. et al., 2020: Tropical forests did not recover from the strong 2015–2016 El Niño event. Sci. Adv. , 6(6) : eaay4603 doi:10.1126/sciadv.aay4603.
Wijaya, A. et al., 2017: How Can Indonesia Achieve Its Climate Change Mitigation Goal? An Analysis of Potential Emissions Reductions from Energy and Land-Use Policies. World Resources Institute, Washington, DC, USA, 36 pp.
Wilson, C., H. Pettifor, E. Cassar, L. Kerr, and M. Wilson, 2019: The potential contribution of disruptive low-carbon innovations to 1.5°C climate mitigation. Energy Effic. , 12(2) , 423–440, doi:10.1007/s12053-018-9679-8.
Wilson, D. et al., 2016: Greenhouse gas emission factors associated with rewetting of organic soils. Mires Peat , 17(4) , 1–28, doi:10.19189/MaP.2016.OMB.222.
Wilson, K. and H. Lotze, 2019: Climate change projections reveal range shifts of eelgrass Zostera marina in the Northwest Atlantic. Mar. Ecol. Prog. Ser. , 620, 47–62, doi:10.3354/meps12973.
Windham-Myers, L. et al., 2018: Chapter 15: Tidal Wetlands and Estuaries. Second State of the Carbon Cycle Report [Cavallaro, N., G. Shrestha, R. Birdse, M.A. Mayes, R. Najjar, S. Reed, P. Romero-Lankao, and Z. Zhu, (eds.)]. Washington, DC, USA, 596–648 pp.
Wood, S.L.R. et al., 2018: Distilling the role of ecosystem services in the Sustainable Development Goals. Ecosyst. Serv. , 29, 70–82, doi:10.1016/j.ecoser.2017.10.010.
Woodward, R.T., D.A. Newburn, and M. Mezzatesta, 2016: Additionality and reverse crowding out for pollution offsets in water quality trading. Ecol. Econ. , 128, 224–231, doi:10.1016/j.ecolecon.2016.05.001.
Woolf, D., J.E. Amonette, F.A. Street-Perrott, J. Lehmann, and S. Joseph, 2010: Sustainable biochar to mitigate global climate change. Nat. Commun. , 1(1) , 56, doi:10.1038/ncomms1053.
Woolf, D., J. Lehmann, and D.R. Lee, 2016: Optimal bioenergy power generation for climate change mitigation with or without carbon sequestration. Nat. Commun. , 7(1) , 13160, doi:10.1038/ncomms13160.
Worden, J.R. et al., 2017: Reduced biomass burning emissions reconcile conflicting estimates of the post-2006 atmospheric methane budget. Nat. Commun. , 8(1) , 2227, doi:10.1038/s41467-017-02246-0.
World Bank, 2019: Illegal Logging, Fishing, and Wildlife Trade: The Cost and How to Combat it . The World Bank, Washington, DC, USA, 70 pp.
Wotton, B.M., M.D. Flannigan, and G.A. Marshall, 2017: Potential climate change impacts on fire intensity and key wildfire suppression thresholds in Canada. Environ. Res. Lett. , 12(9) , 095003, doi:10.1088/1748-9326/aa7e6e.
Wu, H. et al., 2017: The interactions of composting and biochar and their implications for soil amendment and pollution remediation: a review. Crit. Rev. Biotechnol. , 37(6) , 754–764, doi:10.1080/07388551.2016.1232696.
Wu, J., 2000: Slippage Effects of the Conservation Reserve Program. Am. J. Agric. Econ. , 82(4) , 979–992, doi:10.1111/0002-9092.00096.
Wu, W. et al., 2019: Global advanced bioenergy potential under environmental protection policies and societal transformation measures. GCB Bioenergy, 11(9) , gcbb.12614, doi:10.1111/gcbb.12614.
Wunder, S., 2007: The Efficiency of Payments for Environmental Services in Tropical Conservation. Conserv. Biol. , 21(1) , 48–58, doi:10.1111/j.1523-1739.2006.00559.x.
WWF, 2020: The Living Planet Index 2020: Bending the Curve of Biodiversity Loss-Summary[Almond, R.E.A., M. Grooten M., and T. Petersen (eds.)]. WWF, Gland, Switzerland, 83 pp.
Wylie, L., A.E. Sutton-Grier, and A. Moore, 2016: Keys to successful blue carbon projects: Lessons learned from global case studies. Mar. Policy, 65, 76–84, doi:10.1016/j.marpol.2015.12.020.
Wynberg, R., 2017: Making sense of access and benefit sharing in the rooibos industry: Towards a holistic, just and sustainable framing. South African J. Bot. , 110, 39–51, doi:10.1016/j.sajb.2016.09.015.
Xie, S.H., W.A. Kurz, and P.N. McFarlane, 2021: Inward- versus outward-focused bioeconomy strategies for British Columbia’s forest products industry: a harvested wood products carbon storage and emission perspective. Carbon Balance Manag. , 16(1) , 30, doi:10.1186/s13021-021-00193-4.
Xu, Z., C.E. Smyth, T.C. Lemprière, G.J. Rampley, and W.A. Kurz, 2018: Climate change mitigation strategies in the forest sector: biophysical impacts and economic implications in British Columbia, Canada. Mitig. Adapt. Strateg. Glob. Change, 23, 257–290, doi:10.1007/s11027-016-9735-7.
Xue, D. and C. Tisdell, 2001: Valuing ecological functions of biodiversity in Changbaishan Mountain Biosphere Reserve in Northeast China. Biodivers. Conserv. , 10, 467–481, doi.org/10.1023/A:1016630825913.
Yagi, K. et al., 2020: Potential and promisingness of technical options for mitigating greenhouse gas emissions from rice cultivation in Southeast Asian countries. Soil Sci. Plant Nutr. , 66(1) , 37–49, doi:10.1080/00380768.2019.1683890.
Yamaguchi, T., M.T. Luu, K. Minamikawa, and S. Yokoyama, 2017: Compatibility of Alternate Wetting and Drying Irrigation with Local Agriculture in An Giang Province, Mekong Delta, Vietnam. Trop. Agric. Dev., 61(3) , 117–127, doi.org/10.11248/jsta.61.117.
Yamaguchi, T., L.M. Tuan, K. Minamikawa, and S. Yokoyama, 2019: Assessment of the relationship between adoption of a knowledge-intensive water-saving technique and irrigation conditions in the Mekong Delta of Vietnam. Agric. Water Manag. , 212, 162–171, doi:10.1016/j.agwat.2018.08.041.
Yao, G., T.W. Hertel, and F. Taheripour, 2018: Economic drivers of telecoupling and terrestrial carbon fluxes in the global soybean complex. Glob. Environ. Change, 50, 190–200, doi:10.1016/j.gloenvcha.2018.04.005.
Yao, Y. et al., 2020: Anaerobic digestion of livestock manure in cold regions: Technological advancements and global impacts. Renew. Sustain. Energy Rev. , 119, 109494, doi:10.1016/j.rser.2019.109494.
Ye, L. et al., 2020: Biochar effects on crop yields with and without fertilizer: A meta‐analysis of field studies using separate controls. Soil Use Manag. , 36(1) , 2–18, doi:10.1111/sum.12546.
Zak, D. et al., 2018: Top soil removal reduces water pollution from phosphorus and dissolved organic matter and lowers methane emissions from rewetted peatlands. J. Appl. Ecol. , 55(1) , 311–320, doi:10.1111/1365-2664.12931.
Zelli, F., I. Möller, and H. van Asselt, 2017: Institutional complexity and private authority in global climate governance: the cases of climate engineering, REDD+ and short-lived climate pollutants. Env. Polit. , 26(4) , 669–693, doi:10.1080/09644016.2017.1319020.
Zhang, A. et al., 2010: Effect of biochar amendment on yield and methane and nitrous oxide emissions from a rice paddy from Tai Lake plain, China. Agric. Ecosyst. Environ. , 139(4) , 469–475, doi:10.1016/j.agee.2010.09.003.
Zhang, B., A. Hastings, J.C. Clifton‐Brown, D. Jiang, and A.P.C. Faaij, 2020: Modeled spatial assessment of biomass productivity and technical potential of Miscanthus×giganteus, Panicum virgatum L. , and Jatropha on marginal land in China. GCB Bioenergy, 12(5) , 328–345, doi:10.1111/gcbb.12673.
Zhang, J.J. et al., 2017: Nutrient Expert Improves Nitrogen Efficiency and Environmental Benefits for Summer Maize in China. Agron. J. , 109(3) , 1082–1090, doi:10.2134/agronj2016.08.0477.
Zhao, N., J. Lehmann, and F. You, 2020: Poultry Waste Valorization via Pyrolysis Technologies: Economic and Environmental Life Cycle Optimization for Sustainable Bioenergy Systems. ACS Sustain. Chem. Eng. , 8(11) , 4633–4646, doi:10.1021/acssuschemeng.0c00704.
Zhao, Q. et al., 2016: A review of methodologies and success indicators for coastal wetland restoration. Ecol. Indic. , 60, 442–452, doi:10.1016/j.ecolind.2015.07.003.
Zhu, K., J. Zhang, S. Niu, C. Chu, and Y. Luo, 2018: Limits to growth of forest biomass carbon sink under climate change. Nat. Commun. , 9(1) , 2709, doi:10.1038/s41467-018-05132-5.
Zhu, P., Q. Zhuang, J. Eva, and C. Bernacchi, 2017: Importance of biophysical effects on climate warming mitigation potential of biofuel crops over the conterminous United States. GCB Bioenergy, 9, 577–590. https://doi.org/10. 1111/gcbb.12370.
Zhu, X. et al., 2020: Reductions in water, soil and nutrient losses and pesticide pollution in agroforestry practices: a review of evidence and processes. Plant Soil, 453(1–2) , 45–86, doi:10.1007/s11104-019-04377-3.
Zimmerman, A.R. and L. Ouyang, 2019: Priming of pyrogenic C (biochar) mineralization by dissolved organic matter and vice versa. Soil Biol. Biochem. , 130, 105–112, doi:10.1016/j.soilbio.2018.12.011.
Zomer, R.J. et al., 2016: Global Tree Cover and Biomass Carbon on Agricultural Land: The contribution of agroforestry to global and national carbon budgets. Sci. Rep. , 6(1) , 29987, doi:10.1038/srep29987.
Zougmoré, R., A. Jalloh, and A. Tioro, 2014: Climate-smart soil water and nutrient management options in semiarid West Africa: a review of evidence and analysis of stone bunds and zaï techniques. Agric. Food Secur. , 3(1) , 16, doi:10.1186/2048-7010-3-16.
Zschornack, T. et al., 2018: Soil CH4 and N2O Emissions from Rice Paddy Fields in Southern Brazil as Affected by Crop Management Levels: a Three-Year Field Study. Rev. Bras. Ciência do Solo, 42, doi:10.1590/18069657rbcs20170306.
Zygourakis, K., 2017: Biochar soil amendments for increased crop yields: How to design a “designer” biochar. AIChE J. , 63(12) , 5425–5437, doi:10.1002/aic.15870.
1 Global databases make different choices about which emissions and removals occurring on land are considered anthropogenic. Currently, net CO2 land fluxes from land reported by global book-keeping models used here differ from those from the aggregate global net emissions based on national GHG inventories. This difference, which has been considered in the literature, mainly reflects differences in how anthropogenic forest sinks and areas of managed land are defined. Other reasons for this difference, which are more difficult to quantify, can arise from the limited representation of land management in global models and varying levels of accuracy and completeness of estimated LULUCF fluxes in national GHG inventories. Neither method is inherently preferable. This chapter reports estimates from different databases and approaches, but uses CO2LULUCF from book-keeping models to report overall emissions to ensure consistency and comparability across chapters.
2 Bookkeeping models and dynamic global vegetation models.
3 Scenarios are considered consistent between global and regional results (based on R5 regions), if the sum of regional emissions (or sequestration efforts) does not deviate more than 10% from the reported global total. To take into account that small absolute values have a higher sensitivity, a deviation of 90% is allowed for absolute values below 100.


