Menu
IPCC Sixth Assessment Report
Working Group 1:
The Physical Science Basis
About
Report
Resources
Download
Back to all figures
Figures: Chapter 1
For all usages of AR6 WGI figures, please refer to the
IPCC Copyright Policy
.
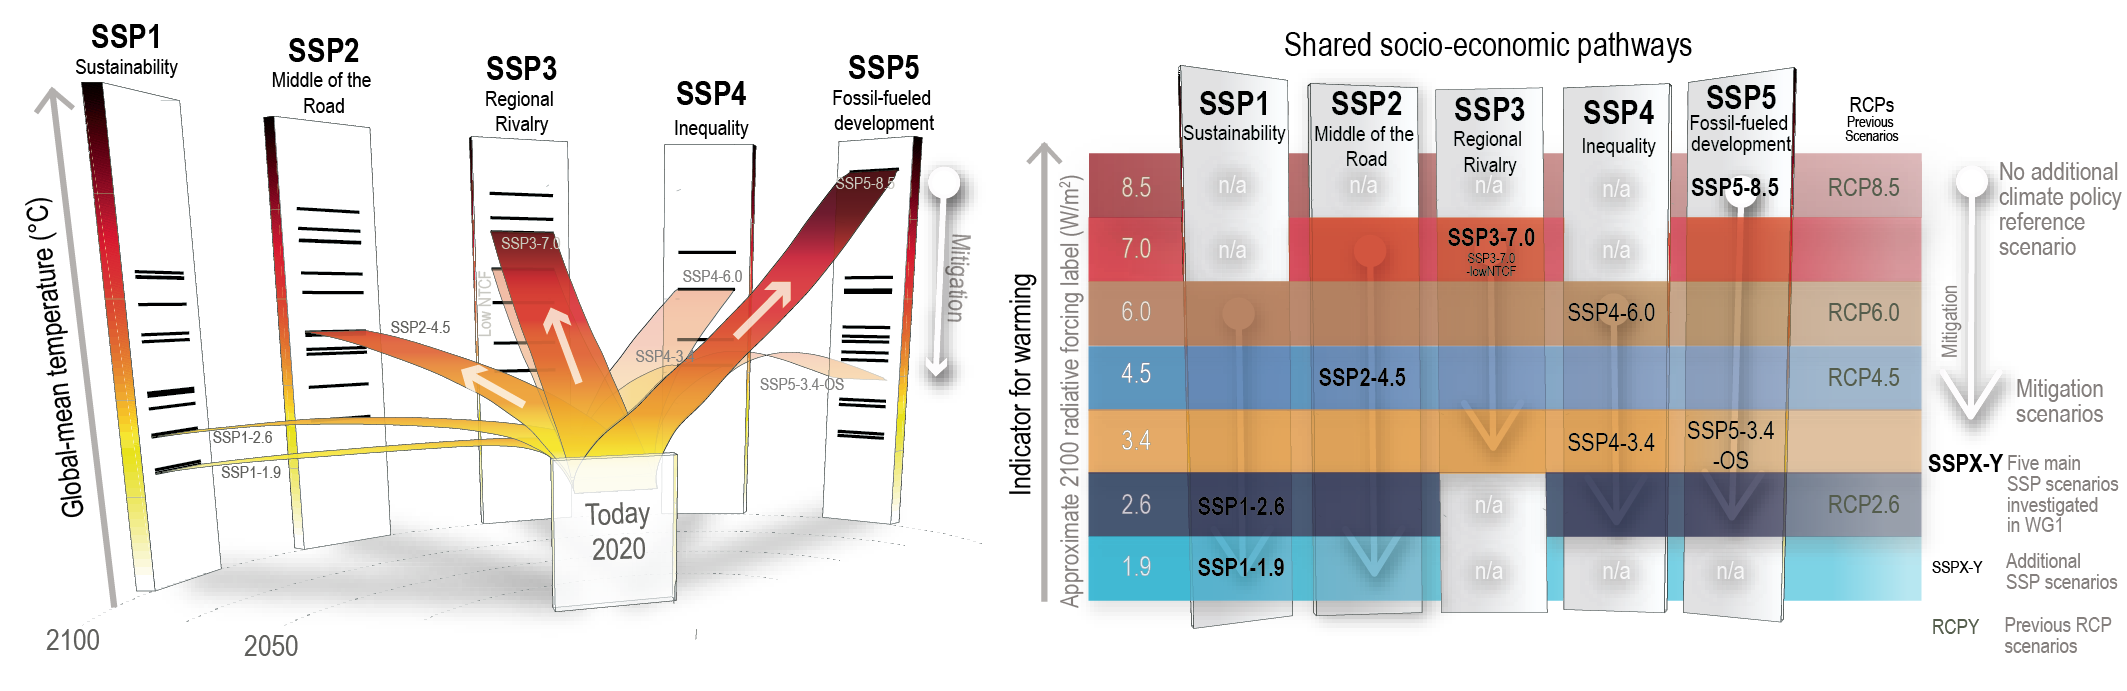
Figure 1.1
View
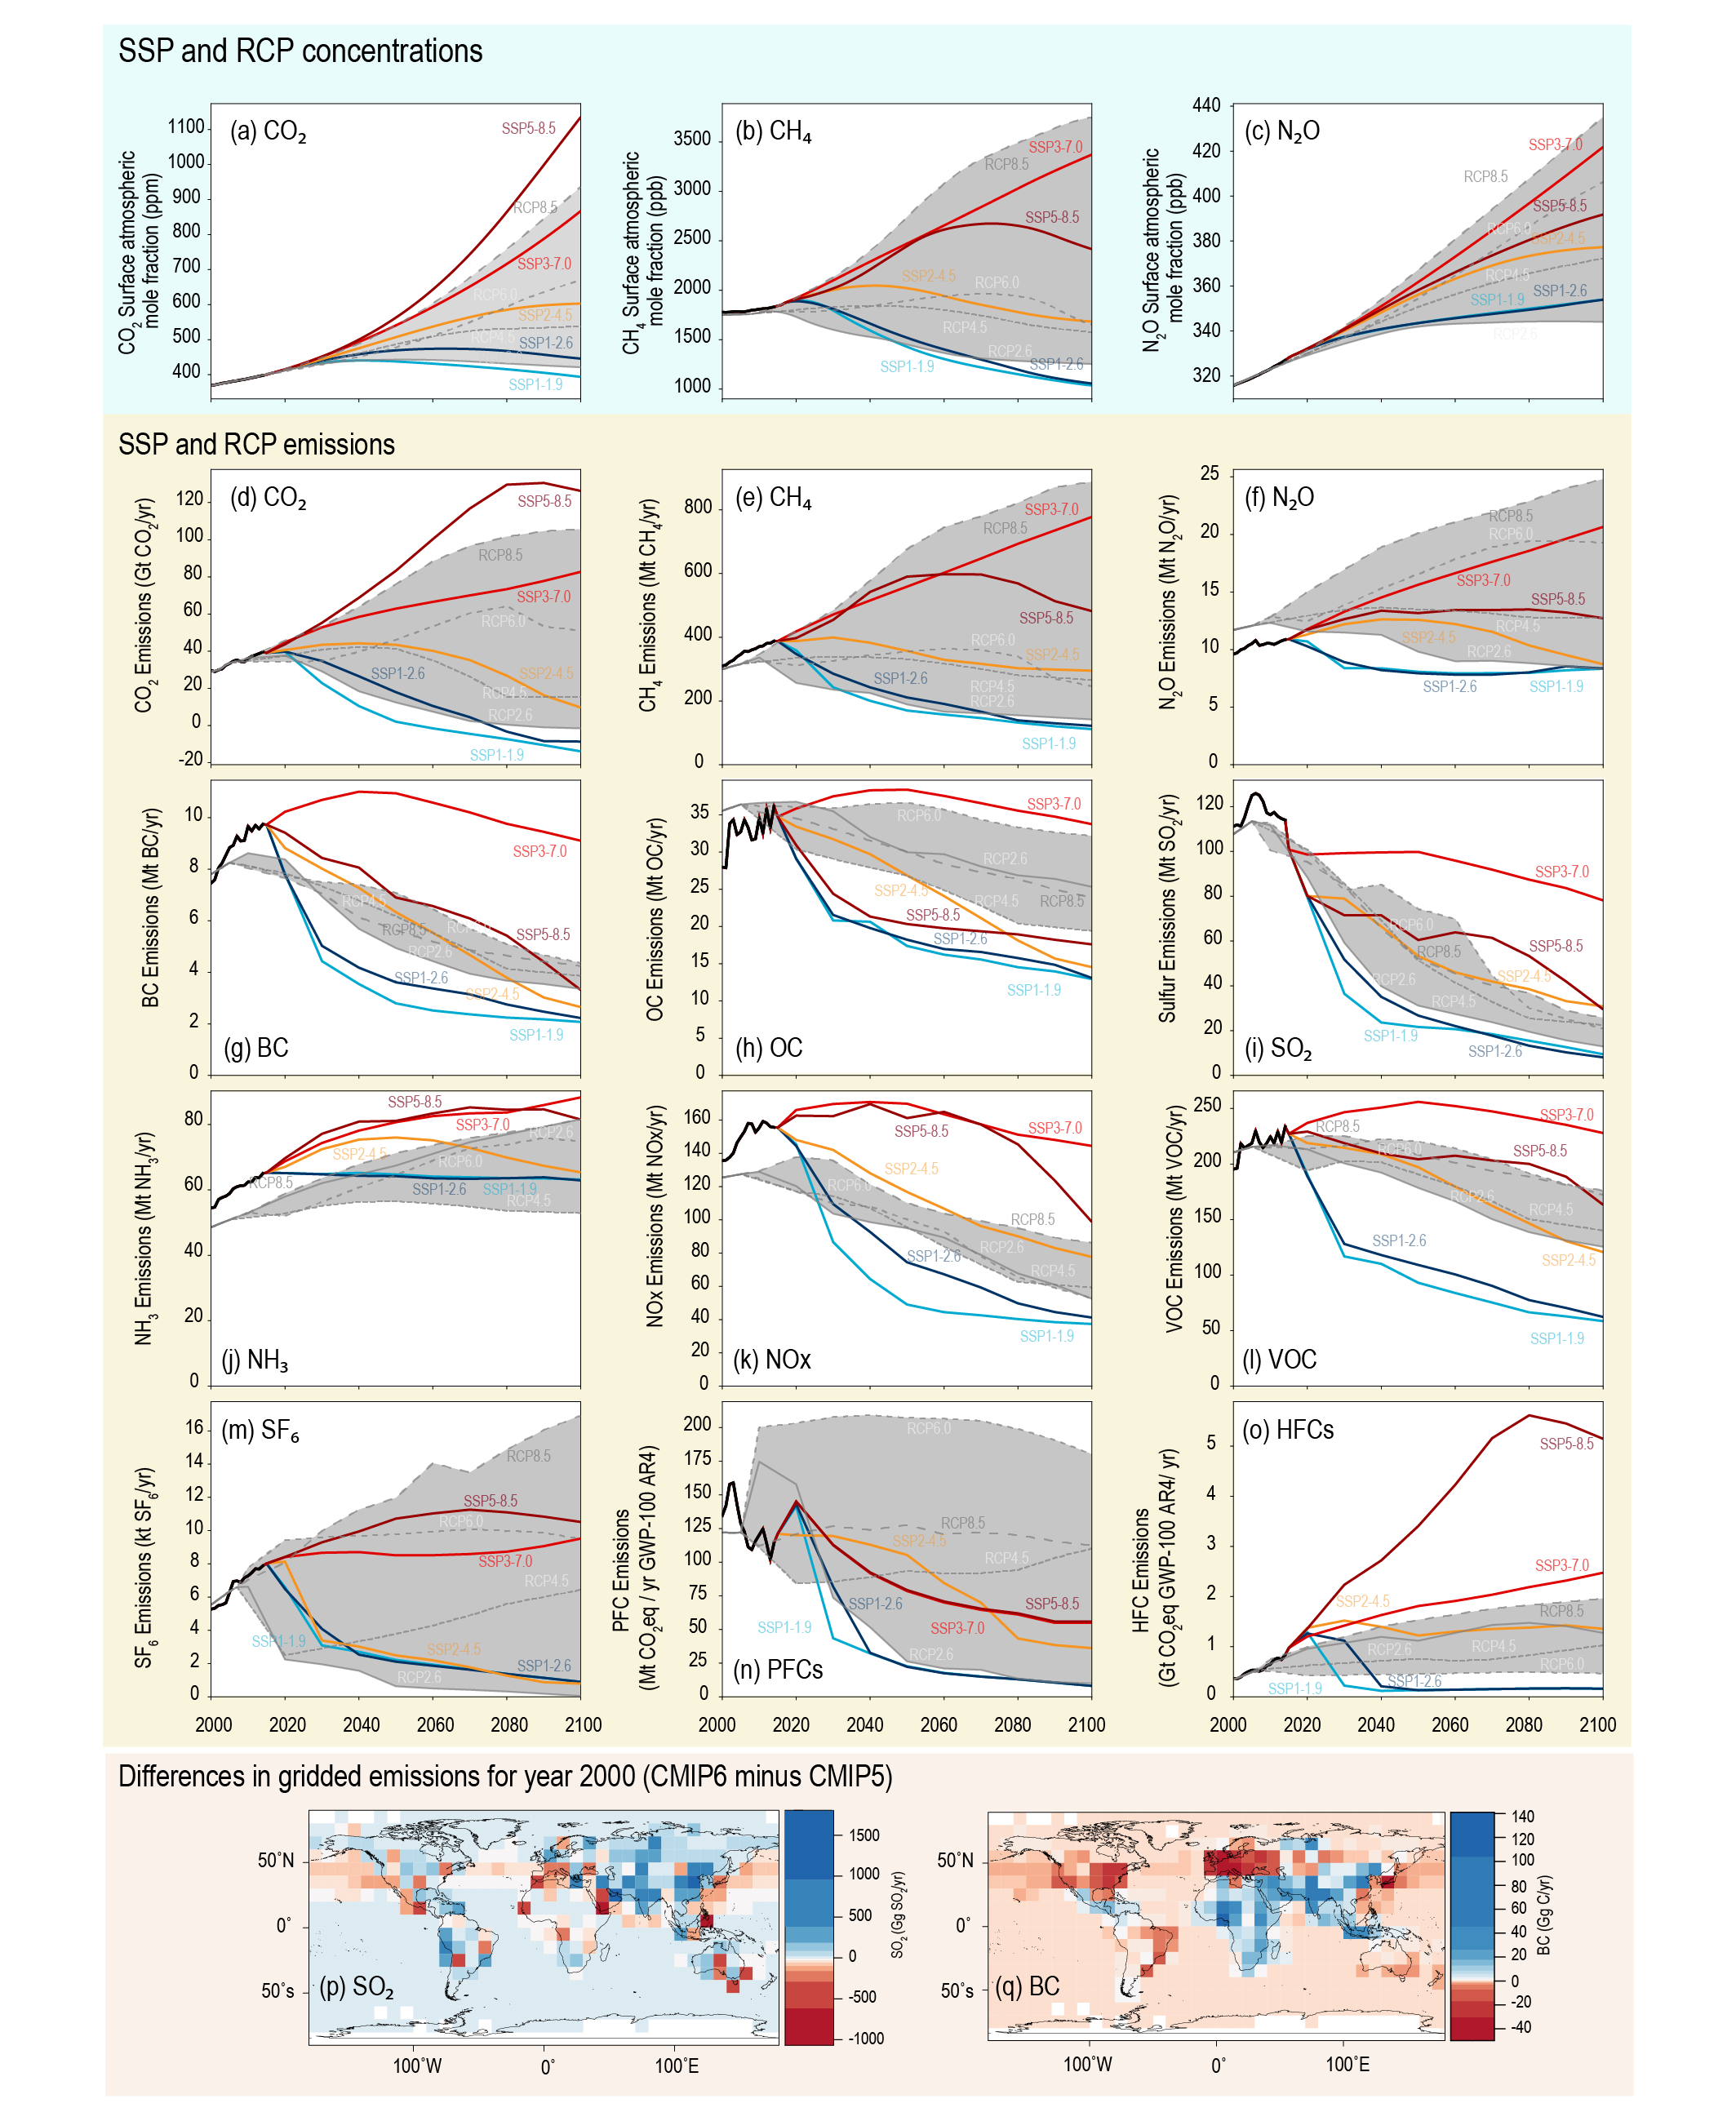
Figure 1.2
View
Figure 1.3
View
Figure 1.4
View
Figure 1.5
View
Figure 1.6
View
Figure 1.7
View
Figure 1.8
View
Figure 1.9
View
Figure 1.10
View
Figure 1.11
View
Figure 1.12
View
Figure 1.13
View
Figure 1.14
View
Figure 1.15
View
Figure 1.16
View
Figure 1.17
View
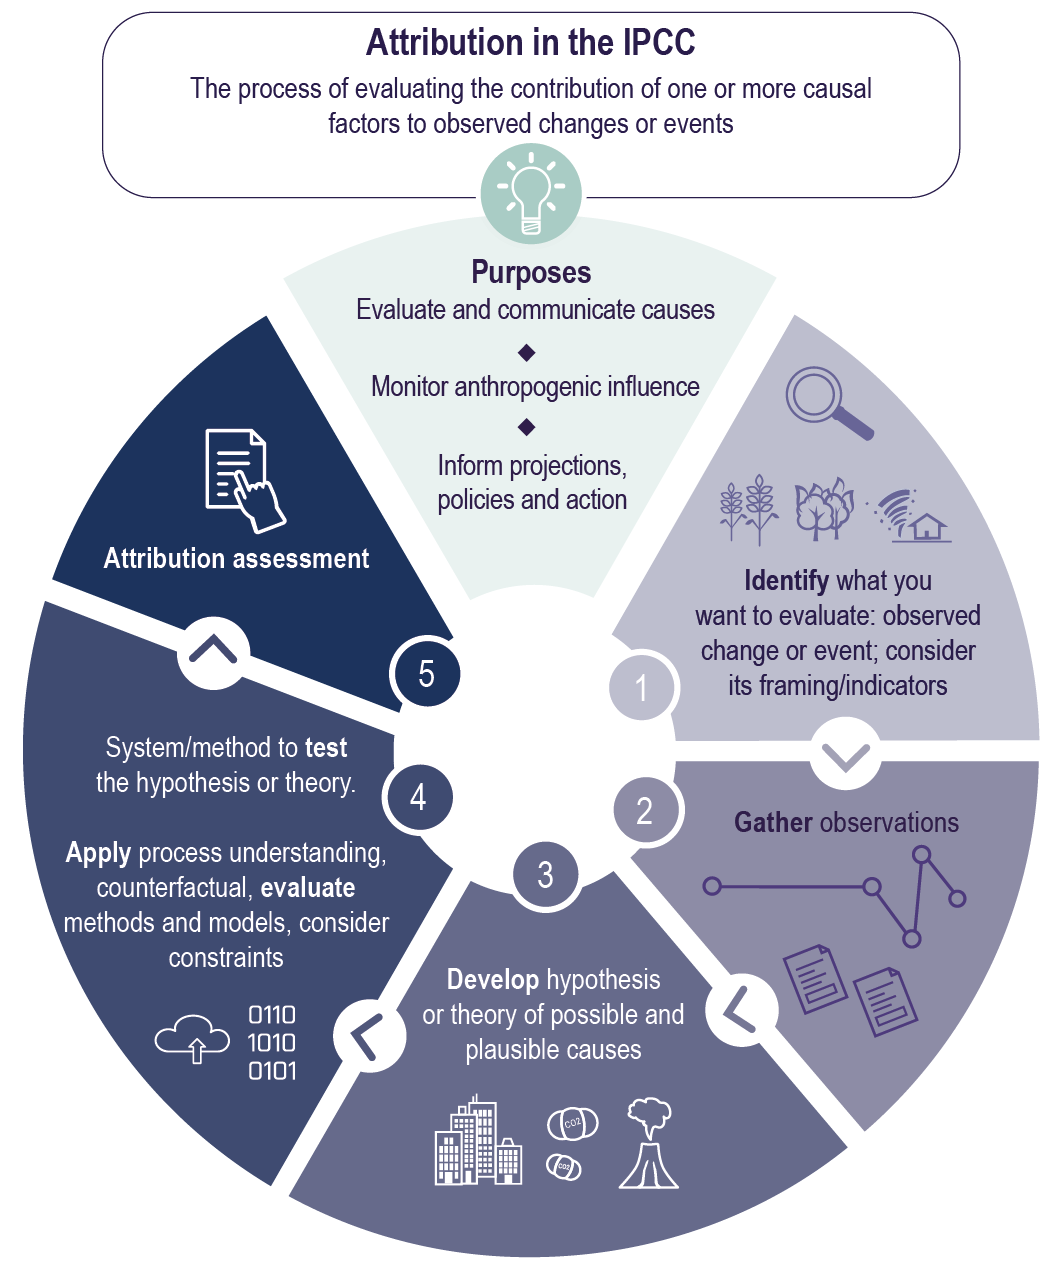
Cross-Working Group Box: Attribution, Figure 1
View
Figure 1.18
View
Figure 1.19
View
Figure 1.20
View
Figure 1.21
View
Figure 1.22
View
Figure 1.23
View
Figure 1.24
View
Figure 1.25
View
Figure 1.26
View
Figure 1.27
View
Figure 1.28
View
Figure 1.29
View
Box 1.1 Figure 1
View
Cross-Chapter Box 1.2, Figure 1
View
Cross-Chapter Box 1.4, Figure 1
View
Cross-Chapter Box 1.4, Figure 2
View
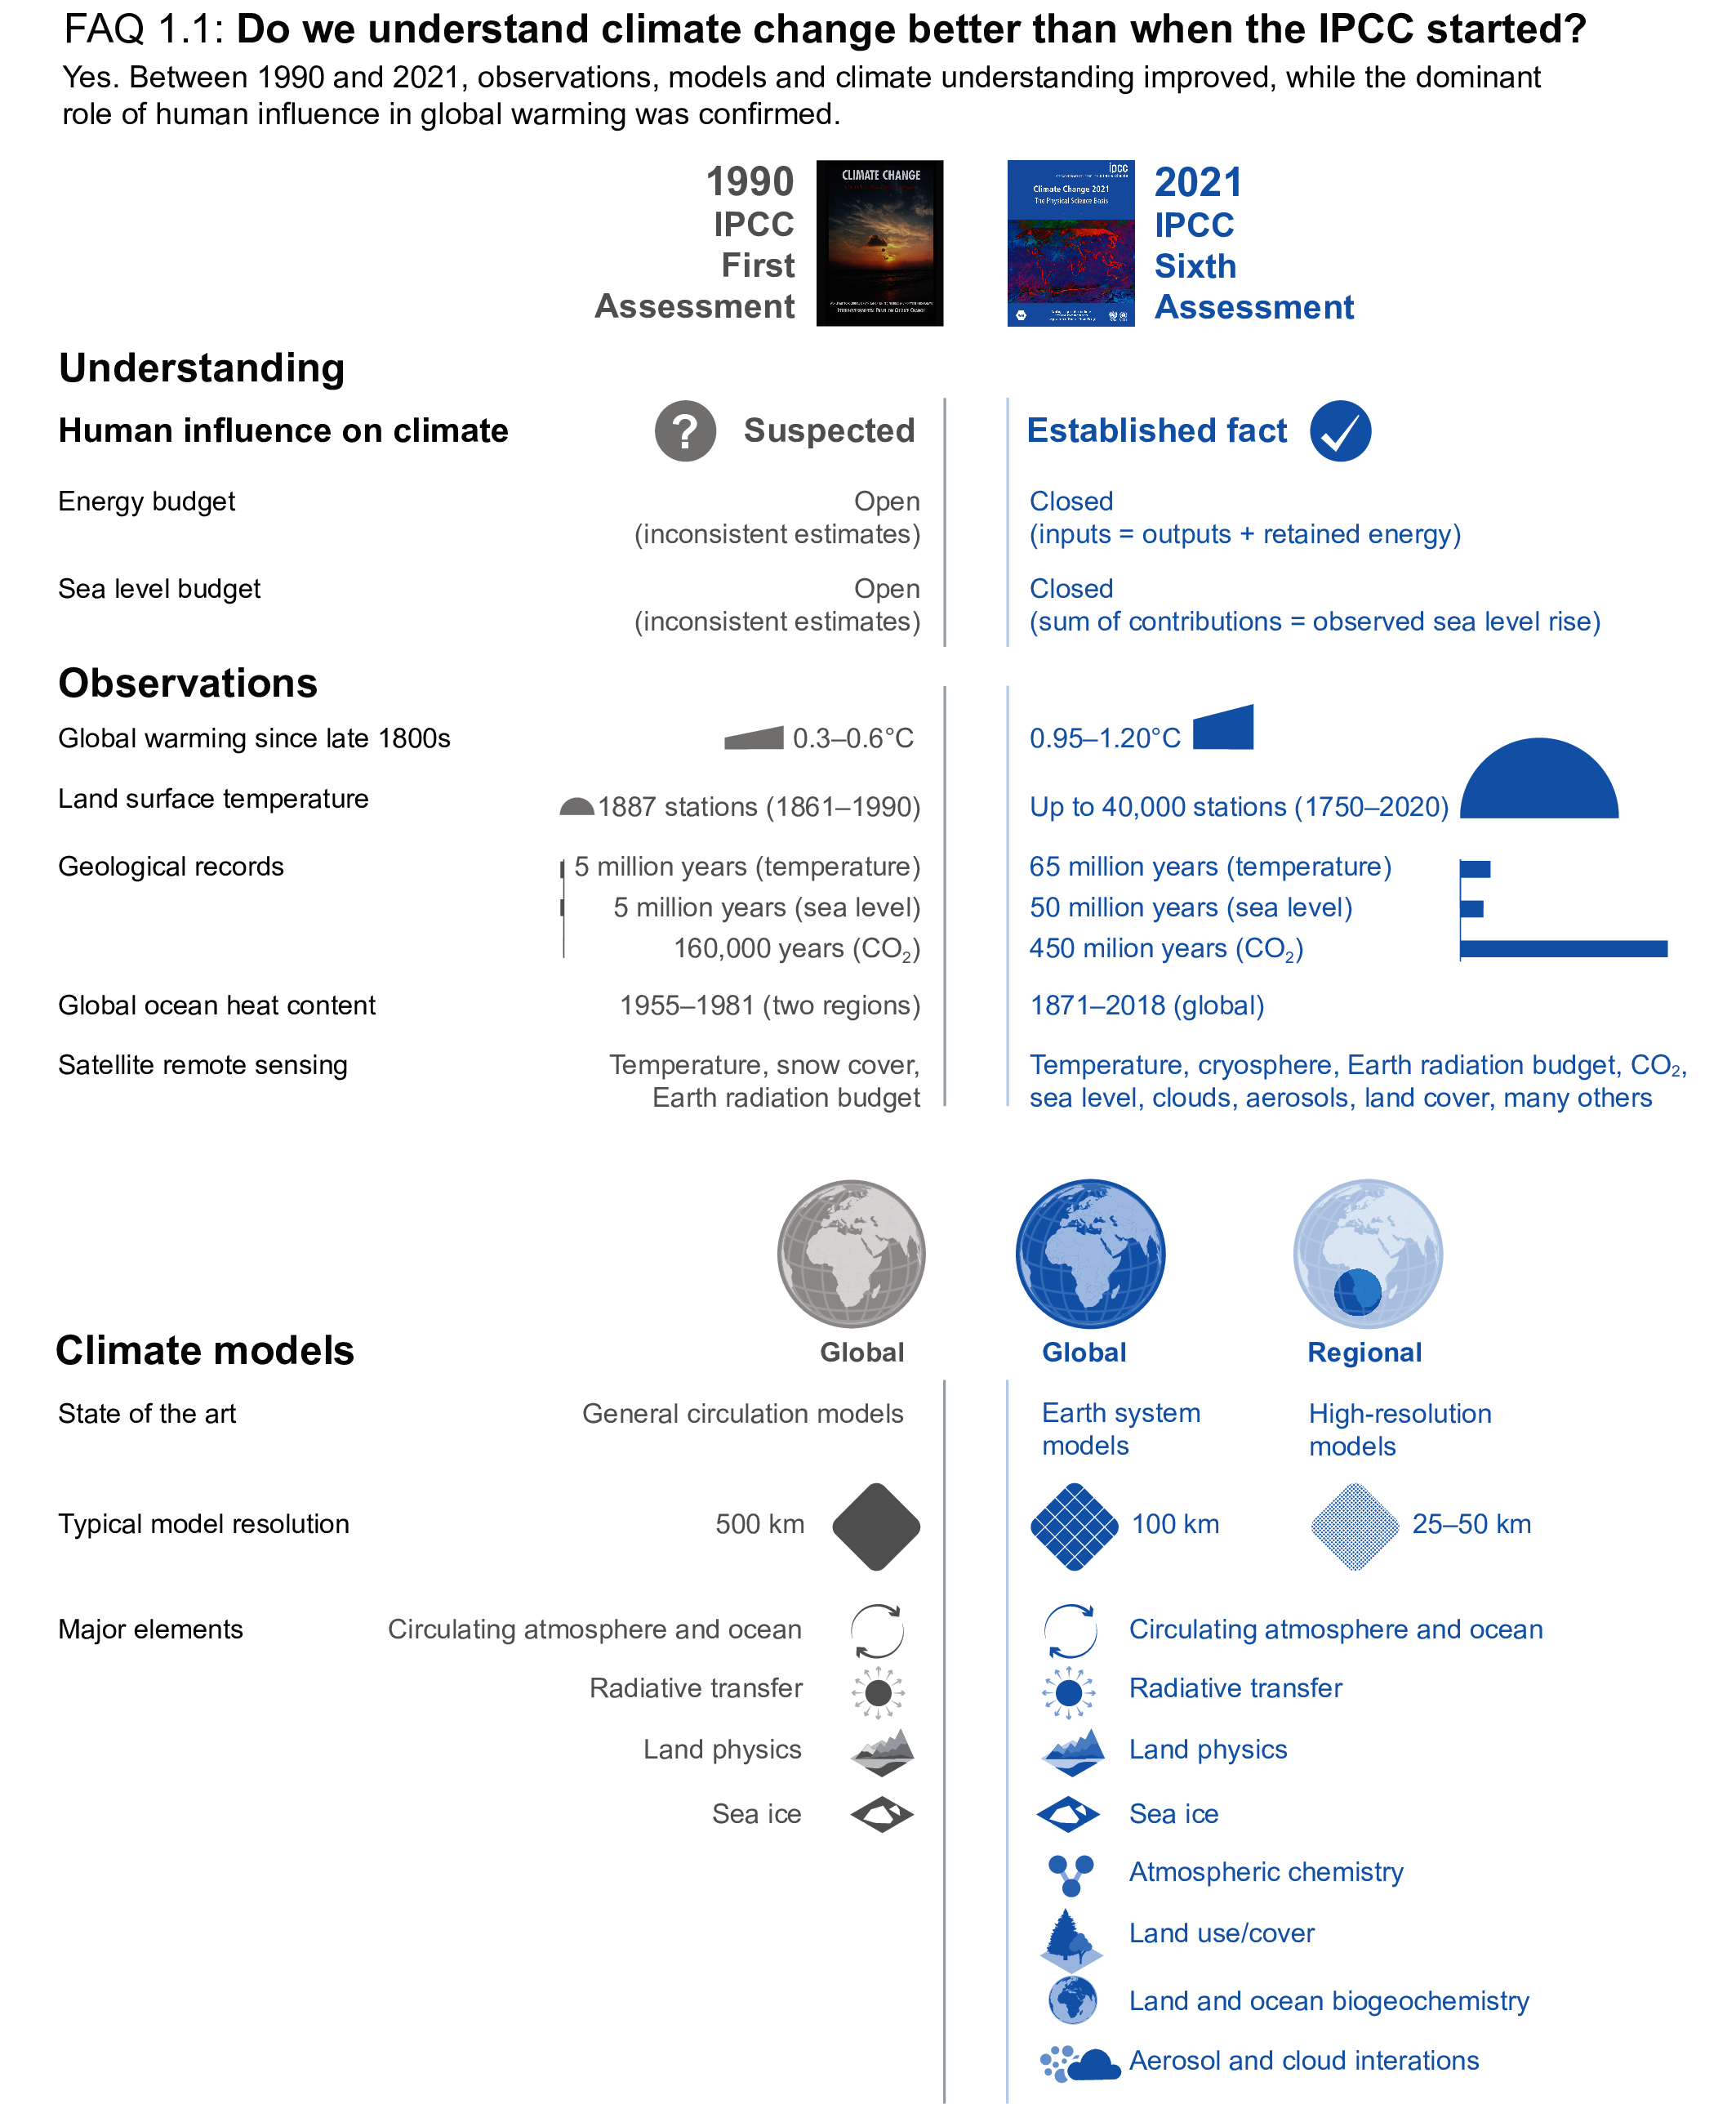
FAQ 1.1 Figure 1
View
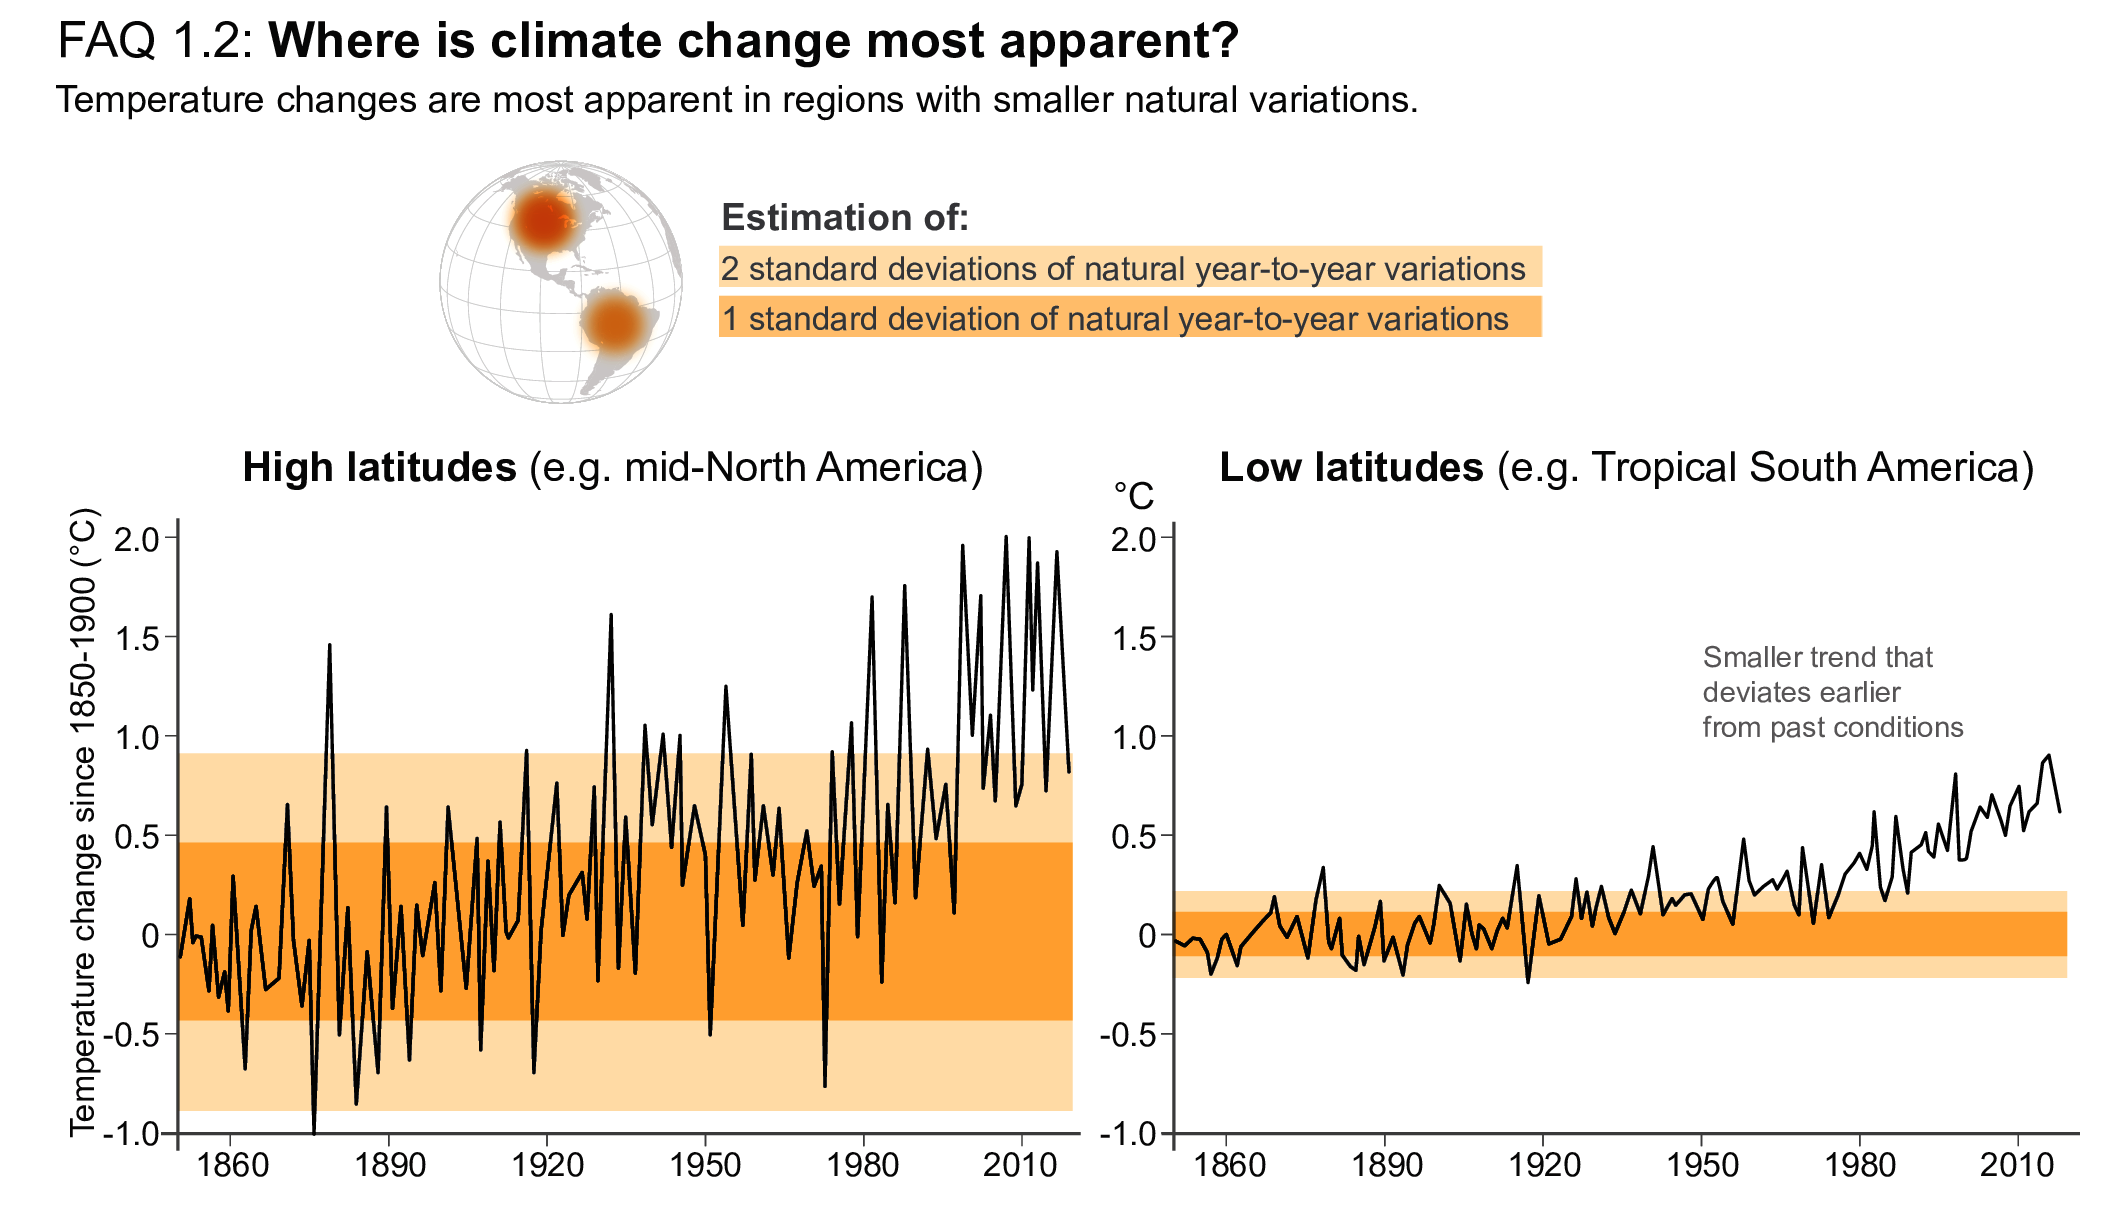
FAQ 1.2, Figure 1
View
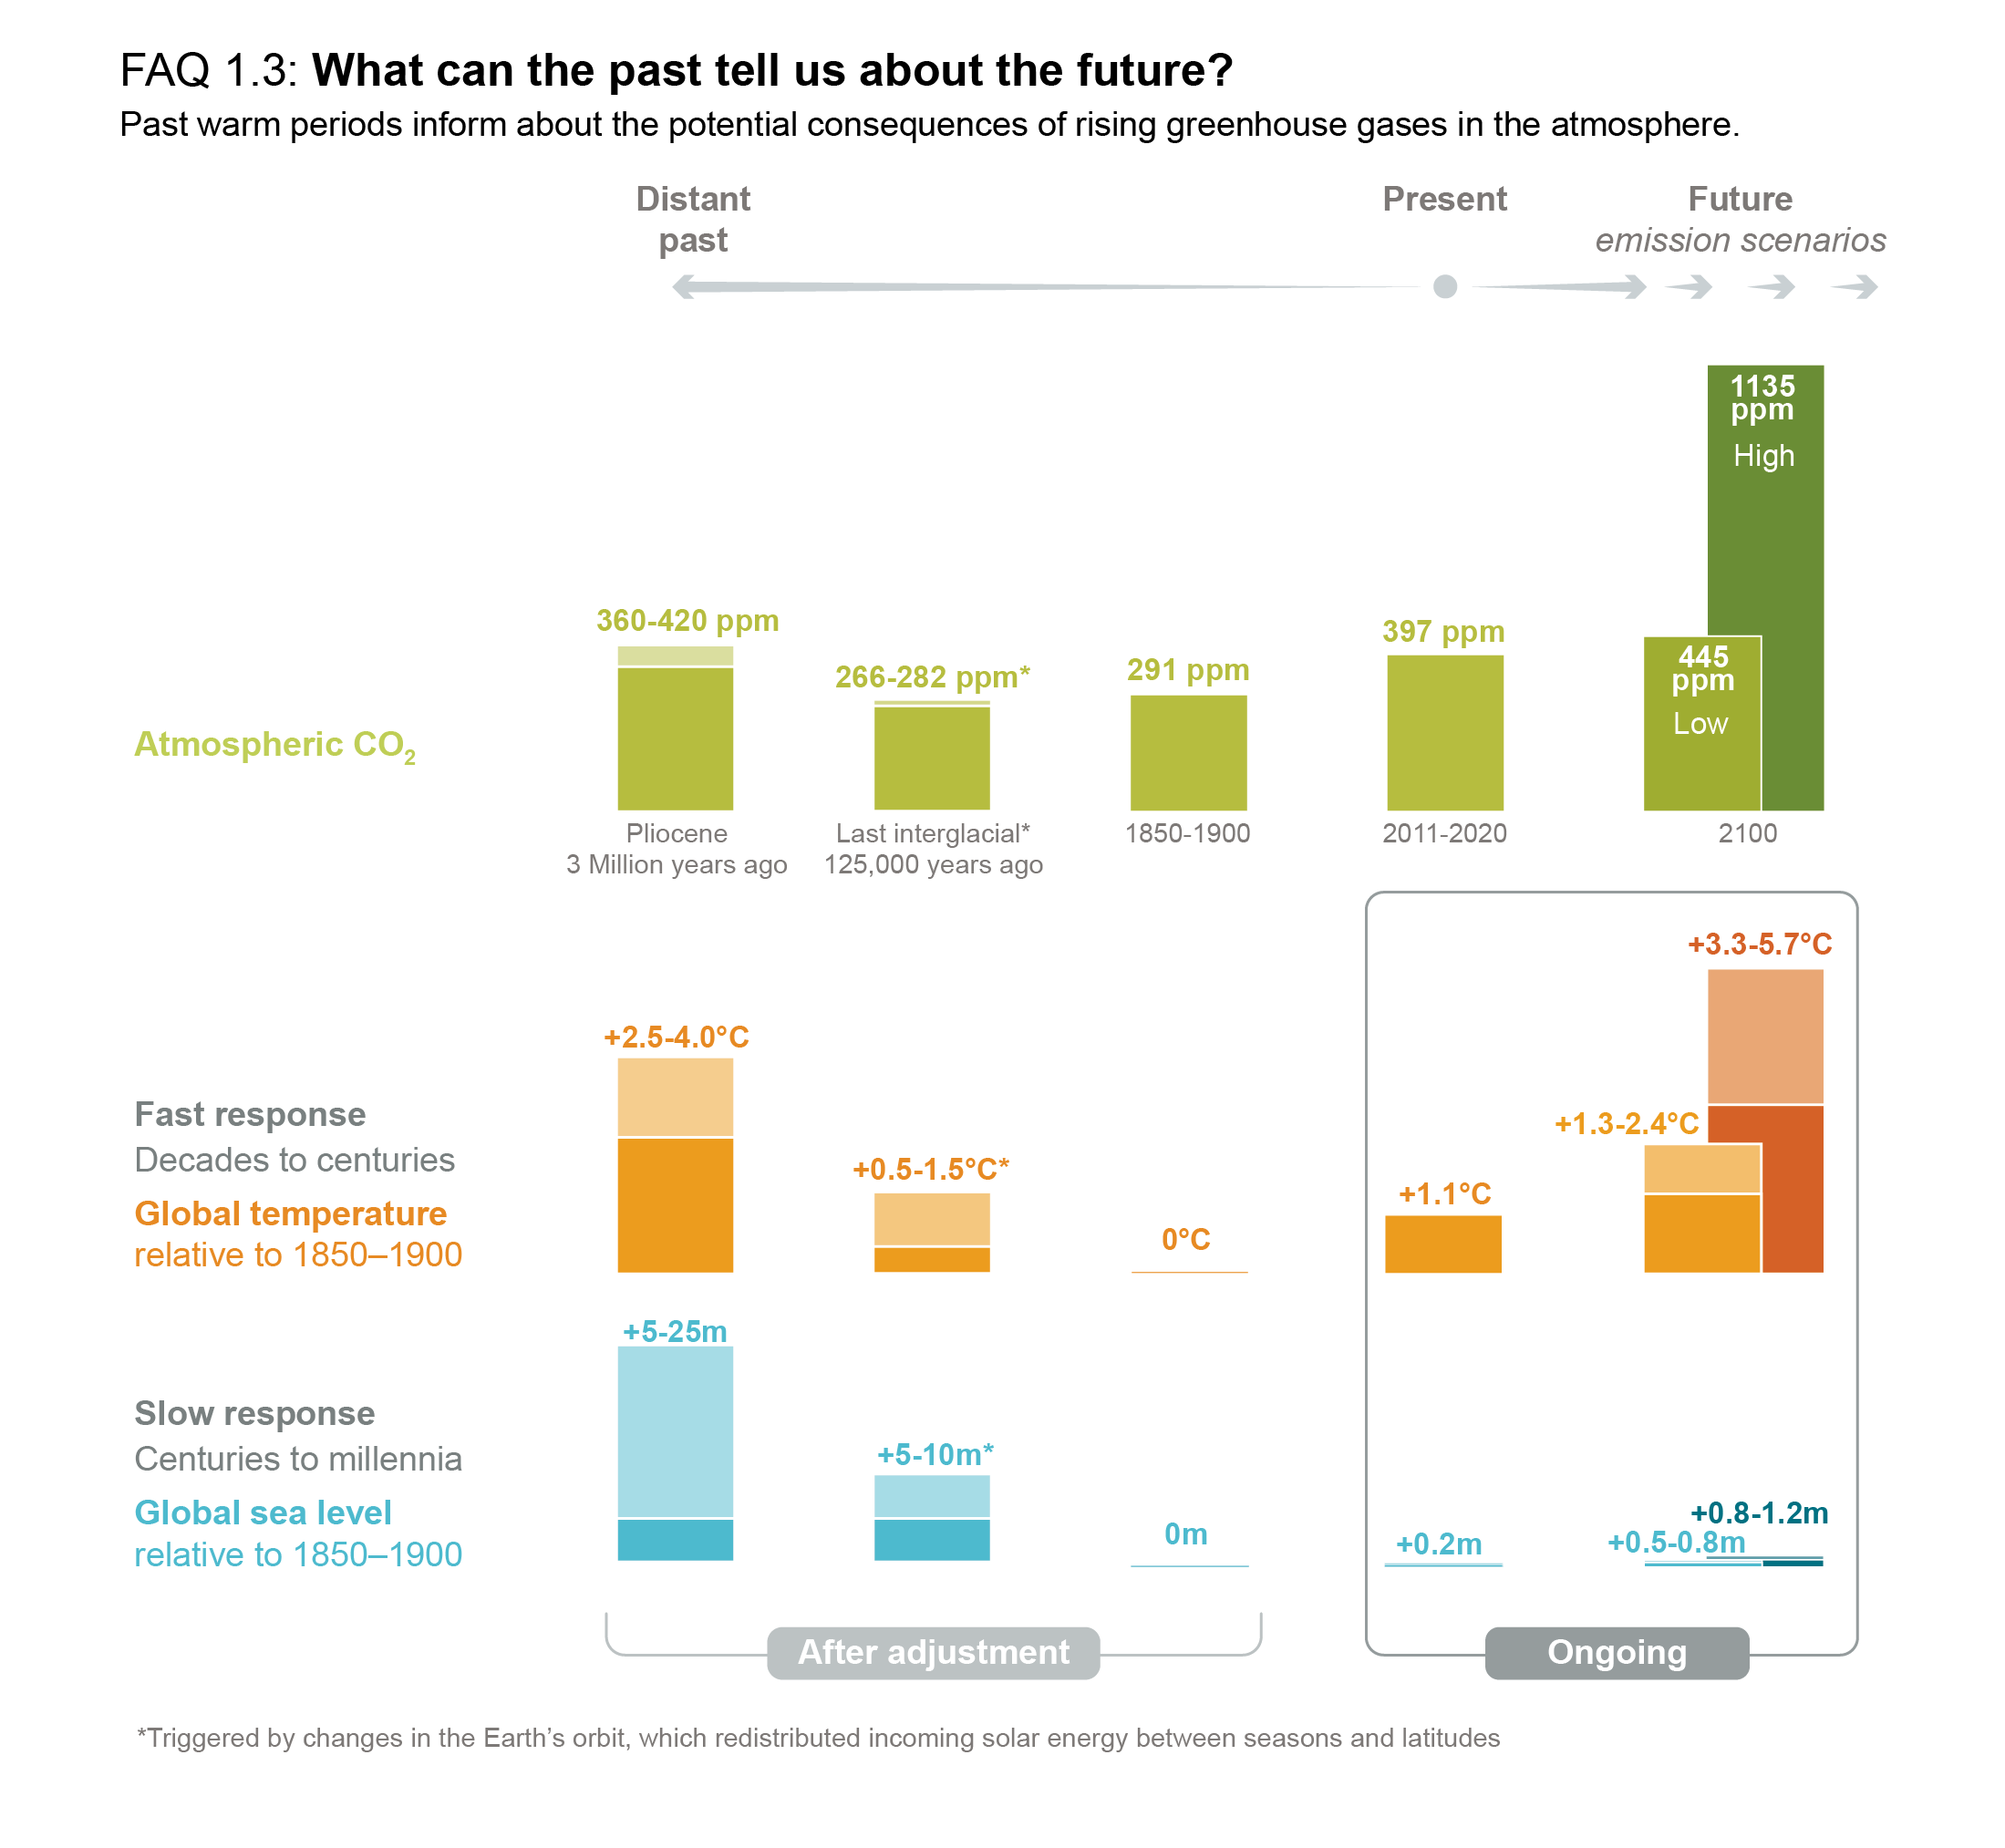
FAQ 1.3, Figure 1
View