Chapter 12: Climate Change Information for Regional Impact and for Risk Assessment


This chapter should be cited as:
Ranasinghe, R., A.C. Ruane, R. Vautard, N. Arnell, E. Coppola, F.A. Cruz, S. Dessai, A.S. Islam, M. Rahimi, D. Ruiz Carrascal, J. Sillmann, M.B. Sylla, C. Tebaldi, W. Wang, and R. Zaaboul, 2021: Climate Change Information for Regional Impact and for Risk Assessment. In Climate Change 2021: The Physical Science Basis. Contribution of Working Group I to the Sixth Assessment Report of the Intergovernmental Panel on Climate Change [Masson-Delmotte, V., P. Zhai, A. Pirani, S.L. Connors, C. Péan, S. Berger, N. Caud, Y. Chen, L. Goldfarb, M.I. Gomis, M. Huang, K. Leitzell, E. Lonnoy, J.B.R. Matthews, T.K. Maycock, T. Waterfield, O. Yelekçi, R. Yu, and B. Zhou (eds.)]. Cambridge University Press, Cambridge, United Kingdom and New York, NY, USA, pp. 1767–1926, doi: 10.1017/9781009157896.014.
Executive Summary
Climate change information is increasingly available and robust at regional scale for impacts and risk assessment. Climate services and vulnerability, impacts and adaptation studies require regional scale multi-decadal climate observations and projections. Since the IPCC Fifth Assessment Report (AR5), the increased availability of coordinated ensemble regional climate model projections and improvements in the level of sophistication and resolution of global and regional climate models, completed by attribution and sectoral vulnerability studies, have enabled the investigation of past and future evolution of a range of climatic quantities that are relevant to socio-economic sectors and natural systems. Chapter 12 consolidates core physical knowledge from preceding AR6 Working Group I (WGI) chapters and post-AR5 climate impact assessment literature to assess the spatio-temporal evolution of the climatic conditions that may lead to regional scale impacts and risks (following the sectoral classes adopted by AR6 WGII) in the world’s regions (presented in Chapter 1). {12.1}
The climatic impact-driver (CID) framework adopted in Chapter 12 allows for assessment of changing climate conditions that are relevant for regional impacts and risk assessment. CIDs are physical climate system conditions (e.g., means, events, extremes) that affect an element of society or ecosystems and are thus a priority for climate information provision. Depending on system tolerance, CIDs and their changes can be detrimental, beneficial, neutral or a mixture of each across interacting system elements, regions and society sectors. Each sector is affected by multiple CIDs and each CID affects multiple sectors. A CID can be measured by indices to represent related tolerance thresholds. {12.1–12.3}
The current climate in most regions is already different from the climate of the early or mid-20th century with respect to several CIDs. Climate change has already altered CID profiles and resulted in shifts in the magnitude, frequency, duration, seasonality and spatial extent of associated indices (high confidence). Changes in temperature-related CIDs such as mean temperatures, growing season length, extreme heat and frost have already occurred and many of these changes have been attributed to human activities (medium confidence). Mean temperatures and heat extremes have emerged above natural variability in all land regions (high confidence). In tropical regions, recent past temperature distributions have already shifted to a range different to that of the early 20th century (high confidence). Ocean acidification and deoxygenation have already emerged over most of the global open ocean, as has reduction in Arctic sea ice (high confidence). Using CID index distributions and event probabilities accurately in both current and future risk assessments requires accounting for the climate change-induced shifts in distributions that have already occurred. {12.4, 12.5}
Several impact-relevant changes have not yet emerged from the natural variability but will emerge sooner or later in this century depending on the emissions scenario (high confidence). Increasing precipitation is projected to emerge before the middle of the century in the high latitudes of the Northern Hemisphere (high confidence). Decreasing precipitation will emerge in a very few regions (Mediterranean, Southern Africa, south-western Australia) (medium confidence) by mid-century (medium confidence). The anthropogenic forced signal in near-coast relative sea level rise will emerge by mid-century RCP8.5 in all regions with coasts, except in the West Antarctic region where emergence is projected to occur before 2100 (medium confidence). The signal of ocean acidification in the surface ocean is projected to emerge before 2050 in every ocean basin (high confidence). However, there is limited evidence of drought trends emerging above natural variability in the 21st century. {12.5}
Every region of the world will experience concurrent changes in multiple CIDs by mid-century (high confidence), challenging the resilience and adaptation capacity of the region. Changes in heat, cold, snow and ice, coastal, oceanic, and CO2 at surface CIDs are projected with high confidence in most regions, indicating worldwide challenges, while additional region-specific changes are projected in other CIDs that may lead to more regional challenges. High confidence increases in some of the drought, aridity and fire weather CIDs will challenge, for example, agriculture, forestry, water systems, health and ecosystems in Southern Africa, the Mediterranean, North Central America, Western North America, the Amazon regions, South-Western South America, and Australia. High confidence changes in snow, ice and pluvial or river flooding will pose challenges for, for example, energy production, river transportation, ecosystems, infrastructure and winter tourism in North America, Arctic regions, Andes regions, Europe, Siberia, Central, South and East Asia, Southern Australia and New Zealand. Only a few CIDs are projected to change with high confidence in the Sahara, Madagascar, Arabian Peninsula, Western Africa and Small Islands; however, the lower confidence levels for CID changes in these regions can originate from knowledge gaps or model uncertainties, and does not necessarily mean that these regions have relatively low risk. {12.5}
Worldwide changes in heat, cold, snow and ice, coastal, oceanic and CO2-related CIDs will continue over the 21st century, albeit with regionally varying rates of change, regardless of the climate scenario (high confidence). In all regions there is high confidence that, by 2050, mean temperature and heat extremes will increase, and there is high confidence that sea surface temperature will increase in all oceanic regions except the North Atlantic. Apart from a few regions with substantial land uplift, relative sea level rise is very likely to virtually certain (depending on the region) to continue in the 21st century, contributing to increased coastal flooding in most low-lying coastal areas (high confidence) and coastal erosion along most sandy coasts (high confidence), while ocean acidification is virtually certain to increase. It is virtually certain that atmospheric CO2 at the surface will increase in all emissions scenarios until net zero emissions are achieved. Glaciers will continue to shrink and permafrost to thaw in all regions where they are present (high confidence). These changes will lead to climate states with no recent analogue that are of particular importance for specific regions such as tropical forests or biodiversity hotspots. {12.4}
A wide range of region-specific CID changes relative to recent past are expected with high ormedium confidence, by 2050 and beyond. Most of these changes concern CIDs related to the water cycle and storms. Agricultural and ecological drought changes are generally of higher confidence than hydrological drought changes, with increases projected in North and Southern Africa, Madagascar, Southern and Eastern Australia, some regions of Central and South America, Mediterranean Europe, Western North America and North Central America (medium to high confidence). Fire weather conditions will increase by 2050 under RCP4.5 or above in several regions in Africa, Australia, several regions of South America, Mediterranean Europe, and North America (medium to high confidence). Extreme precipitation and pluvial flooding will increase in many regions around the world (high confidence). Increases in river flooding are also expected in Western and Central Europe and in polar regions (high confidence), most of Asia, Australasia, North America, the South American Monsoon region and South-Eastern South America (medium confidence). Mean winds are projected to slightly decrease by 2050 over much of Europe, Asia and Western North America, and increase in many parts of South America except Patagonia, West and South Africa and the eastern Mediterranean (medium confidence). Extratropical storms are expected to have a decreasing frequency but increasing intensity over the Mediterranean, increasing intensity over most of North America, and an increase in both intensity and frequency over most of Europe (medium confidence). Enhanced convective conditions are expected in North America (medium confidence). Tropical cyclones are expected to increase in intensity despite a decrease in frequency in most tropical regions (medium confidence). Climate change will modify multiple CIDs over Small Islands in all ocean basins, most notably those related to heat, aridity and droughts, tropical cyclones and coastal impacts. {12.4}
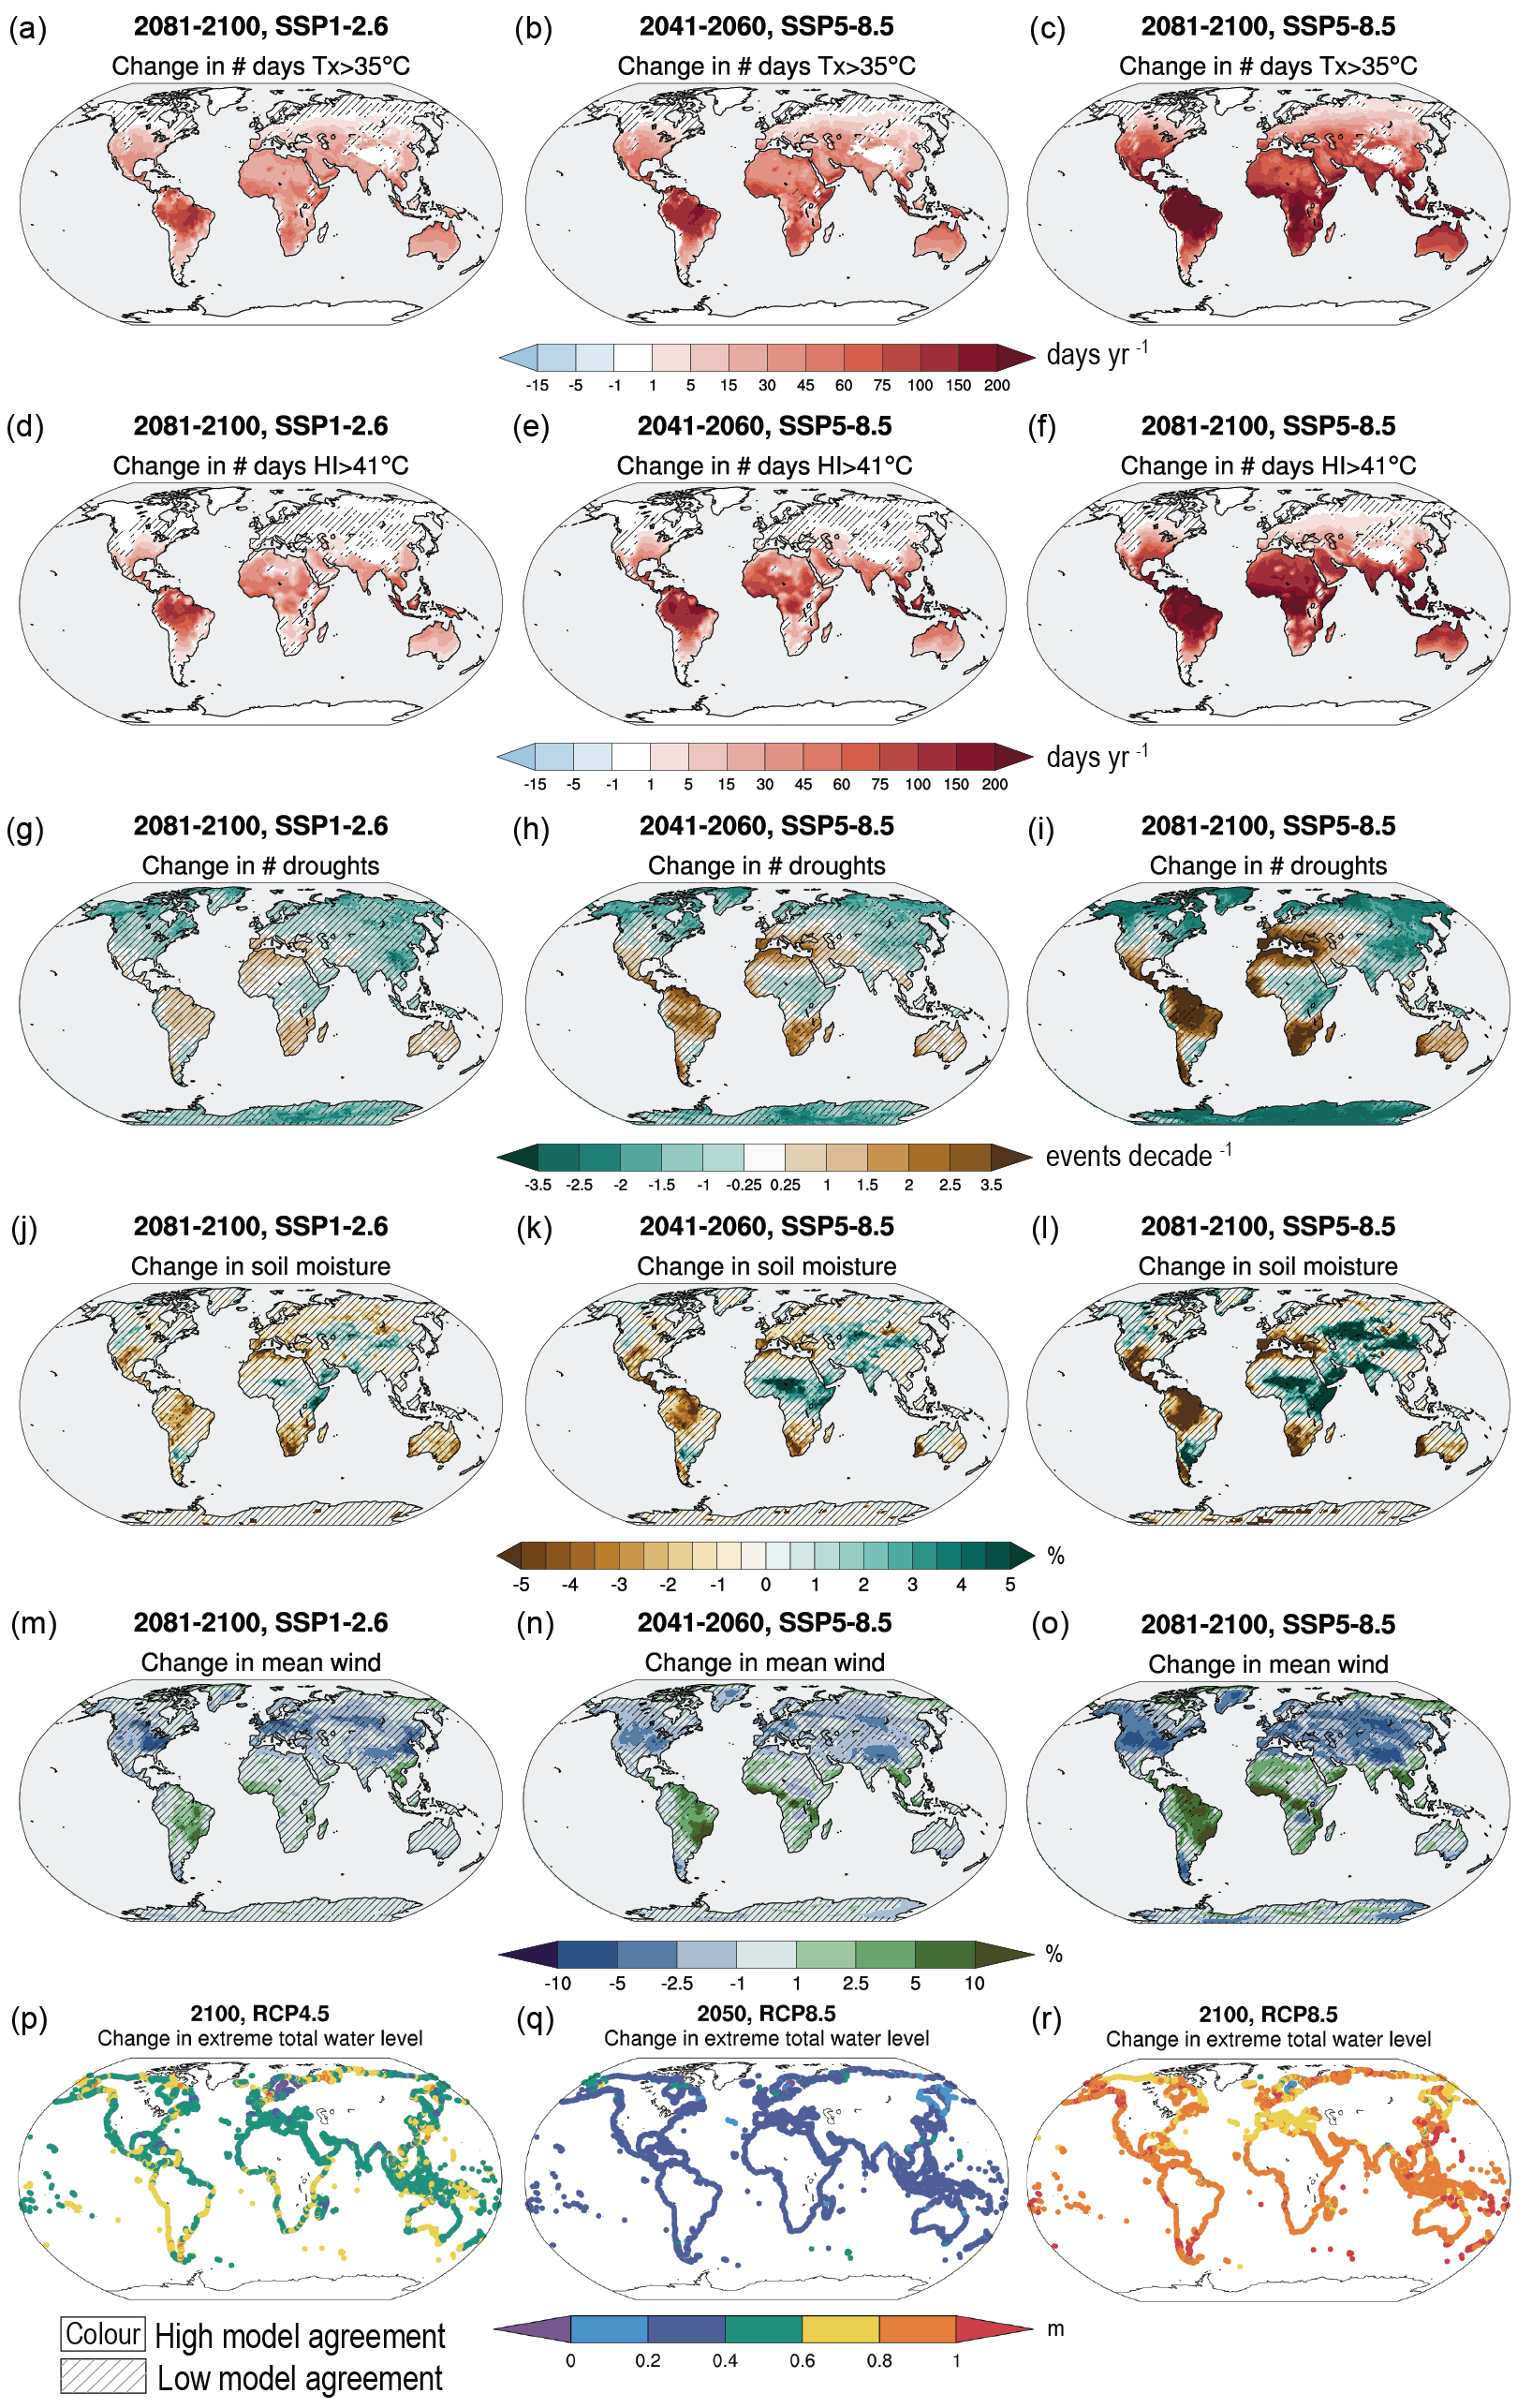
The level of confidence in the projected direction of change in CIDs and the intensity of the signal depend on mitigation efforts over the 21st century, as reflected by the differences between end-century projections for different climate scenarios. Dangerous humid heat thresholds, such as the US National Oceanic and Atmospheric Administration Heat Index (NOAA HI) of 41°C, will be exceeded much more frequently under the SSP5-8.5 scenario than under SSP1-2.6 and will affect many more regions (high confidence). In many tropical regions, the number of days per year where an HI of 41°C is exceeded will increase by more than 100 days relative to the recent past under SSP5-8.5, while this increase will be limited to less than 50 days under SSP1-2.6 (high confidence). The number of days per year where temperature exceeds 35°C will increase by more than 150 days in many tropical areas, such as the Amazon basin and South East Asia under SSP5-8.5, while it is expected to increase by less than two months in these areas under SSP1-2.6 (except for the Amazon Basin). There is high confidence that sandy shorelines will retreat in most regions of the world, in the absence of additional sediment sources or physical barriers to shoreline retreat. The total length of sandy shorelines around the world that are projected to retreat by more than 100 m by the end of the century is about 35% greater under RCP8.5 (about 130,000 km) compared to that under RCP 4.5 (about 95,000 km). The frequency of the present-day 1-in-100 year extreme sea level event (represented here by extreme total water level) is also projected to increase substantially in most regions (high confidence). In a globally averaged sense, the 1-in-100 year extreme sea level is projected to become an event that occurs multiple times per year under RCP8.5, while under RCP4.5 it is projected to become a one-in-five-year event, representing at least a five fold increase from RCP4.5 to RCP8.5. {12.4, 12.5}
There is low confidence in past and future changes of several CIDs. In nearly all regions there is low confidence in changes in hail, ice storms, severe storms, dust storms, heavy snowfall and avalanches, although this does not indicate that these CIDs will not be affected by climate change. For such CIDs, observations are short term or lack homogeneity, and models often do not have sufficient resolution or accurate parametrization to adequately simulate them over climate change time scales. {12.4}
Many global- and regional-scale CIDs have a direct relation to global warming levels (GWLs) and can thus inform the hazard component of ‘Representative Key Risks’ and ‘Reasons for Concern’ assessed by AR6 WGII. These include both mean and extreme heat, cold, wet and dry hazards; cryospheric hazards (snow cover, ice extent, permafrost); and oceanic hazards (marine heatwaves) (high confidence). For some of these, a quantitative relation can be drawn (high confidence). For example, with each degree of global surface air temperature (GSAT) warming, the magnitude and intensity of many heat extremes show a linear change, while some changes in frequency of threshold exceedances are exponential: Arctic temperatures warm about twice as fast as GSAT; global sea surface temperatures increase by about 80% of GSAT change; Northern Hemisphere spring snow cover decreases by about 8% per 1°C. For other hazards (e.g., ice-sheet behaviour, glacier mass loss, global mean sea level rise, coastal floods and coastal erosion) the time and/or scenario dimensions remain critical and a simple relation with GWLs cannot be drawn (high confidence), but still quantitative estimates assuming specific time frames and/or stabilized GWLs can be derived (medium confidence). Model uncertainty challenges the link between specific GWLs and tipping points and irreversible behaviour, but their occurrence cannot be excluded and their chances increase with warming levels (medium confidence). {CCB 12.1}
Since AR5, climate change information produced in climate service contexts has increased significantly due to scientific, technological advancements and growing user demand (very high confidence). Climate services involve the provision of climate information in such a way as to assist decision-making. These services include appropriate engagement from users and providers, are based on scientifically credible information and expertise, have an effective access mechanism, and respond to user needs. Climate services are being developed across regions, sectors, time scales and target users. {12.6}
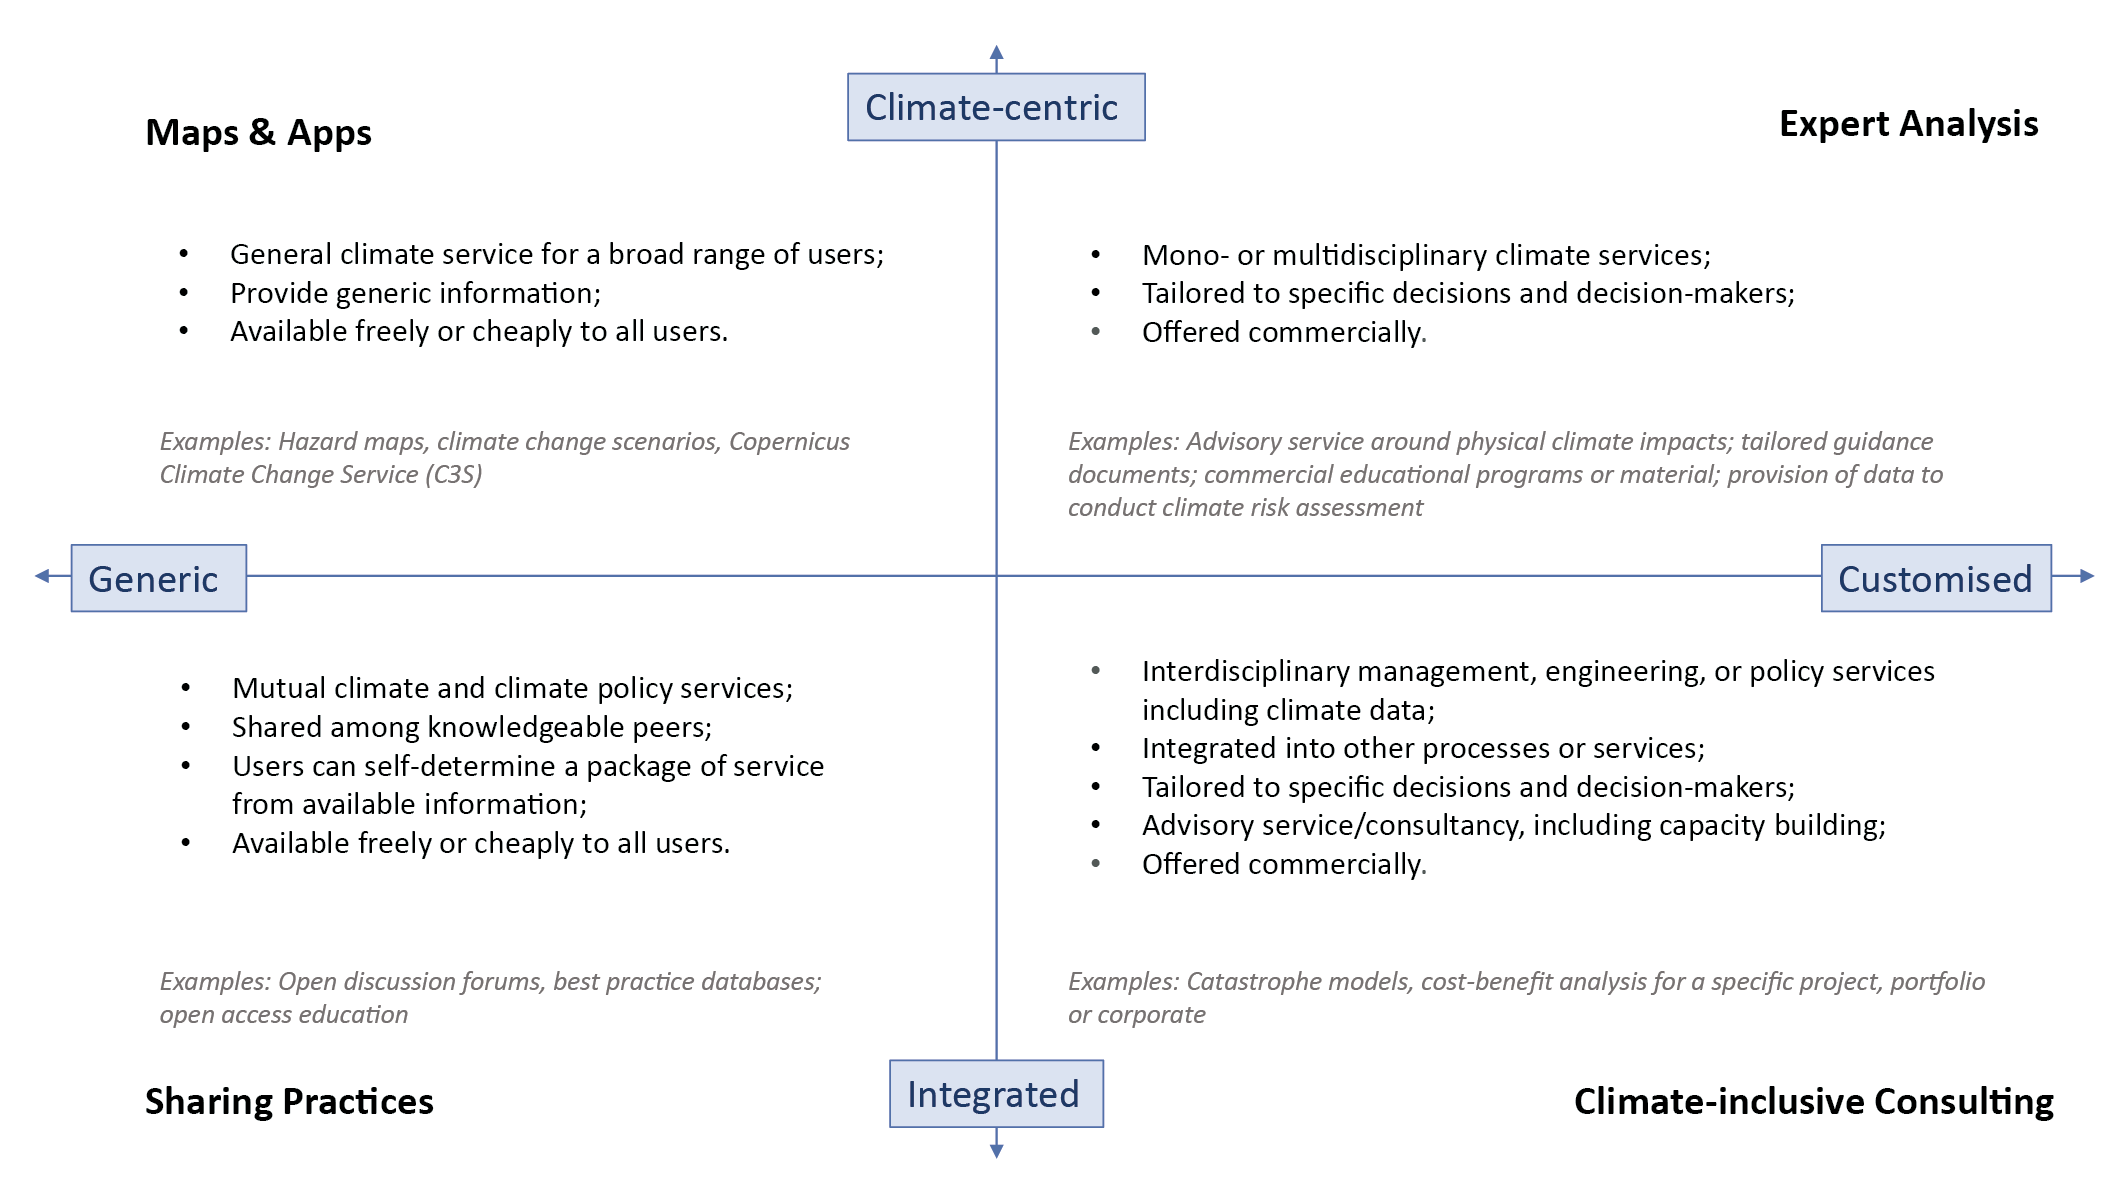
Climate services are growing rapidly and are highly diverse in their practices and products (very high confidence). The decision-making context, level of user engagement and co-production between scientists, practitioners and intended users are important determinants of the type of climate service developed and its utility supporting adaptation, mitigation and risk management decisions. User needs and decision-making contexts are very diverse and there is no universal approach to climate services. {12.6}
Realization of the full potential of climate services is often hindered by limited resources for the co-design and co-product ion process, including sustained engagement between scientists, service providers and users (high confidence). Further challenges relate to climate services development, provision of climate services, generation of climate service products, communication with users, and evaluation of the quality and socio-economic value of climate services. The development of climate services often uncovers and presents new research challenges to the scientific community. {12.6}
12.1 Framing
Climate change is already resulting in significant societal and environmental impacts and will induce major socio-economic damages in the future (AR5 WGII). The society, at large, benefits from information related to climate change risks, which enables the development of options to protect lives, preserve nature, build resilience and prevent avoidable loss and damage. Climate change can also lead to beneficial conditions that can be taken into account in adaptation strategies.
This chapter assesses climate change information relevant for regional impact and for risk assessment. It complements other WGI chapters that focus on the physical processes determining changes in the climate system and on methods for estimating regional changes.
Impacts of climate change are driven not only by changes in climate conditions, but also by changes in exposure and vulnerability (Cross-Chapter Box 1.3). This chapter concentrates on drivers of impacts that are of climatic origin (see also the IPCC Special Report on Global Warming of 1.5°C (SR1.5, IPCC, 2018), and Section 1.3.2 in this Report), referred to in WGI as ‘climatic impact-drivers’ (CIDs). CIDs are physical climate system conditions (e.g., means, events, extremes) that affect an element of society or ecosystems. Depending on system tolerance, CIDs and their changes can be detrimental, beneficial, neutral, or a mixture of each across interacting system elements and regions. However, this chapter largely focuses on drivers commonly connected to hazards, and adopts the IPCC risk framework (Cross-Chapter Box 1.3) since the main objective of the United Nations Framework Convention on Climate Change (UNFCCC) is to ‘prevent dangerous anthropogenic interference with the climate system’ (Article 2).
In some cases, risk assessments may require climate information beyond the CIDs identified in this chapter, with further impacts or risk modelling often driven by historical climate forcing datasets (e.g., Ruane et al., 2021) and full climate scenario time series (e.g., Lange, 2019) produced using methods described in Chapter 10. Chapter 12 focuses on the assessment of a finite number of drivers and how they are projected to evolve with climate change, in order to inform impact and risk assessments.
This chapter is new in IPCC WGI assessment reports, in that it represents a contribution to the ‘IPCC risk framework’. Within this framework, climate-related impacts and risks are determined through an interplay between the occurrence of climate hazards and their consequences depending on the exposure of the affected human or natural system and its vulnerability to the hazardous conditions. In Chapter 12, we are assessing climatic impact-drivers that could lead to hazards or to opportunities, from the literature and model results since AR5. This will particularly support the assessment of key risks related to climate change by WGII (Chapter 16). Despite the fact that impacts may also be induced by climate adaptation and mitigation policies themselves, as well as by socio-economic trends, changes in vulnerability or exposure, and external geophysical hazards such as volcanoes, the focus here is only on climatic impacts and risks induced by shifts in physical climate phenomena that directly influence human and ecological systems (Cross-chapter Box 1.3).
This chapter follows the terminology associated with the framing introduced in Chapter 1 (Cross-Chapter Box 1.2) and as found in Annex VII: Glossary. The highlighted terms below are introduced and used extensively in this chapter:
- Indices for climatic impact-drivers: numerically computable indices using one or a combination of climate variables designed to measure the intensity of the climatic impact-driver, or the probability of exceedance of a threshold. For instance, an index of heat inducing human health stress is the Heat Index (HI) that combines temperature and relative humidity (e.g., Burkart et al., 2011; Lin et al., 2012; Kent et al., 2014) and is used by the NOAA for issuing heat warnings.
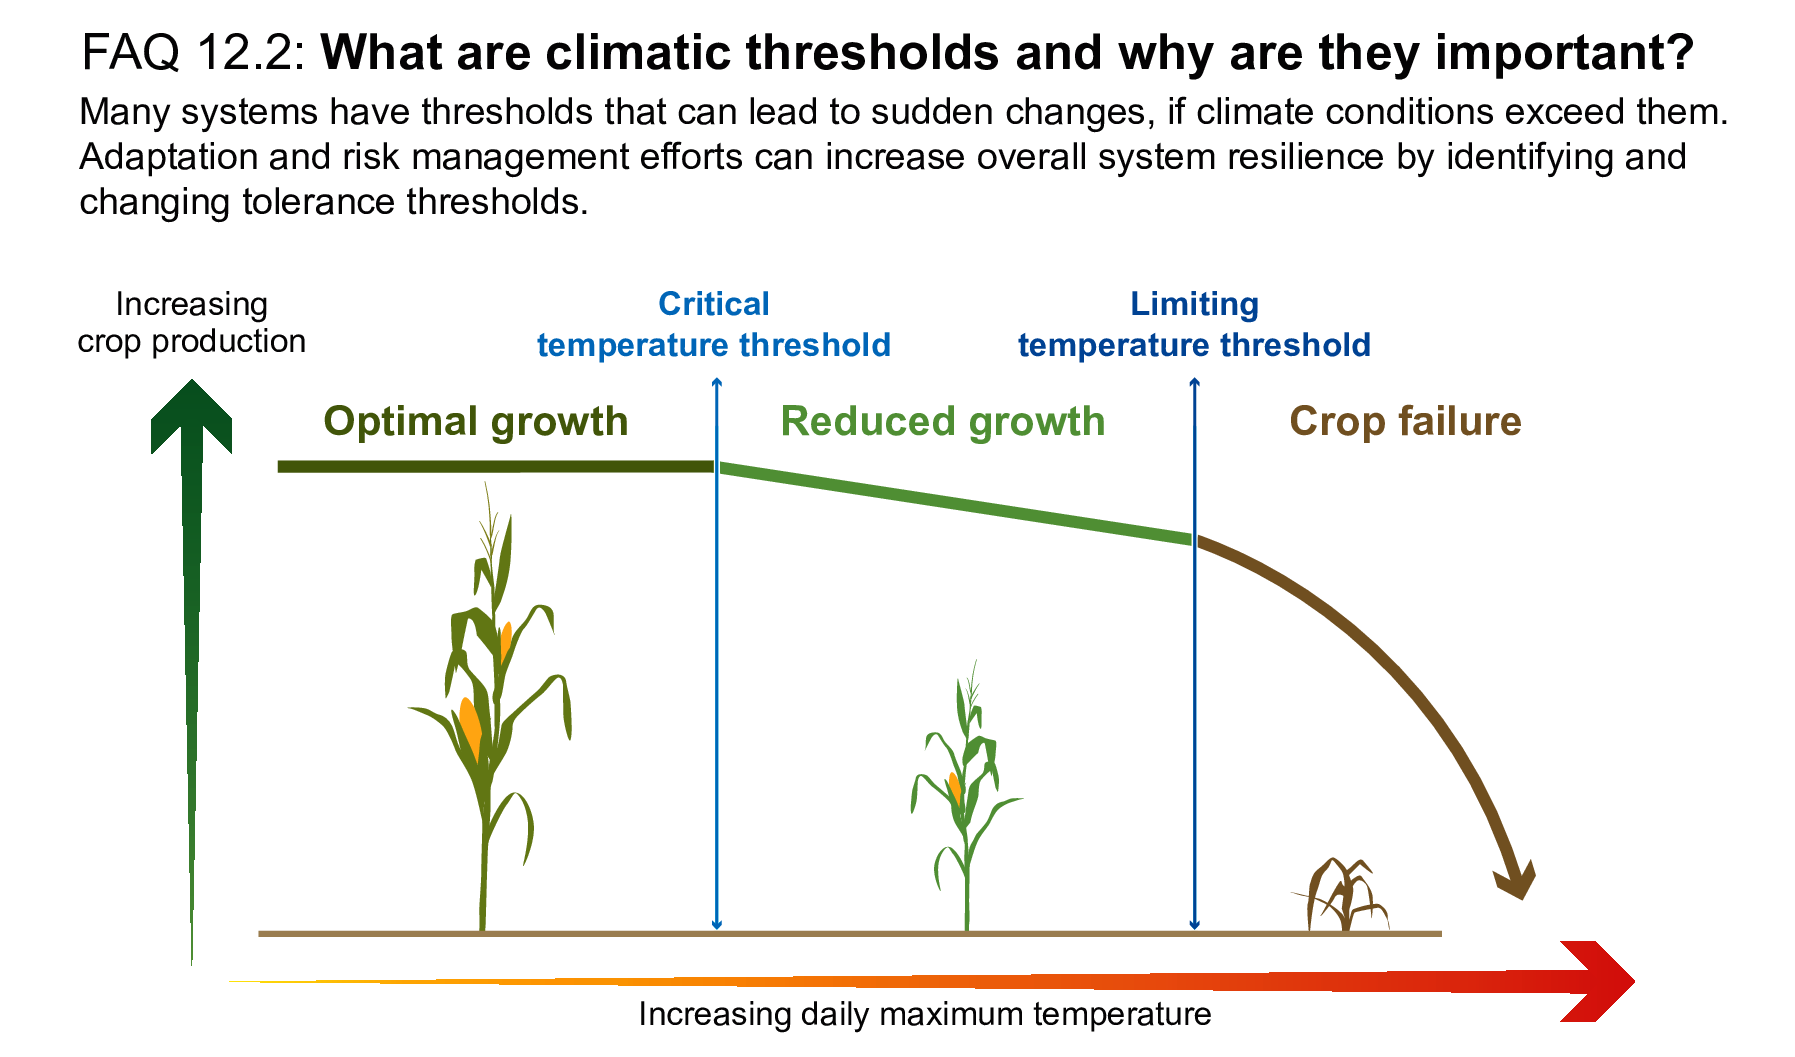
- Thresholds for climatic impact-drivers: an identified index value beyond which a climatic impact-driver interacts with vulnerability or exposure to create, increase or reduce an impact, risk or opportunity. Thresholds can be used to measure various aspects of the climatic impact-driver (magnitude or intensity, duration, frequency, timing, and spatial extent of threshold exceedance). For instance, a threshold of daily maximum temperature above 35°C is considered critical for maize pollination and production (e.g., Schauberger et al., 2017; Tesfaye et al., 2017).
The approach adopted here is consistent with the UN Sendai Framework for Disaster Risk Reduction 2015–2030, which aims to face disaster consequences (including but not limited to climate disasters) and reduce risks in natural, managed and built environments (Aitsi-Selmi et al., 2015; UNISDR, 2015). The classification of climatic impact-drivers in this chapter is largely consistent with the classification of hazards used in the Sendai Framework. However, the UNISDR hazard list spans a wider range of hazards inducing damage to society, including hazards that are not directly related to climate (such as volcanoes and earthquakes), which are excluded from the assessment herein. Furthermore, the UNISDR classification of hazards does not include mean climatic conditions, which are also discussed as climatic impact-drivers in this chapter. The first priority mentioned in the Sendai Framework is understanding disaster risk as a necessary step for action. Facilitating such an understanding is a clear goal of this chapter.
The chapter adopts a regional perspective (continental regions as defined in Chapter 1 and used in WGII; see Figure 1.18) on climatic impact-drivers to support decision-making across a wide audience of global and regional stakeholders in addition to governments (e.g., civil society organizations, public and private sectors, academia). While the focus here is on future changes, it also describes current levels and observed trends of CIDs as an important point of reference for informing adaptation strategies.
Figure 12.1 summarizes the rationale behind (Chapter 12 as the linkage (also referred to as a ‘handshake’) between WGI and WGII, illustrating how the changing profile of risk may be informed by an assessment of climatic impact-drivers, aligning WGI findings on physical climate change with WGII needs. The implementation of mitigation policy shifts may modulate hazard probability changes (i.e., by reducing emissions to limit global warming) as well as regional vulnerability and exposure. The assessment herein is organized around regional climatic impact-drivers, but also relates key indices and thresholds to increasing global drivers (such as mean surface warming) as a contribution to the assessment of ‘Reasons for Concern’ in WGII (O’Neill et al., 2017).
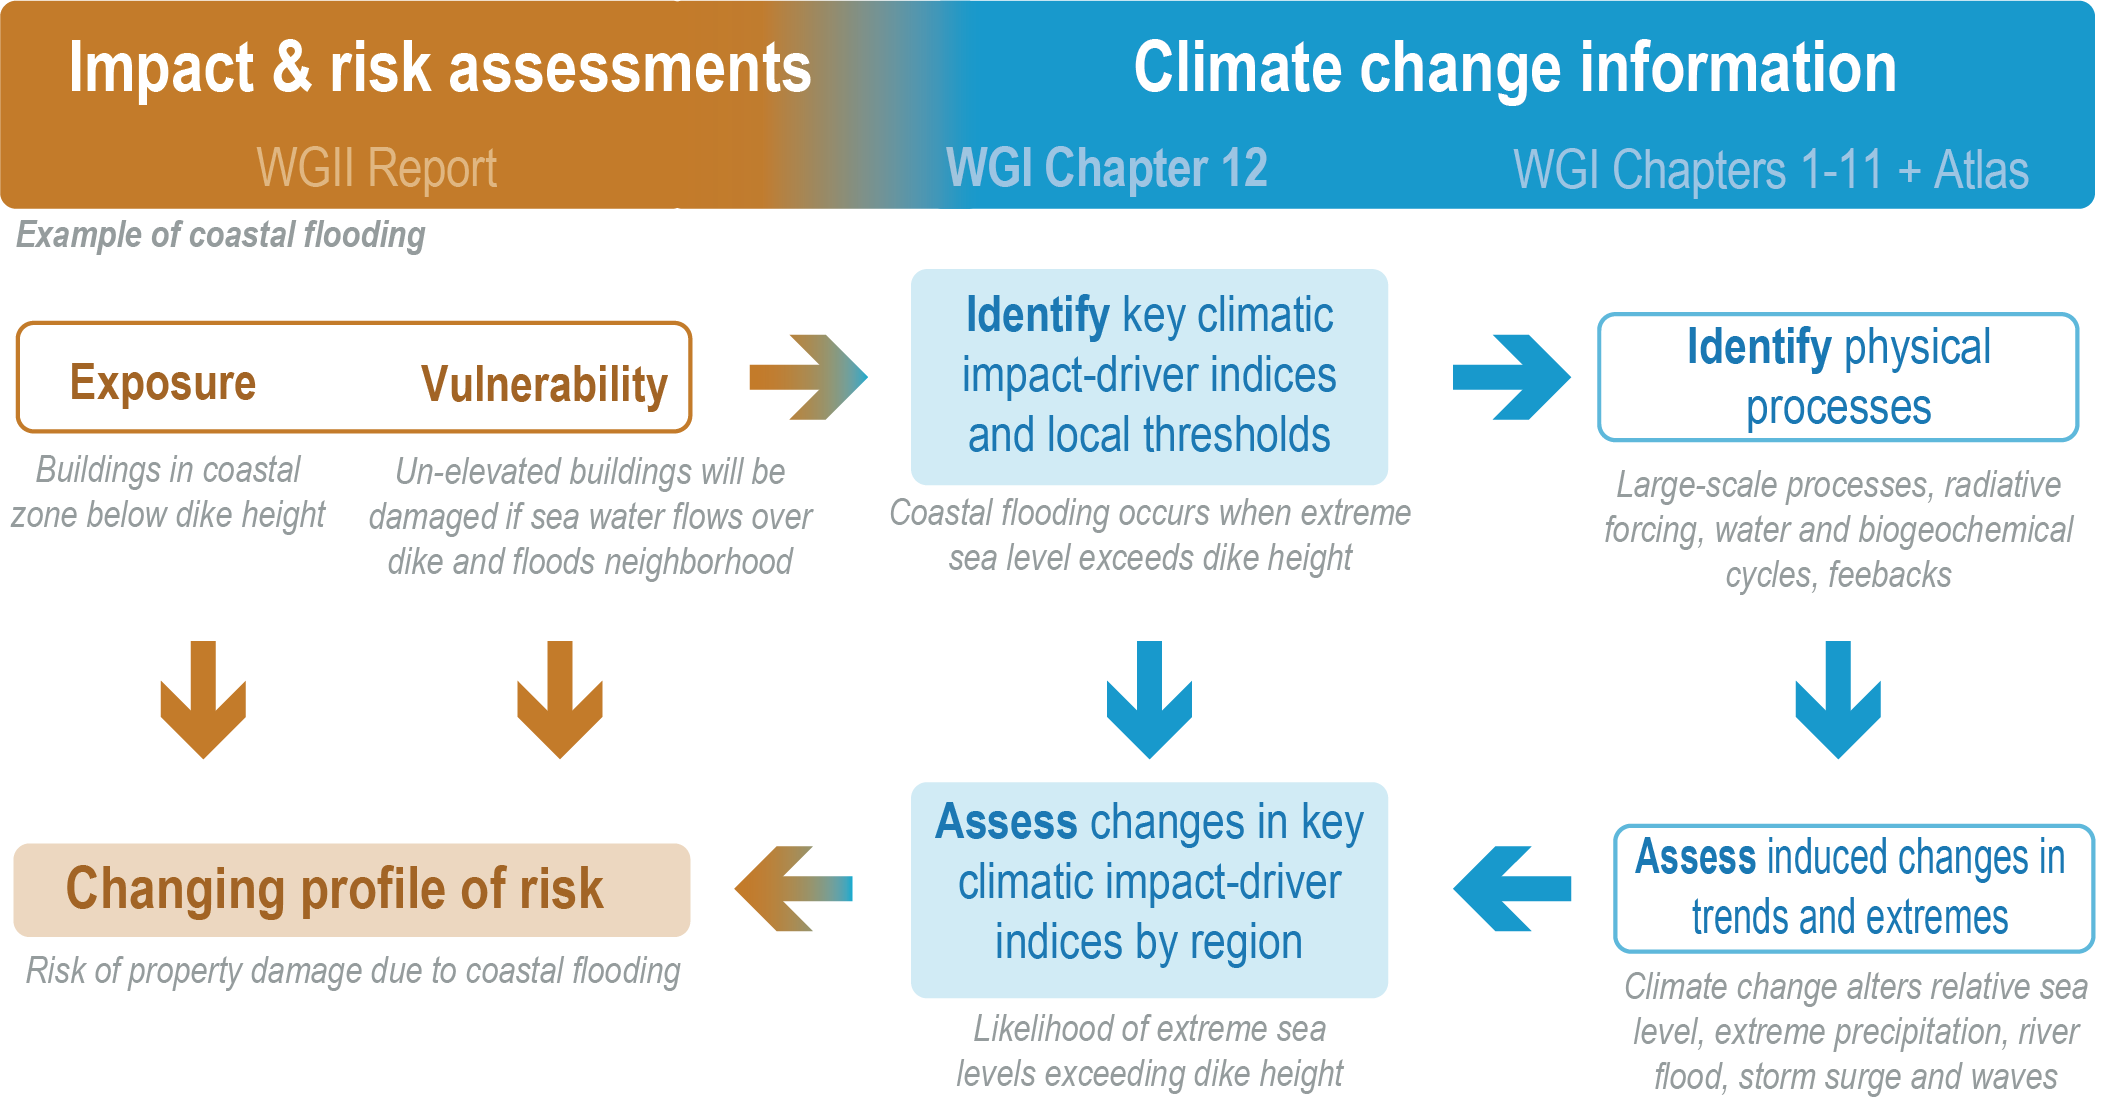 Figure 12.1 | Schematic diagram showing the use of climate change information (AR6 WGI chapters) for typical impacts or risk assessment (AR6 WGII chapters) and the role of Chapter 12, via an illustration of the assessment of property damage or loss in a particular region when extreme sea level exceeds dike height.
 The narrative of (Chapter 12 is illustrated in Figure 12.2. First, Section 12.2 defines a range of climatic impact-driver categories that are relevant for regional and sectoral impacts. Next, Section 12.3 identifies climatic impact-drivers and their relevant indices that are frequently used in the context of climate impacts in the WGII focus sectors (AR6 WGII Chapters 2–8). The assessment of changes in regional-scale climatic impact-drivers is then developed within Section 12.4 by continent, following the structure of the WGII assessment report regional chapters (AR6 WGII Chapters 9–15), and adding the polar regions, open/deep ocean and other specific zones corresponding to the WGII Cross-Chapter Papers. Section 12.5 then presents a global perspective (both bottom-up and top-down) on the change of regional climatic impact-drivers, including an assessment of the ‘emergence’ of climatic impact-drivers. Section 12.6 discusses how climate information is used in ‘climate services’, which encompasses a range of activities bridging climate science and its use for adaptation and mitigation decision-making (see also AR6 WGII Chapter 17). The chapter concludes with final remarks in Section 12.7.

The chapter includes two Cross-Chapter Boxes. Cross-Chapter Box 12.1 connects climatic impact-drivers to global climate drivers and levels of warming as an element of the ‘Reasons for Concern’ framework (AR6 WGII Chapter 16). An additional Cross-Chapter Box, including three case studies from Europe, Asia and Africa, describes how climate services draw upon and apply regional climate information to support stakeholder decisions (Cross-Chapter Box 12.2).
12.2 Methodological Approach
This section details the methodological approach followed in Chapter 12 and discusses the underlying rationale for the assessments presented herein. Scientific literature on vulnerability, impacts, and adaptation (as typically asssessed in IPCC WGII) is examined to identify relevant climatic impact-drivers (CIDs) that contribute to sectoral risks and opportunities. Projected changes in corresponding CID indices are then derived from existing literature on changes in the physical climate system, results of other AR6 WGI chapters, and direct calculations based on climate projections from several model ensembles.
The classification of climatic impact-drivers, the ways that they change (e.g., their magnitude or intensity, duration, frequency, timing and spatial extent) is described in this section. It is emphasized that this chapter assesses literature relating only to physical climatic impact-drivers, not their impacts on human systems or the environment. Thus, here we do not consider indicators including exposure or vulnerability as assessed by WGII, although the selection of climatic impact-drivers is informed by literature feeding into WGII.
(Chapter 12 assesses climate change information relevant for regional impact and for risk assessment in the seven main sectors corresponding to Chapters 2–8 of the WGII Assessment Report:
- Terrestrial and freshwater ecosystems and their services (WGII Chapter 2);
- Ocean and coastal ecosystems and their services (WGII Chapter 3);
- Water (WGII Chapter 4);
- Food, fibre and other ecosystem products (WGII Chapter 5);
- Cities, settlements and key infrastructure (WGII Chapter 6);
- Health, well-being and the changing structure of communities (WGII Chapter 7);
- Poverty, livelihoods and sustainable development (WGII Chapter 8).
Many of these sectors also include assets affected by climate change that are important for recreation and tourism, including elements of ecosystems services, health and well-being, communities, livelihoods and sustainable development (see also Chapter 1 on the Intergovernmental Science-Policy Platform on Biodiversity and Ecosystem Services (IPBES), and the IPCC Special Report on climate change, desertification, land degradation, sustainable land management, food security, and greenhouse gas fluxes in terrestrial ecosystems (SRCCL; Hurlbert et al., 2019; IPCC, 2019c)).
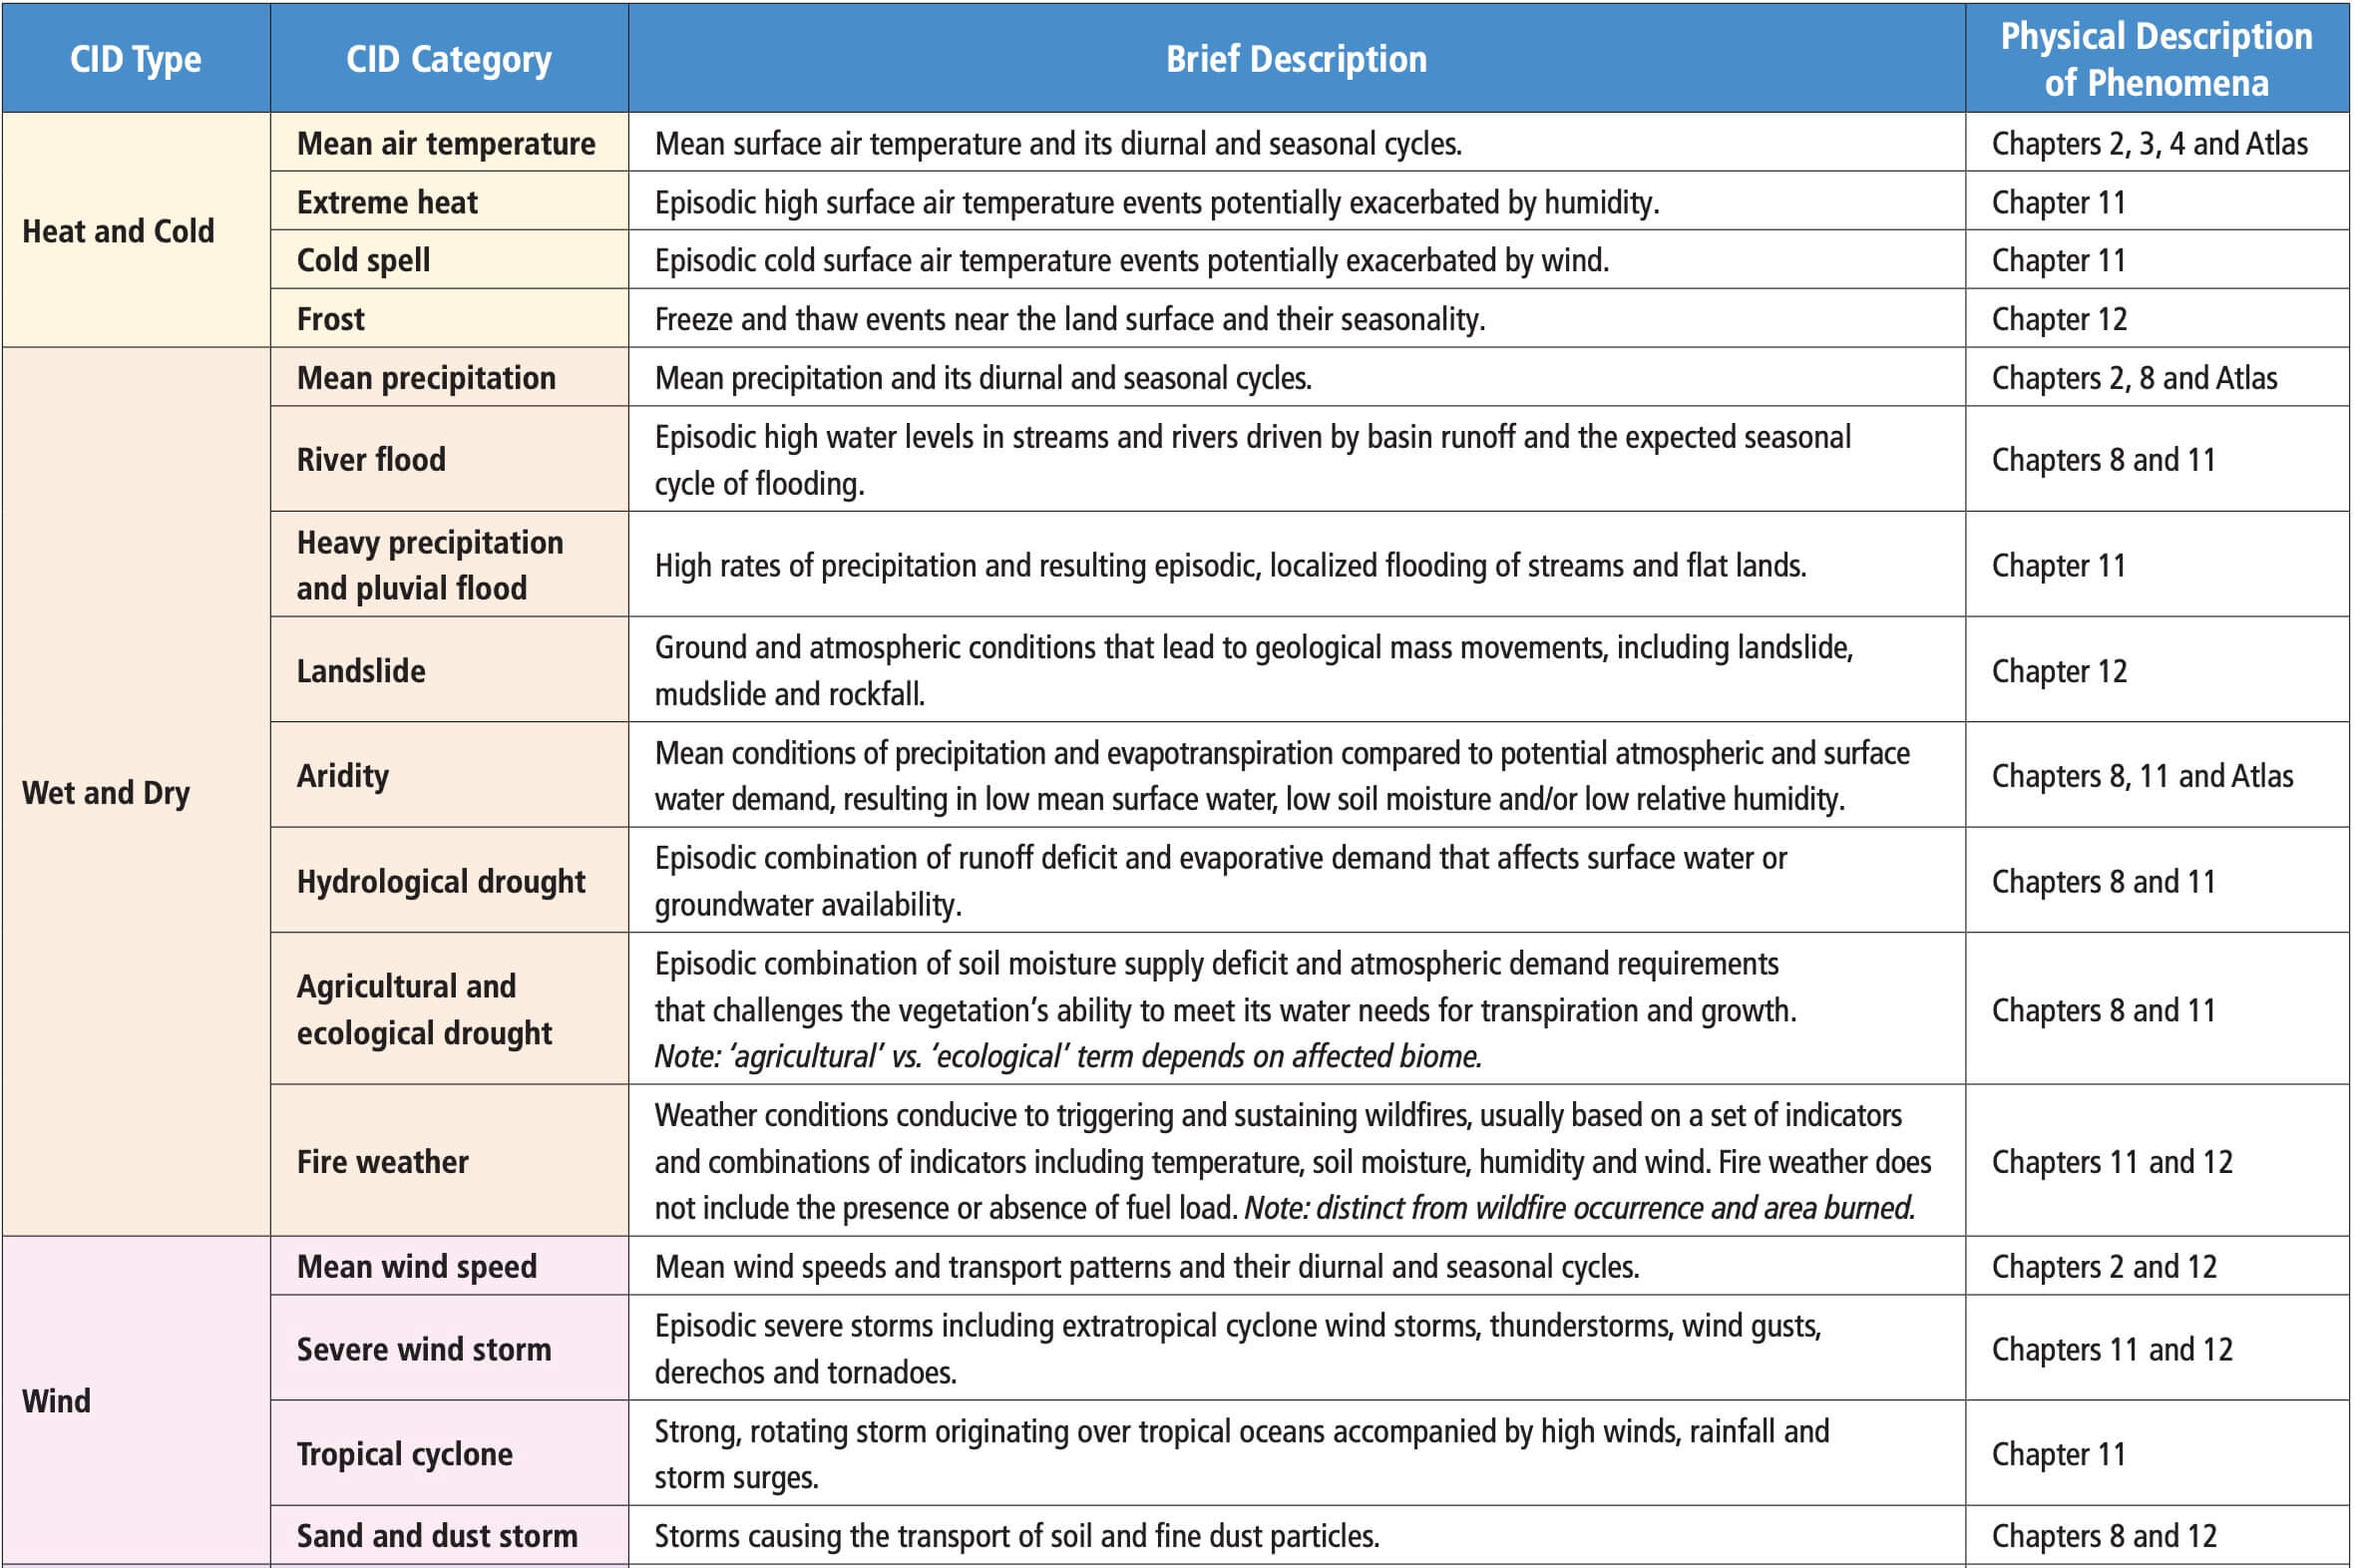
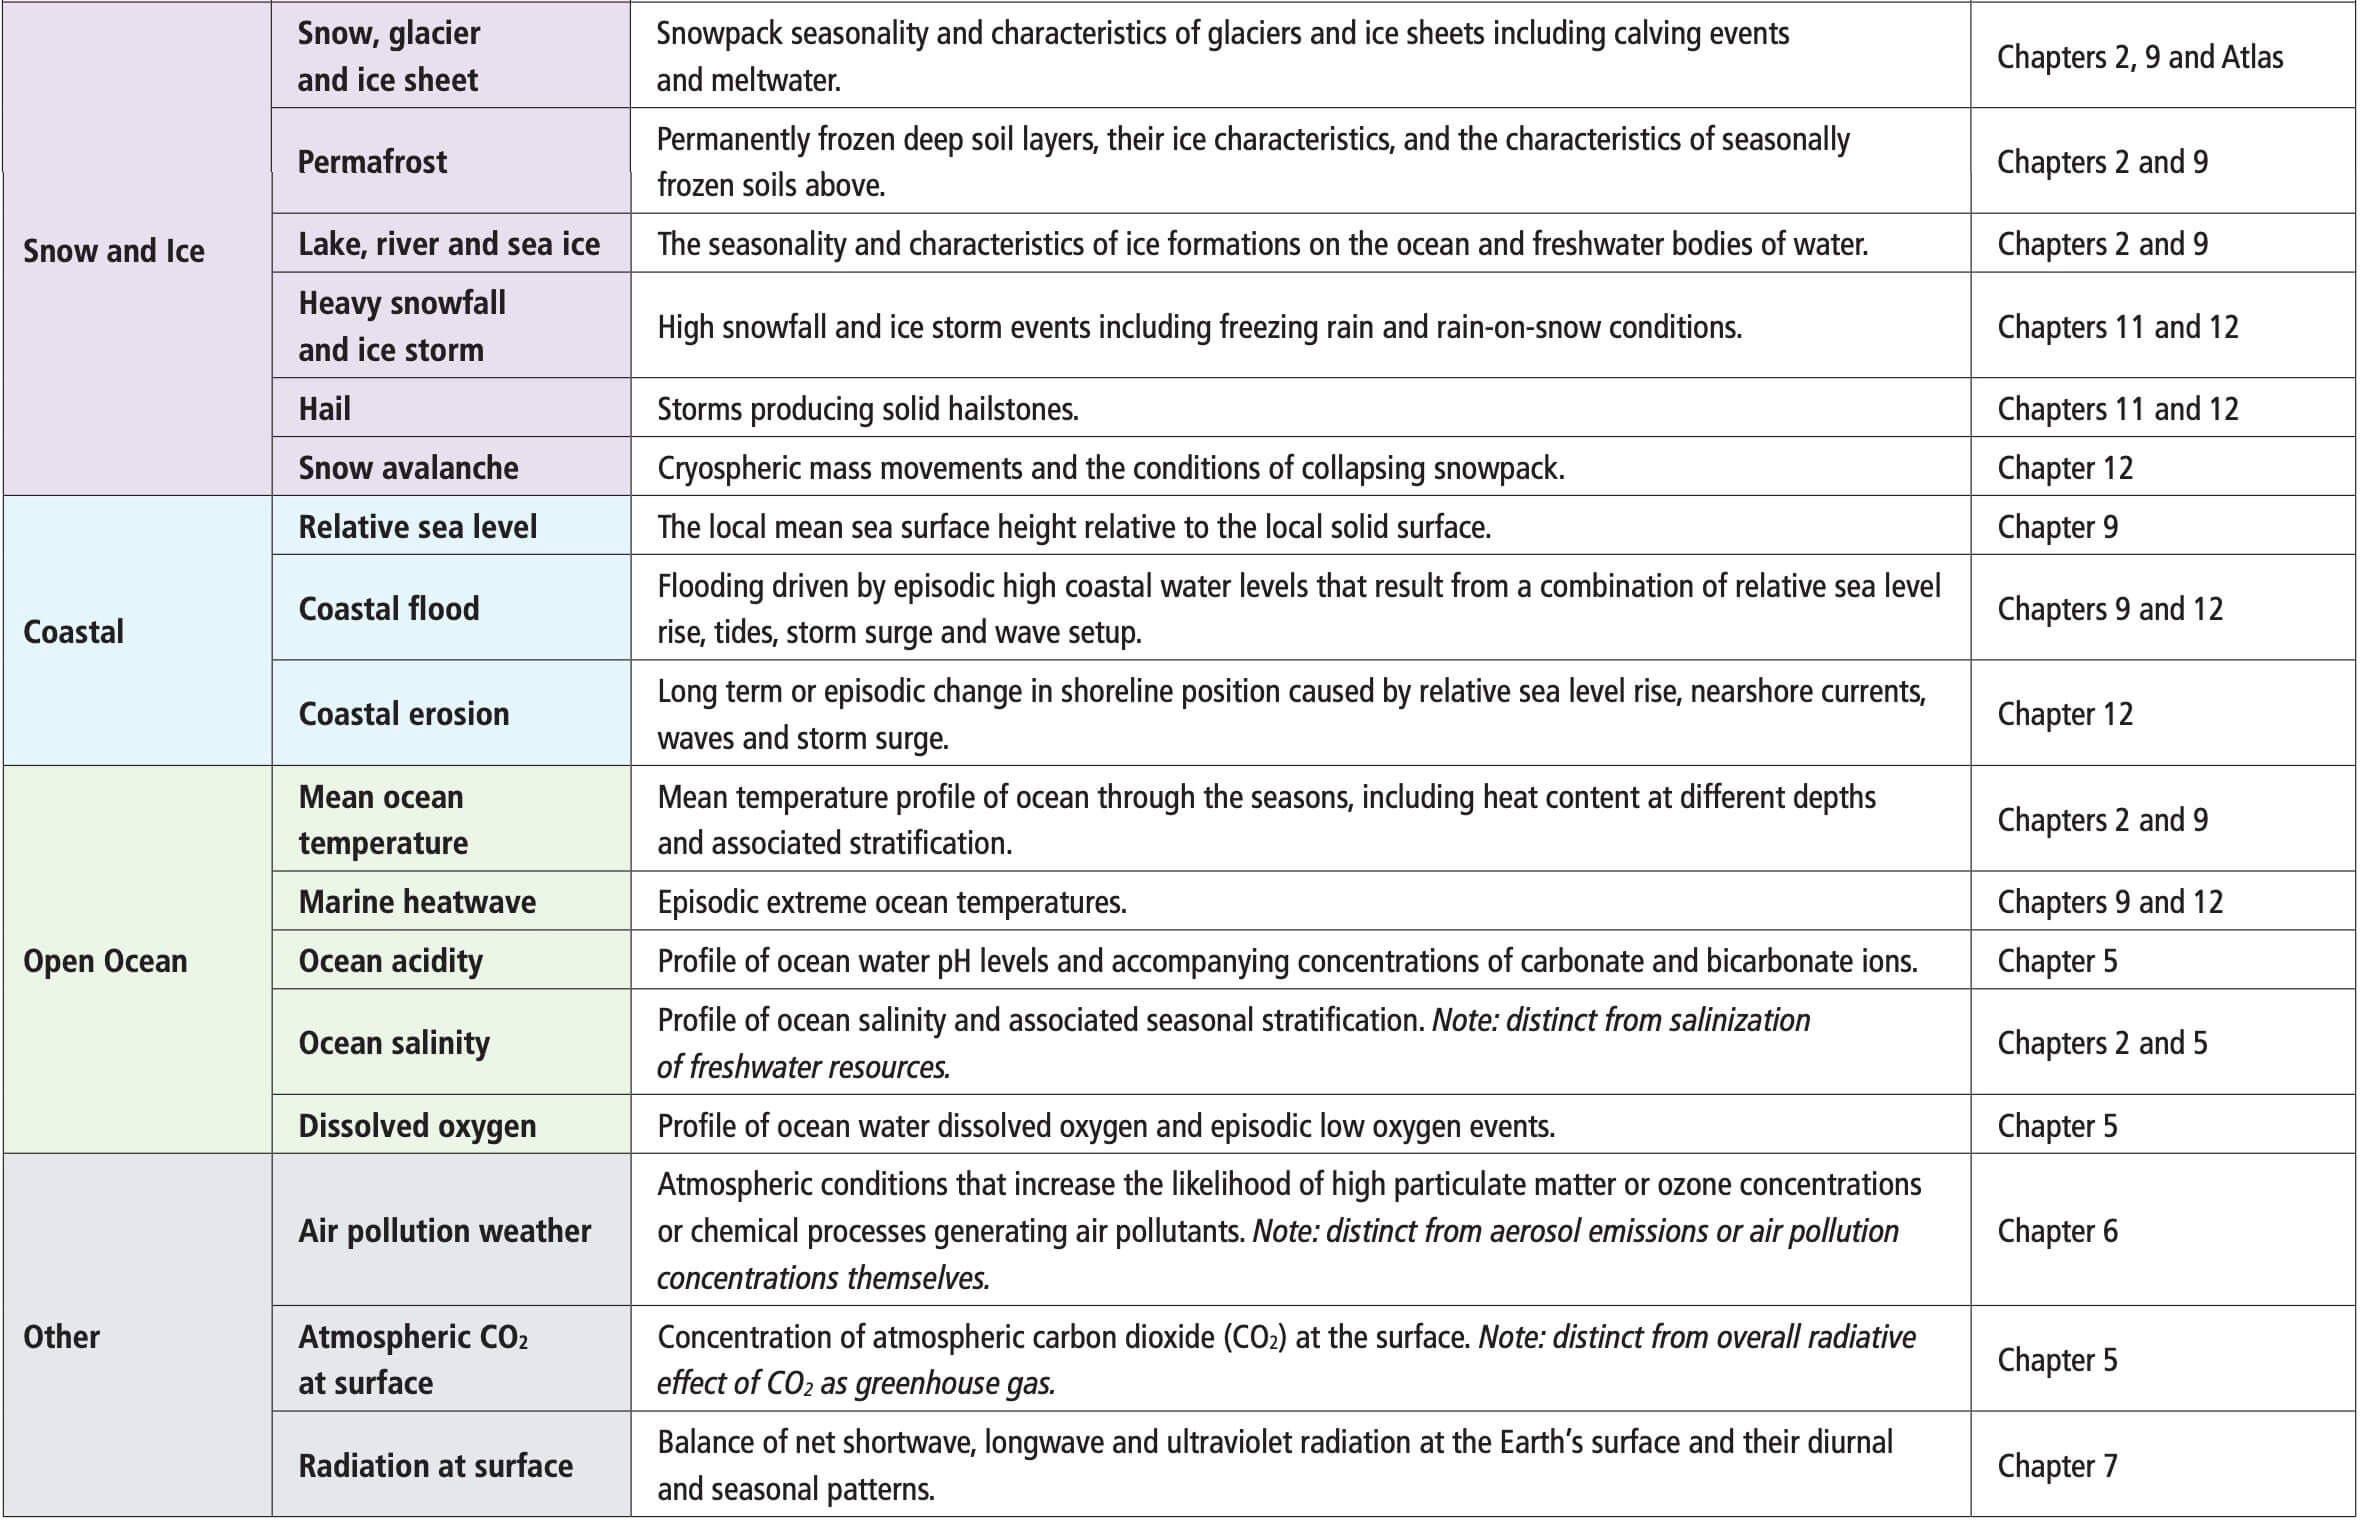
CIDs can be captured in seven main types: heat and cold; wet and dry; wind; snow and ice; coastal; oceanic and other. Table 12.1 provides an overview of the seven CID types and the CID categories associated with each type. The type ‘Other’ comprises additional CIDs that are not encompassed within the other six CID types, including air pollution weather (e.g., meteorological conditions that favour high concentrations of surface ozone, particulate matter or other air pollutants), near-surface atmospheric CO2 concentrations, and mean radiation forcing at the surface (which are, for example, relevant for plant growth). Icebergs, fog and lightning are also noted in this chapter but are not broadly assessed across all subsections. In addition, there can be changes in impacts associated with earthquakes that interact with climate variables and climate change, such as liquefaction (e.g., Yasuhara et al., 2012) during earthquakes, or earthquakes caused by snow and water changes (Amos et al., 2014; Johnson et al., 2017), which are secondary effects on geophysical hazards that are not further assessed in this chapter. The characteristics and physical description of the climate phenomena or essential climate variables associated with each of these CID categories are assessed and described in previous Chapters 2–11 or (Chapter 12 directly as indicated in Table 12.1. The CID categories are further mapped on to different sectors in Section 12.3 (Table 12.2).
Potential changes in the seasonality of CIDs or the length and characteristics of seasons (e.g., changes in growing season length or pollen season) are also important as they may shift the timing of many CIDs with broad implications for sectors and regional stakeholders (Wanders and Wada, 2015; Cassou and Cattiaux, 2016; Hansen and Sato, 2016; Brönnimann et al., 2018; Marelle et al., 2018; Unterberger et al., 2018; Kuriqi et al., 2020). Episodic CIDs characterize impact-relevant conditions persisting from short to long time frames but eventually returning to normal conditions.
In some situations, phenomena causing severe impacts go well beyond a single extreme event or a single climate variable, and can include interaction of climatic conditions, such as sea level rise and storm surge (Wahl et al., 2015), precipitation in combination with strong winds (Martius et al., 2016) or flooding quickly followed by a heatwave (S.S.-Y. Wang et al., 2019; see also Section 10.5.2.4). Such compound events, particularly in the context of climate extremes, are assessed in Section 11.8. A combination of non-extreme climatic impact-drivers in time or space can also lead to severe impacts (Cutter, 2018).
Several climatic impact-drivers are reliant on many factors beyond their associated primary climatic phenomenon. For example, river flooding is heavily dependent on river management and engineering and could also be affected by tidal water levels due to sea level rise and/or storm surge. Coastal flooding could be affected by coastal protection structures, port and harbour structures, as well as river flows (on inlet-interrupted coasts). Coastal erosion could be influenced by coastal protection measures as well as fluvial sediment supply to the coast. Furthermore, air pollution weather is not the only or dominant driver, for instance, of surface ozone pollution, but precursor emissions from anthropogenic sources can play a significant role (Section 6.5). Chapter 12 focuses only on the influence of the atmospheric, land and oceanic conditions associated with the climatic impact-drivers and the confidence in the direction of CID changes given here does not take into account existing or potential future adaptation measures, unless otherwise stated.
For each CID category there can be a range of indices that capture the sector- or application-relevant characteristics of a climatic impact-driver as described in Sections 12.3 and 12.4. Indices for climatic impact-drivers that are based on absolute or percentile thresholds (e.g., daily maximum temperature above 35°C) can be affected by biases in climate model simulations, such as local or regional deviations of a simulated climate variable from observed values (Sillmann et al., 2014; Dosio, 2016). Where sensible (i.e., where reliable observational data are available and a climate model that fits for the desired purpose), the output of climate model simulations can be bias-adjusted, potentially involving advanced methods to account for multiple variables and extreme value statistics as assessed in detail in Cross-Chapter Box 10.2. Yet, there is no general agreement about which bias adjustment methods to apply, as artefacts can arise both from the climate model and from the bias adjustment method, and the number of available methods has considerably grown in recent years (for a detailed discussion of available methods and their performance see Sections 10.3.1.3.2 and 10.3.3.7.2, and Cross-Chapter Box 10.2). The WGI Interactive Atlas illustrates original and bias-adjusted CIDs (see Atlas.1.4.5).
A global perspective on climatic impact-drivers is provided in Section 12.5.1. Section 12.5.2 focuses on assessing evidence for the emergence (Section 1.4.2.2) of an anthropogenic climate change signal on the change in CIDs beyond natural climate variability, based on the literature assessed in other chapters and additional literature, at both global and regional scales. The process of generating user-relevant regional climate information in the context of co-production and climate services is assessed in Sections 10.5, 12.6, Box 10.2 and Cross-Chapter Boxes 10.3 and 12.2. Cross-Chapter Box 12.1 provides a global perspective on climatic impact-drivers related to their evolution for different GWLs (Section 1.6).
12.3 Climatic Impact-drivers for Sectors
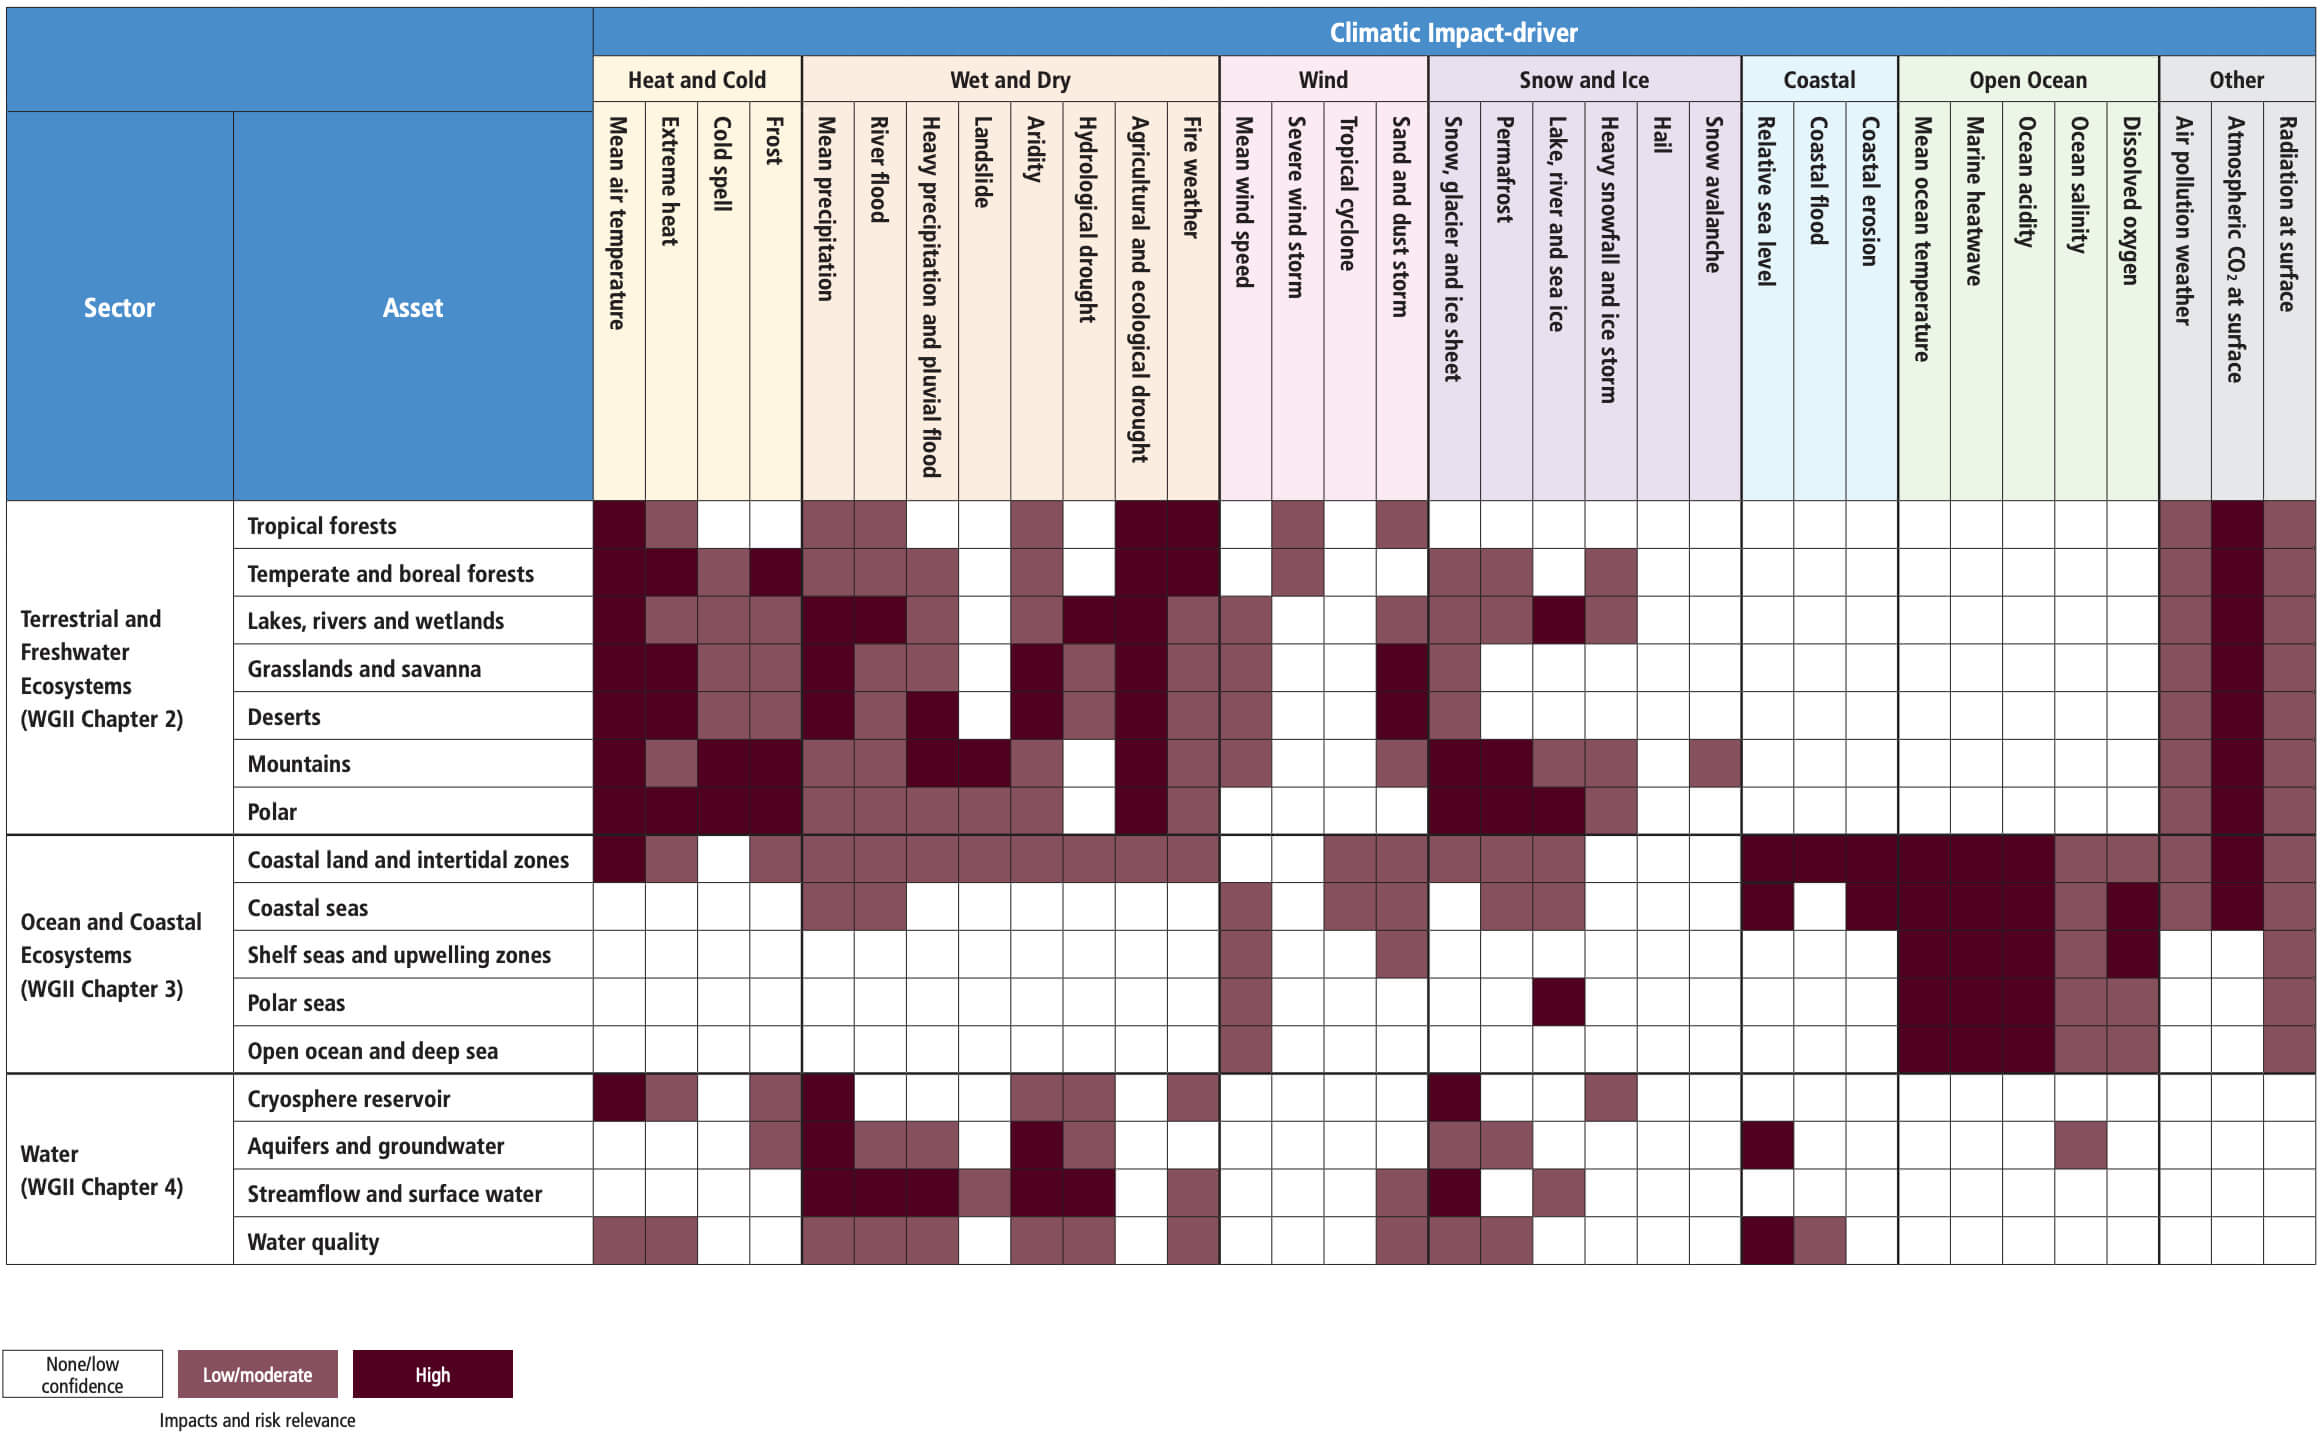
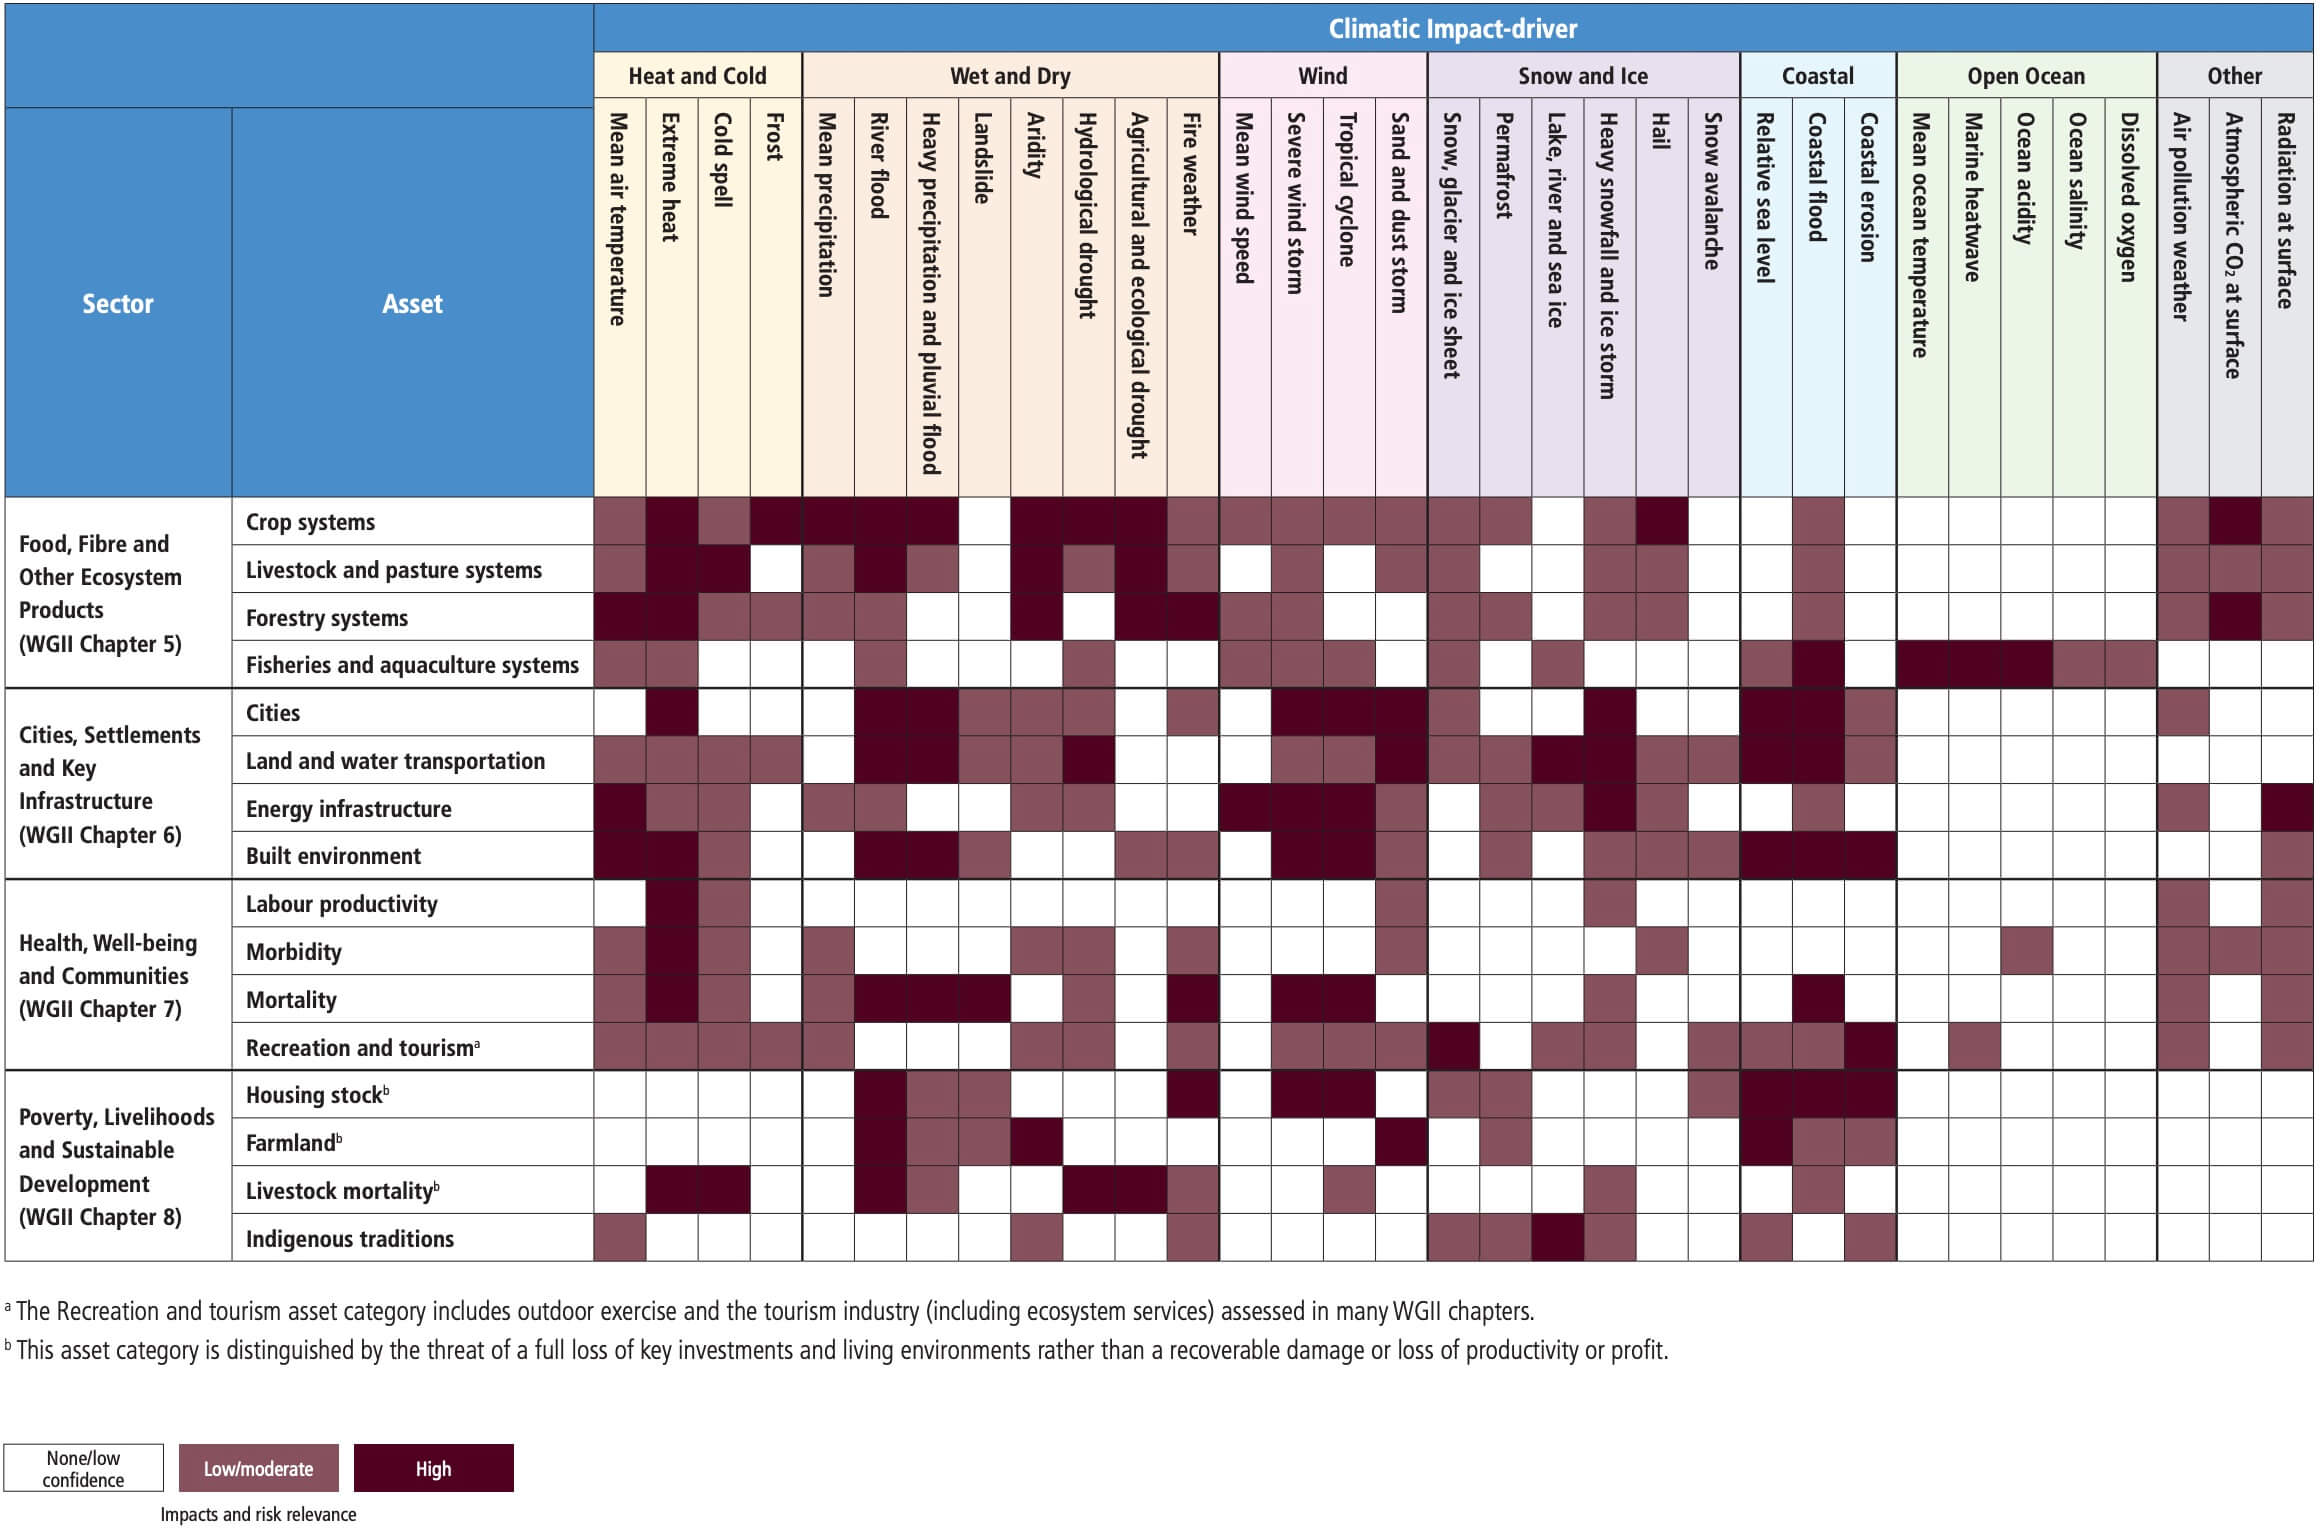
Climate change becomes relevant for regional impact management and for risk assessment when changes in mean conditions or episodic events affect natural and societal assets (system components with socio-economic, cultural or intrinsic value) positively or negatively (Table 12.2). Decision makers, policymakers, risk managers and engineers therefore benefit from climate information that tracks key trends and exceedance of thresholds that represent crucial challenges for natural and human systems. While useful indices can vary widely for a given sector and precise tolerance threshold values are often unknown, common metrics, categories and progressions of threshold levels allow experts to recognize coherent messages concerning altered regional impacts and risk profiles under climate change.
This section surveys the links between CIDs and affected sectors; not to perform specific climate change impact or risk assessments (see AR6 WGII), but to describe key indices (among many) that quantify these links as guidance for stakeholders seeking applicable climate information. This survey builds on the work of the World Meteorological Organization Expert Team on Sector-Specific Climate Indices (ET-SCI) and previous IPCC assessments, notably AR5 WGII (Birkmann et al., 2014; IPCC, 2014a) and IPCC Special Reports (IPCC, 2018, 2019b, c) that have assessed climate hazards affecting sectors but is organized from a CID perspective drawing also upon recent summaries of sectoral hazards (Mora et al., 2018; ICOMOS, 2019; Yokohata et al., 2019). Impacts, risks and opportunities are rarely attributable to a single CID index or threshold, but climate shifts that push conditions outside of expected conditions and beyond tolerance levels are indicative of impact, risk or benefit given vulnerability and exposure. Focus is on direct sectoral connections of a CID (Hallegatte and Przyluski, 2010) rather than cascading or secondary effects (e.g., water-borne diseases following a flood, mental health challenges following a severe storm, or the effects of drought on poverty), as these are strongly affected by exposure, vulnerability and response, as discussed in the WGII Report.
Table 12.2 presents a summary of (Section 12.3 connections between CIDs as defined in Table 12.1 and key sectoral assets, utilizing the WGII organization of sectors (corresponding to WGII Chapters 2–8). Colours are shown for connections with at least medium confidence as assessed from sectoral impacts and risk literature, with relevance assessed according to the prominence of that specific CID/asset connection in analyses of current and future impacts and risk. Within each sector there is a multitude of specific sectoral systems that may be affected by CID increases and decreases, with consequences further distinguished by region, background climate and socio-economic or ecological context of the affected asset. Our aim is therefore to recognize important drivers and the common attributes of change within each CID that scientists and practitioners monitor to understand current and future challenges for important asset groups, thereby pointing to the climate information that needs to be tailored and analysed for impacts and for risk assessment (Section 12.6). Additional effects whereby CIDs affect each other (across Table 12.2 columns) are discussed as climatic phenomena within WGI. The ways sectoral assets affect each other (across Table 12.2 rows) are described throughout WGII, for example with information about the suitability of future climate zones and climate velocity challenges for a given asset potentially drawing from multiple CIDs and associated system tolerance thresholds (Hamann et al., 2015). Some broad connections indicated as low confidence may be under-represented in the literature or could be acute under specific circumstances.
12.3.1 Heat and Cold
12.3.1.1 Mean Air Temperature
Information about increasing mean annual and seasonal air temperature is relevant in the determination of suitable species range for terrestrial, freshwater and intertidal species (Thomas et al., 2004; Elith et al., 2010; Hincapie and Caicedo, 2013; Cooper, 2014; Krist et al., 2014; Lindner et al., 2014; Saintilan et al., 2014; Lenoir and Svenning, 2015; Myers-Smith et al., 2015; Urban, 2015; Thorne et al., 2017). Ocean ecosystems are affected by the ocean temperature CID (described in Section 12.3.6.1). Species redistribution and extinction studies also need information about climate velocity, a comparison of the pace of warming to geographical temperature gradients that indicates the rate at which a species would have to move to maintain its climatological temperature (Thomas et al., 2004; Loarie et al., 2009; Dobrowski et al., 2013; Burrows et al., 2014; Dobrowski and Parks, 2016; Sittaro et al., 2017) with some studies incorporating additional variables beyond temperature (Hamann et al., 2015). Many freshwater ecosystems are strongly constrained by stream and lake temperatures (Scheurer et al., 2009; Comte and Grenouillet, 2013; Contador et al., 2014; Knouft and Ficklin, 2017). Warmer and more stratified lake temperatures are more conducive to cyanobacteria blooms with implications for ecosystem health and water resource quality (Whitehead et al., 2009; Moss et al., 2011; Jones and Brett, 2014; Chapra et al., 2017; Shatwell et al., 2019). Consideration of nighttime and daytime temperature trends also elucidates different biophysical effects on vegetation (Peng et al., 2013). Changes in the seasonal timing caused by warming trends are critical to species ranges and ecosystem function (Pearce-Higgins et al., 2015; Hughes et al., 2017b), and indices that characterize the onset of spring shed light on plant emergence and development (Ault et al., 2015).
Mean air temperature dictates many aspects of crop cultivation, livestock production, agroforestry and output from freshwater aquaculture and fisheries, as well as the potential for food contamination. Mean warming alters suitable cultivation zones for crop species (Bragança et al., 2016; Gendron St-Marseille et al., 2019; IPCC, 2019c) and tree species (Hanewinkel et al., 2013; Fei et al., 2017). Crop and ecosystem service productivity often responds directly to mean temperatures, although this is dependent on farming systems (Bassu et al., 2014; Challinor et al., 2014; Lobell and Tebaldi, 2014; Rosenzweig et al., 2014; Asseng et al., 2015; Li et al., 2015; Fleisher et al., 2017; Zhao et al., 2017; Smith and Fazil, 2019). Many studies relate plant development (phenology), insect generation cycles and pest outbreaks to growing degree days, an aggregation of daily thermal units above a threshold (e.g., Tmean>5°C) that accelerates with warmer conditions (Hof and Svahlin, 2016; Ruosteenoja et al., 2016; Tripathi et al., 2016). Many plants respond to changes in nighttime temperatures that affect respiration and transpiration rates (Narayanan et al., 2015; X. Chen et al., 2019), and warming of the soil column is also relevant to determine plant sprouting (Grotjahn, 2021). A number of indices have been developed to represent the length of the viable local growing season, including a count of days where Tmax>5°C (Mueller et al., 2015) or the period between a year’s first and last set of five consecutive days with a weighted Tmean≥10°C (G. Li et al., 2018). Warmer conditions and altered seasonality modify the range and metabolism of some pollinators, pests, diseases and weeds (Wolfe et al., 2008; Bebber, 2015; Aljaryian and Kumar, 2016; IPBES, 2016; Ramesh et al., 2017; Deutsch et al., 2018; Nyangiwe et al., 2018) and may reduce the effectiveness of winter storage for farmers and caching species (Sutton et al., 2016).
Warming raises accumulated seasonal heat indices used in livestock production, especially when humidity is high (Key et al., 2014; Lallo et al., 2018), determines aquaculture suitability and is important for wild fish species migration (Tripathi et al., 2016; Brander et al., 2017). Agricultural planners may also calculate how overall warming trends alter the accumulation of vernalization units or chilling hours for agricultural or horticultural crops (often accumulated temperature deficit below a given daily or hourly threshold; Dennis and Peacock, 2009; Luedeling, 2012; Tripathi et al., 2016; Grotjahn, 2021). Warming in the post-harvest is also important for the determination of spoilage and waste (Stathers et al., 2013) as well as food-borne diseases (Kovats et al., 2004; Mbow et al., 2019).
Warming affects road degradation rates (Chinowsky and Arndt, 2012; Espinet et al., 2016) and warming rates inform designs for long-term energy efficiency of buildings (Kalvelage et al., 2014). Mean temperature drives seasonal energy demand, often expressed using winter heating degree days (the accumulated deficit of daily temperatures below a ‘comfortable’ indoor temperature, e.g., 15.5°C) and summer cooling degree days (the accumulated excess of temperature above a ‘comfortable’ level, e.g., 18°C; Spinoni et al., 2015; Arnell et al., 2019). Energy resources may also need information on warming trends to determine suitable zones and overall productivity for biofuels and solar panels, the efficiency of which decreases with higher temperatures (Schaeffer et al., 2012; Wild et al., 2015; Solaun and Cerdá, 2019).
Health impacts and risk studies compare seasonal temperature conditions to limiting thresholds to understand range shifts and incubation rates for pathogens, disease vectors and zoonotic hosts (e.g., mosquitoes, ticks; Caminade et al., 2012, 2014; Eisen and Moore, 2013; Lima et al., 2016; Ogden, 2017; Monaghan et al., 2018) and warming of surface ocean and lake waters conducive to bacterial outbreaks (Baker-Austin et al., 2013; Jacobs et al., 2015; Vezzulli et al., 2015). Warmer conditions can also affect tourism (Kovács et al., 2017) and impact human health by lengthening the allergy season and increasing pollen concentration (Hamaoui-Laguel et al., 2015; Kinney et al., 2015a; Lake et al., 2017; Upperman et al., 2017; Sapkota et al., 2019; Ziska et al., 2019).
12.3.1.2 Extreme Heat
Impacts and risk assessments utilize a large variety of indices and approaches tailored to evaluate heat impacts on human health (Sanderson et al., 2017; C. Gao et al., 2018; McGregor and Vanos, 2018; Staiger et al., 2019; J. Zhu et al., 2019; Schwingshackl et al., 2021). A mixture of simple and complex heat stress indices often combine extreme temperatures and high humidity to capture human health challenges (Aström et al., 2013; Chow et al., 2016; Dahl et al., 2017a; Im et al., 2017; Coffel et al., 2018; J. Li et al., 2018; Vanos et al., 2020). Different optimum temperatures and extreme heat thresholds based on local distributions are needed to reflect acclimation of different locations and populations (Hajat et al., 2014; WHO, 2014; Kinney et al., 2015b; Russo et al., 2015; Petitti et al., 2016; Dosio, 2017; Cheng et al., 2018; Lay et al., 2018; Schwingshackl et al., 2021). Hot and humid heat episodes can be deadly (Mora et al., 2017), are associated with elevated hospital intake (Goldie et al., 2017) and lower safety and productivity of outdoor labourers (Dunne et al., 2013; Graff Zivin and Neidell, 2014; Kjellstrom et al., 2016; Pal and Eltahir, 2016; Y. Zhao et al., 2016; Mora et al., 2017; Watts et al., 2018; Orlov et al., 2019). Elevated nighttime temperatures prevent the human body from experiencing relief from heat stress (Zhang et al., 2012) and can be tracked over extended periods of sequential day and night heat extremes (Murage et al., 2017; Mukherjee and Mishra, 2018). Extreme heat also exacerbates asthma, respiratory difficulties and response to airborne allergens such as hay fever (Upperman et al., 2017). Extreme heat affects outdoor exercise such as the use of bike-share facilities (Heaney et al., 2019; Vanos et al., 2020). Large-scale recreational and sporting events such as marathons and tennis tournaments monitor heat extremes when determining the viability of host cities (Smith et al., 2016, 2018).
Short-term exposure of crops to temperatures beyond a critical temperature threshold can lead to lower yields and above a limiting temperature threshold, crops may fail altogether (Schlenker and Roberts, 2009; Lobell et al., 2012, 2013; Gourdji et al., 2013; Deryng et al., 2014; Schauberger et al., 2017; Tesfaye et al., 2017; Vogel et al., 2019). The exact level of these thresholds depends on species, cultivar and farm management (Hatfield and Prueger, 2015; Hatfield et al., 2015; Bisbis et al., 2018; Grotjahn, 2021). The timing of heatwaves is particularly important, as extreme heat is more damaging during critical phenological stages (Teixeira et al., 2013; Eyshi Rezaei et al., 2015; Fontana et al., 2015; B. Wang et al., 2017; Mäkinen et al., 2018). Extreme canopy temperatures, rather than 2 m air temperatures, may be a more robust biophysical indicator of heat impacts on crop production (Siebert et al., 2017). Heat stress indices based upon temperature and humidity determine livestock productivity as well as conception and mortality rates (Key et al., 2014; Dash et al., 2016; Pragna et al., 2016; Rojas-Downing et al., 2017).
Heat extremes factor in mortality, morbidity and the range of some thermally sensitive ecosystem species (Smith and Nagy, 2015; Ratnayake et al., 2019; Thomsen et al., 2019). Combined heat and drought stress can reduce forest and grassland primary productivity (Ciais et al., 2005; De Boeck et al., 2018) and even cause tree mortality at higher extremes (Teskey et al., 2015).
Extreme heat events raise temperatures in buildings and cities already warmed by the urban heat island effect (Gaffin et al., 2012; Oleson et al., 2018; Zhao et al., 2018; Mauree et al., 2019; Box 10.3) and can induce disruptions in critical infrastructure networks (Chapman et al., 2013). Heat affects transportation infrastructure by warping roads and airport runways (Chinowsky and Arndt, 2012) or buckling railways (Dobney et al., 2010; Dépoues, 2017; Chinowsky et al., 2019), and high temperatures reduce air density leading to aircraft take-off weight restrictions (Coffel et al., 2017; Palko, 2017; T. Zhou et al., 2018). Heat extremes increase peak cooling demand and challenge transmission and transformer capacity (Sathaye et al., 2013; Russo et al., 2016; Craig et al., 2018; X. Gao et al., 2018) and may cause transmission lines to sag or fail (Gupta et al., 2012). Thermal and nuclear electricity plants may be challenged when using warmer river waters for cooling or when mixing waste waters back into waterways without causing ecosystem impacts (Kopytko and Perkins, 2011; van Vliet et al., 2016; Tobin et al., 2018). Extreme temperature can also reduce photovoltaic panel efficiency (Jerez et al., 2015).
12.3.1.3 Cold Spells
The magnitude and timing (relative to developmental stages) of cold extremes (such as the typical coldest day of the year) set limits in the range of species habitat for ecosystems as well as for agricultural and forest pests (Osland et al., 2013; Cavanaugh et al., 2014; Parker and Abatzoglou, 2016; Brunner et al., 2018; Unterberger et al., 2018). Cold air outbreaks can lead to chilling injuries for crops (even above 0°C) and may kill outdoor livestock (particularly young animals; Mader et al., 2010; Liu et al., 2013; Grotjahn, 2021), but are often necessary for crop chill requirements (Dennis and Peacock, 2009).
Increases in human mortality can occur on exceptionally cold days (e.g., <1st percentile of temperatures in winter) although thresholds and human-perceived temperatures linked to wind speed (i.e., ‘wind chill’) vary geographically due to acclimatization (Li et al., 2013; Gao et al., 2015; J. Li et al., 2018; J. Zhu et al., 2019). The timing of ‘unseasonal’ cold spells also affect human health (Kinney et al., 2015b). Extreme cold can increase heat and electricity demand (Stuivenvolt-Allen and Wang, 2019), cause water pipes to burst, and mechanically alter roads, railroads and buildings (Underwood et al., 2017).
12.3.1.4 Frost
Frost (Tmin<0°C) is a natural and fundamental aspect of many ecosystems, with more extreme conditions defined as ice (or icing) days (Tmax<0°C) (L.A. Vincent et al., 2018). Agricultural systems planning (e.g., planting calendars, seed selection or the opportunity to double-crop) requires information about the start and end of the frost-free season (Wypych et al., 2017; Wolfe et al., 2018). Crops and wild plants can be directly damaged by frost, but hard or killing frosts (at a threshold several degrees below freezing) can kill crops or lower harvest quality depending on duration (which relates to soil temperature penetration) and plant developmental stage (Crimp et al., 2016a; Cradock-Henry, 2017; G. Li et al., 2018; Mäkinen et al., 2018; Grotjahn, 2021). Earlier disappearance of snow cover reduces natural insulation that protects plants and burrowing animals from hard frost damages (Trnka et al., 2014; Mäkinen et al., 2018). In some cases an early season warm spell may reduce plant hardiness or induce fruit tree flowering that exposes plants to devastating subsequent frost impacts (Hufkens et al., 2012; Hatfield et al., 2014; Tripathi et al., 2016; Brunner et al., 2018; DeGaetano, 2018; Unterberger et al., 2018; Wolfe et al., 2018). Shifts in the seasonality of frozen soils also affect groundwater recharge and surface streamflow for water resource applications, particularly when peak precipitation is shifted to a season that no longer has frozen soils (Jyrkama and Sykes, 2007).
Regional information about the spring and autumn seasonal periods in which freeze-thaw cycles are common (such as the dates of first spring thaw and last spring frost, or the number of days where Tmax>0°C and Tmin<0°C) are particularly useful in estimating the rate of potential road and building damage or determining seasonal truck weight restrictions (Kvande and Lisø, 2009; Chinowsky and Arndt, 2012; Palko, 2017; Daniel et al., 2018). The altitude of the freezing level also identifies portions of mountain slopes where freeze/thaw transitions or changes in snowpack condition can influence landslide and snow avalanche hazards (Coe et al., 2018). The geographical distribution of frost is also a determining factor in the range of vectors for human diseases such as malaria (X. Zhao et al., 2016; Smith et al., 2020).
Figure 12.3 illustrates how successive heat and cold hazards can potentially affect important natural and human systems, with climatic pressures reaching new sectoral assets or becoming increasingly severe as conditions become more extreme. While the precise value of any CID threshold may depend strongly on local environmental and system characteristics, there are common patterns and interdependencies in the types of thresholds encountered. Changes in the regional profile of CIDs can thus substantially alter threshold exceedance likelihoods.
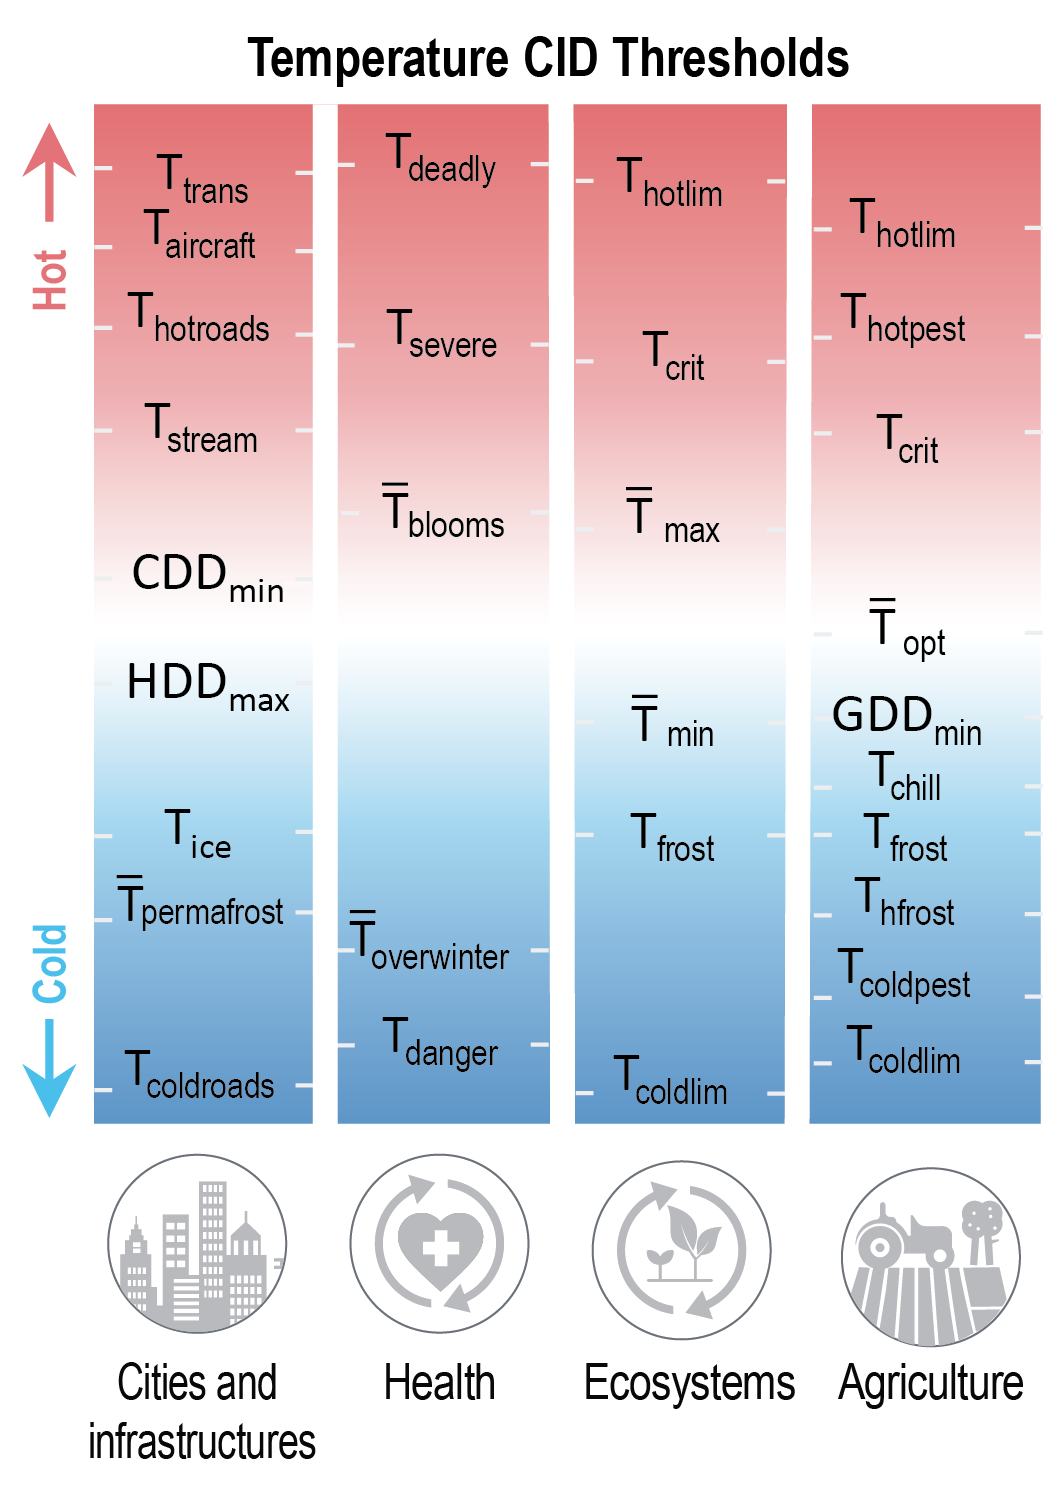 Figure 12.3 | Conceptual illustration of representative climatic impact-driver thresholds showing how graduating thresholds affect successive sectoral assets and lead to potentially more acute hazards as conditions become more extreme (exact values are not shown as these must be tailored to reflect diverse vulnerabilities of regional assets). Representative threshold definitions (T = instantaneous temperature; T= mean temperature): Cities and Infrastructures: Ttrans= temperature at which energy transmission lines efficiency reduced; Taircraft = temperature at which aircraft become weight-restricted for takeoff; Thotroads= temperature above which roads begin to warp; Tstream= temperature at which streams are not capable of adequately cooling thermal plants; CDDmin= minimum temperature for calculating cooling degree days; HDDmax= maximum temperature for calculating heating degree days; Tice= temperature at which ice threatens transportation; Tpermafrost = mean seasonal temperature above which permafrost thaws at critical depths; Tcoldroads= temperature below which road asphalt performance suffers. Health: Tdeadly= temperature above which prolonged exposure may be deadly (often combined with humidity for heat indices); Tsevere= temperature above which prolonged exposure may cause elevated morbidity; Tblooms= mean temperature for harmful algal or cyanobacteria blooms; Tdanger= level of dangerous cold temperatures (often combined with wind for chill indices); Toverwinter= temperature below which disease vector species cannot survive winter. Ecosystems (CID indices for air and ocean temperature): Thotlim and Tcoldlim= limiting hot and cold temperatures for a given species range; Tfrost = frost threshold; Tmax and Tmin= maximum and minimum suitable annual mean temperatures for a given species; Tcrit = critical temperature above which a given species is stressed. Agriculture: Thotlim= temperature above which a crop or livestock species dies; Thotpest = maximum (or ‘lethal’) temperature above which an agricultural pest/disease/weed cannot survive; Tcrit = temperature at which productivity for a given crop is depressed; Topt = optimal mean temperature for a given plant’s productivity; GDDmin= threshold temperature for growing degree days determining plant development; Tchill= temperature below which chilling units are accumulated; Tfrost = temperature below which frost occurs; Thfrost = temperature below which a hard frost threatens crops or livestock; Tcoldpest = minimum winter temperature below which a given agricultural pest cannot survive; Tcoldlim= minimum temperature below which a given crop cannot survive.
 12.3.2 Wet and Dry
12.3.2.1 Mean Precipitation
Changes in mean precipitation alter total water resources and long-term surface, snowpack and groundwater reservoirs (Schewe et al., 2014). Annual and seasonal wet trends can alter the suitable geographic range of species, with implications for biodiversity and vector-borne diseases (Knouft and Ficklin, 2017; Smith et al., 2020). The rate at which higher total streamflow increases river erosion and changes sediment loading is relevant for fish breeding (Scheurer et al., 2009), the location of riverine salt fronts that affect coastal agriculture and ecosystems (Chun et al., 2018; Vu et al., 2018), coastal freshwater stratification (Baker-Austin et al., 2013; Bell et al., 2013), and the accretion of sediment in estuaries and beaches (Syvitski and Milliman, 2007). Wetter conditions may shift tourist appeal (Kovács et al., 2017) and alter the pace of degradation for paved and especially unpaved roads (Chinowsky and Arndt, 2012).
Many agricultural systems require minimum rainfall totals or rely upon irrigation (Mbow et al., 2019). The length of the wet season helps determine the potential for multiple cropping seasons, but inconsistency of wet season arrival times poses challenges for farm management (Waha et al., 2020). Wetter growing season conditions increase the chance of waterlogging, which can delay planting or damage planted seeds (Rosenzweig et al., 2002; Ben-Ari et al., 2018; Mäkinen et al., 2018; Wolfe et al., 2018; Kolberg et al., 2019; Grotjahn, 2021). Tomasek et al. (2017) calculated ‘workable days’ for agricultural machinery around planting and harvest time set in part by limits in soil moisture saturation below which farmers can utilize critical machinery with less rutting or soil compaction. Wetter conditions may also increase canopy moisture that is conducive to crop pathogens (Garrett et al., 2006; Kilroy, 2015; Grotjahn, 2021).
12.3.2.2 River Flood
A large variety of climate indices and models are utilized to understand how river flooding affects both natural or built environments with highly variable hazard thresholds, given unique local topography and engineered defences such as dams and polders (Arnell and Gosling, 2016; Ekström et al., 2018). Key transportation routes, built infrastructure and agricultural lands are threatened when floods exceed design standards commonly based around flood magnitudes of a given historic return period (e.g., 1-in-100-year flood event), an annual exceedance probability or precipitation intensity-duration-frequency relationships with key indices (e.g., 10-day cumulative precipitation) related to catchment size and properties (Hirabayashi et al., 2013; Arnell and Lloyd-Hughes, 2014; Kundzewicz et al., 2014; Arnell and Gosling, 2016; Dikanski et al., 2016; Gosling and Arnell, 2016; Forzieri et al., 2017; Fluixá-Sanmartín et al., 2018; Koks et al., 2019). Floods and high-flow events can scour river beds and elevate silt loads, reducing water quality and accelerating deposition in estuaries and reservoirs (Khan et al., 2018; Parasiewicz et al., 2019). Floods can knock down, drown or wash away crops and livestock, and partially submerged plants can have yield reduction depending on water turbidity and their development stage (Ruane et al., 2013; Shrestha et al., 2019). Basin snowpack properties may also be important during heavy rain events, as rain-on-snow events can lead to rapid acceleration of flood stages that threaten wildlife and society (Hansen et al., 2014).
12.3.2.3 Heavy Precipitation and Pluvial Flood
Heavy downpours can lead to pluvial flooding in cities, roadways, farmland, subway tunnels and buildings (particularly those with basements; Grahn and Nyberg, 2017; Palko, 2017; Pregnolato et al., 2017; Orr et al., 2018). Heavy precipitation may overwhelm city transportation and storm water drainage systems, which are typically designed using intensity-duration-frequency information such as the return periods for 1-, 6- or 24-hour rainfall totals (Kermanshah et al., 2017; Depietri and McPhearson, 2018; Rosenzweig et al., 2018; Courty et al., 2019). Heavy rain events can directly cause leaf loss and damage, or knock over crops, also driving pollutant entrainment and erosion hazards in terrestrial ecosystems and farmland, with downstream ramifications for water quality (Hatfield et al., 2014; Segura et al., 2014; Li and Fang, 2016; Chhetri et al., 2019). The proportion of total precipitation that falls in heavy events also affects the percentage that is retained in the soil column, altering groundwater recharge and deep soil moisture content for agricultural use (Fishman, 2016; Lesk et al., 2020).
12.3.2.4 Landslide
Landslides, mudslides, rockfalls and other mass movements can lead to fatalities, destroy infrastructure and housing stock, and block critical transportation routes. Climate models cannot resolve these complex slope failure processes (nor triggering mechanisms such as earthquakes), so most studies rely on proxies or conditions conducive to slope failure (Gariano and Guzzetti, 2016; Ho et al., 2017). Common indices include precipitation intensity-duration thresholds (Brunetti et al., 2010; Khan et al., 2012; Melchiorre and Frattini, 2012) and thresholds related to antecedent wet periods and extreme rainfall intensities (Alvioli et al., 2018; Monsieurs et al., 2019). Landslides and rockfalls may also be exacerbated by permafrost thaw and receding glaciers in polar and mountain areas (Cook et al., 2016; Haeberli et al., 2017; Patton et al., 2019).
12.3.2.5 Aridity
Aridity indices may track long-term changes in precipitation, evapotranspiration demand, surface water, groundwater or soil moisture (Sherwood and Fu, 2014; Herrera-Pantoja and Hiscock, 2015; B.I. Cook et al., 2020). Changes in soil moisture and surface water can shift the rate of carbon uptake by ecosystems (Humphrey et al., 2018) and alter suitable climate zones for wild species and agricultural cultivation (Feng and Fu, 2013; Garcia et al., 2014; Huang et al., 2016a; Schlaepfer et al., 2017; Fatemi et al., 2018; IPCC, 2019c) as well as the prevalence of related pests and pathogen-carrying vectors (Paritsis and Veblen, 2011; Smith et al., 2020). Water table depth, in relation to rooting depth, is also important for farms and forests under dry conditions (Feng et al., 2006). A reduction in water availability (via aridity or hydrological drought) challenges water supplies needed for for municipal, industrial, agriculture and hydropower use (Schaeffer et al., 2012; Arnell and Lloyd-Hughes, 2014; Schewe et al., 2014; Gosling and Arnell, 2016; van Vliet et al., 2016).
12.3.2.6 Hydrological Drought
Water managers often utilize a variety of hydrological drought indices and hydrological models to characterize water resources, low flow conditions and the potential for irrigation (Wanders and Wada, 2015; Mukherjee et al., 2018). Low flow volume and intermittency thresholds can indicate reductions in dissolved oxygen, more concentrated pollutants, and higher stream temperatures relevant for ecosystems, water resource quality and thermal power plant cooling (Feeley et al., 2008; Döll and Schmied, 2012; Schaeffer et al., 2012; Prudhomme et al., 2014; van Vliet et al., 2016). Low water levels may also restrict waterway navigation for commerce and recreation (Forzieri et al., 2018).
12.3.2.7 Agricultural and Ecological Drought
Agricultural and ecological drought indices relate to the ability of plants to meet growth and transpiration needs (Table 11.3; Zargar et al., 2011; Lobell et al., 2015; Pedro-Monzonís et al., 2015; Bachmair et al., 2016; Wehner et al., 2017; Naumann et al., 2018) and the timing and duration of droughts can lead to substantially different impacts (Peña-Gallardo et al., 2019). Drought stress for agriculture and ecosystems is difficult to directly observe, and therefore scientists use a variety of drought indices (Table 11.3), proxy information about changes in precipitation supply and reference evapotranspiration demand, the ratio of actual/potential evapotranspiration or a deficit in available soil water content, particularly at rooting level (Park Williams et al., 2013; Trnka et al., 2014; C.D. Allen et al., 2015; Svoboda and Fuchs, 2017; Mäkinen et al., 2018; Otkin et al., 2018). Severe water stress can lead to crop failure, in particular when droughts persist for an extended period or occur during key plant developmental stages (Hatfield et al., 2014; Jolly et al., 2015; Leng and Hall, 2019). Projections of high wind speed and low humidity (even for just a portion of the day) can also inform studies examining fruit desiccation and rice cracking (Grotjahn, 2021). Drought also raises disease infection rates for West Nile virus (Paull et al., 2017), and the alternation of dry and wet spells induces swelling and shrinkage of clay soils that can lead to sinkholes and destabilize buildings (Hadji et al., 2014).
12.3.2.8 Fire Weather
Complex fire weather indices shed light on conditions that increase the likelihood of wildfire and shifts in the fire season (Flannigan et al., 2013; Bedia et al., 2015; Jolly et al., 2015; Harvey, 2016; Littell et al., 2016; Westerling, 2016; Abatzoglou et al., 2019), which pose particularly acute challenges for indigenous communities (Christianson and McGee, 2019). Projection of future lightning frequency provides information on an important natural triggering mechanism, particularly when coupled with long-term warming and drying trends (Romps et al., 2014; Jin et al., 2015; Veraverbeke et al., 2017). Fuel aridity metrics also help determine vegetative fuel desiccation and therefore the ignitability, flammability and spread of fires when they occur (Abatzoglou and Williams, 2016). The presence of snow cover can influence the length of the fire season and the penetration of fire danger into new portions of the Arctic tundra (Young et al., 2017; Abatzoglou et al., 2019). Data on the changing characteristics of local wind circulations like the Santa Ana in California shed light on future intensity and spread patterns for fires (Jin et al., 2015). Fires also produce smoke plumes that reduce air and water quality (via deposition), adversely affecting health, visibility and water resources both near and far downwind (Dennekamp and Abramson, 2011; McKenzie et al., 2014; Dreessen et al., 2016; Liu et al., 2016; Martin, 2016).
12.3.3 Wind
12.3.3.1 Mean Wind Speed
Changes in the speed and direction of prevailing winds can alter the profile of seed dispersal, windblown pest and disease vectors, animal activities, and dust or pollen dispersal affecting ecosystems, agriculture and human health (Reid and Gamble, 2009; Bullock et al., 2012; Hellberg and Chu, 2016; Nourani et al., 2017). Seasonal winds influence algal blooms, ecosystems and fisheries via lake mixing, ocean currents and coastal upwelling (Bakun et al., 2015; Townhill et al., 2018; Woolway et al., 2020). Changes to wind density also modify a region’s wind and wave renewable energy endowment (Schaeffer et al., 2012; Sierra et al., 2017; Craig et al., 2018; Devis et al., 2018; Tobin et al., 2018; Yalew et al., 2020). D. Li et al. (2020) and Karnauskas et al. (2018a) evaluated wind thresholds at turbine height (about 80–100 m above ground) including periods outside of cut-in (2.5–3 m s–1) and cut-out (about 25 m s–1) levels beyond which given turbines could not operate.
12.3.3.2 Severe Wind Storm
High winds associated with severe storms can destroy trees and houses, break plant stems and knock fruits, nuts and grains to the ground, with tolerance thresholds depending on crop species and developmental stage (Seidl et al., 2017; Lai, 2018; Elsner et al., 2019; Grotjahn, 2021). Severe storms particularly threaten energy infrastructure, with maximum wind speed associated with treefall and breaking of above-ground electrical transmission lines (Ward, 2013; Nik et al., 2020). The profile of heavy wind gusts is also required in the design of skyscrapers (C.-H. Wang et al., 2013) and bridges (Mondoro et al., 2018). Severe storms are difficult to simulate at the relatively coarse spatial scales of Earth system models, thus scientists often project changes by noting areas with increased convective available potential energy (CAPE) and strong low-level wind shear as these are conducive to tornado formation (Diffenbaugh et al., 2013; Tippett et al., 2016; Glazer et al., 2021).
12.3.3.3 Tropical Cyclone
Tropical cyclones and severe coastal storms can deliver wind, water and coastal hazards with the potential for widespread mortality and damages to cities, housing, transportation and energy infrastructure, ecosystems and agricultural lands (Burkett, 2011; NASEM, 2012; Bell et al., 2013; Wehof et al., 2014; Ward et al., 2016; Cheal et al., 2017; Godoi et al., 2018; Koks et al., 2019; Pinnegar et al., 2019). Storm planning is often tied to the Saffir –Simpson scale related to peak sustained wind speed (Izaguirre et al., 2021), with several indices focusing on storms’ overall power and energy, size and translation speed to anticipate destructive potential (Knutson et al., 2015; Wang and Toumi, 2016; Parker et al., 2018; Hassanzadeh et al., 2020).
12.3.3.4 Sand and Dust Storm
Sand and dust storms erode soils, damage crops and induce problems for health, transportation, mechanical equipment and built infrastructure corresponding to the magnitude and duration of high winds and particulate matter concentrations (Goudie, 2014; O’Loingsigh et al., 2014; Crooks et al., 2016; Barreau et al., 2017; Bhattachan et al., 2018; Al Ameri et al., 2019; Middleton et al., 2019). Dust events may be represented as the number of dust hours per year and by particulate matter (PM) concentrations (Leys et al., 2011; Spickett et al., 2011; Hand et al., 2016). Photovoltaic panels can lose energy production efficiency with dust accumulation (Patt et al., 2013; Javed et al., 2017). It is also useful to track dust storm deposition of nutrients necessary for coral and tropical forest systems, but they may also feed algal blooms harming lake and coastal ecosystems, health and recreation (Jickells et al., 2005; Hallegraeff et al., 2014; Gabric et al., 2016). Dust storms also cause air pollution and redistribute the soil-based fungus associated with Valley fever (Barreau et al., 2017; Coopersmith et al., 2017; Tong et al., 2017; Gorris et al., 2018).
12.3.4 Snow and Ice
Cryospheric changes are a focus of (Chapter 9 and were central to the recent IPCC Special Report on the Ocean and Cryosphere in a Changing Climate (SROCC; IPCC, 2019b). Here we focus on the ways that scientists use snow and ice CIDs to understand current and future societal impacts and risks.
12.3.4.1 Snow, Glacier and Ice Sheet
A large number of indices have been used in water resource and ecosystem studies to track changes in snow under current and future climate conditions, including measurements of the snow water equivalent at key seasonal dates, the fraction of precipitation falling as snow, the first and last days of snow cover, and cold season temperatures (Mills et al., 2013; Pierce and Cayan, 2013; Berghuijs et al., 2014; Klos et al., 2014; Musselman et al., 2017; Rhoades et al., 2018). Impact studies also examine shifts in seasonal streamflow for snow-fed river basins (Mote et al., 2005; Pederson et al., 2011; Beniston and Stoffel, 2014; Coppola et al., 2014b, 2018; Fyfe et al., 2017; Islam et al., 2017; Knouft and Ficklin, 2017) as well as the geographic extent of snow cover and the depth of frosts when snow cover’s natural insulation is absent (Scheurer et al., 2009; Millar and Stephenson, 2015). Studies examining the impact of snow changes on winter recreation and transportation have used thresholds of about 30 cm snow depth or snow water equivalent >10 cm to determine the length of the season for alpine and cross-country skiing and snowmobiling (Damm et al., 2017; Wobus et al., 2017b; Spandre et al., 2019; Steiger et al., 2019; Abegg et al., 2021). Changes in snow quality also affect recreational activities (Rutty et al., 2017), and artificial snowmaking can augment recreational snowpack depending on the number of suitable snowmaking hours (e.g., where wet bulb globe temperature (WBGT) <–2.2°C; Wobus et al., 2017b). Local detail may also be provided by tracking the seasonal rain–snow transition line across space and elevation (Berghuijs et al., 2014) (Pierce and Cayan, 2013; Berghuijs et al., 2014; Klos et al., 2014; Musselman et al., 2017).
Change in ice sheet and glacier spatial extent and surface mass balance is relevant for polar and high mountain ecosystems and downstream assets that rely on glacial water resources (J.R. Lee et al., 2017; Milner et al., 2017; Huss and Hock, 2018; Schaefli et al., 2019). The loss of glaciers reduces the thermal consistency of cold streams suitable for some freshwater species (Giersch et al., 2017), and parks and recreation areas may lose appeal as glaciers and seasonal snow cover retreat (Gonzalez et al., 2018; Wang and Zhou, 2019). Rapid glacial retreat can lead to glacial lakes and outburst floods that endanger downstream communities (Carrivick and Tweed, 2016; Cook et al., 2016; Harrison et al., 2018).
12.3.4.2 Permafrost
Changes in permafrost temperature, extent and active layer thickness are metrics that track how permafrost thaw below, for example, roads, airstrips, rails and building foundations in high-latitude and mountain regions may destabilize settlements and critical infrastructure (Pendakur, 2016; Derksen et al., 2018; Duvillard et al., 2019; Olsson et al., 2019; Streletskiy et al., 2019). Warmer conditions can also affect ecosystems, built infrastructure and water resources through thawing of especially ice-rich permafrost (≥20% ice content) and by thawing of ice wedges (Shiklomanov et al., 2017; Hjort et al., 2018), creation of thermokarst ponds and increased subsurface drainage for polar and high-mountain wetlands (Walvoord and Kurylyk, 2016; Farquharson et al., 2019) and the release of water pollutants such as mercury (Burkett, 2011; Schaeffer et al., 2012; Schuster et al., 2018).
12.3.4.3 Lake, River and Sea Ice
Reductions in the duration of thick sea, lake and river ice influence ecosystems as well as ice fishing, hunting, dog sledding and snowmobiling, which are recreation activities for some but vital aspects of many traditional indigenous communities (Durkalec et al., 2015; AMAP, 2017; Baztan et al., 2017; Arp et al., 2018; Rokaya et al., 2018; Knoll et al., 2019; Meredith et al., 2019; Sharma et al., 2019). The seasonal extent of thin ice and iceberg density also determines the viability of shipping lanes and seasonal roads (Valsson and Ulfarsson, 2011; Pizzolato et al., 2016; AMAP, 2017; Mullan et al., 2017; Sturm et al., 2017), oil and gas exploration timing (Schaeffer et al., 2012) and the seasonality of phytoplankton blooms (Oziel et al., 2017). Sea ice is a critical aspect of some ecosystems and fisheries (Massom and Stammerjohn, 2010; Jenouvrier et al., 2014; Bindoff et al., 2019; Meredith et al., 2019). Various definitions of ‘ice free’ Arctic Ocean conditions can be tailored to represent transportation needs, including thresholds of ice coverage (<5% or <30% or <1 million km2) in September or over a four-month period (Laliberté et al., 2016; Jahn, 2018).
12.3.4.4 Heavy Snowfall and Ice Storm
Heavy snowfall is a substantial concern for cities, settlements and key transportation and energy infrastructure (Ward, 2013; Palko, 2017; Janoski et al., 2018; Collins et al., 2019). Heavy snowfall can interfere with transportation (Herring et al., 2018) and cause a loss of both work and school days depending on local snow removal infrastructure. Freezing rain and ice storms can be treacherous for road and air travel (Tamerius et al., 2016), and can knock down power and telecommunication lines if ice accumulation is high (Degelia et al., 2016). Rain-on-snow events can create a solid barrier that hinders wildlife and livestock grazing that is important to indigenous communities (Forbes et al., 2016). Shifts in the frequency, seasonal timing and regions susceptible to ice storms alter risks for agriculture and infrastructure (Lambert and Hansen, 2011; Klima and Morgan, 2015; Ning and Bradley, 2015; Groisman et al., 2016).
12.3.4.5 Hail
Information on the changing frequency and size distribution of hail can help stakeholders build resilience for agriculture, vehicles, transportation infrastructure and buildings, solar panels and wild species that see critical damage at particular hail size thresholds (Dessens et al., 2007; Webb et al., 2009; Patt et al., 2013; Fiss et al., 2019). Most climate models do not directly resolve hail and therefore studies often examine proxies associated with severe mesoscale storms (Tippett et al., 2015; Prein and Holland, 2018), although some regional studies now utilize hail-resolving models (Mahoney et al., 2012; Brimelow et al., 2017).
12.3.4.6 Snow Avalanche
Information about the changing frequency and seasonal timing of snow avalanches is important to assess threats to transportation routes, infrastructure, recreational skiing and people living in alpine communities (Lazar and Williams, 2008; Mock et al., 2017; Ballesteros-Cánovas et al., 2018; Hock et al., 2019). Like landslides and other mass movements, snow avalanches are not directly resolved by climate models and are thus tracked using proxy climate information describing snow avalanche susceptibility, particularly the snow water equivalent, and triggering mechanisms such as warm spells, high winds, rain-on-snow and heavy precipitation (Hock et al., 2019). The quality of snow also provides insight into avalanche hazards (Mock et al., 2017), with the seasonal altitude of wet snowpack (>0.5% liquid water by volume) particularly important in determining characteristics of potential avalanches (Castebrunet et al., 2014).
12.3.5 Coastal
The SROCC included in-depth discussions of threats facing the world’s coastlines (IPCC, 2019b) and Section 9.6 provides further discussion on coastal processes. Here we note major connections between coastal CIDs and ecosystem and societal assets near coastlines.
12.3.5.1 Relative Sea Level
Sea level rise hazards for coastal ecosystems, infrastructure, farmland, cities and settlements in a particular region are often driven by regional changes in relative sea level (RSL) that account for land uplift or subsidence and thus represent local asset vulnerability better than global mean sea level (Box 9.1; Hallegatte et al., 2013; Hinkel et al., 2013; McInnes et al., 2016; Weatherdon et al., 2016; Brown et al., 2018; IPCC, 2019b; Rasoulkhani et al., 2020). Vertical land motion (i.e., land subsidence) caused by local fluid (gas or groundwater) extraction can also have a large influence on relative sea levels (Minderhoud et al., 2020). Several indices have been suggested to signify coastal inundation, including a threshold when the local land elevation falls below the local mean higher high water (MHHW) that is close to the ‘high tide’ level (Kulp and Strauss, 2019) or a threshold when flooding occurs about once every two weeks (Sweet and Park, 2014; Dahl et al., 2017b). RSL rise (or RSLR) can drive increased inland penetration of above-ground and subterranean salt water fronts (i.e., salinity intrusion) affecting coastal ecosystems, agriculture and water resources (Ferguson and Gleeson, 2012; Kirwan and Megonigal, 2013; Rotzoll and Fletcher, 2013; Chen et al., 2016; Colombani et al., 2016; Holding et al., 2016; Sawyer et al., 2016; Mohammed and Scholz, 2018). The rate of RSLR can determine the survival and net pressure on niche coastal ecosystems such as mangroves, tidal flats, sea grasses and coral reefs (Hubbard et al., 2008; Craft et al., 2009; Bell et al., 2013; Kirwan and Megonigal, 2013; Alongi, 2015; Ellison, 2015; Lovelock et al., 2015; Ward et al., 2016; Lee et al., 2018).
12.3.5.2 Coastal Flood
Episodic coastal flooding of coastal communities, farmland, buildings, transportation routes, industry and other infrastructure is caused by extreme total water levels (ETWL), which is the combination of RSL, tides, storm surge and high wave setup at the shoreline (Vitousek et al., 2017; Melet et al., 2018; Vousdoukas et al., 2018, 2020a; Koks et al., 2019; Kirezci et al., 2020). Coastal settlement and infrastructure design often uses coastal flooding metrics such as the ETWL frequency distribution or the 100-year average return interval storm tide (storm surge + high tide) level (McInnes et al., 2016; Mills et al., 2016; Walsh et al., 2016b; Zheng et al., 2017). The duration of floods that overtop coastal protection, due to extreme coastal water levels (ECWL), is important for port and harbour operations and coastal energy infrastructure thresholds (Bilskie et al., 2016; Camus et al., 2017). Frequent inundation by salt water can also have significant impacts on water resources, crops, aquaculture and transportation systems due to corrosion and undercutting of coastal roads, bridges and rails (Zimmerman and Faris, 2010; N. Ahmed et al., 2019; Gopalakrishnan et al., 2019).
12.3.5.3 Coastal Erosion
Effective management of coastal ecosystems, cities, settlements, beaches and infrastructure requires information about coastal erosion driven by storm surge, waves and sea level rise (Dawson et al., 2009; Hinkel et al., 2013; Harley et al., 2017; Mentaschi et al., 2017). Coastal erosion is generally accompanied by shoreline retreat, which can occur as a gradual process (e.g., due to sea level rise) or as an episodic event due to storm surge and/or extreme waves, especially when combined with high tide (Ranasinghe, 2016). The most commonly used shoreline retreat index is the magnitude of shoreline retreat by a pre-determined planning horizon such as 50 or 100 years into the future. Commonly used metrics for episodic coastal erosion include the beach erosion volume due to the 100-year recurrence storm wave height, the full exceedance probability distribution of coastal erosion volume (Li et al., 2014a; Pender et al., 2015; Ranasinghe and Callaghan, 2017) and the cumulative storm energy and storm power index (Godoi et al., 2018). The destruction or overtopping of barrier islands may lead to irreversible changes in the physical system as well as in coastal ecosystems (Carrasco et al., 2016; Zinnert et al., 2019). Shoreline position change rates along inlet-interrupted coasts may also be affected by changes in river flows and fluvial sediment supply (Hinkel et al., 2013; Bamunawala et al., 2018; Ranasinghe et al., 2019). Permafrost thaw and Arctic sea ice decline also reduce natural coastal protection from wave erosion for communities and industry (Forbes, 2011; Melvin et al., 2017).
12.3.6 Oceanic
Oceanic changes and impacts were a substantial focus of SROCC (IPCC, 2019b). Chapter 9 of this Report assesses changes in ocean processes, and here we note major connections used by scientists to understand how oceanic CIDs affect ecosystems and society.
12.3.6.1 Mean Ocean Temperature
Shifts in thermal zones affect the suitability of fisheries and marine and coastal species habitat and migration routes (Hoegh-Guldberg and Bruno, 2010; Doney et al., 2012; Burrows et al., 2014; Urban, 2015; Hixson and Arts, 2016; Tripathi et al., 2016; N. Ahmed et al., 2019; Bindoff et al., 2019). Intertidal species are particularly dependent on suitable conditions for both air and sea surface temperatures (Monaco and McQuaid, 2019). The structure of ocean warming also affects the intensity of upper-ocean stratification and the timing and strength of coastal upwelling (driven also by mean wind changes), which alters the vertical transport of oxygen- and nutrient-rich waters affecting fishery and marine ecosystem productivity (D. Wang et al., 2015).
12.3.6.2 Marine Heatwave
Marine heatwaves (MHW) push water temperatures above key thresholds and have been associated with coral bleaching episodes, species shifts and harmful algal blooms that can disrupt ecosystems, tourism and human health (Box 9.2; Wernberg et al., 2016; Arias-Ortiz et al., 2018; Oliver et al., 2018; Frölicher, 2019; Smale et al., 2019; Sully et al., 2019). The duration and return period of marine heatwaves provide insight into aggregate stresses on marine species, fisheries and ecosystems, with various indices gauging cumulative intensity or the number of days, weeks or months exceeding critical thresholds (Frieler et al., 2013; Frölicher et al., 2018; Hughes et al., 2018b; Cheung and Frölicher, 2020). Hobday et al. (2016) defined marine heatwaves as the exceedance of the 90th percentile of the sea surface temperature (SST) distribution on a given Julian day during five or more consecutive days, while Box 9.2, Figure 1 shows MHW as an exceedance of 99th-percentile 11-day de-seasonalized SSTs. The return period of marine heatwaves is also critical in determining a coral system’s ability to recover before the next event (Hughes et al., 2018a).
12.3.6.3 Ocean Acidity
Uptake of atmospheric CO2 and subsequent increases in dissolved CO2 lowers ocean pH and can reduce carbonate ion concentrations below critical calcium carbonate saturation thresholds for marine and aquatic organisms growth, reproduction and/or survival, with extended implications for marine ecosystems including fisheries (Bell et al., 2013; Kroeker et al., 2013; Barange et al., 2014; Dutkiewicz et al., 2015; Ekstrom et al., 2015; Gattuso et al., 2015; Mathis et al., 2015a; Nagelkerken and Connell, 2015; Behrenfeld et al., 2016; Nagelkerken and Munday, 2016; Tripathi et al., 2016; Jiang et al., 2018; Weiss et al., 2018; N. Ahmed et al., 2019; Bindoff et al., 2019). Lower pH may provide more favourable conditions for toxic algal blooms (Riebesell et al., 2018) and can interact with hypoxic zones to impact ecosystems (Gobler and Baumann, 2016; Cai et al., 2017).
12.3.6.4 Ocean Salinity
Changes in currents, sea ice brine rejection and net freshwater flux in the ocean can alter salinity with effects on mixed layer structure, density stratification and the vertical movement of nutrients and marine organisms (Freeland, 2013; Haumann et al., 2016).
12.3.6.5 Dissolved Oxygen
Ocean warming and increased stratification decrease the oxygen content of the ocean (Griffiths et al., 2017; Schmidtko et al., 2017; Bindoff et al., 2019), lead to an expansion of oxygen minimum zones in the open ocean (Stramma et al., 2012; Zhang et al., 2013) and exacerbate the creation of anoxic ‘dead zones’ in the coastal oceans (Breitburg et al., 2018). Such a decline (characterized by successive dissolved oxygen concentration thresholds) could affect a wide range of marine organisms and reduce marine habitats (Chan et al., 2008; Vaquer-Sunyer and Duarte, 2008; Hoegh-Guldberg and Bruno, 2010; Altieri and Gedan, 2015; Breitburg et al., 2018) and can also lead to further local acidification (Zhang and Gao, 2016; Laurent et al., 2017).
12.3.7 Other Climatic Impact-drivers
12.3.7.1 Air Pollution Weather
Although future air pollution will be strongly driven by air quality policies, anthropogenically-driven changes to temperature, humidity, precipitation and synoptic patterns have the potential to affect the emissions, production, concentration and transport of particulate matter (e.g., from dust, fires, pollen) and gaseous pollutants such as sulphur dioxide, tropospheric ozone and nitrogen dioxide (Section 6.5) with resulting impacts on human health, agriculture and ecosystems (Ren et al., 2011; Fiore et al., 2015; Kinney et al., 2015a; Tian et al., 2016; Orru et al., 2017; Emberson et al., 2018; Hayes et al., 2020). Information about conditions leading to poor air quality is also important for visibility in natural parks and tourist locations (Yue et al., 2013; Val Martin et al., 2015), as well as the efficiency of solar photovoltaic panels (Sweerts et al., 2019). Relevant information about conditions favouring air pollution includes tracking warmer conditions that accelerate ozone formation (Peel et al., 2013; Schnell et al., 2016) and the frequency and duration of stagnant air events (Horton et al., 2014; Fann et al., 2015; Lelieveld et al., 2015; Vautard et al., 2018), although no regional index has proven sufficient to capture regional changes or acute events (Kerr and Waugh, 2018; Schnell et al., 2018). By contrast, precipitation and moister air tend to reduce pollution (Section 6.5).
12.3.7.2 Atmospheric Carbon Dioxide at Surface
Carbon dioxide (CO2) is a well-mixed greenhouse gas with global repercussions on Earth’s energy balance; however, atmospheric CO2 concentration changes at the land surface also affect plant functions within ecosystems and agriculture (see also Chapter 5). High CO2 concentration can increase photosynthesis rates and primary production within natural ecosystems (Norby et al., 2010; Ratliff et al., 2015; Zhu et al., 2016) and agricultural crops (Hatfield et al., 2011; Leakey et al., 2012; Bell et al., 2013; Glenn et al., 2014; Nagelkerken and Connell, 2015; Behrenfeld et al., 2016; Deryng et al., 2016; Kimball, 2016). High CO2 concentration affects total biomass and plant sugar content important to bioenergy production (Schaeffer et al., 2012), but also helps some pests and weeds flourish (Hamilton et al., 2005; Wolfe et al., 2008; Valerio et al., 2013; Korres et al., 2016; Stinson et al., 2016; Ramesh et al., 2017), while potentially shifting the effectiveness of herbicides (Varanasi et al., 2016; Refatti et al., 2019). Higher CO2 concentration reduces transpiration losses during drought conditions (Cammarano et al., 2016; Deryng et al., 2016; Swann et al., 2016; Durand et al., 2018), which also changes the energy balance within the plant canopy (Webber et al., 2017). Higher CO2 reduces the nutritional density of crops and forage lands (Loladze, 2014; Müller et al., 2014; Myers et al., 2014, 2017; X. Li et al., 2016; M.A. Lee et al., 2017; Smith and Myers, 2018; Zhu et al., 2018; Beach et al., 2019) and can increase the production of toxins (Ziska et al., 2007) and allergenic pollen (Schmidt, 2016).
12.3.7.3 Radiation at Surface
Changes in surface solar and longwave radiation fluxes alter photosynthesis rates and potential evapotranspiration for natural ecosystems and food, fibre and energy crops (Mäkinen et al., 2018); changes in radiation fluxes can also shift solar energy resources (Schaeffer et al., 2012; Jerez et al., 2015; Wild et al., 2015; Fant et al., 2016; Craig et al., 2018). Plants and aquatic systems particularly respond to changes in photosynthetically active radiation (PAR) and the fraction of diffuse radiation (Proctor et al., 2018; Ren et al., 2018; Ryu et al., 2018). Increases in ultraviolet radiation can also detrimentally affect ecosystems and human health (Barnes et al., 2019).
12.3.7.4 Additional Relevant Climatic Impact-drivers
Additional CIDs may be relevant for regional studies but are not the focus of assessment in this Report. For example, information about changes in the frequency and seasonal timing of fog helps anticipate airport delays and cool beach days, and is also important for water delivery and retention in coastal ecological and agricultural systems (Torregrosa et al., 2014).
Threats to many sectoral assets and associated systems may also be compounded when multiple hazards occur simultaneously in the same place, affect multiple regions at the same time, or occur in a sequence that may amplify overall impact (Section 11.8; IPCC, 2012; Clarke et al., 2018; Zscheischler et al., 2018; Raymond et al., 2020). There is emerging literature on many connected extremes and their associated hazards (e.g., climatic conditions that could drive multi-breadbasket failures; Trnka et al., 2019; Kornhuber et al., 2020), but a full accounting is not practical here especially considering the many possible CID combinations and the need to assess how exposed systems would be vulnerable to compound CIDs (assessed in WGII). Table 12.2 is once again instructive here in considering hazard-related storylines, as the multiple CIDs affecting a given sectoral asset (assessing across a row of Table 12.2) point to potentially dangerous hazard combinations. Similarly, change in a single CID has the potential to affect multiple sectoral assets (assessing down a column of Table 12.2) in a manner with broader systemic implications (AR6 WGII).
Recent literature defines CID indices to represent trends and thresholds that influence sectoral assets, albeit with considerable variation owing to the unique characteristics of regional and sectoral assets. Indices include direct information about the CID’s profile (magnitude, frequency, duration, timing, spatial extent) or utilize atmospheric conditions as a proxy for CIDs that are more difficult to directly observe or simulate. Each sector is affected by multiple CIDs, and each CID affects multiple sectors. Assets within the same sector may require different or tailored indices even for the same CID. These indices may be defined to capture graduated thresholds associated with tipping points or inflection points in a particular sectoral vulnerability, with commonalities in the types of processes these thresholds represent even as their precise magnitude may vary by specific sectoral system and asset.
12.4 Regional Information on Changing Climate
This section describes the historical and projected changes in commonly used indices and thresholds associated with the main climatic impact-drivers (Sections 12.2 and 12.3) at the scale of AR6 regions described in Figure 1.18a. The section is organised by continents (Sections 12.4.1–12.4.6) with a specific assessment for Small Islands (Section 12.4.7), open and deep ocean (Section 12.4.8), and polar regions (Section 12.4.9) as defined in Chapter 1 (Figure 1.18c). In addition, CID indices and thresholds relevant to ‘specific zones’, as defined in AR6 WGII Cross-Chapter Papers, are assessed in Section 12.4.10 except for the Mediterranean, which is addressed both under Africa and Europe (Sections 12.4.1 and 12.4.5) and is a focus in Section 10.6.4.
Regional assessment method and tables: In each section herein (Sections 12.4.1–12.4.10), we assess changes in sector-relevant CIDs following the main CID categories defined in Section 12.2 through commonly used indices and thresholds relevant for sectors described in 12.3. Sections 12.4.1–12.4.9 each include a summary qualitative CID assessment table (Tables 12.3–12.11) showing the confidence levels associated with the direction of projected CID changes (i.e., increasing or decreasing) for the mid-century period (2041–2060) relative to the recent past, for scenarios RCP4.5, SSP2-4.5, SRES A1B, or above (RCP6.0, RCP8.5, SSP3-7.0, SSP5-8.5, SRES A2), which approximately encompasses GWLs of 2.0°C to 2.4°C (as best estimate; see Chapter 4, Table 4.5). For scenarios RCP2.6, SSP1-2.6 or SSP1-1.9, the signal may have lower confidence levels in some cases due to smaller overall changes, embedded in a similar internal variability, and to the availability of relatively few studies that account for these scenarios. Nevertheless, CID changes under these lower emissions scenarios are included in the text whenever information is available. For each cell in Tables 12.3–12.11, literature is assessed, aided by global Figure 12.4 or regional Figures 12.5–12.10. Confidence in projections is established considering evidence emerging from observations, attribution and projections, as explained in Cross-Chapter Box 10.3 while considering the amount of evidence and agreement across models and studies and model generations.
 Figure 12.4 | Median projected changes in selected climatic impact-driver indices based on CMIP6 models. (d–f) mean number of days per year with the NOAA Heat Index (HI) exceeding 41°C; (g–i) number of negative precipitation anomaly events per decade using the six-month Standardized Precipitation Index; (j–l) mean soil moisture (%) and (m–o) mean wind speed (%). (p–r) shows change in extreme sea level (1-in-100-year return period total water level from Vousdoukas et al. (2018)’s CMIP5 based dataset; metres). Left-hand column is for SSP1-2.6, 2081–2100; middle column is for SSP5-8.5 2041–2060; and right-hand column SSP5-8.5, 2081–2100, all expressed as changes relative to 1995–2014. Exception is extreme total water level which is for (p) RCP4.5 2100, (q) RCP8.5 2050 and (r) RCP8.5 2100, each relative to 1980–2014. Bias correction is applied to daily maximum temperature and HI data (Atlas.1.4.5). Uncertainty is represented using the simple approach: no overlay indicates regions with high model agreement, where ≥80% of models agree on the sign (direction) of change; diagonal lines indicate regions with low model agreement, where <80% of models agree on the sign of change. For more information on the simple approach, please refer to the Cross-Chapter Box Atlas.1. See (Annex VI for details of indices. Figures 12.SM.1–12.SM.6 show regionally averaged values of these indices for the AR6 WGI Reference Regions for various model ensembles, scenarios, time horizons and global warming levels. Further details on data sources and processing are available in the chapter data table (Table 12.SM.1).
The confidence levels associated with the directions of projected CID changes are synthesized assessments based on literature that may utilize different indices and baseline periods or projections by GWLs. For extreme heat, cold spell, heavy precipitation and drought CIDs that are assessed in Chapter 11, here we draw projections from the 2°C GWL tables in Section 11.9. In some cases, more details are needed in order to emphasize one aspect of projected CID change. For instance, the change in a CID may be different for intensity, duration, frequency; or there can be strong sub-regional or seasonal signals; or different CID indices may have conflicting signals. A footnote is added in such cases, but a confidence level for a direction of projected change is given based on the Section 12.3 assessment of aspects of regional CID change that are most relevant for impacts and for risks. As an example, tropical cyclones are increasing in intensity but decreasing in frequency in some regions. Here, in assessing the confidence of the direction of projected change in the Tropical cyclone CID (i.e., the colour of the table cell), we assign more weight to the ‘intensity’ rather than the ‘frequency’, corresponding to the higher relevance of the intensity of major tropical cyclones for risk assessment. Low confidence of changes, arising from lack of evidence, strong spatial or seasonal heterogeneity, or lack of agreement, are represented by colour-less cells, and, for the sake of simplicity, only two categories of confidence are given: medium confidence and high confidence (and higher). In addition, CID assessment tables also indicate observed or projected emergence of the CID change signal from the natural interannual variability if assessed with at least medium confidence in Section 12.5.2, using as a basis a criterion of S/N > 1, noise being defined as the interannual variability. The time of emergence (ToE) is given as either: (i) already emerged in the historical period, or (ii) emerging by 2050 at least for RCP8.5/SSP5-8.5, or (iii) emerging after 2050 but before 2100 at least for scenarios RCP8.5 or SSP5-8.5. Table cells that do not include emergence information are indicative of ‘low confidence of emergence in the 21st century’, which includes situations where assessment indicates emergence will not occur before 2100 or that evidence is not available or insufficient for a confidence assessment of time of emergence.
Figures: The assessment of changes in CIDs is based on literature, physical understanding (Chapters 2–11), and global and regional climate projections of indices and thresholds presented in the Atlas, as well as in the global and regional figures in Section 12.4 (Figures 12.4–12.10) showing the future evolution of nine key CID indices/thresholds used in this assessment (see also Cross-Chapter Box 10.3). The figure indices and impact-relevant thresholds are described in Annex VI: Climatic Impact-drivers and Extreme Indices.
Figure 12.4 shows changes in six CID indices. These global maps are derived from Coupled Model Intercomparison Project Phase 6 (CMIP6) simulations for different time periods and scenarios (except for extreme total water level where CMIP Phase 5 (CMIP5) is used). The uncertainty due to climate models, time, scenarios and regional downscaling is illustrated in Supplementary Material SM.12.1 to SM.12.6, which show the distribution of the spatial average of the index among models over each land region for CMIP5, CMIP6 and Coordinated Regional Climate Downscaling Experiment (CORDEX) ensembles for the recent past, mid- and end-21st century, and for GWLs of +1.5°C, +2°C and +4°C. The hatching in the figure covers areas where less than 80% of models agree on the sign of change.
Further regional detail is provided for the remaining indices in each continental section in the form of continental maps accompanied by regional box plots displaying changes calculated for AR6 region averages, and the associated regionally averaged uncertainty.
Climatic impact-drivers changing in a globally coherent way: For the sake of conciseness, assessments pertaining to ocean acidity and the ‘Other’ CID type in Sections 12.2 and 12.3 are not provided per region in Sections 12.4.1–12.4.9 but are summarized here, given the globally coherent way in which they change.
Ocean acidity: Observations show increasing ocean acidification (robust evidence, high agreement), and it is virtually certain that future ocean acidification will increase given future increases in greenhouse gases (Section 5.4). Areas below calcium carbonate saturation thresholds expanded from the 1990s to 2010 and Meredith et al. (2019) indicated that both the Southern and Arctic Oceans will experience year-round under-saturation conditions by 2100 under RCP8.5. The vertical level of the aragonite saturation horizon off the Pacific coast of North America has risen towards the surface by 30–50 m since pre-industrial times (Mathis et al., 2015b; Feely et al., 2016). In a study of US coastlines, Ekstrom et al. (2015) mapped out the projected year when aragonite saturation state drops below 1.5 (a sublethal threshold for bivalve mollusc larvae), finding hazardous conditions before 2030 from northern Oregon to Alaska and before 2100 for the Pacific coast and Atlantic coastline north of New Jersey. Mathis et al. (2015a) found that surface waters in the Beaufort Sea have already dropped below aragonite saturation thresholds, projecting further declines and the Chukchi Sea also dropping below saturation by about 2030.
Air pollution weather: The effect of climate change on air quality is assessed in Section 6.5 with limitations for local planning explained in Section 6.1.3, and only a brief summary is given here. Section 6.5 notes that climate change will have a small burden on particulate matter (PM) pollution (medium confidence) while the main controlling factor in determining future concentrations will be future emissions policy for PM and their precursors (high confidence). Surface ozone is sensitive to temperature and water vapour changes, but future levels depend on precursor emissions. Although there is low confidence in precise regional changes (Section 6.5), climate change will generally introduce a surface ozone (O3) penalty (increasing concentrations with increasing warming levels) over regions with high anthropogenic and/or natural ozone precursor emissions, while in less polluted regions higher temperatures and humidity favour destruction of ozone (Schnell et al., 2016). There is low confidence in changes to future stagnation events given the lack of robust projections of related atmospheric conditions, such as future atmospheric blocking events (Sections 3.3.3 and 8.4.2). The response of regional air pollution to climate change will also be affected by other CIDs like fire weather, as well as by ecosystem responses such as shifts in emissions by vegetation (Fiore et al., 2015). Section 6.5 assessed medium confidence that climate-driven changes to meteorological conditions generally favour extreme air pollution episodes in heavily polluted environments, but noted strong regional and metric dependencies. Given the dominant influence of future air quality policies, uncertainties around stagnation or blocking events, and the potential contrasting regional changes of conditions favouring ozone and PM formation, accumulation and destruction, cells in Tables 12.3–12.11 for air pollution weather are marked as low confidence, and the reader is referred to Section 6.5 for further details.
Atmospheric CO2 at surface: Observations show rising atmospheric CO2 concentrations at the surface over all Earth regions (robust evidence, high agreement) (Sections 2.2 and 5.1.1), and it is virtually certain that surface atmospheric CO2 concentrations will continue to increase without substantial changes to emissions (Section 5.4).
Radiation at surface: Radiation has undergone decadal variations in past observations, which are mostly responding to the so-called dimming and brightening phenomenon driven by the increase and decrease of aerosols. Over the last two decades or so, brightening continues in Europe and North America and dimming stabilizes over South and East Asia and increases in some other areas (Section 7.2.2.3). Future regional shortwave radiation projections depend mostly on cloud trends, aerosol and water vapour trends, and stratospheric ozone when considering UV radiation. Over Africa in 2050 and beyond, there is medium confidence that radiation will increase in North and South Africa and decrease over the Sahara, North Eastern Africa and Western Africa (Wild et al., 2015, 2017; Soares et al., 2019; C. Tang et al., 2019; Sawadogo et al., 2020, 2021). Over Asia, the CMIP5 multi-model mean response shows that solar radiation will decrease in South Asia and increase in East Asia (medium confidence) by the mid-century RCP8.5 (Wild et al., 2015, 2017; Ruosteenoja et al., 2019b). Projected solar resources show an increasing trend throughout the 21st century in East Asia under RCP2.6 and RCP8.5 scenarios in CMIP5 simulations (medium confidence) (Wild et al., 2015; F. Zhang et al., 2018; Shiogama et al., 2020). More sunshine is projected over Australia in winter and spring by the end of the century (medium confidence) with the increases in Southern Australia exceeding 10% (CSIRO and BOM, 2015; Wild et al., 2015). In Central and South America, there is medium confidence of increasing solar radiation over the Amazon basin and the northern part of South America (medium confidence) (Wild et al., 2015, 2017; de Jong et al., 2019). There is low confidence for an increase in surface radiation in central Europe, owing in particular to disagreement in cloud cover across global and regional models (Jerez et al., 2015; Bartók et al., 2017; Craig et al., 2018), as well as water vapour. The treatment of aerosol appears to be key in explaining these differences (Boé, 2016; Undorf et al., 2018; Boé et al., 2020; Gutiérrez et al., 2020). Regional and global studies, however, indicate that there is medium confidence in increasing radiation over southern Europe and decreasing radiation over Northern Europe. Increasing radiation trends are also found over southern and eastern USA, and decreasing trends over North-Western North America (Wild et al., 2015; Losada Carreño et al., 2020), despite large differences between responses from regional climate models (RCMs) and general circulation models (GCMs) over southern and eastern USA (low confidence), where, as for Central Europe, the role of aerosols appears important (Chen, 2021). Over polar regions there is medium confidence of a decrease in radiation due to increasing moisture in the atmosphere and clouds (Wild et al., 2015).
12.4.1 Africa
Previous IPCC assessments results are summarized in Atlas.4.1.1 For the purpose of this assessment the Africa region has been divided in nine sub-regions of which eight – Sahara (SAH), Western Africa (WAF), Central Africa (CAF), North Eastern Africa (NEAF), South Eastern Africa (SEAF), West Southern Africa (WSAF), East Southern Africa (ESAF) and Madagascar (MDG) – are the official AR6 regions (Figure Atlas.2) and one – North Africa – is used in this assessment to indicate the African portion of the Mediterranean region.
Quite a large body of new literature is now available for the African climate as a result of regionally downscaled CORDEX Africa outputs, in particular, providing projections of both the mean climate (Mariotti et al., 2014; Nikulin et al., 2018; Dosio et al., 2019; Teichmann et al., 2021) and extreme climate phenomena (Giorgi et al., 2014; Nikulin et al., 2018; Dosio et al., 2019; Coppola et al., 2021b). CORDEX Africa simulations are assessed in the Atlas, which finds reasonable skill in mean temperature and precipitation as well as important features of regional climate (e.g., timing of monsoon onset in West Africa) although lower performance in Central Africa.
12.4.1.1 Heat and Cold
Mean air temperature: The African continent has experienced increased warming since the beginning of the 20th century in regions where measurements allow a sufficient homogeneous observation coverage to estimate trends (high confidence) (Figure Atlas.11). This warming is very likely attributable to human influence (Chapter 3 and Atlas.4.2) at continental scale. Mean annual temperatures have increased at a high rate since the mid-20th century, reaching 0.2°C–0.5°C per decade in some regions such as north, north-eastern, west and south-western Africa (high confidence) (Atlas.4.2 and Figure Atlas.11).
It is very likely that temperatures will increase in all future emissions scenarios and all regions of Africa (Atlas.4.4). By the end of the century under RCP8.5 or SSP5-8.5, all African regions will very likely experience a warming larger than 3°C except Central Africa, where warming is very likely expected above 2.5°C, while under RCP2.6 or SSP1-2.6, the warming remains very likely limited to below 2°C (Figure Atlas.12). A very likely warming with ranges between 0.5°C and 2.5°C is projected by the mid-century for all scenarios depending on the region (high confidence). Mean temperatures for all regions are projected to increase with increasing global warming (virtually certain) (Figure Atlas.12).
Extreme heat: Warm extremes have increased in most of the regions (high confidence), NEAF, SEAF and MDG (medium confidence) and with low confidence in CAF (Table 11.4). Despite the increasing mean temperature, there is low confidence (limited evidence) that Africa has experienced increased extreme heat stress trend for agriculture or human health in the last two decades of the 20th century in a few regions such as West Africa, South Africa and North Africa considering the period from 1973 to 2012 (Knutson and Ploshay, 2016).
A substantial increase in heatwave magnitude and frequency over most of the Africa domain is projected for even 2°C global warming (high confidence) (Sections 11.3 and 11.9, and Table 11.4), with potential effects on health and agriculture. The number of days with maximum temperature exceeding 35°C is projected to increase (Coppola et al., 2021b) in the range of 50–100 days by 2050 under SSP5-8.5 in WAF, ESAF and WSAF and NEAF (high confidence) (Figure 12.4b). Under SSP1-2.6, the change in the number of exceedance days remains limited to about 40–50 days per year at the end of the century in these regions, while it increases by 150 days or more in WAF, CAF for SSP5-8.5 (Figure 12.4a,c; Figure 12.SM.1).
Mortality-related heat stress levels and deadly temperatures are very likely to become more frequent in the future in RCP8.5/SSP5-8.5 and RCP4.5/SSP2-4.5 and for a 2°C global warming (Mora et al., 2017; Nangombe et al., 2018; Sylla et al., 2018a; Rohat et al., 2019; Q. Sun et al., 2019). In particular the equatorial regions where heat is combined with higher humidity levels, but also North Africa, the Sahel and Southern Africa (Figure 12.4d–f) are among the regions with the largest increases of heat stress (Zhao et al., 2015; Ahmadalipour and Moradkhani, 2018; Coffel et al., 2018). Mitigation scenarios make a large difference in frequency of exceedance of high heat stress indices thresholds (e.g., HI > 41°C) by the end of the century (Figure 12.4d–f; Schwingshackl et al., 2021). In West Africa and Central Africa, under SSP5-8.5, the expected number of days per year with HI > 41°C will increase by around 200 days while in SSP1-2.6 such exceedances are expected to increase by less than 50 days per year (Figure 12.4; Figure 12.SM.2).
Cold spell and frost: Africa experiences cold events and frost days that can affect agriculture, infrastructure, health and ecosystems, especially in Southern and North Africa, which have marked cold seasons and mountainous areas. Cold spells have likely decreased in frequency over subtropical areas. In particular, in North and Southern Africa, the frequency of cold events has likely decreased in the last few decades (Sections 11.3 and 11.9). There is a high confidence that cold spells and low target temperatures will decrease in future climates under all scenarios in West, Central and East Africa. Heating degree days will have a substantial decrease by the end of the century for up to about one month under RCP8.5 in North and Southern Africa (high confidence) (Coppola et al., 2021b).
There is high confidence that extreme heat has increased in frequency and intensity in most African regions. Heatwaves and deadly heat stress and the frequency of exceedance of hot temperature thresholds (e.g., 35°C) will drastically increase by the end of the century (high confidence) under SSP5-8.5, but limited increases are expected in SSP1-2.6. Dangerous heat stress thresholds (HI > 41°C) are projected to be crossed more than 200 days more in West and Central Africa under SSP5-8.5, while this increase remains limited to a few tens of days more for SSP1-2.6. Cold spells and frost days are projected to occur less frequently in all scenarios.
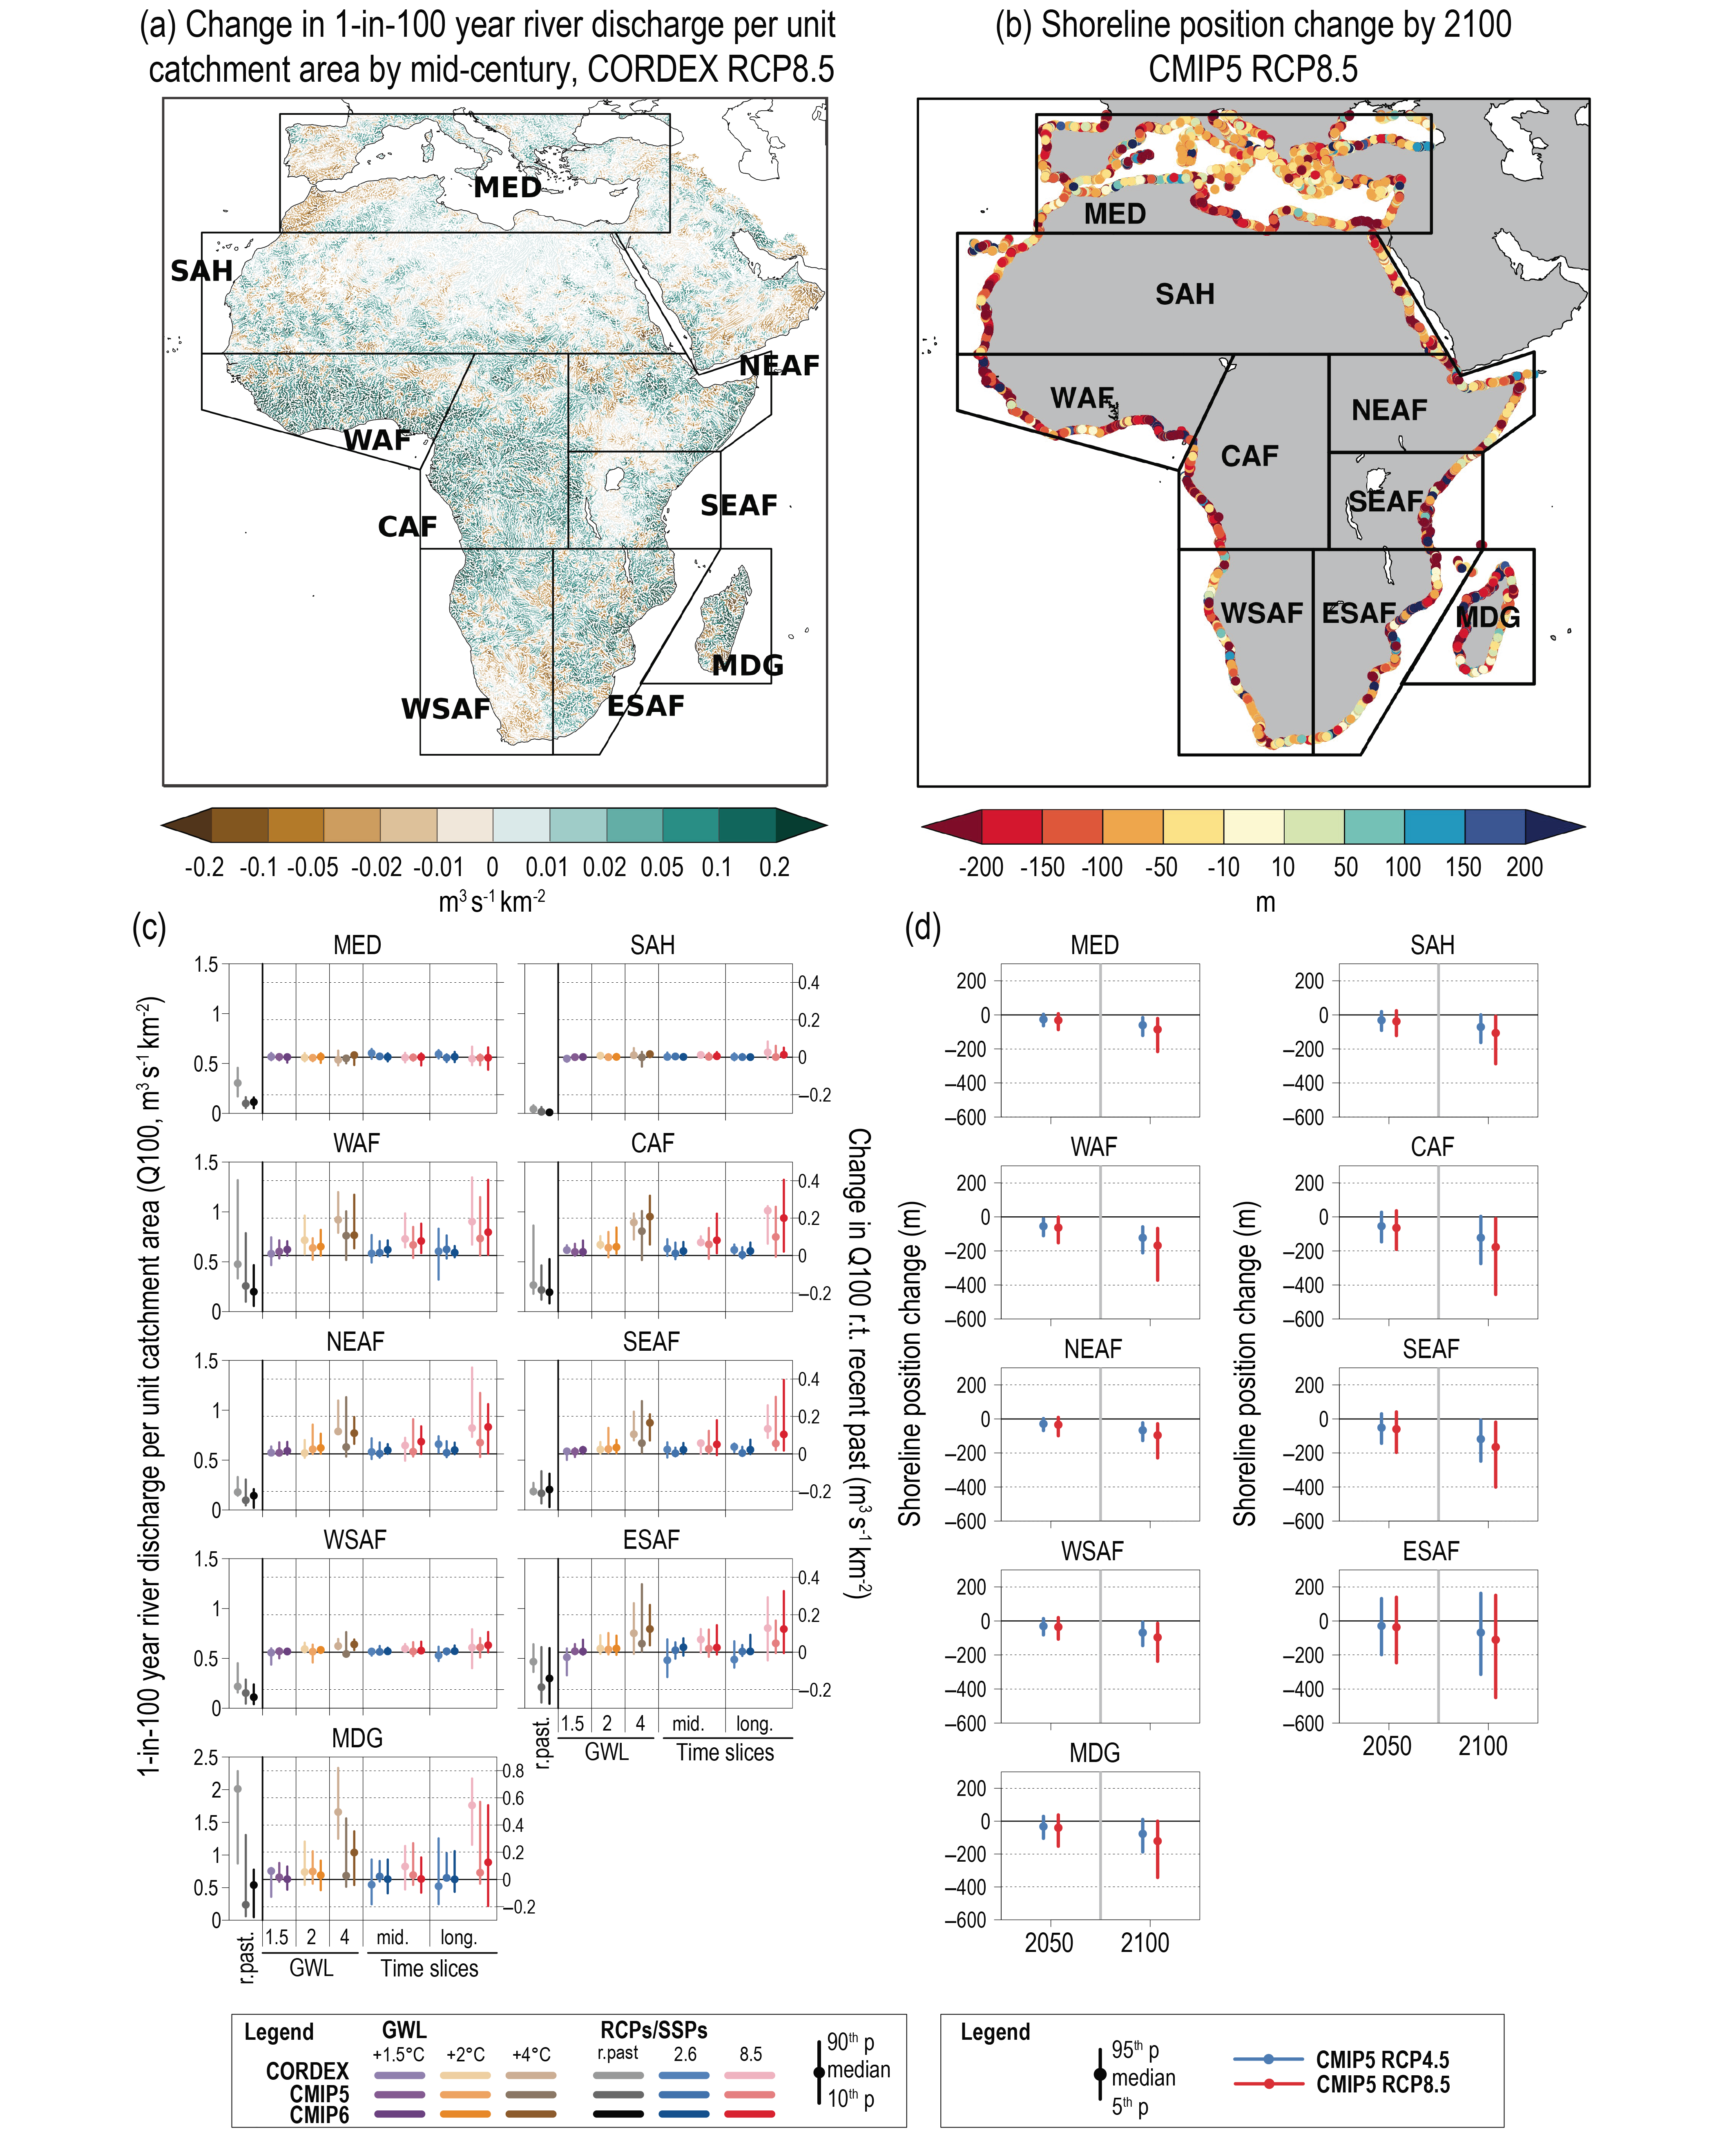 Figure 12.5 | Projected changes in selected climatic impact-driver indices for Africa. Mean change in 1-in-100-year river discharge per unit catchment area (Q100, m3s–1km–2) from CORDEX-Africa models for 2041–2060 relative to 1995–2014 for RCP8.5. (b) Shoreline position change along sandy coasts by the year 2100 relative to 2010 for RCP8.5 (metres; negative values indicate shoreline retreat) from the CMIP5-based dataset presented by Vousdoukas et al. (2020b). (c) Bar plots for Q100 (m3s–1km–2) averaged over land areas for the AR6 WGI Reference Regions (defined in Chapter 1). The left-hand column within each panel (associated with the left-hand y-axis) shows the ‘recent past’ (1995–2014) Q100 absolute values in grey shades. The other columns (associated with the right-hand y-axis) show the Q100 changes relative to the recent past values for two time periods (‘mid’ 2041–2060 and ‘long’ 2081–2100) and for three global warming levels (GWLs, defined relative to the pre-industrial period 1850–1900): 1.5°C (purple), 2°C (yellow) and 4°C (brown). The bars show the median (dots) and the 10–90th percentile range of model ensemble values across each model ensemble. CMIP6 is shown by the darkest colours, CMIP5 by medium, and CORDEX by light. SSP5-8.5/RCP8.5 is shown in red and SSP1-2.6/RCP2.6 in blue. (d) Bar plots for shoreline position change show CMIP5-based projections of shoreline position change along sandy coasts for 2050 and 2100 relative to 2010 for RCP8.5 (red) and RCP4.5 (blue) from Vousdoukas et al. (2020b). Dots indicate regional mean change estimates and bars show the 5–95th percentile range of associated uncertainty. Note that these shoreline position change projections assume that there are no additional sediment sinks/sources or any physical barriers to shoreline retreat. See Technical (Annex VI for details of indices. Further details on data sources and processing are available in the chapter data table (Table 12.SM.1).
12.4.1.2 Wet and Dry
Mean precipitation: Since the mid-20th century, precipitation trends have varied in Africa but notable drying trends are found in eastern, central and north-eastern parts of Southern Africa, Central Africa and in the Horn of Africa (Atlas.4.2).
There is high confidence in projected mean precipitation decreases in North Africa and West Southern Africa and medium confidence in East Southern Africa by the end of the 21st century (Dosio et al., 2019; Gebrechorkos et al., 2019; Teichmann et al., 2021; Atlas.4.5). The Western Africa region features a gradient in which precipitation decreases in the west and increases in the east and increase is also projected over Eastern Africa (medium confidence) (Atlas.4.5), with trends in Western Africa affecting the boreal summer monsoon (Chen et al., 2020). Increasing precipitation for 1.5°C and 2°C GWLs are found in central and eastern Sahel with low confidence and the wet signal is getting stronger and more extended for a 3°C and 4°C warmer world (Atlas.4.4).
A change in monsoon seasonality is also reported in Western Africa and Sahel (low confidence) with a forward shift in time (later onset and end; Section 8.2; Mariotti et al., 2011; Seth et al., 2013; Ashfaq et al., 2021). This shift has been associated with a precipitation decrease during the monsoon season attributed to a decrease of African easterly wave activity in the 6–9-day regime (Mariotti et al., 2014) and a soil precipitation feedback reported in Mariotti et al. (2011).
River flood: Generally in Africa from 1990 through 2014, annual flood frequencies have fluctuated and there is medium confidence in an upward trend in flood events occurrences (C.-J. Li et al., 2016). In particular, over Western Africa, upward trends in hydrological extremes such as maximum peak discharge have likely occurred during the last few decades (i.e., after 1980) and have caused increased flood events in riparian countries of rivers such as Niger, Senegal and Volta (high confidence) (Nka et al., 2015; Aich et al., 2016a; Wilcox et al., 2018; Tramblay et al., 2020). In Southern Africa, trends in flood occurrences were decreasing prior to 1980 and increasing afterwards (medium confidence) (Tramblay et al., 2020).
Under future climate scenarios, the extreme river discharge as characterized by the 30-year return period of 5-day average peak flow is projected to increase by the end of the century for RCP8.5 (more than 10% relative to the 1971–2000 period) for most of the tropical African river basins (Dankers et al., 2014) and a consistent increase of flood magnitude is projected across humid tropical Africa by 2050 for the A1B scenario (medium confidence) (Figure 12.5; Arnell and Gosling, 2013). Specifically, in Western Africa there is not a univocal pattern of change for future projections (Roudier et al., 2014); However, under RCP8.5, there is medium confidence of a projected increase of 20-year flood magnitudes by 2050 in countries within the Niger River basin (Aich et al., 2016b) and low confidence (limited evidence) of an increase in extreme peak flows and their duration in countries of the Volta River basin by 2050 and 2090 (Jin et al., 2018). A significant median change of flood magnitude for the Gambia River (–4.5%) and for the Sessandra (+14.4%) and Niger (+6.1%) are projected under several scenarios between mid- and end-of-century (Roudier et al., 2014). In East Africa, extreme flows are projected to increase for regions within the Blue Nile basin with low confidence (limited evidence) (Aich et al., 2014). However, uncertainty due to the climate scenario dominates the projection of extreme flows (Aich et al., 2014; Krysanova et al., 2017) for the Blue Nile and Niger River basins. Averaged over the African continent for different levels of global warming, the present-day 100-year return period flood levels will have a return period of 40 years in 1.5°C and 2°C (Alfieri et al., 2017) and 21 years for 4°C warmer climate (Hirabayashi et al., 2013; Alfieri et al., 2017).
Heavy precipitation and pluvial flood: Chapter 11 found that heavy precipitation intensity and frequency has likely increased over West and East Southern Africa but there is no evidence due to a lack of studies that any significant trend is observed in any other region. In addition, East Africa has experienced strong precipitation variability and intense wet spells leading to widespread pluvial flooding events hitting most countries including Ethiopia, Somalia, Kenya and Tanzania (medium confidence). Finally, with respect to Southern Africa, heavy precipitations events have increased in frequency (medium confidence).
In West Africa and Central Africa, there is high confidence that the intensity of extreme precipitation will increase in a future climate under both RCP4.5 and RCP8.5 scenarios and 1.5°C and 2°C GWLs threatening widespread flood occurrences before, during and after the mature monsoon season (Chapter 11). Extreme precipitation intensity is also increasing in several other regions, such as SAH, NEAF, SEAF, ESAF and MDG (high confidence) for 2°C GWL and higher (Chapter 11).
Landslides: There is an increase in reported landslides in WAF, CAF, NEAF and SEAF in the past decades but with limited evidence of significant trends (Gariano and Guzzetti, 2016; Haque et al., 2019). There is low confidence (limited evidence) of a future increase in landslides in central-eastern Africa, and literature is largely missing to assess this important hazard (Gariano and Guzzetti, 2016).
Aridity: Section 11.9 assesses medium confidence in observed long-term declines of soil moisture and aridity indices in several African regions (NAF, WAF). Trends in East Africa are not definitive given uncertain balances between precipitation and potential evaporation (Kew et al., 2021). Projected declines in precipitation and soil moisture trends indicate high confidence in increased aridity over the 21st century in NAF, WSAF and ESAF but low confidence elsewhere in Africa (Section 11.9; see also Figure 12.4j–l; Gizaw and Gan, 2017). A growing number of studies provide further regional context on expanding aridity in several places in East and West Africa, respectively (Sylla et al., 2016a; Liu et al., 2018b; Haile et al., 2020).
Hydrological drought: Section 11.9 noted observed decreases in hydrological drought over the Mediterranean (high confidence) and diminished summer river flows in West Africa (medium confidence). Recent regional modelling studies project substantial increases in hydrological drought affecting major West African river basins under 1.5°C and 2°C GWLs and RCP4.5 and RCP8.5 scenarios (Oguntunde et al. 2018, 2020; Sylla et al., 2018b); however, there remains low confidence in future projections given disagreement with global model runoff projections (e.g., B.I. Cook et al., 2020). There is high confidence that a 2°C GWL would see an increase in hydrological droughts in the Mediterranean region, and medium confidence in increasing hydrological drought conditions in the Southern Africa regions (Section 11.9).
Agricultural and ecological drought: Farmers and food security experts in East Africa have noted spatial extensions in seasonal agricultural droughts in recent decades (Elagib, 2014), but it is difficult to disentangle these trends from climate variability. In Ethiopia, past severe agricultural drought conditions in the northern regions are moderately common events in recent years (Zeleke et al., 2017). In Southern Africa, the number of ‘flash’ droughts (with rapid onset and durations from a few days to couple of months) have increased by 220% between 1961 and 2016 as a result of anthropogenic warming (Yuan et al., 2018). Section 11.9 notes medium confidence increases in agricultural and ecological drought trends in North, Western and Central Africa as well as both Southern Africa regions. The most striking drought is the Western Cape drought in 2015–2018, a prolonged drought that resulted in acute water shortages (Wolski, 2018; Burls et al., 2019; Section 10.6.2). Anthropogenic climate change caused a threefold increase in the probability of such a drought to occur (Chapters 10 and 11; Botai et al., 2017; Otto et al., 2018). Section 11.9 assesses increases in agricultural and ecological drought at 2°C GWL for North Africa and West Southern Africa (high confidence) and for East Southern Africa and Madagascar (medium confidence), with confidence generally rising for higher emissions scenarios (Sylla et al., 2016b; Zhao and Dai, 2017; Diedhiou et al., 2018; Abiodun et al., 2019; Todzo et al., 2020; Coppola et al., 2021b). Liu et al. (2018b) identified the Southern Africa region as the drought ‘hottest spot’ in Africa in 1.5°C and 2°C global warming scenarios.
Fire weather: There is low confidence (low agreement) in recent reductions in fire activity given soil moisture increases in some regions and substantial land use changes (Andela et al., 2017; Forkel et al., 2019; Zubkova et al., 2019). Days prone to fire conditions are going to increase in all extratropical Africa until the end of the century and fire weather indices are projected to largely increase in North and Southern Africa, where increasing aridity trends occur (high confidence), with an emerging signal well before the middle of the century where drought and heat increase will combine (Chapter 11; Engelbrecht et al., 2015; Abatzoglou et al., 2019). There is low confidence (limited evidence) of fire weather changes for other African regions.
Total precipitation is projected to decrease in the northernmost (high confidence) and southernmost regions of Africa (medium confidence), with West and East Africa regions each having a west-to-east pattern of decreasing-to-increasing precipitation (medium confidence). Most African regions will undergo an increase in heavy precipitation that can lead to pluvial floods (high confidence), even as increasing dry climatic impact-drivers (aridity, hydrological, agricultural and ecological droughts, fire weather) are generally projected in the North Africa and Southern African regions (high confidence) and western portions of West Africa (medium confidence).
12.4.1.3 Wind
Mean wind speed: Decreasing trends in wind speeds have occurred in many parts of Africa (low confidence due to observations with limited homogeneity) (McVicar et al., 2012; AR5 WGI). There is high confidence in climate change-induced future decreasing mean wind, wind energy potential and strong winds in North Africa and Mediterranean regions as a consequence of the poleward shift of the Hadley cell (Karnauskas et al., 2018a; Kjellström et al., 2018; Sivakumar and Lucio, 2018; Tobin et al., 2018; Jung and Schindler, 2019) in the RCP4.5 and RCP8.5 scenarios by the middle of the century or beyond, and for a GWL of 2°C or higher. Over Western Africa and Southern Africa a future significant increase in wind speeds and wind energy potential is expected (medium confidence) (Figure 12.4m–o; Karnauskas et al., 2018a; Jung and Schindler, 2019).
Severe wind storm: A limited number of studies allow an assessment of past trends in wind storms. In West Africa and specifically in the Sahel band, more intense storms have occurred since the 1980s (low confidence, limited evidence). A persistent and large increase of frequency of Sahelian mesoscale convective storms has been found in several studies (Panthou et al., 2014; C.M. Taylor et al., 2017), with consequences for extreme rainfalls, and potentially extreme winds (low confidence, limited evidence). There is low confidence of a general increasing trend in extreme winds across Western, Central, Eastern and Southern Africa in a majority of regions by the middle of the century even in high-end scenarios. The frequency of Mediterranean wind storms reaching North Africa, including Medicanes, is projected to decrease, but their intensities are projected to increase, by the mid-century and beyond under SRES A1B, SRES A2 and RCP8.5 (medium confidence) (Chapter 11; Cavicchia et al., 2014; Walsh et al., 2014; Tous et al., 2016; Romera et al., 2017; Romero and Emanuel, 2017; González-Alemán et al., 2019).
Tropical cyclone: In the South Indian Ocean, an increase in Category 5 cyclones has been observed in recent decades (Fitchett, 2018) as in other basins (Section 11.7). However, there is a projected decrease in the frequency of tropical cyclones making landfall over Madagascar, South Eastern Africa and East Southern Africa in a 1°C, 2°C and 3°C warmer world (medium confidence) (Malherbe et al., 2013; Roberts et al., 2015, 2020; Muthige et al., 2018; Knutson et al., 2020). There is medium confidence in general increasing intensities for cyclones in such studies for African regions.
Sand and dust storm: North Africa and the Sahel, and to a lesser extent Southern Africa, are prone to dust storms, having consequences on health (Querol et al., 2019), transmission of infectious diseases (Agier et al., 2013; Wu et al., 2016), and solar power generation and related maintenance costs. There is limited evidence and low agreement of secular 20th century trends in wind speeds or dust emissions (limited length of data records, large variability). Dust variations are controlled by changes in surface winds, precipitation and vegetation, which in turn are modulated at multiple time scales by dominant modes of internal climate variability (Chapter 10). In North Africa, wind variability explains both the observed high concentrations between the 1970s and 1980s and lower concentrations thereafter (Ridley et al., 2014; Evan et al., 2016). Yet, the effect of vegetation changes may not be negligible (Pu and Ginoux, 2017, 2018).
Changes to the frequency and intensity of dust storms also remain largely uncertain due to uncertainty in future regional wind and precipitation as the climate warms, CO2 fertilization effects on vegetation (Huang et al., 2017), and anthropogenic land use and land-cover change due to land management and invasive species (Ginoux et al., 2012; Webb and Pierre, 2018). Dust loadings and related air pollution hazards (from fine particles that affect health) are projected to generally decrease in many regions of the Sahara and Sahel due to the changing winds (Evan et al., 2016) and slightly increase over the Guinea coast and West Africa (low confidence) (Ji et al., 2018).
In summary, there is high confidence of a decrease in mean wind speed and wind energy potential in North Africa and medium confidence of an increase in Southern and Western Africa, by the middle of the century regardless of climate scenario or global warming level equal or superior to 2°C, high confidence of a decrease in frequency of cyclones landing in SEAF, ESAF and MDG, and low confidence of a general increase in wind storms in most African regions located south of the Sahel. The evolution of dust storms remains largely uncertain.
12.4.1.4 Snow and Ice
Snow and glacier: African glaciers are located in East Africa and more specifically on Mount Kenya, the Rwenzori Mountains and Mount Kilimanjaro, with glaciers reducing substantially in each region (high confidence) (Taylor et al., 2006; Cullen et al., 2013; Chen et al., 2018; Prinz et al., 2018; Wang and Zhou, 2019). Observation and future projection of African glacier mass changes are assessed in Section 9.5.1 within the low-latitude glacier region, which is one of the regions with the largest mass loss even under low-emissions scenarios (assessment of this region is dominated by glaciers in the South American Andes, however) (high confidence). Glaciers in the low-latitude region will lose 67 ± 42%, 86 ± 24% and 94 ± 13% of their mass by the end of the century for RCP2.6, RCP4.5 and RCP8.5 scenarios respectively (Marzeion et al., 2020). Cullen et al. (2013) calculated that even imbalances between the Mount Kilimanjaro glaciers and present-day climate would be enough to eliminate the mountain’s glaciers by 2060. Snow water equivalent and snow cover season duration also decline in the East African mountains, Ethiopian Highlands and Atlas Mountains with climate change (high confidence) (López-Moreno et al., 2017).
In conclusion, there is high confidence that African snow and glaciers have very significantly decreased in the last decades and that this trend will continue over the 21st century.
12.4.1.5 Coastal and Oceanic
Relative sea level: Around Africa, from 1900 to 2018, a new tide gauge-based reconstruction finds a regional mean RSL change of 2.07 [1.36 to 2.77] mm yr–1 in the South Atlantic and 1.33 [0.80 to 1.86] mm yr–1 in the Indian Ocean (Frederikse et al., 2020), compared to a GMSL change of around 1.7 mm yr–1Section 2.3.3.3 and Table 9.5). For the period 1993–2018, these RSLR rates, based on satellite altimetry, increased to 3.45 [3.04 to 3.86] mm yr–1 and 3.65 [3.23 to 4.08] mm yr–1 respectively (Frederikse et al., 2020), compared to a GMSL change of 3.25 mm yr–1Section 2.3.3.3 and Table 9.5).
Relative sea level rise is virtually certain to continue in the oceans around Africa. Regional mean RSLR projections for the oceans around Africa range from 0.4–0.5 m under SSP1-2.6 to 0.8–0.9 m under SSP5-8.5 for 2081–2100 relative to 1995–2014 (median values), which is within the range of projected GMSL change (Section 9.6.3.3). These RSLR projections may, however, be underestimated due to potential partial representation of land subsidence in their assessment (Section 9.6.3.2).
Coastal flood: The present-day 1-in-100-year extreme total water level is between 0.1 and 1.2 m around Africa, with values around 1 m or above along the south-west, south-east and central east coasts (Vousdoukas et al., 2018).
Extreme total water level (ETWL) magnitude and occurrence frequency are expected to increase throughout the region (high confidence) (Figure 12.4p–r and Figure 12.SM.6). Across the continent, the 5th–95th percentile range of the 1-in-100-year ETWL is projected to increase (relative to 1980–2014) by 7–36 cm and by 14–42 cm by 2050 under RCP4.5 and RCP8.5 respectively. By 2100, this range is projected to be 28–86 cm and 43–190 cm under RCP4.5 and RCP8.5 respectively (Vousdoukas et al., 2018; Kirezci et al., 2020). In terms of ETWL occurrence frequencies, the present-day 1-in-100-year ETWL is projected to have median return periods of around 1-in-10-years to 1-in-20-years by 2050 and 1-in-1-year to 1-in-5-years by 2100 in southern and North Africa and occur more than once per year by 2050 and 2100 in most of East and West Africa under RCP4.5 (Vousdoukas et al., 2018). The present-day 1-in-50-year ETWL is projected to occur around three times a year by 2100 with an SLR of 1 m in Africa (Vitousek et al., 2017).
Coastal erosion: Shoreline retreat rates up to 1 m yr–1have been observed around the continent during 1984–2015, except in ESAF, which has experienced a shoreline progradation rate of 0.1 m/r over the same period (Luijendijk et al., 2018; Mentaschi et al., 2018). Mentaschi et al. (2018) report a coastal area losses of 160 km2 and 460 km2 over a 30-year period (1984–2015) along the Atlantic and Indian Ocean coasts of the continent. At the more regional level, in Ghana along the Gulf of Guinea about 79% of the shoreline was found to be retreating while 21% was found to be stable or prograding over the period 1974–1996 (Addo and Addo, 2016).
Projections indicate that a vast majority of sandy coasts in the region will experience shoreline retreat throughout the 21st century (high confidence), while parts of the ESAF and western MDG coastline are projected to prograde over the 21st century, if present ambient trends continue. Median shoreline change projections (CMIP5), relative to 2010, presented by Vousdoukas et al. (2020b) show that, under RCP4.5, shorelines in Africa will retreat by between 30 m (SAH, NEAF, WSAF, ESAF, MDG) and 55 m (WAF, CAF), by mid-century. By the same period but under RCP8.5, the median shoreline retreat is projected to be between 35 m (SAH, NEAF, WSAF, ESAF) and 65 m (WAF, CAF). By 2100, more than 100 m of median retreat is projected in WAF, CAF and SEAF under RCP4.5, while under RCP8.5, more than 100 m of shoreline retreat is projected in all regions except NEAF and WSAF. Under RCP8.5 especially, the projected retreat by 2100 is greater than 150 m in WAF and CAF. The total length of sandy coasts in Africa that is projected to retreat by more than a median of 100 m by 2100 under RCP4.5 and RCP8.5 is about 13,000 km and 17,000 km respectively, an increase of approximately 33%.
Marine heatwave (MHW): From 1982 to 2016, the coastal oceans of Africa have experienced on average 2–3 MHWs per year, with the coastal oceans around the southern half of the continent experiencing on average 2.5–3 MHWs per year. The average duration was between 5 and 15 days (Oliver et al., 2018). Changes over the 20th century, derived from MHW proxies, show an increase in frequency between 0.5 and 2 MHWs per decade over the region, especially off the Horn of Africa; an increase in intensity per event around Southern Africa; and an increase in MHW duration along the North African coastlines (Oliver et al., 2018).
There is high confidence that MHWs will increase around Africa. Mean SST, a common proxy for MHWs, is projected to increase by 1°C (2°C) around Africa by 2100, with a hotspot of around 2°C (5°C) along the coastlines of South Africa under RCP4.5 (RCP8.5; Interactive Atlas). Under global warming conditions, MHW intensity and duration will increase in the coastal zones of all sub-regions of Africa (Frölicher et al., 2018). Projections for SSP1-2.6 and SSP5-8.5 both show an increase in MHWs around Australasia by 2081–2100, relative to 1985–2014 (Box 9.2, Figure 1).
In general, there is high confidence that most coastal- and ocean-related hazards in Africa will increase over the 21st century. Relative sea level rise is virtually certain to continue around Africa, contributing to increased coastal flooding in low-lying areas (high confidence) and shoreline retreat along most sandy coasts (high confidence). Marine heatwaves are also expected to increase around the region over the 21st century (high confidence).
The assessed direction of change in CIDs for Africa and associated confidence levels are illustrated in Table 12.3. No relevant literature could be found for permafrost and hail, although these phenomena may be relevant in parts of the continent.
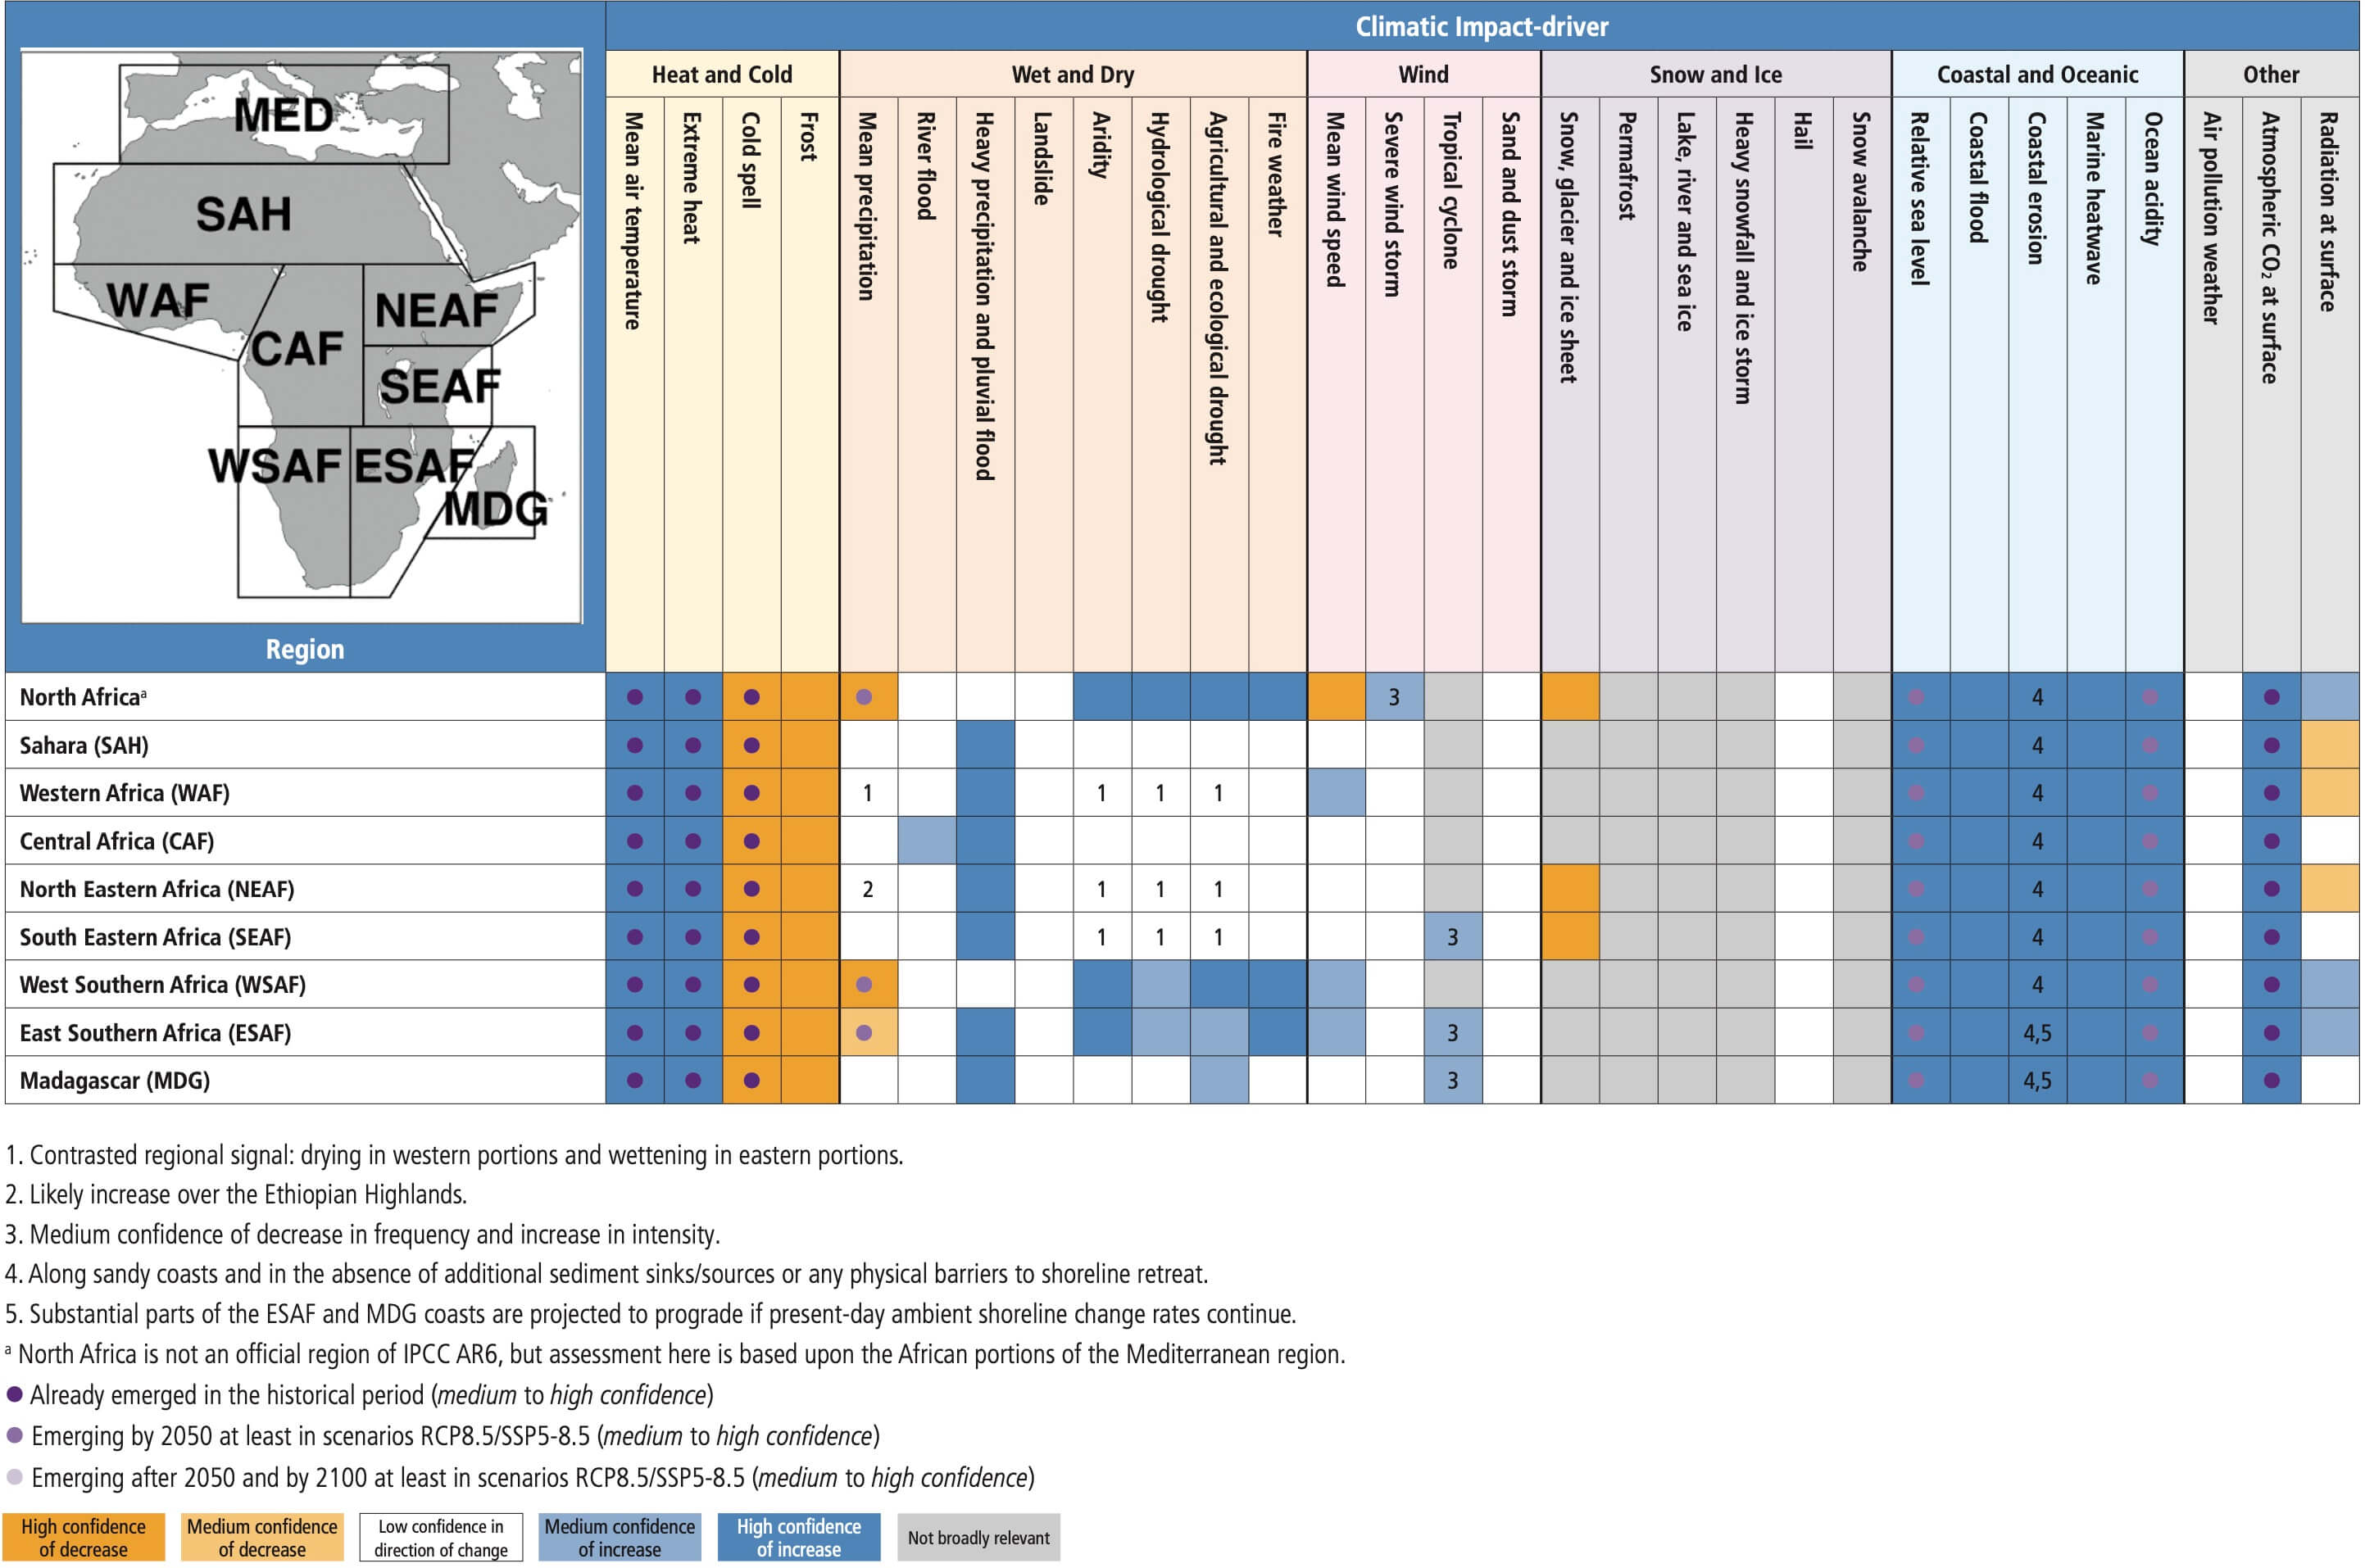
12.4.2 Asia
According to the region definitions given in Chapter 1, Asia is divided into 11 regions: the Arabian Peninsula (ARP), Western Central Asia (WCA), West Siberia (WSB), East Siberia (ESB), the Russian Far East (RFE), East Asia (EAS), East Central Asia (ECA), the Tibetan Plateau (TIB), South Asia (SAS), South East Asia (SEA) and the Russian Arctic Region (RAR). CID changes in RAR are assessed in the Polar Region section (Section 12.4.9). As assessed in previous IPCC Reports, major concerns in Asia are associated particularly with droughts and floods in all regions, heat extremes in SAS and EAS, sand-dust storms in WCA, tropical cyclones in SEA and EAS, snow cover and glacier changes in ECA and the Hindu Kush Himalaya (HKH) region, and sea ice and permafrost thawing in northern Asia.
Since AR5, a large body of new literature is now available relevant to climate change in Asia, which includes projections of both mean climate and extreme climate phenomena from global and regional ensembles of climate simulations such as CMIP6 and CORDEX (Chapter 10 and the Atlas). Literature has also considerably grown on several climate topics relevant to Asia such as the mountain climate (Chapter 3 of the SROCC), and the novel regional assessments such as the Hindu Kush Himalaya Assessment (Wester et al., 2019). Figure 12.6 shows the regional changes in indices related to floods, and coastal erosion over Asia, which are assessed on a regional basis along with other climatic impact-driver indices below.
 Figure 12.6 | Projected changes in selected climatic impact-driver indices for Asia. (a) Mean change in 1-in-100-year river discharge per unit catchment area (Q100, m3s–1km–2) from CORDEX models for the West, South East and East Asia domains for 2041–2060 relative to 1995–2014 for RCP8.5. (b) Shoreline position change along sandy coasts by the year 2100 relative to 2010 for RCP8.5 (metres; negative values indicate shoreline retreat) from the CMIP5-based dataset presented by Vousdoukas et al. (2020b). (c) Bar plots for Q100 (m3s–1km–2) averaged over land areas for the AR6 WGI Reference Regions (defined in Chapter 1). The left-hand column within each panel (associated with the left-hand y-axis) shows the ‘recent past’ (1995–2014) Q100 absolute values in grey shades. The other columns (associated with the right-hand y-axis) show the Q100 changes relative to the recent past values for two time periods (‘mid’ 2041–2060 and ‘long’ 2081–2100) and for three global warming levels (defined relative to the pre-industrial period 1850–1900): 1.5°C (purple), 2°C (yellow) and 4°C (brown). The bars show the median (dots) and the 10–90th percentile range of model ensemble values across each model ensemble. CMIP6 is shown by the darkest colours, CMIP5 by medium, and CORDEX by light. SSP5-8.5/RCP8.5 is shown in red and SSP1-2.6/RCP2.6 in blue. (d) Bar plots for shoreline position change show CMIP5-based projections of shoreline position change along sandy coasts for 2050 and 2100 relative to 2010 for RCP8.5 (red) and RCP4.5 (blue) from Vousdoukas et al. (2020b). Dots indicate regional mean change estimates and bars show the 5–95th percentile range of associated uncertainty. Note that these shoreline position change projections assume that there are no additional sediment sinks/sources or any physical barriers to shoreline retreat. See Technical (Annex VI for details of indices. Further details on data sources and processing are available in the chapter data table (Table 12.SM.1).
 12.4.2.1 Heat and Cold
Mean air temperature: A long-term warming trend in annual mean surface temperature has been observed across Asia during 1960–2015, and the warming accelerated after the 1970s (high confidence) (Davi et al., 2015; Aich et al., 2017; Cheong et al., 2018; S. Dong et al., 2018; IPCC, 2018; Krishnan et al., 2019; M. Zhang et al., 2019). Records also indicate a higher rate of warming in minimum temperatures than maximum temperatures in Asia, leading to more frequent warm nights and warm days, and less frequent cold days and cold nights (high confidence) (Supari et al., 2017; Akperov et al., 2018; Cheong et al., 2018; Rahimi et al., 2018; Khan et al., 2019a; L. Li et al., 2019; M. Zhang et al., 2019).
Projections show continued warming over Asia in the future with contrasted regional patterns across the continent (high confidence) (Figure 4.19). For RCP8.5/SSP5-8.5 at the end of the century, the mean estimated warming exceeds 5°C in WSB, ESB and RFE and 7°C in some parts (high confidence). In most areas of ARP and WCA, 5°C is exceeded (Ozturk et al., 2017), but EAS, SAS and SEA have a lower projected warming of less than 5°C (Basha et al., 2017; C. Lu et al., 2019; Almazroui et al., 2020; Atlas.5). Under SSP1-2.6, the warming remains limited to 2°C in most areas except Arctic regions, where it exceeds 2°C (Figure 4.19).
Extreme heat: There is increased evidence and high confidence of more frequent heat extremes in the recent decades than in previous ones in most of Asia (Acar Deniz and Gönençgil, 2015; Rohini et al., 2016; Mishra et al., 2017; You et al., 2017; Imada et al., 2018; Khan et al., 2019b; Krishnan et al., 2019; Rahimi et al., 2019; Yin et al., 2019; Chapter 11) due to the effects of anthropogenic global warming, El Niño and urbanization (Luo and Lau, 2017; Thirumalai et al., 2017; Imada et al., 2019; Y. Sun et al., 2019; Zhou et al., 2019). But there is medium confidence of heat extremes increasing in frequency in many parts of India (Rohini et al., 2016; Mazdiyasni et al., 2017; van Oldenborgh et al., 2018; Sen Roy, 2019; Kumar et al., 2020) partly due to the alleviation of anthropogenic warming by increased air pollution with aerosols and expanding irrigation (van Oldenborgh et al., 2018; Thiery et al., 2020).
Extreme heat events are very likely to become more intense and/or more frequent in SAS, WCA, ARP, EAS, and SEA by the end of 21st century, especially under RCP6.0 and RCP8.5 (Figure 12.4a–c and Chapter 11; Lelieveld et al., 2016; Pal and Eltahir, 2016; Guo et al., 2017; Mishra et al., 2017; Dosio et al., 2018; Lin et al., 2018; Nasim et al., 2018; Shin et al., 2018; Hong et al., 2019; Su and Dong, 2019; Khan et al., 2020; Kumar et al., 2020). The exceedance of the dangerous heat stress 41°C threshold of the HI is expected to increase by about 250 days in SEA and by 50–150 days in SAS, WCA, ARP and EAS for SSP5-8.5 at the end of the century (Figure 12.4d–f and Figure 12.SM.2). Under SSP1-2.6, the increase would be restricted to less than 30 days in many of these regions except SEA, where the number of exceedance days increases by about 100 days in some areas. Such increases are already present in the middle of the century (Figure 12.4d–f; Schwingshackl et al., 2021). In these regions, the increase in number of days with exceedance of 35°C of high heat stress is also expected to increase substantially for the mid-century under SSP5-8.5 (typically by 10–50 days except in Arctic and Siberian regions), and by more than 60 days in areas of SEA, and a large difference is found between low- and high-end scenarios in the end of the century (high confidence) (Figure 12.4b). Over WSB, ESB and RFE also, an increase of extreme heat durations and frequency is expected in all scenarios (high confidence) (Kattsov et al., 2017; Khlebnikova et al., 2019b).
Cold spell and frost: Cold spells intensity and frequency, as well as the number of frost days, in most Asian regions have been decreasing since the beginning of the 20th century (high confidence) (Chapter 11; Sheikh et al., 2015; Donat et al., 2016; Erlat and Türkeş, 2016; S. Dong et al., 2018; Liao et al., 2018, 2020; Lu et al., 2018; van Oldenborgh et al., 2019), except for the central Eurasian regions, where there was a cooling trend during 1995–2014, which is linked to sea ice loss in the Barents–Kara Seas (medium confidence) (Atlas.5.2; Wegmann et al., 2018; Blackport et al., 2019; Mori et al., 2019).
It is very likely that cold spells will have a decreasing frequency in all future scenarios across Asian regions (J. Guo et al., 2018; Sui et al., 2018; L. Li et al., 2019), as well as frost days (L. Wang et al., 2017; Fallah-Ghalhari et al., 2019) except in tropical Asia (Chapter 11).
In Asia, temperatures have warmed during the last century (high confidence). Extreme heat episodes have become more frequent in most regions (high confidence), and are very likely to increase in all regions of Asia under all warming scenarios during this century. Dangerous heat stress thresholds such as HI > 41°C will be crossed much more often (typically 5 0–1 50 days per year more than the recent past) in many southern Asia regions at the end of the century under SSP5-8.5 while these numbers should remain limited to a few tens under SSP1-2.6 (high confidence). It is very likely that cold spells and frost days will decrease in frequency in all future scenarios across Asian regions during the century.
12.4.2.2 Wet and Dry
Mean precipitation: The most prominent features about changes in precipitation over Asia (1901–2010) are the increasing precipitation trends across higher latitudes, along with some scattered smaller regions of detectable increases and decreases (Knutson and Zeng, 2018); however, spatial variability remains high (W. Wang et al., 2015; Limsakul and Singhruck, 2016; Supari et al., 2017; Rahimi et al., 2018, 2019; Sein et al., 2018; Kumar et al., 2019; H. Wang et al., 2019; see Atlas.5) (medium confidence).
Mean precipitation is likely to increase in most areas of northern (WSB, ESB, RFE), southern (ECA, TIB, SAS) and East Asia (EAS) in different scenarios (high confidence) (Huang et al., 2014; Xu et al., 2017; Kusunoki, 2018; Mandapaka and Lo, 2018; Luo et al., 2019; Wu et al., 2019; X. Zhu et al., 2019; Almazroui et al., 2020; Jiang et al., 2020; Rai et al., 2020; see Atlas.5). Monsoon circulation will also increase seasonal contrasts, with SAS seeing wetter wet seasons and drier dry seasons (Atlas.5.3). Higher uncertainty between CMIP5 and CMIP6 as well as spatial differences lend low confidence to model projections in ARP and WCA (Atlas.5.5), with large seasonal differences (Zhu et al., 2020) and some models projecting decreases in precipitation in Central Asia (Ozturk et al., 2017), Pakistan (Nabeel and Athar, 2020) and SEA (Supari et al., 2020).
River flood: Flood risk has grown in many places in China from 1961 to 2017 (Kundzewicz et al., 2019) (low confidence). In SAS, the numbers of flood events and human fatalities have increased in India during 1978–2006 (Singh and Kumar, 2013), whereas the average country-wide inundation depth has been decreasing during 2002–2010 in Bangladesh, attributed to improved flood management (low confidence) (Sciance and Nooner, 2018).
Given the increase of heavy precipitation in most Asian regions, the river flood frequency and intensities will change consequently in Asia. Over China floods will increase with different levels under different warming scenarios (medium confidence) (Lin et al., 2018; Kundzewicz et al., 2019; Liang et al., 2019; Gu et al., 2020). Monsoon floods will be more intense in SAS (medium confidence) (Nowreen et al., 2015; Babur et al., 2016; Mohammed et al., 2018). The total flood damage will increase greatly in river basins in SEA countries under the conditions of climate change and rapid urbanization in the near future (Dahal et al., 2018; Kefi et al., 2020). A changing snowmelt regime in the mountains may contribute to a shift of spring floods to earlier periods in Central Asia in future (medium confidence) (Reyer et al., 2017b). The annual maximum river discharge can almost double by the mid-21st century in major Siberian rivers, and annual maximum flood area is projected to increase across Siberia mostly by 2–5% relative to the baseline period (1990–1999) under RCP8.5 scenario (medium confidence) (Shkolnik et al., 2018).
Heavy precipitation and pluvial flood: Pluvial floods are driven by extreme precipitation and land use. Observed changes in extreme precipitation vary considerably by region (Chapter 11). Heavy precipitation is very likely to become more intense and frequent in all areas of Asia except in ARP (medium confidence) for a 2°C GWL or higher (Chapter 11).
Landslide: The majority of non-seismic fatal landslide events were triggered by rainfall, and Asia is the dominant geographical area of landslide distribution (Froude and Petley, 2018). Floods and landslides are the most frequently occurring natural hazards in the eastern Himalayas and hilly regions, particularly caused by torrential rain during the monsoon season (Gaire et al., 2015; Syed and Al Amin, 2016). They accounted for nearly half of the events recorded in the countries of the HKH region (Vaidya et al., 2019). Intense monsoon rainfall in northern India and western Nepal in 2013, which led to landslides and one of the worst floods in history, has been linked to increased loading of GHG and aerosols (Cho et al., 2016). Due to an increase of heavy precipitation and permafrost thawing, an increase in landslides is expected in some areas of Asia, such as northern Taiwan (China), some South Korean mountains, Himalayan mountains, and permafrost territories of Siberia, and the increase is expected to be the greatest over areas covered by current glaciers and glacial lakes (medium confidence, medium evidence) (Kim et al., 2015; Kharuk et al., 2016; C.-W. Chen et al., 2019; Kirschbaum et al., 2020).
Aridity: Aridity in West Central Asia and parts of South Asia increased in recent decades (medium confidence), as documented in Afghanistan (Qutbudin et al., 2019), Iran (Zarei et al., 2016; Zolfaghari et al., 2016; Pour et al., 2020), most parts of Pakistan (K. Ahmed et al., 2018, 2019), and many parts of India (Roxy et al., 2015; Mallya et al., 2016; Matin and Behera, 2017; Ramarao et al., 2019). Some spatial and seasonal differences within these regions remain, with Ambika and Mishra (2020) noting significant aridity declines over the Indo–Gangetic Plain in India during 1979–2018 due in part to the effect of irrigation, and Araghi et al. (2018) found that many parts of Iran show no significant trends in aridity. There was a drying tendency in the dry season and significant wetting in the wet season in the Philippines during 1951–2010 (Villafuerte et al., 2014), and slight wetting in Vietnam during 1980–2017 (Stojanovic et al., 2020) (low confidence). In EAS there is low confidence of broad aridity changes, as the frequency of droughts have increased (especially in spring) along a strip extending from south-west China to the western part of north-east China; however, there is no evidence of a significant increase in drought severity over China as a whole and many parts in the arid north-west China got wetter during 1961–2012 (W. Wang et al., 2015; Zhai et al., 2017; H. Wang et al., 2019; Zhang and Shen, 2019). In Siberia, the number of dry days has decreased for much of the region, but increased in its southern parts (Khlebnikova et al., 2019a).
The counteracting factors of projected increases in precipitation and temperature across most of Asia (Section 11.9 and Atlas.5) leads to low confidence (limited evidence, inconsistent trends) for broad, long-term aridity changes with medium confidence only for aridity increases in West Central Asia and East Asia. A growing number of studies highlight the potential for more localized aridity trends, including projection ensembles indicating significant increase in aridity and more frequent and intense droughts in most parts of China (Y. Li et al., 2019; Yao et al., 2020) and India under RCP4.5 and RCP8.5 for the 2020–2100 period (Gupta and Jain, 2018; Bisht et al., 2019; Preethi et al., 2019).
Hydrological drought: Section 11.9 indicates that limited evidence and inconsistent regional trends gives low confidence to observed and projected changes in hydrological drought in all Asian regions at a 2°C GWL (approximately mid-century), although West Central Asia hydrological droughts increase at the 4°C GWL (approximately end-of-century under higher emissions scenarios) (medium confidence). Human activities such as reservoir operation and water abstraction have had a profound effect on low river flow characteristics and drought impacts in many Asian regions (Kazemzadeh and Malekian, 2016; Yang et al., 2020b). There was no observed overall long-term change of both meteorological droughts and hydrological droughts over India during 1870–2018 (Mishra, 2020), but there were strong trends towards drying of soil moisture in north-central India (Ganeshi et al., 2020) and intensified droughts in north-west India, parts of Peninsular India, and Myanmar (Malik et al., 2016). The frequency of water scarcity connected with hydrological droughts has increased significantly in southern Russia since the beginning of the 21st century (Frolova et al., 2017). Higher future temperatures are expected to alter the seasonal profile of hydrologic droughts given reduced summer snowmelt (medium confidence) downstream of mountains such as the Himalayas and the Tibetan Plateau (Sorg et al., 2014). Several studies project more severe future hydrological drought in the Weihe River basin in northern China (Yuan et al., 2016; Sun and Zhou, 2020).
Agricultural and ecological drought: Section 11.9 assesses medium confidence in observed increases to agricultural and ecological droughts in West Central Asia, East Central Asia, and East Asia. Persistent droughts were the main factor for grassland degradation and desertification in Central Asia in the early 21st century (G. Zhang et al., 2018; Emadodin et al., 2019). Compound meteorological drought and heat events, which lead to water stress conditions for agricultural and ecological systems, have become more frequent, widespread and persistent in China especially since the late 1990s (Yu and Zhai, 2020). There were more agricultural droughts in northern China than in southern China, and the intensity of agricultural drought increased during 1951–2018 (Zhao et al., 2021).
Studies examining a 2°C GWL give low confidence for projected broad changes to agricultural and ecological drought across all Asia regions, although at 4°C GWL agricultural and ecological drought increases are projected for West Central Asia and East Asia along with a decrease in South Asia (medium confidence) (Section 11.9). Summer temperature increase will enhance evapotranspiration, facilitating ecological and agricultural drought over Central Asia towards the latter half of this century (Chapter 11; see also Figure 12.4 for soil moisture and DF indices; Ozturk et al., 2017; Reyer et al., 2017b; Senatore et al., 2019). However, broader changes in droughts could not be determined in Asia due to the mixture of total precipitation signals together with temperature increase patterns (Section 11.9 and Atlas.5).
Fire weather: Under the global warming scenario of 2°C, the magnitude of length and frequency of fire seasons are projected to increase with strong effects in India, China and Russia (medium confidence) (Q. Sun et al., 2019). Abatzoglou et al. (2019) found that higher fire weather conditions due to climate change emerge in the first part of the 21st century in South China, WCA as well as in boreal areas of Siberia and RFE. The potential burned areas in five Central Asian countries (Kazakhstan, Kyrgyzstan, Tajikistan, Uzbekistan and Turkmenistan) will increase by 2–8% in the 2030s and 3–13% in the 2080s compared with the baseline (medium confidence) (1971–2000; Zong et al., 2020).
In conclusion, there is medium confidence that extreme precipitation, mean precipitation and river floods will increase across most Asian regions. There is low confidence for projected changes in aridity and drought given overall increases in precipitation and regional inconsistencies, with medium increases for West Central Asia and East Asia especially beyond the middle of the century and global warming levels beyond 2°C. Fire weather seasons are projected to lengthen and intensify particularly in the northern regions (medium confidence).
12.4.2.3 Wind
Mean wind speed: There is high confidence of the slowdown in terrestrial near-surface wind speed (SWS) in Asia by approximately –0.1 m s–1 per decade since the 1950s based on observations and reanalysis data, with the significant decreases in Central Asia among the highest in the world followed by EAS and SAS (J. Wu et al., 2018; Tian et al., 2019; R. Zhang et al., 2019). But a short-term strengthening in SWS was observed during the winter since 2000 in eastern China (medium confidence) (Zeng et al., 2019; Zha et al., 2019).
There is medium confidence of future declining mean SWS in Asia, except in SAS and SEA, as global projections indicate a decreasing trend in all climate scenarios for most of northern Asia, TIB and East Asia by the mid-century (Karnauskas et al., 2018a; Fedotova, 2019; Jung and Schindler, 2019; Ohba, 2019; J. Wu et al., 2020; Zha et al., 2020; Figure 12.4m–o), with negative effects on wind energy potential. Decreases in North Asia are generally modest, not exceeding 10% for the mid-century and 20% for the end of century for the RCP8.5 and RCP4.5 scenarios (Figure 12.4m–o).
Severe wind storms: Consistent with the general mean decreasing surface winds, there is medium confidence that strong winds declined faster than weak winds in the past few decades in Asia in general (Vautard et al., 2010; Tian et al., 2019), but evidence is lacking for spatial patterns. There is low confidence that extra-tropical cyclones will decline in number in future climate scenarios over WCA, TIB, WSB and ESB, and intensify over the Arctic regions as a result of the poleward shift of storm tracks (Basu et al., 2018; Chapter 11). There is limited evidence for projection of changes in severe winds occurring in convective storms in Asia.
Tropical cyclone: There was an increase in the number and intensification rate of intense tropical cyclones (TC), such as Category 4–5 (wind speeds >58 m s–1), in the Western North Pacific (WNP) and Bay of Bengal since the mid-1980s (medium confidence) (Section 11.7; Kim et al., 2016; Mei and Xie, 2016; Walsh et al., 2016a; Knutson et al., 2019). There is medium confidence that there has been a significant north-westward shift in TC tracks and a poleward shift in the average latitude where TCs reach their peak intensity in the WNP since the 1980s (Knutson et al., 2019; J. Sun et al., 2019; Lee et al., 2020), increasing exposure to TC passage and more destructive landfall over eastern China, Japan, and Korea in the last few decades (Kossin et al., 2016; Li et al., 2017; Altman et al., 2018; Liu and Chan, 2019), and decreasing exposure in the region of SAS and southern China (Cinco et al., 2016; Kossin et al., 2016; see Chapter 11). However, while the analysis shows fewer typhoons, more extreme TCs have affected the Philippines (low confidence) (Takagi and Esteban, 2016). The frequency and duration of tropical cyclones has significantly increased over time over the Arabian Sea and insignificantly decreased over the Bay of Bengal during 1977–2018 (low confidence) (Fan et al., 2020).
There is medium confidence that future TC numbers will decrease but the maximum TC wind intensities will increase in the western Pacific as elsewhere (Chapter 11, see Figure 11.24; Choi et al., 2019; Cha et al., 2020; Knutson et al., 2020). The simulations for the late 21st century for the RCP8.5 scenario yield considerably more TCs in the WNP that exceed 49.4 m s−1 (Category 3) intensity (Mclay et al., 2019). There is medium confidence that the average location of the maximum wind will migrate poleward (see Chapter 11), and TC translation speeds at the higher latitudes would decrease (Yamaguchi et al., 2020). As a consequence, the intensity of TCs affecting the Japan Islands would increase in the future under the RCP8.5 scenario (Yoshida et al., 2017), whereas the frequency of TCs affecting the Philippine region and Vietnam is projected to decrease (Kieu-Thi et al., 2016; C. Wang et al., 2017; Gallo et al., 2019) (medium confidence).
Sand and dust storm: The Asia-Pacific region contributes 26.8 per cent to global dust emissions as of 2012 (UNESCAP, 2018). In West Asia, the frequency of dust events has increased markedly in some areas (east and north-east of Saudi Arabia, north-west of Iraq and east of Syria) from 1980 to the present (Nabavi et al., 2016; Alobaidi et al., 2017). This marked dust increase has been associated with drought conditions in the Fertile Crescent (Notaro et al., 2015; Yu et al., 2015), likely amplified by anthropogenic warming (Kelley et al., 2015; Chapter 10). Dust storm frequency in most regions of northern China show a decreasing trend since the 1960s due to the decrease in surface wind speed (medium confidence) (Guan et al., 2017).
While dust activity has decreased greatly over EAS, current climate models are unable to reproduce the trends (Guan et al., 2015, 2017; Zha et al., 2017; C. Wu et al., 2018). Thus, there is limited evidence for future trends of sand and dust storms in Asia.
In conclusion, surface wind speeds have been decreasing in Asia (high confidence), but there is a large uncertainty in future trends. There is medium confidence that mean wind speeds will decrease in Central and northern Asia, and that tropical cyclones will have decreasing frequency and increasing intensity overall.
12.4.2.4 Snow and Ice
Snow: There is no significant interannual trend of total snow cover from 2000 to 2016 over Eurasia (X. Wang et al., 2017a; Sun et al., 2020). Observations do show significant changes in the seasonal timing of Eurasian snow cover extent (especially for earlier spring snowmelt) since the 1970s, with seasonal changes expected to continue in the future (high confidence) (Yeo et al., 2017; Zhong et al., 2021). By 2100, snowline elevations are projected to rise between 400 and 900 m (4.4 to 10.0 m yr–1) in the Indus, Ganges and Brahmaputra basins under the RCP8.5 scenario (Viste and Sorteberg, 2015).
Glacier: Observation and future projection of glacier mass changes in Asia are assessed in Section 9.5.1 grouped in three main regions: northern Asia, High Mountains of Asia, and Caucuses and Middle East. All regions show continuing decline in glacier mass and area in the coming century (high confidence). Under RCP2.6 the pace of glacier loss slows, but glacier losses increase in RCP8.5 and peak in the mid to late 21st century. GlacierMIP projections indicate that glaciers in the High Mountains of Asia lose 42 ± 25%, 56 ± 24% and 71 ± 21% of their 2015 mass by the end of the century for RCP2.6, RCP4.5 and RCP8.5 scenarios respectively. Under the same scenarios, glaciers in North Asia would lose 57 ± 40%, 72 ± 38% and 85 ± 30% of their mass, and glaciers in the Caucuses and the Middle East would lose 68 ± 32%, 83 ± 19% and 94 ± 13% of their mass (see also Kraaijenbrink et al., 2017; Rounce et al., 2020).
Although enhanced meltwater from snow and glaciers largely offsets hydrological drought-like conditions (Pritchard, 2019), this effect is unsustainable and may reverse as these cryospheric buffers disappear (medium confidence) (Gan et al., 2015; W. Dong et al., 2018; Huss and Hock, 2018). In the Himalayas and the TIB region higher temperatures will lead to higher glacier melt rates and significant glacier shrinkage and a summer runoff decrease (medium confidence) (Sorg et al., 2014). Glacier runoff in the Asian high mountains will increase up to mid-century, and after that runoff might decrease due to the loss of glacier storage (medium confidence) (Lutz et al., 2014; Huss and Hock, 2018; Rounce et al., 2020).
Compared with the 1990s, the number of lakes in TIB in the 2010s decreased by 2%, whereas total lake area expanded by 25% (S. Wang et al., 2020) due to the joint effect of precipitation increase and glacier retreat. Many new lakes are predicted to form as a consequence of continued glacier retreat in the Himalaya-Karakoram region (Linsbauer et al., 2016). As many of these lakes will develop at the immediate foot of steep icy peaks with degrading permafrost and decreasing slope stability, the risk of glacier lake outburst floods and floods from landslides into moraine-dammed lakes is increasing in Asian high mountains (high confidence) (Haeberli et al., 2017; Kapitsa et al., 2017; Bajracharya et al., 2018; Narama et al., 2018; S. Wang et al., 2020).
Permafrost : Permafrost is thawing in Asia (high confidence). Temperatures in the cold continuous permafrost of north-eastern East Siberia rose from the 1980s up to 2017, and the active layer thicknesses in Siberia and Russian Far East generally increased from late 1990s to 2017 (Romanovsky et al., 2018). The change in mean annual ground temperature for northern Siberia is about +0.1 to +0.3°C per decade since 2000 (Romanovsky et al., 2018). Ground temperature in the permafrost regions of TIB (taking 40% of TIB currently) increased (0.02–0.26°C per decade for different boreholes) during 1980 to 2018, and the active layer thickened at a rate of 19.5 cm per decade (L. Zhao et al., 2020). There is high confidence that permafrost in Asian high mountains will continue to thaw and the active layer thickness will increase (Bolch et al., 2019). The permafrost area is projected to decline by 13.4–27.7% and 60–90% in TIB (L. Zhao et al., 2020) and 32% ± 11% and 76% ± 12% in Russia (Guo and Wang, 2016) by the end of the 21st century under the RCP2.6 and RCP8.5 scenarios respectively (high confidence).
Lake and river ice: Lake ice cover duration got shorter in many lakes in TIB (Yao et al., 2016; Cai et al., 2019; Guo et al., 2020) and some other areas such as north-west China (Cai et al., 2020) and north-east China (Yang et al., 2019) in the last two decades (high confidence). River ice cover extent decreased in TIB as well (H. Li et al., 2020; Yang et al., 2020a). Climate warming also leads to a significant reduction in the period with ice phenomena and the decrement of ice regime hazard in Russian lowland rivers (Agafonova et al., 2017), and the Inner Mongolia reach of the Yellow River in northern China (Wan et al., 2020) (high confidence). Lake ice and river ice in Asia are expected to decline with projected increases in surface air temperature towards the end of this century (high confidence) (Guo et al., 2020; Yang et al., 2020a).
Heavy snowfall and ice storm: Observed trends in heavy snowfall and ice storms are uncertain. Annual maximum snow depth decreased for the period between 1962 and 2016 on the western side of both eastern and western Japan, at rates of 12.3% and 14.6% per decade respectively (MOE et al., 2018). Observational results generally show a decrease in the frequency and an increase in the mean intensity of snowfalls in most Chinese regions (medium confidence) (B. Zhou et al., 2018). Because of the decrease in the snow frequency, the occurrence of large-scale snow disasters in TIB decreased (low confidence) (Qiu et al., 2018; S. Wang et al., 2019). Large parts of northern high-latitude continents (including Siberia and RFE) have experienced cold snaps and heavy snowfalls in the past few winters, and the reduction of Arctic sea ice would increase the chance of heavy snowfall events in those regions in the coming decades (medium confidence) (Song and Liu, 2017). Heavy snowfall is projected to occur more frequently in Japan’s Northern Alps, the inland areas of Honshu Island and Hokkaido Island (Kawase et al., 2016, 2020; MOE et al., 2018), and the heavy wet snowfall can be enhanced over the mountainous regions in central Japan and northern part of Japan (Ohba and Sugimoto, 2020) (medium confidence).
Hail: The hailstorm in the Asian region shows a decreasing trend in several regions (low confidence, limited evidence). In China severe weather days including thunderstorms, hail and/or damaging wind have decreased by 50% from 1961 to 2010 (M. Li et al., 2016; Zhang et al., 2017), and the hail size decreased since 1980 (Ni et al., 2017). A rate of decrease of 0.214 hail days per decade has also been reported for Mongolia between 1984–2013, where the annual number of hail days averaged is 0.74 (Lkhamjav et al., 2017).
Snow avalanche: There is as yet limited evidence for the evolution of avalanches in Asia. Tree-ring-based snow avalanche reconstructions in the Indian Himalayas show an increase in avalanche occurrence and runout distances in recent decades (Ballesteros-Cánovas et al., 2018).
In summary, snowpack and glaciers are projected to continue decreasing and permafrost to continue thawing in Asia (high confidence). There is medium confidence of increasing heavy snowfall in some regions, but limited evidence on future changes in hail and snow avalanches.
12.4.2.5 Coastal and Oceanic
Relative sea level: Around Asia, from 1900–2018, a new tide gauge-based reconstruction finds a regional mean RSL change of 1.33 [0.80 to 1.86] mm yr–1 in the Indian Ocean–Southern Pacific and 1.68 [1.27 to 2.09] mm yr–1 in the North-west Pacific (Frederikse et al., 2020), compared to a GMSL change of around 1.7 mm yr–1Section 2.3.3.3 and Table 9.5). For the period 1993–2018, the RSLR rates around Asia, based on satellite altimetry, increased to 3.65 [3.23 to 4.08] mm yr–1 and 3.53 [2.64 to 4.45] mm yr–1 respectively (Frederikse et al., 2020), compared to a GMSL change of 3.25 mm yr–1Section 2.3.3.3 and Table 9.5). The rate of RSLR along the coastline of China ranges from –2.3 ± 1.9 to +5.7 ± 0.4 mm yr–1 during 1980–2016; after removing the vertical land movement, the average rate of sea level rise is 2.9 ± 0.8 mm yr–1 over 1980–2016 and 3.2 ± 1.1 mm yr–1 since 1993 (Qu et al., 2019). However, the rates of land subsidence reported by Minderhoud et al. (2017) are substantially higher than those reported by Qu et al. (2019). RSL change in many coastal areas in Asia, especially in EAS, is affected by land subsidence due to sediment compaction under building mass and groundwater extraction (high confidence) (Erban et al., 2014; Nicholls, 2015; Minderhoud et al., 2019; Qu et al., 2019). During 1991–2016, the Mekong Delta in Vietnam sank on average about 18 cm as a consequence of groundwater withdrawal, and the subsidence related to groundwater extraction has gradually increased with highest sinking rates estimated to be 11 mm yr–1 in 2015 (Minderhoud et al., 2017).
Relative sea level rise is very likely to continue in the oceans around Asia. Regional mean RSLR projections for the oceans around Asia range from 0.3–0.5 m under SSP1-2.6 to 0.7–0.8 m under SSP5-8.5 for 2081–2100 relative to 1995–2014 (median values), which is within the range of projected GMSL change (Section 9.6.3.3). These RSLR projections may, however, be underestimated due to potential partial representation of land subsidence in their assessment (Section 9.6.3.2).
Coastal flood: The present-day 1-in-100-year ETWL is between 0.5–8 m around Asia, with values above 2.5 m or above common along the coasts of Central and north-eastern Asia (Vousdoukas et al., 2018; Kirezci et al., 2020). Sea level rise and land subsidence will jointly lead to more flooding in delta areas in Asia (high confidence) (Takagi et al., 2016; J. Wang et al., 2018).
Extreme total water level magnitude and occurrence frequency are expected to increase throughout the region (high confidence) (Figure 12.4p–r and Figure 12.SM.6). Across the region, the 5–95th percentile range of the 1-in-100-year ETWL is projected to increase (relative to 1980–2014) by 7–44 cm and by 10–52 cm by 2050 under RCP4.5 and RCP8.5 respectively. By 2100, this range is projected to be 11–91 cm and 28–187 cm under RCP4.5 and RCP8.5 respectively (Vousdoukas et al., 2018; Kirezci et al., 2020). Furthermore, the present-day 1-in-100-year ETWL is projected to have median return periods of around 1-in-50-years by 2050 and 1-in-10-years by 2100 under RCP4.5 in most of Asia, except SEA and ARP, in which the present-day 1-in-100-year ETWL is projected occur once per year or more, both by 2050 and 2100 (Vousdoukas et al., 2018). The present-day 1-in-50-year ETWL is projected to occur around three times a year by 2100 with a SLR of 1 m across Asia (Vitousek et al., 2017). Compound impacts of precipitation change, land subsidence, sea level rise, upstream hydropower development, and local water infrastructure development may lead to larger flood extent and prolonged inundation in the Vietnamese Mekong Delta (Triet et al., 2020).
Coastal erosion: Over the past 30 years, South, South East and East Asia exhibit the most pronounced delta changes globally due to strong human-induced changes to the fluvial sediment flux (Nienhuis et al., 2020). Satellite derived shoreline change estimates over 1984–2015 indicate shoreline retreat rates between 0.5 m yr–1 and 1 m yr–1along the coasts of WCA and ARP, increasing to 3 m yr–1 in SAS. Over the same period, shoreline progradation has been observed along the coasts of RFE (0.2 m yr–1), SEA (0.1 m yr–1) and EAS (0.5 m yr–1) (Luijendijk et al., 2018; Mentaschi et al., 2018). Meanwhile, there has been a gross coastal area loss of 3,590 km2 in South Asia, and a loss of 2,350 km2 in Pacific Asia, over a 30-year period (1984–2015) (Mentaschi et al., 2018).
Projections indicate that a majority of sandy coasts in the Asia region will experience shoreline retreat (high confidence) (Udo and Takeda, 2017; Ritphring et al., 2018; Vousdoukas et al., 2020b), while parts of the RFE, EAS, SEA and WCA coastline are projected to prograde over the 21st century, if present ambient shoreline change trends continue. Median shoreline change projections (CMIP5), relative to 2010, presented by Vousdoukas et al. (2020b) show that, by mid-century, sandy shorelines in Asia will retreat by between 10–50 m, except in SAS where shoreline retreat is projected to exceed 100 m, under both RCP4.5 and RCP8.5. By 2100, and under RCP4.5, shoreline retreats of around 85, 100 and 300 m are projected along the sandy coastlines of SEA and WCA, ARP and SAS respectively (50 m or less in other Asian regions), while under RCP8.5, over the same period, sandy shorelines along all regions with coastlines, except RFE and EAS, are projected to retreat by more than 100 m, with the retreat in SAS reaching 350 m (2100 RCP8.5 projections for RFE and EAS are about 60 m and about 85 m respectively; Figure 12.6).
Marine heatwave: There have been frequent marine heatwaves (MHW) in the coastal oceans of Asia, connected to the increase between 0.25°C and 1°C in mean SST of the coastal oceans since 1982–1998 (Oliver et al., 2018). There is high confidence that MHWs will increase around most of Asia. Mean SST is projected to increase by 1°C (2°C) around Asia by 2100, with a hotspot of around 2°C (5°C) along the coastlines of the Sea of Japan and the RFE under RCP4.5 (RCP8.5; Interactive Atlas). Under global warming conditions, MHW intensity and duration are projected to increase in the coastal zones of all sub-regions of Asia, but most notably in SEA and SAS (Frölicher et al., 2018). Projections for SSP1-2.6 and SSP5-8.5 both show an increase in MHWs around Asia by 2081–2100, relative to 1985–2014 (Box 9.2, Figure 1).
In general, there is high confidence that most coastal/ocean-related climatic impact-drivers in Asia will increase over the 21st century. Relative sea level rise is very likely to continue around Asia, contributing to increased coastal flooding in low-lying areas (high confidence) and shoreline retreat along most sandy coasts (high confidence). Marine heatwaves are also expected to increase around the region over the 21st century (high confidence).
The assessed direction of change in climatic impact-drivers for Asia and associated confidence levels are illustrated in Table 12.4.
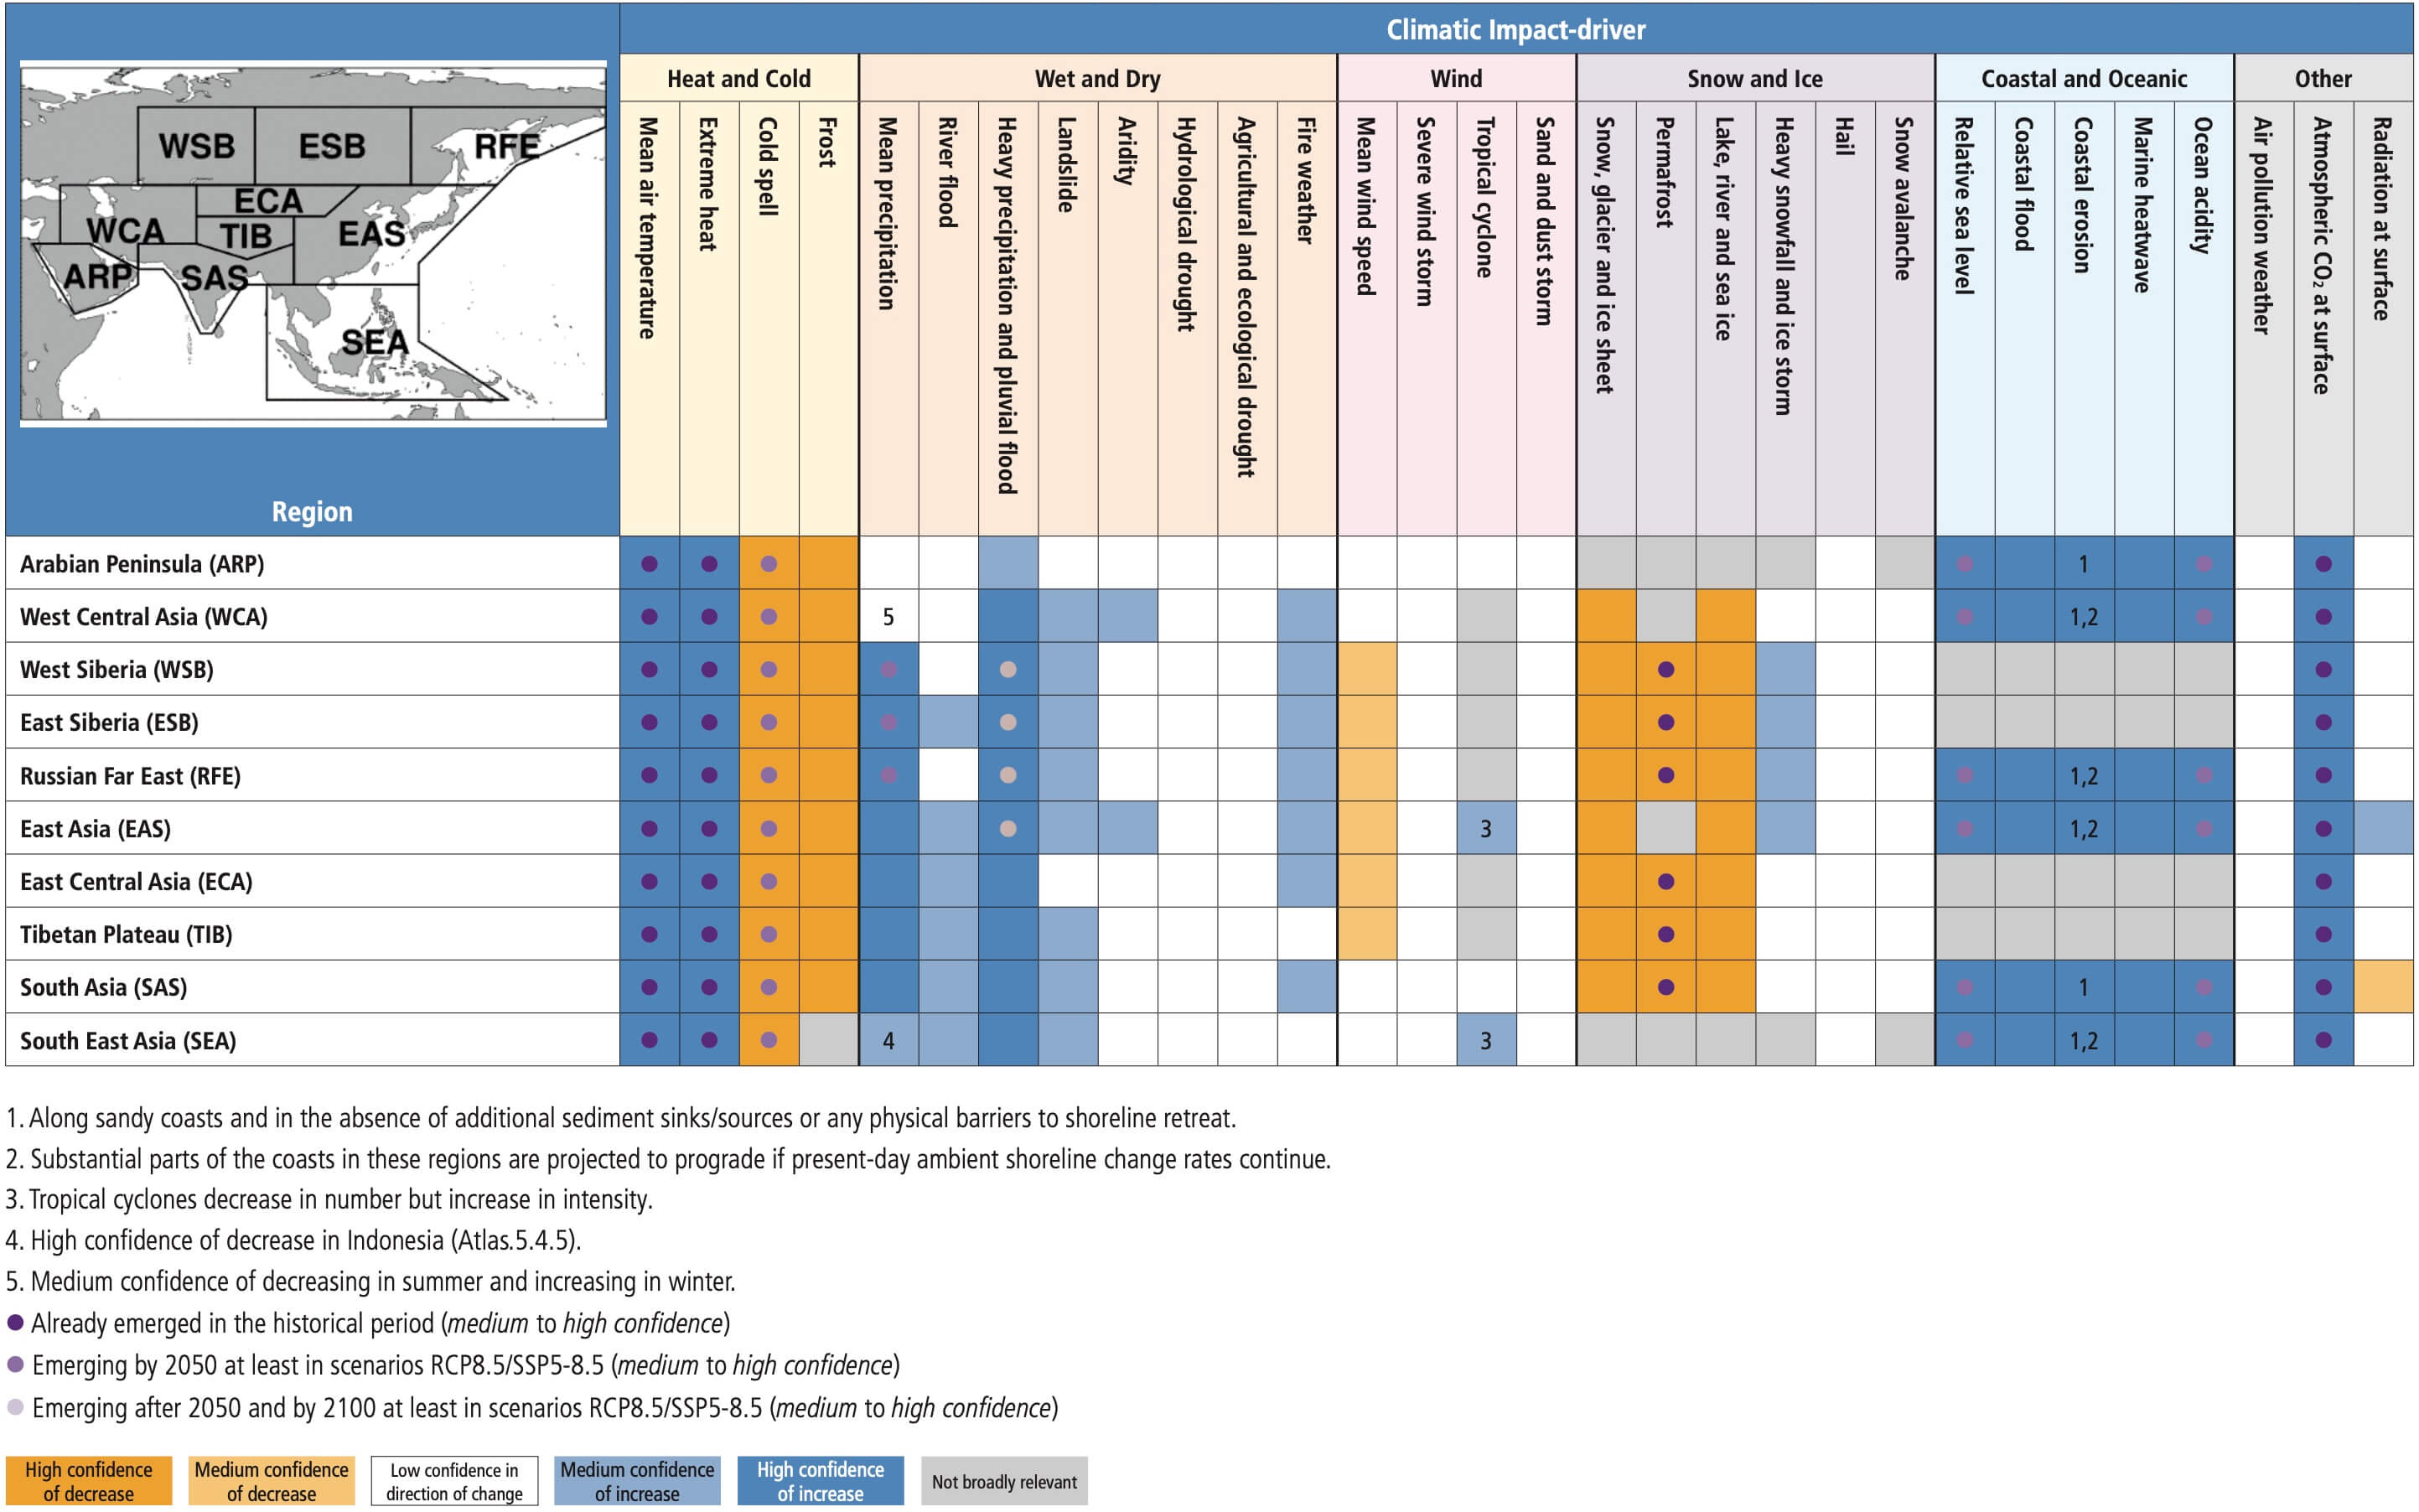
12.4.3 Australasia
For the purpose of this assessment, Australasia is divided into five sub-regions as defined in Section 1.4.5: Northern Australia (NAU), Central Australia (CAU), Eastern Australia (EAU), Southern Australia (SAU) and New Zealand (NZ).
The Fourth and Fifth IPCC Assessment Reports (AR4 and AR5) identify the most damaging historical hazards in this region to be inland flooding, drought, wildfire and episodic coastal erosion due to storms (Hennessy et al., 2007; Reisinger et al., 2014). The SR1.5 (Hoegh-Guldberg et al., 2018) projects very likely increases in the intensity and frequency of warm days and warm nights and decreases in the intensity and frequency of cold days and cold nights in Australasia. Furthermore, a likely increase in the frequency and duration of warm spells is also projected for Australia. The SROCC (IPCC, 2019b) projects a likely global mean sea level rise (RCP8.5) that is up to 0.1 m higher than corresponding AR5 projections. The SROCC also projects an increase of mean significant wave height across the Southern Ocean (high confidence) and an increase in the occurrence of historically rare (1-in-100-year) extreme sea levels to 1-in-1-year or more frequent events all around the Australasian region by 2100 under RCP8.5.
A detailed national scale climate change assessment of observed and projected climate change, based on over 40 CMIP5 models and high resolution downscaling (CSIRO and BOM, 2015), and biannual short updates thereafter are available for Australia (CSIRO and BOM, 2016, 2018, 2020). Similar national assessments for New Zealand are also available (MfE and Stats NZ, 2017, 2020; MfE, 2018). The severe extreme events such as heatwaves and river floods that have occurred in Australasia, especially over the last decade, have enabled a number of attribution studies, improving the understanding of regional climate change mechanisms that drive such extreme events (Chapter 11).
Figure 12.7 illustrates projected changes in two selected climatic impact-driver indices for Australasia.
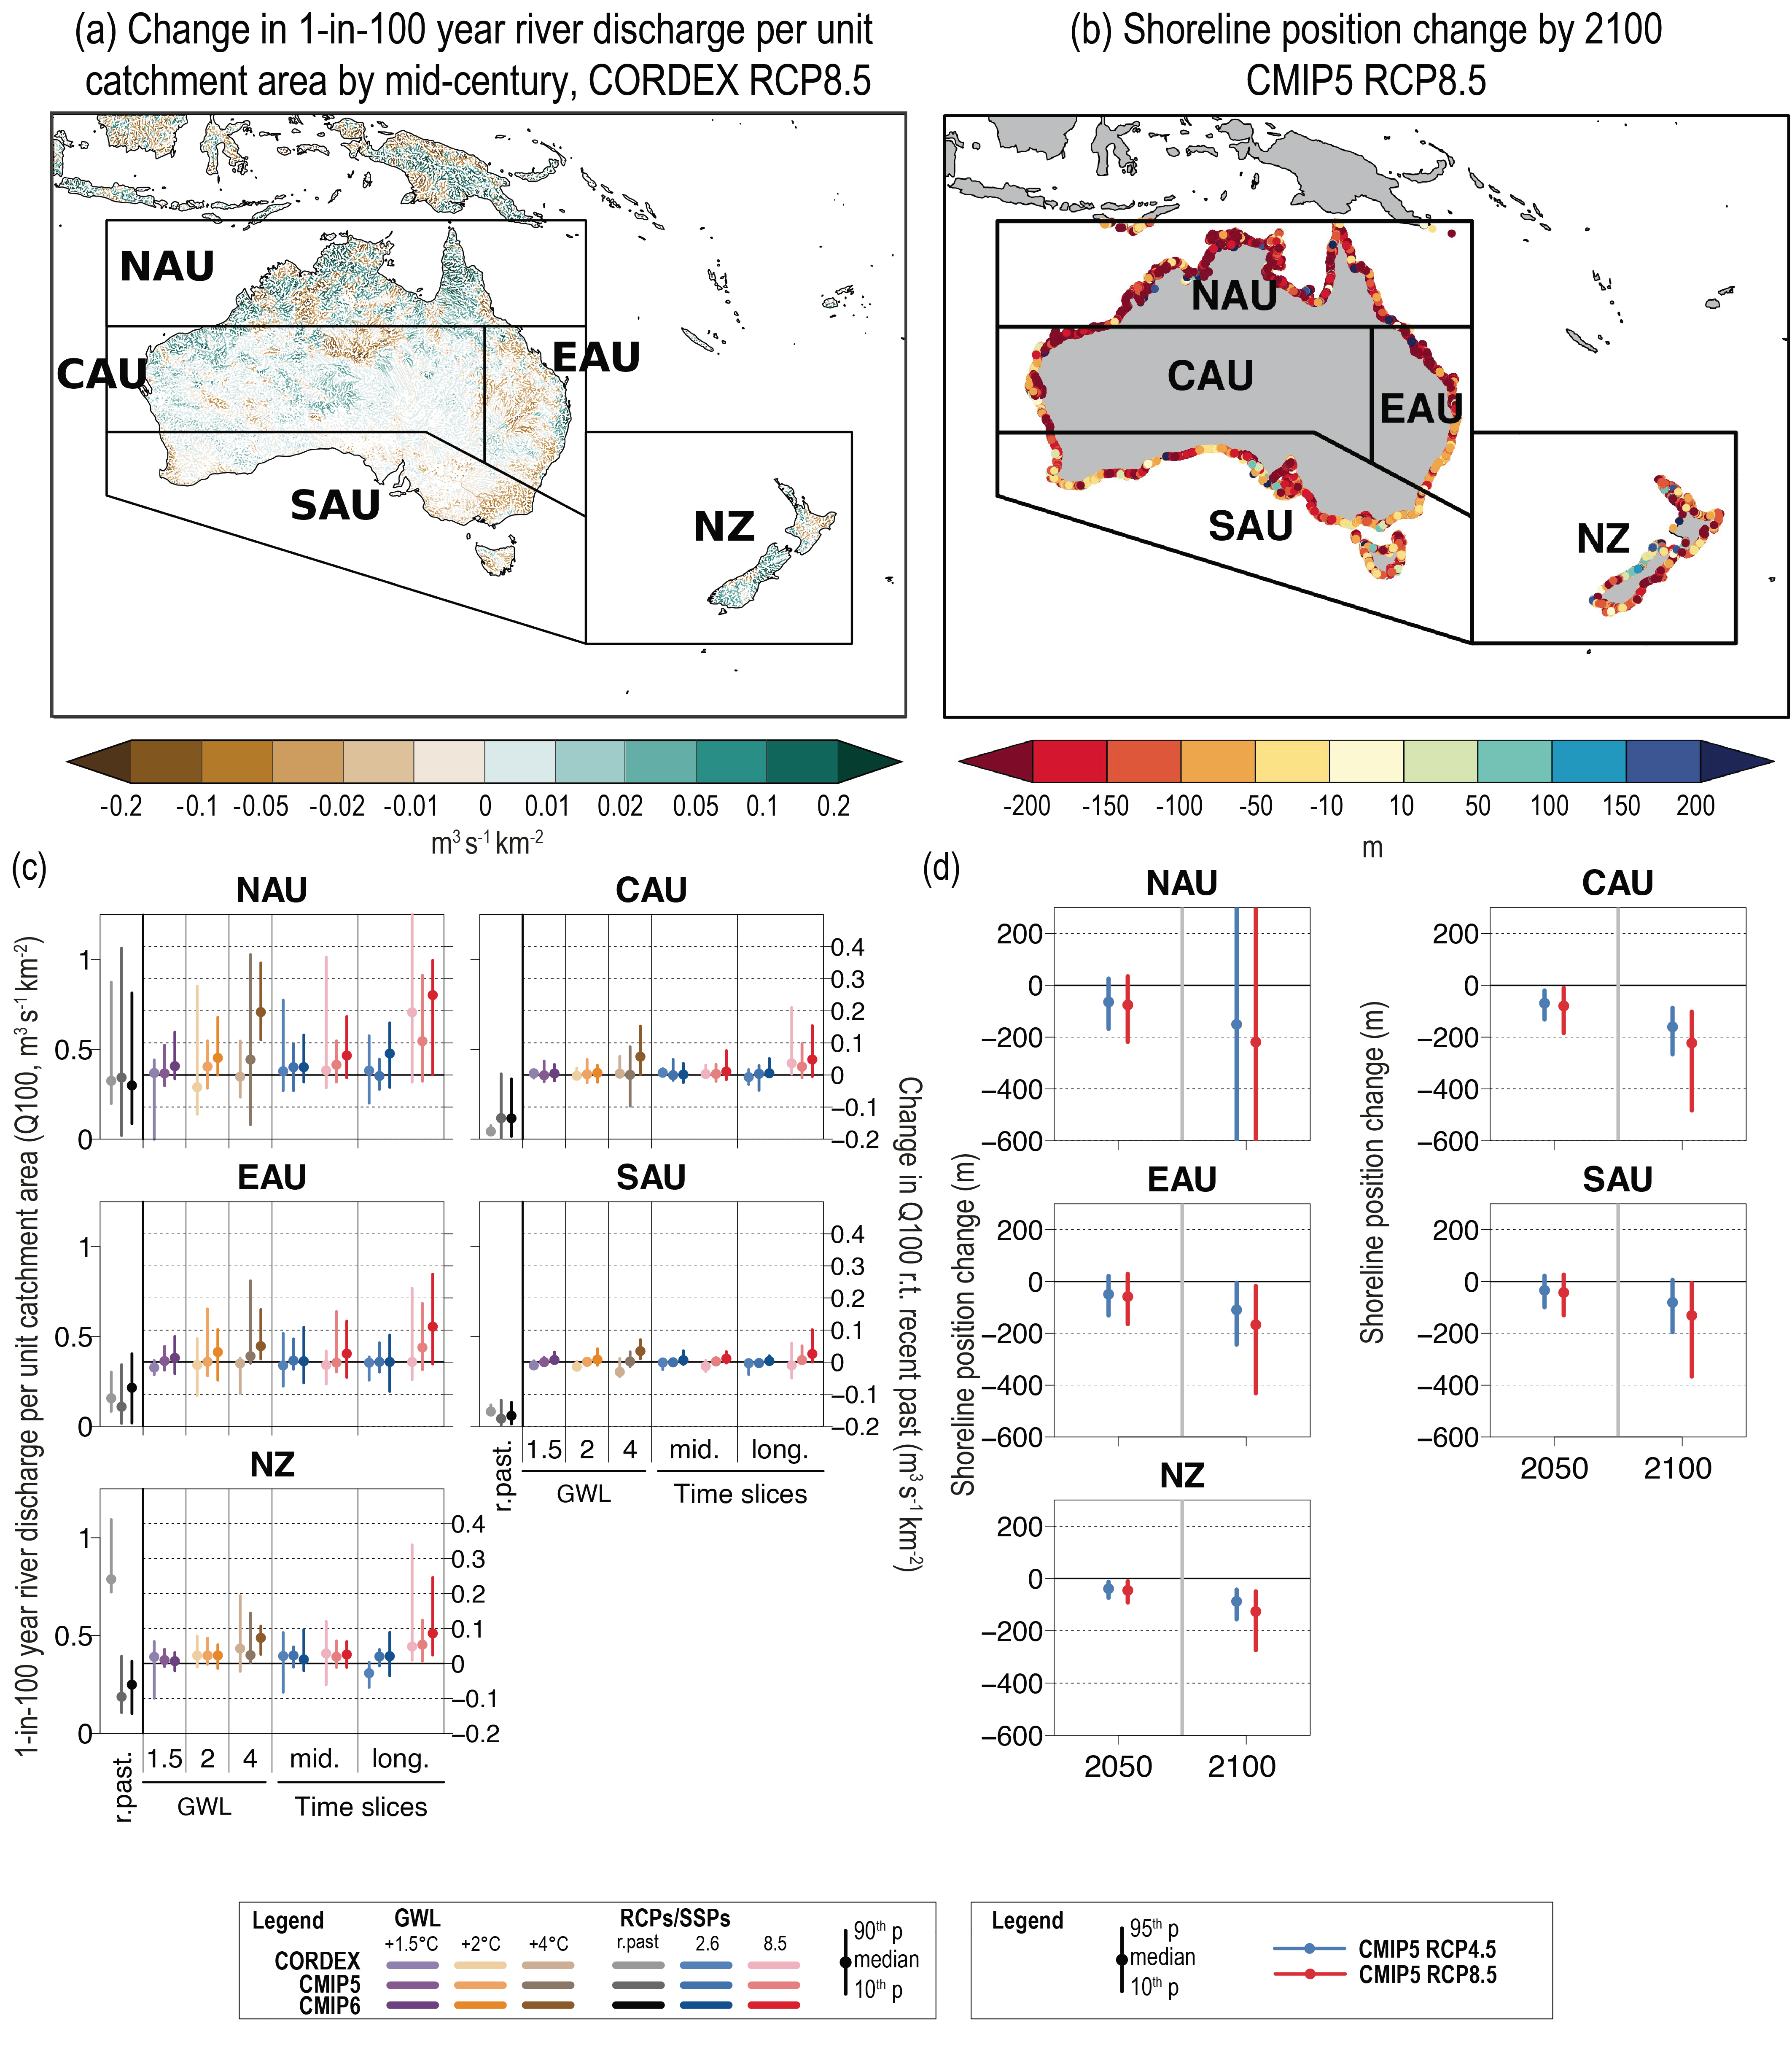 Figure 12.7 | Projected changes in selected climatic impact-driver indices for Australasia. (a) Mean change in 1-in-100-year river discharge per unit catchment area (Q100, m3s–1km–2) from CORDEX-Australasia models for 2041–2060 relative to 1995–2014 for RCP8.5. (b) Shoreline position change along sandy coasts by the year 2100 relative to 2010 for RCP8.5 (metres; negative values indicate shoreline retreat) from the CMIP5-based dataset presented by Vousdoukas et al. (2020b). (c) Bar plots for Q100 (m3s–1km–2) averaged over land areas for the AR6 WGI Reference Regions (defined in Chapter 1). The left-hand column within each panel (associated with the left-hand y-axis) shows the ‘recent past’ (1995–2014) Q100 absolute values in grey shades. The other columns (associated with the right-hand y-axis) show the Q100 changes relative to the recent past values for two time periods (‘mid’ 2041–2060 and ‘long’ 2081–2100) and for three global warming levels (defined relative to the pre-industrial period 1850–1900): 1.5°C (purple), 2°C (yellow) and 4°C (brown). The bars show the median (dots) and the 10–90th percentile range of model ensemble values across each model ensemble. CMIP6 is shown by the darkest colours, CMIP5 by medium, and CORDEX by light. SSP5-8.5/RCP8.5 is shown in red and SSP1-2.6/RCP2.6 in blue. (d) Bar plots for shoreline position change show CMIP5-based projections of shoreline position change along sandy coasts for 2050 and 2100 relative to 2010 for RCP8.5 (red) and RCP4.5 (blue) from Vousdoukas et al. (2020b). Dots indicate regional mean change estimates and bars show the 5–95th percentile range of associated uncertainty. Note that these shoreline position change projections assume that there are no additional sediment sinks/sources or any physical barriers to shoreline retreat. See Technical (Annex VI for details of indices. Further details on data sources and processing are available in the chapter data table (Table 12.SM.1).
 12.4.3.1 Heat and Cold
Mean air temperature: Across Australia mean temperatures have increased by 1.44°C ± 0.24°C during the period 1910–2019, with most of the warming occurring since 1950 (Atlas.6.2; CSIRO and BOM, 2020; Trewin et al., 2020). In New Zealand, an increase of 1.1°C has been measured from 1909–2016 (Atlas.6.2; MfE and Stats NZ, 2020). In the period 1980–2014 a rate of increase of 0.1°C–0.3°C per decade has been observed (Atlas.11 and Atlas.20).
Mean temperature in Australasia is projected to continue to rise through the 21st century (virtually certain) (Atlas.6.4). Projections for Australia indicate that the average temperature will increase by +1.1°C (0.84–1.52°C 10–90th percentile range) by 2041–2060 (mid-century), and by +1.9°C (1.29–2.58°C) by 2081–2100 (end-century), relative to the baseline period of 1995–2014, under SSP2-4.5 (Interactive Atlas). For SSP5-8.5, the projected changes are up to +1.5°C (1.17–1.96°C) and +3.7°C (2.75–4.91°C) for mid- and end-century respectively. For SSP1-2.6, mean temperature is projected to rise by +0.9°C (0.55–1.26°C) and +1.0°C (0.55–1.54°C) relative to 1995–2014 by mid- and end-century respectively (Interactive Atlas). In New Zealand, an increase of mean temperature of +1.0°C (0.60–1.32°C) relative to 1995–2014 is projected by mid-century, and an increase of +1.6°C (1.03–2.26°C) by end-century under SSP2-4.5. For SSP5-8.5, the projected increase in mean temperature is +1.3°C (0.91–1.66°C 10–90th percentile range) and +3.1°C (2.20–4.05°C) relative to 1995–2014 by mid- and end-century respectively. For SSP1-2.6, the projected increase in mean temperature is +0.75°C (0.39–1.06°C) and +0.8°C (0.47–1.46°C) relative to 1995–2014 by mid- and end-century, respectively (Interactive Atlas).
Extreme heat: The region has a very likely trend of increasing frequency and severity of hot extremes since the 1950s (Table 11.10). Extreme minimum temperatures have increased in all seasons over most of Australia and exceeds the increase in extreme maximum temperatures (X.L. Wang et al., 2013; Jakob and Walland, 2016). Heatwave characteristics and hot extremes have increased across many Australian regions since the mid-20th century (Table 11.10; CSIRO and BOM, 2020). The number of days per year with maximum temperature greater than 35°C has increased over most parts of Australia from 1957–2015, with the largest increasing trends of 0.4–1 days/year occurring in north-western, Northern, north-eastern Australia and parts of Central Australia (CSIRO and BOM, 2016). Long-term changes of hot extremes in Australia have been attributed to anthropogenic influence (Table 11.10). In New Zealand, the number of annual heatwave days increased at 18 of 30 sites during the period 1972–2019 (MfE and Stats NZ, 2020).
More frequent hot extremes and heatwaves are expected over the 21st century in Australia (virtually certain) (Table 11.10). Heat thresholds potentially affecting agriculture and health, such as 35°C or 40°C, are projected to be exceeded more frequently over the 21st century in Australia under all RCPs (high confidence). By 2090 under RCP4.5, the average number of days per year with maximum temperatures above 35°C is highly spatially variable and is expected to increase by 50–100%, while the number of days per year with maximum temperatures above 40°C is expected to increase by 200%, relative to 1985–2005 (CSIRO and BOM, 2015). Under RCP8.5 the corresponding projected increases are even greater, with a greater than 100% increase in most of Australia, and far greater increases in Central and Northern Australia (up to a 20-fold increase in Darwin). Projections for New Zealand indicate more frequent hot extremes (virtually certain) (Table 11.10). Figure 12.4b, c shows CMIP6 projections of mean number of days per year with maximum temperature exceeding 35°C under SSP5-8.5, which are consistent with the above assessed literature and across the two CMIP generations, and indicate a strong difference depending on the mitigation scenario (e.g., over 100 days more per year under SSP5-8.5 in NAU, but, in general, less than 60 days more per year under SSP1-2.6 in NAU; Figure 12.SM.1).
The projected frequency of exceeding dangerous humid heat thresholds is increasing in Australia, with a strong increase in Northern Australia for RCP8.5 (high confidence) (Zhao et al., 2015; Mora et al., 2017; Brouillet and Joussaume, 2019), consistently across CMIP5, CMIP6 and CORDEX simulations (Figure 12.4d–f and Figure 12.SM.2). Using the HI index, by end-century, the average number of days exceeding 41°C is projected to increase in NAU by about 100 days and by about 25 days under SSP5-8.5 and SSP1-2.6, respectively. The projections for New Zealand indicate no appreciable increase in the number of days with HI > 41°C across SSPs, time periods and CMIP generations (Figure 12.4d–f and Figure 12.SM.2).
Cold spell and frost: Excepting parts of Southern Australia, the Australasian region has a significant trend of decreasing frequency in cold extremes since the 1950s (high confidence) (Table 11.10) and there is high confidence that such trends are attributable to anthropogenic influence (Table 11.10). The number of frost days per year in Australia has on average declined at a rate of 0.15 days/decade in the past century (Alexander and Arblaster, 2017), except in some regions of Southern Australia, where an increase in both number and season length has been reported (Dittus et al., 2014; Crimp et al., 2016b). The number of frost days has decreased at 12 of 30 monitoring sites around New Zealand over the period 1972–2019 (MfE and Stats NZ, 2020).
Less frequent cold extremes are virtually certain in Australasia (Table 11.10) while a decrease of frost days is projected with high confidence for the region. Projections, relative to 1986–2005, for the number of frost days per year in Australia indicate declines of 0.9 days by mid-century and 1.1 days by end-century for RCP4.5, while for RCP8.5, the projected declines are 1.0 days and 1.3 days by mid- and end-century respectively (Alexander and Arblaster, 2017; Herold et al., 2018). Projections for New Zealand indicate that the number of frost days will decrease by 30% (RCP2.6) to 50% (RCP8.5) by 2040, relative to 1986–2005. By 2090, the decrease ranges from 30% (RCP2.6) to 90% (RCP8.5) (MfE and Stats NZ, 2017).
In general, there is high confidence that most heat hazards in Australasia will increase and that cold hazards will decrease over the 21st century. The mean temperature in Australasia is virtually certain to continue to rise through the 21st century, accompanied by less frequent cold extremes (virtually certain) and frost days (high confidence), and more frequent hot extremes (virtually certain). Heat stress is projected to increase in Australia (high confidence).
12.4.3.2 Wet and Dry
Mean precipitation: Here, only increases in precipitation (under ‘Wet’) are addressed, with decreases (under ‘Dry’) addressed in ‘Aridity’ below.
In terms of wet climatic impact-drivers, detectable anthropogenic increases in precipitation in Australia have been reported particularly for north-central Australia for the period 1901–2010 (Knutson and Zeng, 2018). Figure Atlas.11 indicates no significant trend in precipitation over the region during the baseline period 1960–2015, except for the Global Precipitation Climatology Project (GPCP) dataset, which shows an increasing trend in north-central Australia. In New Zealand, increases in annual rainfall have been observed between 1960–2019 in the south and west of the South Island and east of the North Island. Note however, for the most part, the above reported trends in New Zealand have been classified as statistically not significant (Figure Atlas.20).
Annual mean precipitation is projected to increase in Central and north-east Australia (low confidence) and in the south and west of New Zealand (medium confidence) (Atlas.6.4). Liu et al. (2018a) show that under 1.5°C warming, Central and north-east Australia will become wetter. Projected patterns in annual precipitation exhibit increases in the west and south of New Zealand (Atlas.6.4; Liu et al., 2018a) and project that the South Island will be wetter under both 1.5°C and 2°C warming. However, there is limited model agreement for projected rainfall changes in Australasia as shown in the Atlas.
River flood: Streamflow observations in Australia have shown that negative trends dominate in annual maximum flow and that stations with significant negative trends were mostly located in the south-east and south-west (Gu et al., 2020). The observed peak flow trend in Southern Australia is attributed to the decrease of soil moisture, although an increase of flood magnitude is possible for very rare events. For the more frequent flood events, the increase of extreme precipitation is balanced by the decrease of soil moisture. (Wasko and Nathan, 2019).
While median annual runoff is projected to decrease in most of Australia (Chiew et al., 2017), consistent with projected decreases in average rainfall (CSIRO and BOM, 2015; Alexander and Arblaster, 2017), river floods are projected to increase due to more intense extreme rainfall events and associated increase in runoff (medium confidence). Asadieh and Krakauer (2017) found a decrease in the value of the 95% percentile of mean streamflow with RCP8.5 by the end of the century in all of Australia, except in a small part in centre of the country. In terms of relative increases, flooding is expected to increase more in Northern Australia (driven by convective rainfall systems) than in Southern Australia (where more intense extreme rainfall may be compensated by drier antecedent moisture conditions; Alexander and Arblaster, 2017; Dey et al., 2019) with flood frequency increasing in Northern Australia and along parts of the east coast and decreasing in south-western Western Australia (Hirabayashi et al., 2013). Gu et al. (2020) project larger flood magnitude and volumes under both RCP2.6 and RCP8.5 in Northern Australia, and smaller flood magnitudes and volumes in Southern Australia under the same RCPs. These findings are in general agreement with the patterns in peak flow, corresponding to the 1-in-100-year return period streamflow, shown in Figure 12.7a,c for mid-21st century under RCP8.5.
There is medium confidence that river flooding will increase in New Zealand. Projections for New Zealand indicate that the 1-in-50-year and 1-in-100-year flood peaks for rivers in many parts of the country may increase by 5 to 10% by 2050 and more by 2100 (with large variation between models and emissions scenarios), with a corresponding decrease in return periods for specific flood levels (Gray et al., 2005; Carey-Smith et al., 2010; McMillan et al., 2010, 2012; Ballinger et al., 2011).
Heavy precipitation and pluvial flood: Rainfall extremes have been detected to increase in Australasia, with low confidence (Table 11.10). There is high confidence that R × 1 day and R × 5 day precipitation extremes will increase for 2°C or lower warming for the region as a whole, but on a sub-regional basis there is only medium confidence of increases in NAU and CAU and low confidence of increases on EAU, SAU and NZ. For warming levels exceeding 2°C, these extremes are very likely to increase in NAU and CAU and they are likely to increase elsewhere in the region (Section 11.9).
Landslide: Based on local slope characteristics, lithology and seismic activity, the South Island and the eastern half of the North Island of New Zealand are vulnerable to landslide occurrence (Broeckx et al., 2020). The potential for land and rockslides increases with, amongst other factors, total precipitation rates, precipitation intensity, mountain permafrost thaw rates, glacier retreat and air temperature (Crozier, 2010; Allen and Huggel, 2013; Gariano and Guzzetti, 2016; IPCC, 2019a). Given the increase of the magnitude of these physical variables in areas that are already highly susceptible to mass movements (MfE, 2018), there is low confidence that the occurrence of landslides will increase under future climate conditions.
Aridity: In terms of dry climatic impact-drivers, a substantial decrease in precipitation has been observed across Southern Australia during the cool season (April–October) (medium confidence). The drying trend has been particularly strong over south-west Western Australia between May and July, with rainfall since 1970 being around 20% less than the 1900–1969 average (CSIRO and BOM, 2020). Detectable decreases in mean precipitation, attributable at least in part to anthropogenic forcing, have been reported for parts of south-west Australia (Delworth and Zeng, 2014; Knutson and Zeng, 2018), south-east Australia, and Tasmania (Knutson and Zeng, 2018). In New Zealand, the north-east of the South Island and western and the northern parts of the North Island show decreasing precipitation trends during 1960–2019 (MfE and Stats NZ, 2020).
Aridity is projected to increase, especially during winter and spring, with medium confidence in SAU but with high confidence in south-west Western Australia (Table 11.11 and Atlas.6.4). In EAU and in the north and east of NZ, aridity is projected to increase with medium confidence, while a decrease is projected with medium confidence in the south and west of NZ (Atlas.6.4). Although there is only low confidence in the projected decrease of mean annual precipitation in south-western and eastern Australia and the north and east of New Zealand, there is high confidence of reduced winter and spring precipitation in Australia in future, mostly in south-western and eastern Australia (Atlas.6.4). Liu et al. (2018b) show that under 2°C warming, most of Australia is projected to become drier based on the Palmer Drought Severity Index (PDSI), with the exception of the tropical north-east. Ferguson et al. (2018) project that between 1976–2005 and 2070–2099, winters will become drier (mainly in Southern Australia) under RCP8.5. Liu et al. (2018b) project that the North Island of New Zealand will be drier under both 1.5°C and 2°C warming.
Hydrological drought: There is low confidence of observed changes in hydrological droughts in Australasia, except in SAU where there is medium confidence of an observed increase in the south-east and south-west. Future projections indicate medium confidence in further hydrological drought increases for Southern Australia for warming levels of 2°C or higher (Section 11.9). Mean annual runoff in far south-east and far south-west Australia are projected to decline by median values of 20 and 50% respectively, by mid-century under RCP8.5 (Chiew et al., 2017). Prudhomme et al. (2014) assess changes in the Drought Index (DI), defined as areal runoff less than the 10th percentile over the reference period 1976–2005, and project DI increases for both Australia and New Zealand by 10–20% by 2070–2099 under RCP8.5, with the greatest effects being in the southern parts of the Australian continent. These projections are consistent with the trends shown in Figure 12.4g–i (Figure 12.SM.3). The SPI drought frequency is projected to increase in SAU and particularly in south-west Western Australia by mid-century, while by the end of the century SPI drought frequency is projected to increase all over Australia, and particularly strongly in south-west Western Australia as well as southern Victoria (see Figure 12.4g–i). For the Murray–Darling basin, Ferguson et al. (2018) project effectively no change (–1%) in mean precipitation, a 27% decrease in P–E, and 30% increase in runoff in 2070–2099 relative to 1976–2005 with RCP8.5.
Agricultural and ecological drought: There is medium confidence in observations of agricultural and ecological droughts increasing in SAU and decreasing in NAU, while there is low confidence of changes elsewhere in the region (Section 11.9). More regional studies have observed an increase in agricultural and ecological drought intensity in south-west Australia and an increase in drought intensity in parts of south-east Australia, while the length of droughts therein has increased (Section 11.9). In New Zealand, since 1972–73, soils at 7 of 30 monitored sites became drier, while the 2012–13 drought was one of the most extreme in the previous 41 years (MfE and Stats NZ, 2017). Future evaporative demand is projected to lead to medium confidence increases in agricultural and ecological droughts for 2°C of global warming in SAU and EAU and low confidence for changes in CAU, NAU and NZ, although there is medium confidence of increases in CAU with 4°C of global warming (Section 11.9). There is medium confidence for more time in agricultural and ecological drought in SAU by mid-21st century (Coppola et al., 2021b) as well as by the end of the 21st century (Herold et al., 2018). The Standardized Precipitation Evapotranspiration Index (SPEI) shows a springtime intensification in SAU with moderate and severe droughts in the south-west and moderate droughts in the south-east (Herold et al., 2018). There is consensus among the different model ensembles (CORDEX-CORE, CMIP5 and CMIP6) that the drought frequency (DF), one of several proxies for agricultural and ecological drought, will increase in all four Australian regions for both mid-century (NAU 0.2–2 DF increase, CAU 0.5–2 DF increase, SAU 1–3 DF increase and EAU 0.8–3 DF increase) and end-century (0.8–2.7 DF increase for NAU, 1.2–2 DF increase for CAU, 2.2–3.8 for SAU and 0.2–3 for EAU) for both RCP8.5 and SSP5-8.5, with CMIP6 showing the lowest increase (Figure 12.4g–l and Figure 12.SM.4; Coppola et al., 2021b).
Fire weather: Dowdy and Pepler (2018) examined atmospheric conditions conducive to pyroconvection in the period 1979–2016, and found an increased risk in south-east Australia during spring and summer, due to changes in vertical atmospheric stability and humidity, in combination with adverse near-surface fire weather conditions. CSIRO and BOM (2018) and Dowdy (2018) found that the annual 90th percentile daily Forest Fire Danger Index (FFDI) has increased from 1950–2016 in parts of Australia, especially in Southern Australia (1–2.5 per decade) and in spring and summer. These studies indicate an increase in the frequency and magnitude of FFDI extreme quantiles, as well as a shift of the fire season start towards spring, lengthening the fire season. The unprecedented large fires of austral spring and summer of 2019 in south-east Australia were a result of extreme hot and dry weather in significantly drier than average conditions that had persisted since 2017, in combination with consistently stronger than average winds, resulting in above average to highest on record FFDI values in much of the country (Abram et al., 2021). These fires have been attributed to climate change through the temperature component of fire weather indices (van Oldenborgh et al., 2021). In New Zealand, days with very high and extreme fire weather increased in 12 out of 28 monitored sites, and decreased in 8, in the period 1997–2019 (MfE and Stats NZ, 2020). Attribution studies indicate that there is medium confidence of an anthropogenically driven past increase in fire weather conditions, essentially due to increase in frequency of extreme heat waves. (Hope et al., 2019; Lewis et al., 2020; van Oldenborgh et al., 2021).
Fire weather indices are projected to increase in most of Australia (high confidence) and many parts of New Zealand (medium confidence), in particular with respect to extreme fire and induced pyroconvection (Dowdy et al., 2019b). Increasing mean temperature, cool season rainfall decline, and changes in tropical climate variability all contribute to a future increase in extreme fire risk in Australia (Abram et al., 2021). Projections indicate that the annual cumulative FFDI will increase by 31–33% in Southern and Eastern Australia, and by 17–25% in Northern Australia and the Rangelands by 2090 (relative to 1995) under RCP8.5 (CSIRO and BOM, 2015). Using a CMIP5 ensemble of 17 models, Abatzoglou et al. (2019) found a statistically significant positive trend for fire weather intensity and fire season length for future mid-century conditions under RCP8.5, including a detectable anthropogenic influence on fire risk magnitude and fire season length by 2040 in Western Australia and along the Queensland coastline. Using the C-Haines and FFDI indices with A2 and RCP8.5 respectively, Di Virgilio et al. (2019) and Clarke et al. (2019) have shown that extreme fire weather frequency will increase in south-eastern Australia by the end of the 21st century. Most of these projections indicate that the biggest increases in fire weather conditions will be in late spring, effectively resulting in longer (stronger) fire seasons in areas where spring is the shoulder (peak) season. In New Zealand, Watt et al. (2019) projected that the number of days with very high to extreme fire risk will increase by 71% by 2040, and by a further 12% by 2090, for the A1B scenario, with fire risk increase all along the east coast. The most marked relative changes by 2090 were projected for Wellington and Dunedin, where very high to extreme fire risk is projected to increase by, respectively, 89% to 32 days and 207% to 18 days, compared to the baseline period 1970–1999.
Annual mean precipitation is projected to increase in Central and north-east Australia (low confidence) and in the south and west of New Zealand (medium confidence), while it is projected to decrease in Southern Australia (medium confidence), albeit with high confidence in south-west Western Australia, in Eastern Australia (medium confidence), and in the north and east of New Zealand (medium confidence). Heavy precipitation and pluvial flooding are projected to increase with medium confidence in Northern Australia and Central Australia. There is medium confidence that river flooding will increase in New Zealand and Australia, with higher increases in Northern Australia. Aridity is projected to increase with medium confidence in Southern Australia (high confidence in south-west Western Australia), Eastern Australia (medium confidence), and in the north and east of New Zealand (medium confidence). Hydrological droughts are projected to increase in Southern Australia (medium confidence), while agricultural and ecological droughts are projected to increase with medium confidence in Southern Australia and Eastern Australia. Fire weather is projected to increase throughout Australia (high confidence) and New Zealand (medium confidence).
12.4.3.3 Wind
Mean wind speed: There is low confidence of a mean wind speed trend in the last decades (low agreement) (McVicar et al., 2012; Troccoli et al., 2012; Azorin-Molina et al., 2018; J. Wu et al., 2018), as long-term measurements are not homogeneous.
In future climate scenarios wind speed trends in Australia exhibit generally weak amplitudes with low agreement among models (Figure 12.4m–o and Figure 12.SM.5) with uncertain consequences on wind power potential (CSIRO and BOM, 2015; Karnauskas et al., 2018a; Jung and Schindler, 2019). However, there is medium confidence that, by the end of the century, annual mean wind power will significantly increase in north-eastern Australia under RCP8.5, but there is low confidence of an increase by end-century under RCP4.5, and for any scenario by mid-century (Karnauskas et al., 2018a). In New Zealand, mean wind patterns are projected to become more north-easterly in summer, and westerlies to become more intense in winter (low confidence), in agreement with the strengthening of the Southern Hemisphere storm tracks (Section 4.5.1).
Severe wind storm: There is generally low confidence in observed changes in extreme winds and extratropical storms in Australasia (Section 11.7.2). CMIP5 projections of severe winds indicate a general increase in north-eastern Australia, and decreases in some parts in Southern and Central Australia (medium confidence) by the end of the century under RCP8.5 (CSIRO and BOM, 2015; Kumar et al., 2015; Jung and Schindler, 2019). Elsewhere trends are diverse and vary across simulations with low agreement. Projections of changes in the 1-in-25-year return period winds (based on annual maxima) for 2074–2100 relative to 1979–2005 for RCP8.5 show an increase in tropical areas of Northern Australia (Kumar et al., 2015).
In New Zealand, the frequency and magnitude of extreme winds have decreased (from 1980–2019) at 12 of 14 monitored sites and increased at two monitored sites (MfE and Stats NZ, 2020). Due to the intensification and the shift of the austral storm track by the end of the century (Yin, 2005), increases in extreme wind speed in New Zealand are projected over the South Island and the southern part of the North Island by mid- and end-century for all RCPs (low confidence) (MfE, 2018).
Tropical cyclone: In Australia, the number of TCs has generally declined since 1982, and the frequency of intense TCs that make landfall in north-eastern Australia has declined significantly since the 19th century (medium confidence) (Kuleshov et al., 2010; Callaghan and Power, 2011; Holland and Bruyère, 2014; Knutson et al., 2019; CSIRO and BOM, 2020). There is high confidence that cyclones making landfall along north-eastern and northern Australian coastlines will decrease in number and low confidence of an increase in their intensities for 2°C of global warming as well as for the mid-century period with scenarios RCP4.5 and above (Roberts et al., 2015, 2020; Bacmeister et al., 2018; Knutson et al., 2020), with the amplitude of changes increasing from RCP4.5 to RCP8.5 (Bacmeister et al., 2018). Decreases in frequency are projected for ‘east coast lows’ (Walsh et al., 2016b; Dowdy et al., 2019a).
Sand and dust storm: Australia is recognized to be the largest dust source in the Southern Hemisphere (Zheng et al., 2016). Land-use and land-cover change have increased dust emissions in Australia in the past 200 years (Marx et al., 2014). While projections suggest a decrease in severe winds in Central and Southern Australia, changes in vegetation due to increased aridity and hydrological drought could be expected to result in increased wind erosion and dust emission across the country (medium confidence) (Webb et al., 2020).
In Australasia, there is low confidence in projected mean wind speeds and wind power potential, with a medium confidence increase projected only in north-eastern Australia under high emissions scenarios and by the end of the 21st century. Tropical cyclones in north-eastern and North Australia are projected to decrease in number (high confidence) while their intensity is projected to increase (low confidence).
12.4.3.4 Snow and Ice
Snow: The snow season length in Australia has decreased by 5% during 2000–2013 relative to 1954–1999, especially in spring (Pepler et al., 2015). A shift in the date of peak snowfall has also been observed with an 11-day advance over the same period (Pepler et al., 2015). A decreasing trend in maximum snow depth has been observed for Australian alpine regions since the late 1950s, with the largest declines during spring and at lower altitudes. Maximum snow depth is highly variable and is strongly influenced by rare heavy snowfall days, which have no observed trends in frequency (CSIRO and BOM, 2020).
Projections for Southern Australia and New Zealand show a continuing reduction in snowfall during the 21st century (high confidence). The magnitude of decrease varies with the altitude of the region and the emissions scenario. At elevations lower than 1500 m, years without snowfall are projected from 2030 in some models. By 2090, and under RCP8.5, such years are projected to become common (CSIRO and BOM, 2015). The number of annual snow days in New Zealand is projected to decrease under all RCPs, by up to 30 days or more by 2090 under RCP8.5, relative to 1986–2005 (MfE, 2018).
Glacier: Glacier mass and areal extent in New Zealand is projected to continue to decease over the 21st century (high confidence) (Section 9.5.1.3). Glacier ice volume from 1977–2018 in New Zealand has decreased from 26.6 to 17.9 km3 (a loss of 33%; Salinger et al., 2019). Relative to 2015, glaciers in New Zealand are projected to lose 36 ± 44%, 53 ± 33% and 77 ± 27% of their mass by the end of the century under RCP2.6, RCP4.5 and RCP8.5 respectively, with the loss rates decreasing over time under RCP2.6 and increasing under RCP8.5 (Marzeion et al., 2020).
In summary, snowfall is expected to decrease throughout the region at high altitudes in both Australia (high confidence) and New Zealand (medium confidence). In New Zealand, glacier ice mass and extent are expected to decrease over the 21st century for all scenarios (high confidence).
12.4.3.5 Coastal and Oceanic
Relative sea level: Around Australasia, from 1900–2018, a new tide gauge-based reconstruction finds a regional mean RSL change of 1.33 [0.80 to 1.86] mm yr–1 in the Indian Ocean–South Pacific region (Frederikse et al., 2020), compared to a GMSL change of around 1.7 mm yr–1Section 2.3.3.3 and Table 9.5). For the period 1993–2018, the RSLR rates, based on satellite altimetry, increased to 3.65 [3.23 to 4.08] mm yr–1 (Frederikse et al., 2020), compared to a GMSL change of 3.25 mm yr–1Section 2.3.3.3 and Table 9.5).
Relative sea level is virtually certain to increase throughout the region over the 21st century (Section 9.6.3, Figure 9.28). Regional mean RSLR projections for the oceans around Australasia range from 0.4–0.5 m under SSP1-2.6 to 0.7–0.9 m under SSP5-8.5 for 2081–2100 relative to 1995–2014 (median values), which means local RSL change falls within the range of mean projected GMSL change (Section 9.6.3.1). However these RSLR projections may be underestimated due to potential partial representation of land subsidence (Section 9.6.3.2).
Coastal flood: The most commonly used index for episodic coastal inundation in Australia is the summation of a high end SLR and the 1-in-100-year storm tide level (the combined sea level due to storm surge and tide) (CSIRO and BOM, 2016; McInnes et al., 2016). However, episodic coastal flooding is caused by extreme total water levels (ETWL), which is the combination of SLR, tides, surge and wave setup (Section 12.3.5.2). The present-day 1-in-100-year ETWL is between 0.5–2.5 m around most of Australia, except the north-western coast where 1-in-100-year ETWL can be as large as 6–7 m (Vousdoukas et al., 2018; O’Grady et al., 2019; Kirezci et al., 2020).
Extreme total water level magnitude and occurrence frequency are expected to increase throughout the region (high confidence) (Figure 12.4p–r and Figure 12.SM.6). Across the region, the 5–95th percentile range of the 1-in-100-year ETWL is projected increase (relative to 1980–2014) by 5–35 cm and by 10–40 cm by 2050 under RCP4.5 and RCP8.5 respectively (Figure 12.4q). By 2100 (Figure 12.4p,r), this range is projected to be 25–80 cm and 50–190 cm under RCP4.5 and RCP8.5 respectively (Vousdoukas et al., 2018; Kirezci et al., 2020). Furthermore, the present-day 1-in-100-year ETWL is projected to have median return periods of around 1-in-20-years by 2050 and 1-in-1-year by 2100 in SAU and NZ and return periods of around 1-in-50-years by 2050 and 1-in-20-years by 2100 in NAU under RCP4.5 (Vousdoukas et al., 2018), while the present-day 1-in-50-year ETWL is projected to occur around three times a year by 2100 with a SLR of 1 m around Australasia (Vitousek et al., 2017).
Coastal erosion: Satellite derived shoreline retreat rates for the period between 1984–2015 show retreat rates between 0.5 and 1 m yr–1around the region, except in SAU where a shoreline progradation rate of 0.1 m yr–1has been observed (Luijendijk et al., 2018; Mentaschi et al., 2018). Mentaschi et al. (2018) report a coastal area loss of 350 km2 over the same period in Western Australia from satellite observations.
Projections indicate that a majority of sandy coasts in the region will experience shoreline retreat, throughout the 21st century (high confidence) (Figure 12.7b,d). Median shoreline change projections (CMIP5) under both RCP4.5 and RCP8.5 presented by Vousdoukas et al. (2020b) show that, by mid-century, sandy shorelines will retreat (relative to 2010) by between 50 and 80 m all around Australasia, except in SAU and NZ where the projected retreat (relative to 2010) is between 35 and 50 m. By 2100, median shoreline retreats exceeding 100 m (relative to 2010) are projected along the sandy coasts of NAU (about 150 m), CAU (about 160 m), and EAU (about 110 m) under RCP4.5m, while projections for SAU and NZ are around 80–90 m. Under RCP8.5, shoreline retreat exceeding 100 m is projected all around the region by 2100 (relative to 2010) with retreats as high as 220 m in NAU and CAU (about 170 m in EAU and about 130 m in SAU and NZ; Figure 12.7b,d). The total length of sandy coasts in Australasia that is projected to retreat by more than a median of 100 m by 2100 under RCP4.5 and RCP8.5 is about 12,500 and 16,000 km respectively, an increase of approximately 30%.
Distinct from long-term coastline recession, storms and storm surges also result in episodic coastal erosion. In general, the historically measured maximum episodic coastal erosion (either eroded volume or coastline retreat distance) or that due to a 1-in-100-year return period storm wave height is used as a design criterion for coastal zone management and planning in Australia (Wainwright et al., 2014; Mortlock et al., 2017).
While there is wide recognition in Australia that the combined effect of SLR, changing storm surge and wave climates will directly affect future episodic coastal erosion (McInnes et al., 2016; Ranasinghe, 2016; Harley et al., 2017) only a few projections of how this hazard may evolve are available for Australia. In one such study, Jongejan et al. (2016) provide projections of how the full exceedance probability curve of the maximum erosion per year may evolve over the 21st century (due to the combined action of SLR, storm surge and storm waves). Their results show that, for example, the 0.01 exceedance probability maximum coastline retreat in 2025 will have an exceedance probability of 0.015 by 2050 and 0.07 by 2100.
Marine heatwave: The mean SST of the ocean around Australia and east of New Zealand has warmed at a rate of about 0.22°C per decade between 1992 and 2016 (Wijffels et al., 2018), which is higher than the global average SST increase of 0.16°C per decade (Oliver et al., 2018). This mean ocean surface warming is connected to longer and more frequent marine heatwaves in the region (Oliver et al., 2018). Over the period 1982–2016, the coastal ocean of Australia experienced on average more than 1.5 marine heatwaves (MHWs) per year, with the north coast of Western Australia and the Tasman Sea experiencing on average 2.5–3 MHWs per year. The average duration was between 10 and 15 days, with somewhat longer and hotter MHWs in the Tasman Sea. In New Zealand, the south-east coast of South Island experiences the most MHWs (2.5–3 per year). The duration of MHW in New Zealand is on average 10–15 days (Oliver et al., 2018). Changes around Australasia over the 20th century, derived from MHW proxies, show an increase in frequency between 0.3 and 1.5 MHW per decade, except along the south-east coast of New Zealand (Box 9.2); an increase in duration per event; and the total number of MHW days per decade, with the change being stronger in the Tasman Sea than elsewhere (Oliver et al., 2018).
There is high confidence that MHWs will increase around most of Australasia. Under RCP4.5 and RCP8.5 respectively, mean SST is projected to increase by 1°C and 2°C around Australia by 2100, with a hotspot of around 2°C for RCP4.5 and of 4°C for RCP8.5 along the south-east coast between Sydney and Tasmania (Interactive Atlas). Under all RCPs, the mean SST around Australia is expected to increase in the future, with median values of around 0.4°C–1.0°C by 2030 under RCP4.5, and 2°C–4°C by 2090 under RCP8.5 (CSIRO and BOM, 2015). Warming is expected to be largest along the north-west coast of Australia, southern Western Australia, and along the east coast of Tasmania (CSIRO and BOM, 2018). More frequent, extensive, intense and longer lasting MHWs are projected around Australia and New Zealand for GWLs of 1.5°C, 2°C and 3.5°C relative to the modelled reference value for 1861–1880 (Frölicher et al., 2018). Projections for SSP1-2.6 and SSP5-8.5 both show an increase in MHWs around Australasia by 2081–2100, relative to 1985–2014 (Box 9.2, Figure 1).
In general, there is high confidence that most coastal/ocean-related hazards in Australasia will increase over the 21st century. Relative sea level rise is virtually certain to continue in the oceans around Australasia, contributing to increased coastal flooding in low-lying areas (high confidence) and shoreline retreat along most sandy coasts (high confidence). Marine heatwaves are also expected to increase around the region over the 21st century (high confidence).
The assessed direction of change in climatic impact-drivers for Australasia and associated confidence levels are illustrated in Table 12.5, together with emergence time information (Section 12.5.2). No assessable literature could be found for hail and snow avalanches, although these phenomena may be relevant in parts of the region.
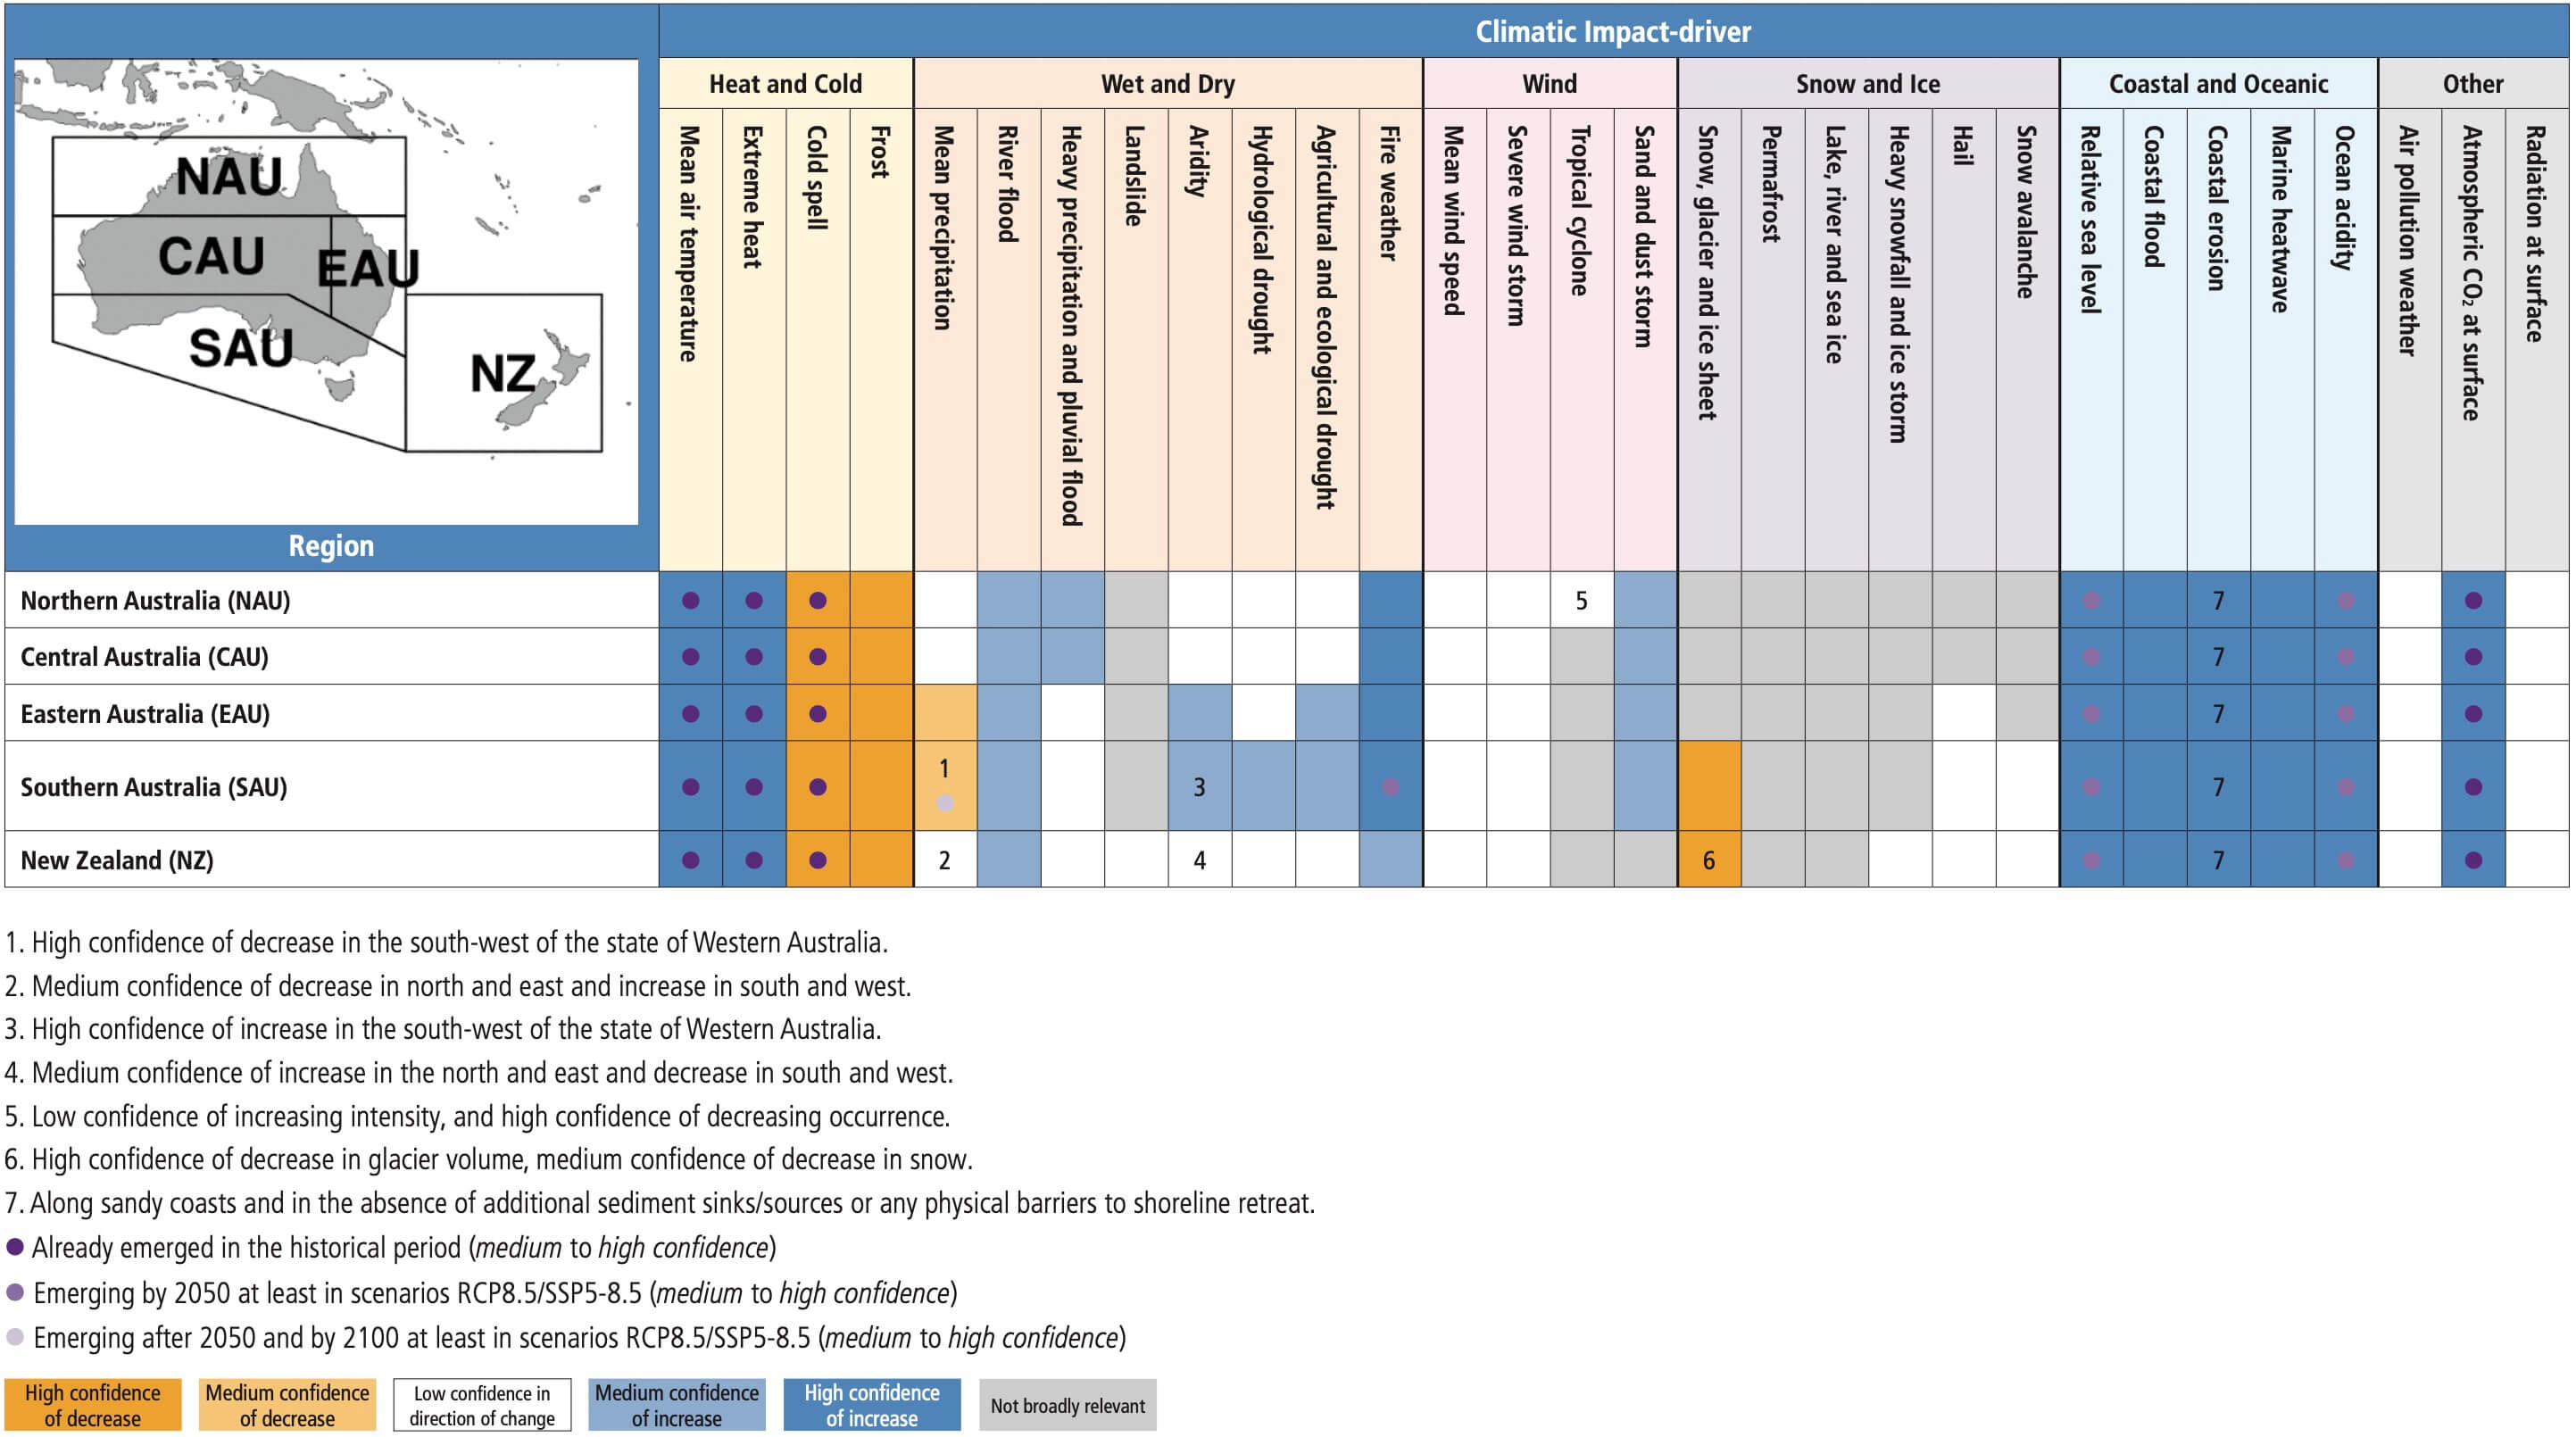
12.4.4 Central and South America
For the purpose of this assessment, Central and South America is divided into eight sub-regions, as defined in Chapter 1: Southern Central America (SCA), North-Western South America (NWS), Northern South America (NSA), South American Monsoon (SAM), North-Eastern South America (NES), South-Western South America (SWS), South-Eastern South America (SES) and Southern South America (SSA). The Caribbean is placed under the Small Islands section (12.4.7) of this chapter.
Previous assessments have documented ongoing and projected changes in several CIDs. IPCC AR5 projections (IPCC, 2014b) pointed to increases in mean temperature between 2°C and 6°C by the end of the century (high confidence) and increases in the occurrence of warm days and nights under various future climate scenarios (medium confidence). The AR5 also pointed to patterns of changes in precipitation (medium confidence), changes in the duration of dry spells (medium confidence) and decreases in water supply (high confidence). The SR1.5 projections indicated expected increases in river flooding and extreme runoff at 2°C warming in parts of South America, and decreases in runoff in Central America, central and Southern South America, and the Amazon basin. The SROCC reported an increased number of landslides, a decreased volume of lahars from ice and snow-clad volcanoes, and increased frequency of glacier lake outburst floods. The SROCC also indicated that regional and local-scale projections point to decreasing trends in glacier runoff.
New literature is now available for the regional climate as a result of observational research and coordinated modelling outputs of CORDEX South America (Solman, 2013; Sánchez et al., 2015) and CORDEX-CORE (Giorgi et al., 2018; Coppola et al., 2021b; Teichmann et al., 2021). Of particular interest are the new projections of both mean climate and extremes. This new regional climate information is key to main sectors sensitive to climate change in Central and South America such as water resources, infrastructure, agriculture, livestock, forestry, silviculture and fisheries (Magrin, 2015; López Feldman and Hernández Cortés, 2016), human health (changes in morbidity and mortality, and emergence of diseases in previously non-endemic areas; Núñez et al., 2016) and biodiversity (Uribe Botero, 2015), urban planning, navigation and tourism.
12.4.4.1 Heat and Cold
Mean air temperature: New literature confirms a continuous warming since the beginning of the 20th century in the majority of the eight sub-regions (Atlas.7). However, observational datasets in several areas are still short and trend estimation is hindered by year-to-year and interannual variability. Atlas projections point to a virtually certain warming across all sub-regions, with the largest increases taking place in the Amazon basin (NSA and SAM; Atlas.7.2.4). A consistent increase in temperature-related indices linked to several climate-sensitive sectors (e.g., growing degree days, cooling degree days) is found across CMIP5, CMIP6 and CORDEX-CORE projections, with smaller increases for cooling degree days in mid-latitude regions than in SCA and the Amazon (Coppola et al., 2021b). Daily mean temperature exceedances of a typical 21.5°C threshold for a successful incubation of disease pathogens inside many mosquito vectors (Lambrechts et al., 2011; Blanford et al., 2013; Mordecai et al., 2013, 2017) will be crossed much more frequently, potentially driving increases in the incidence of vector-borne diseases (Laporta et al., 2015; Messina et al., 2019).
Extreme heat: Chapter 11 found high confidence of increased heatwaves in all regions except SSA over the past decades. There is evidence of increasing heat stress over summer in much of SES and SWS using the wet bulb globe temperature (WBGT) index for the period 1973–2012, and this has been attributed to human influence on the climate system (Knutson and Ploshay, 2016). Climate change projections point to major increases in several heat indices across the region for all scenarios (high confidence). Largest increases in the frequency of hot days (maximum temperatures, Tx > 35°C) are projected for the Amazon basin under SSP5-8.5 with more than 200 days per year at the end of the century under SSP5-8.5 relative to 1995-2014, while such increases remain moderate (50–100 days) in SSP1-2.6. For the dangerous heat threshold of HI > 41°C, increases in frequency are similar to that in Tx > 35°C (Figure 12.4 and Figures 12.SM.1 and 12.SM.2; Coppola et al., 2021b; Schwingshackl et al., 2021).
Cold spell and frost: A decreasing frequency of cold days and nights has been observed in many sub-regions (Table 11.13). There is medium confidence (limited agreement) of a decrease in frost days in SWS, SES and SSA. Projections consistently suggest a general decrease in the frequency of cold spells and frost days in the region as indicated by several indices based on minimum temperature (Chou et al., 2014; López-Franca et al., 2016; C. Li et al., 2021). Heating degree days are consistently projected to decrease by 5 degree days per year in the Amazon region, and up to 20–30 degree days per year in NWS, SWS and SES, under RCP8.5/SSP5-8.5 by mid century (Coppola et al., 2021b).
In conclusion, it is virtually certain that warming will continue everywhere in Central and South America and there is high confidence that by the end of the century most regions will undergo extreme heat stress conditions much more often than in recent past (e.g., increase of dangerous heat with HI > 41°C, or Tx > 35°C) with more than 200 additional days per year under SSP5-8.5, while such conditions will be met typically 5 0–1 00 more days per year under SSP1-2.6 over the same regions. Cold spells and frost days will have a decreasing trend (high confidence).
12.4.4.2 Wet and Dry
Mean precipitation: The (Atlas documents diverse historical precipitation trends in the region, including a small but not significant increasing trend in SCA, a decreasing trend in south-eastern and north-eastern Brazil, and an increasing trend in SSA. Projections indicate a drying signal for SCA (medium confidence) (Coppola et al., 2014a; Nakaegawa et al., 2014), NES and SWS (high confidence) (Atlas.7.2.5) and the well-known dipole for South America, meaning increasing precipitation over subtropical regions like the Río de La Plata basin (SES) (high confidence) and decreasing precipitation in the Amazon (NSA) (medium confidence) (Chou et al., 2014; Llopart et al., 2014; Reboita et al., 2014; Sánchez et al., 2015; Teichmann et al., 2021). These features are consistent with observations (Sena et al., 2018) and are evident in regional and global model projections by mid- and end-of-century for both RCP4.5 and RCP8.5 (Jones and Carvalho, 2013).
River flood: Emerging literature in the region documents ongoing changes in river floods. Mernild et al. (2018) report decreases and increases in annual runoff west of the Andes Cordillera’s continental divide, with the greatest decreases in the number of low (<10th percentile) runoff conditions and the greatest increases in high (>90th percentile) runoff conditions. In coastal north-east Peru, extreme precipitation events recently caused devastating river floods and landslides (Son et al., 2020). In Brazil, floods are becoming more frequent and intense in wet regions but less frequent and intense in drier regions (Bartiko et al., 2019; Borges de Amorim and Chaffe, 2019), with higher propagation of hydrological changes through anthropogenically modified agricultural basins (Chagas and Chaffe, 2018). Record, catastrophic, unprecedented, and once-in-a-century flooding events have also been reported in recent decades in the tributaries of the Amazon River or along its mainstream (Sena et al., 2012; Espinoza et al., 2013; Marengo et al., 2013; Filizola et al., 2014), in Argentinean rural and urban areas (Barros et al., 2015), in the lower reaches of the Atrato, Cauca and Magdalena rivers in Colombia (Hoyos et al., 2013; Ávila et al., 2019), in basins whose mainstreams flow through important metropolitan areas such as Concepción, Chile (Rojas et al., 2017), and even in one of Earth’s driest regions, the Atacama Desert (Wilcox et al., 2016). In the Amazon basin, the significant increase in extreme flow is associated with the strengthening of the Walker circulation (Barichivich et al., 2018).
Available projections for the region show increases in river floods in SES and SAM (medium confidence). Projections indicate that SES and the coasts of Ecuador and Peru will experience a tendency towards wetter conditions that can be a proxy for longer periods of flooding and enhanced river discharges (Zaninelli et al., 2019). CORDEX models project the strongest changes for the peak flow with a return period of 100 years in SES by mid-century and under RCP8.5 (Figure 12.8). At the continental scale, on the contrary, Alfieri et al. (2017) suggest that 100-year river floods will decrease under RCP8.5. Regional projections of river floods have high uncertainty, however, owing to differences in hydrological models (low confidence) (Reyer et al., 2017a). Fábrega et al. (2013) projected increases in surface runoff for Panama, while Zulkafli et al. (2016) identified increases in 100-year floods of 7.5 and 12.0% in projections for the Peruvian Amazon wet season under RCPs 4.5 and 8.5 respectively. Wetter conditions and ±20% variations in annual mean streamflow are also projected for the Río de La Plata under the warming levels of 1.5°C, 2°C and 3°C above pre‐industrial conditions (Montroull et al., 2018). In central Chile, 50-year peak flows are expected to be greater by mid-century than 100-year peak flows observed over the reference period (Bozkurt et al., 2018).
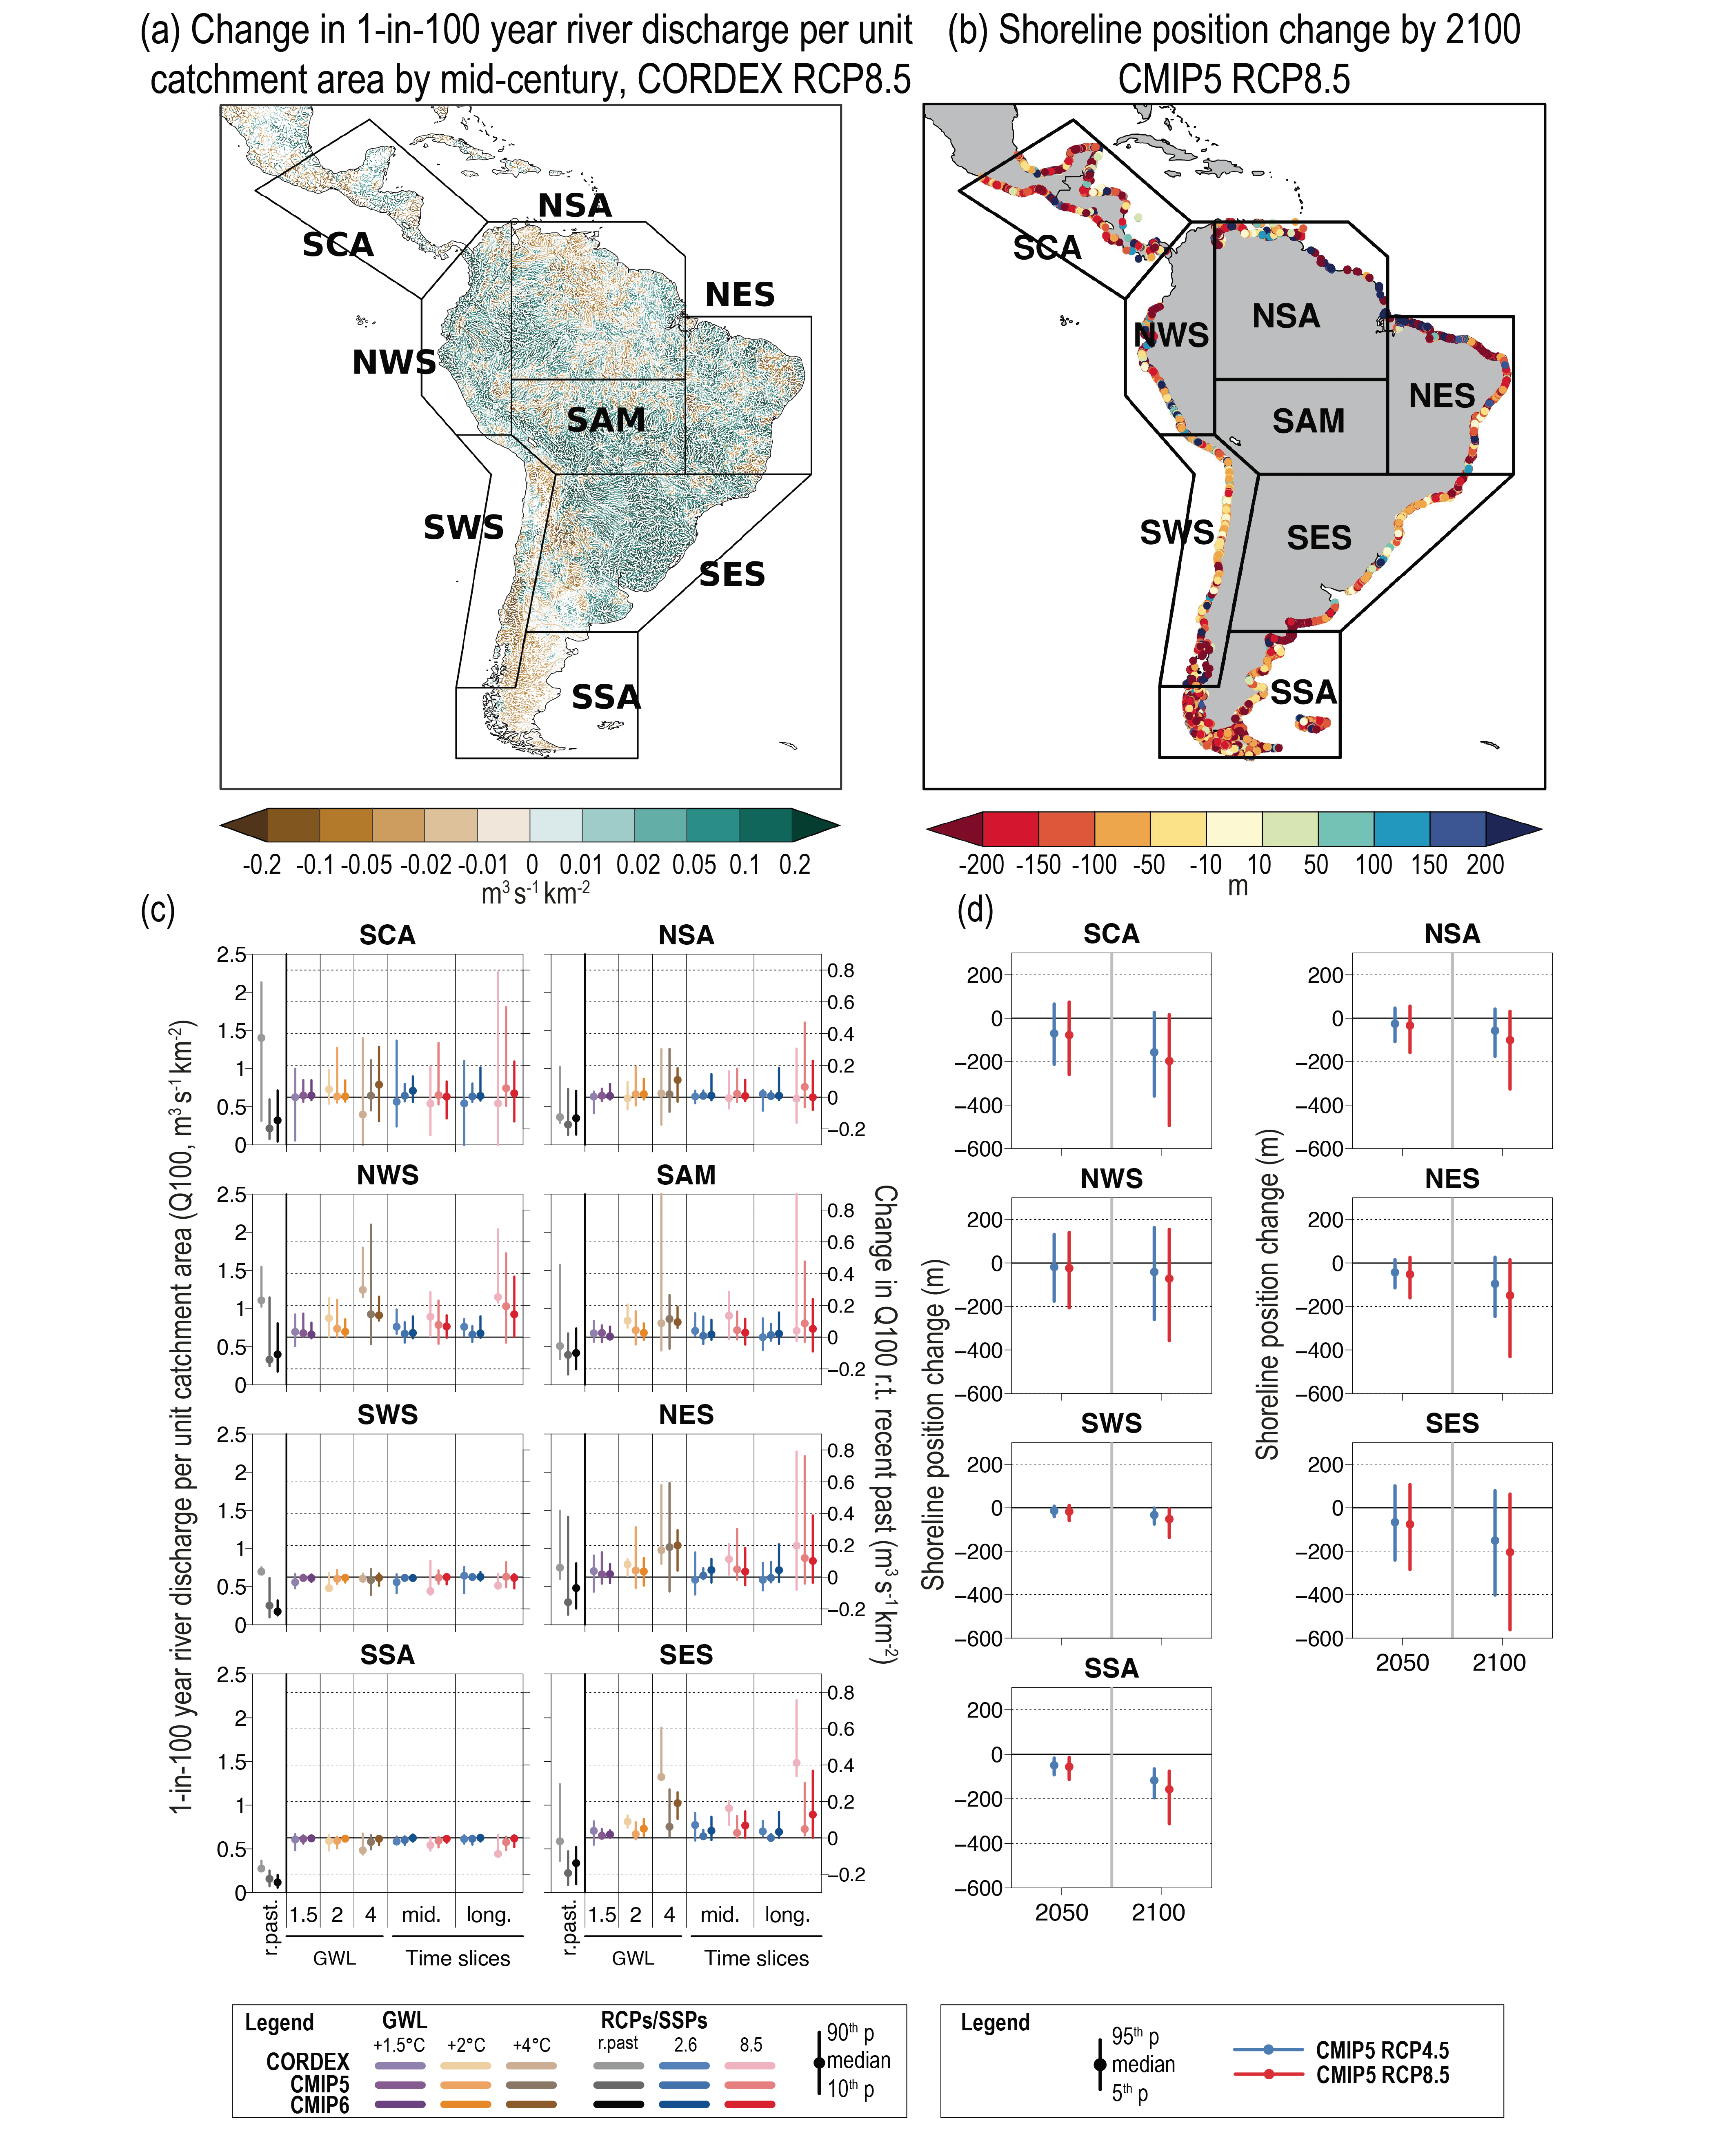 Figure 12.8 | Projected changes in selected climatic impact-driver indices for Central and South America.
 Heavy precipitation and pluvial flood: Table 11.14 indicated that there is low confidence due to limited evidence of extreme precipitation trends in almost all Central and South America, except in SES where increases in the magnitude and frequency of heavy precipitation have been observed (high confidence). In general, data scarcity persists for a representative continental assessment. Chapter 11 projections indicate low confidence of increase, compared to the modern period, in the intensity and frequency of heavy precipitation in SCA and SWS for all GWLs, and medium confidence of increase in NSA, NES, SSA, SAM and SES for GWL of 4°C. In NWS, a wide range of changes is projected (low confidence).
Landslide: Several regions in Central America, as well as Colombia and south-eastern Brazil, are considered areas of high incidence of observed fatal landslides. In these areas, El Niño–Southern Oscillation (ENSO)-driven fluctuations in rainfall amounts (Sepúlveda and Petley, 2015) and climate change (Nehren et al., 2019) seem to be key factors. Rockfalls, ice- and rock-ice avalanches, lahars and landslides have been reported frequently in the southern, extratropical Andes in the last decades (Gariano and Guzzetti, 2016). A large number of ice- and moraine-dammed lakes have consequently failed, causing floods that rank amongst the largest events ever recorded (Iribarren Anacona et al., 2015). However, published literature is largely missing for a reliable assessment of past and future trends of such hazards.
Aridity: Several regional studies suggest increasing trends in the frequency and length of droughts in the region, such as: over NWS (Domínguez-Castro et al., 2018), NSA (Marengo and Espinoza, 2016; Cunha et al., 2019) and NES (Marengo and Bernasconi, 2015), over southern Amazonia (Fu et al., 2013; Boisier et al., 2015), in the São Francisco River basin and the capital city Distrito Federal in Brazil (Borges et al., 2018; Bezerra et al., 2019), in the southern Andes (Vera and Díaz, 2015), in central southern Chile (Boisier et al., 2018), in SES (Rivera and Penalba, 2014) and, during recent years, in SSA (Rivera and Penalba, 2014). Chapter 8 indicated medium confidence of anthropogenic forcing on observed drying trends in central Chile. Additional discussion on droughts and aridity trends in South America is presented in Sections 8.3.1.6, 8.4.1.6 and 8.6.2.1.
Sections 8.3.2.4 and 8.4.1.6 point to two important drying hotspots in South America with long-term soil moisture decline and precipitation declines: the Amazon basin (SAM and NSA) and SWS (medium confidence) (Figure 12.4). End-of-century RCP8.5 projections show a longer dry season in the central part of South America and decreased precipitation over the Amazon and central Brazil (Teichmann et al., 2013; Coppola et al., 2014a; Giorgi et al., 2014; Llopart et al., 2014; Atlas.7). Seasonal changes are also projected by end century under RCP 8.5, with decreases in June–July–August (JJA) rainfall projected for NSA, the coastal region of SES, SAM and the southern portion of SWS (Marengo et al., 2016). Decreases in December –January–February (DJF) rainfall are projected for the central part of South America in the near term (Kitoh et al., 2011; Chou et al., 2014; Cabré et al., 2016). Regional projections for Central and South America also indicate an increase in dryness in SCA and NES by mid- to end-century (medium confidence) (Chou et al., 2014; Marengo and Bernasconi, 2015).
Hydrological drought: Chapter 11 assessed mostly low confidence in observed changes in hydrological droughts given a lack of studies and clear evidence, with medium confidence only for a streamflow decrease in sub-regions of SWS (Table 11.15). Some trends are becoming more clear, such as the ones reported for Colombia (NWS) by Carmona and Poveda (2014), who indicated that 62% of the 25- to 50-year-long monthly average streamflow time series exhibited significant decreasing trends. However, studies of discharge changes indicate that uncertainty is still large, as argued by Pabón-Caicedo et al. (2020) for the full extent of the Andes.
A number of studies project decreases in runoff and river discharge for SCA, Colombia, Brazil and the southern part of South America by the end of this century (Nakaegawa and Vergara, 2010; Arnell and Gosling, 2013; van Vliet et al., 2013). Section 11.9 assessed high confidence in projections of increases in hydrological droughts in NSA, SAM, SWS, and SSA under for 4°C GWL, medium confidence in SCA, and low confidence in the rest of the sub-regions given insufficient evidence, lack of signal or mixed signals among the available studies. Signals are much more uncertain for the middle of the century (or for a 2°C GWL).
Agricultural and ecological drought: Section 11.9 assessed low confidence in observed changes in agricultural and ecological drought across Central and South America due to regional heterogeneity and differences depending on the drought metrics used, except in NES, which has seen a dominant increase in drought severity (medium confidence).
NSA and SAM are the two regions where the strongest signal of increasing number of dry days (NDD) and drought frequency (DF) is projected compared to other regions of the world (Coppola et al., 2021b). By the end of this century and under RCP8.5, the NSA area average value for NDD reaches 43, 32 and 27, within the CORDEX-CORE, CMIP5 and CMIP6 ensembles respectively. For the frequency of droughts, the NSA area average value is of about 4.6, 3.4 and 3.8. For the same period and scenario, the SAM region shows NDD and DF values of 29, 20 and 21, and of 4, 3 and 3.5 respectively (Figure 12.4j–l). In Central America, a significantly drier northern region and a wetter southern region are projected for mid-century by (Hidalgo et al., 2017), whilst Fuentes-Franco et al. (2015) pointed to more pronounced dry periods during the rainy season in SCA by the end of this century under RCP8.5. Increases in the frequency of meteorological droughts that may initiate other drought types are projected for the eastern part of the Amazon and the opposite for the west under RCP8.5 (Duffy et al., 2015). In central Chile, the occurrence of extended droughts, such as the recently experienced 2010–2015 megadrought (which is still driving impacts), is projected to increase from one to up to five events per 100 years under RCP8.5 (Bozkurt et al., 2018). Section 11.9 highlights change in confidence in increases in drought severity in SCA, NSA, NES, SAM, SWS, and SSA from low to highunder the three GWLs of 1.5°C, 2°C and 4°C. NES and SES change from low confidence to medium confidence increases in agricultural and ecological drought severity by 4°C GWL with different metrics and high agreement between studies. Only SAM and SSA have projections of agricultural and ecological drought increasing with high confidence for the middle of the century, or for a 2°C GWL, and NSA, NES and SCA are projected to increase with medium confidence.
Fire weather: There is evidence of increases in forest fire activity (number of fires, burned area and fire duration) in central and south-central Chile, where more conducive fire weather conditions have been proposed as the main driver (González et al., 2018; Urrutia-Jalabert et al., 2018). Projections indicate that the Amazon will be one of the regions in the world with the highest increase in fire weather indices over the 21st century and under all RCPs (high confidence) (Betts et al., 2015; Abatzoglou et al., 2019; Q. Sun et al., 2019). This is consistent with the large increase in the frequency of joint occurrence of extreme hot and dry days projected for a 2°C warming level or more (Vogel et al., 2020). Projections of fire weather indices also show an increased risk in SWS (high confidence), SSA and SCA (medium confidence). However, wildfires highly depend on land use and appropriate management may help mitigate future increases in fire risk (Fonseca et al., 2019).
Mean precipitation is projected to change in a dipole pattern with increases in NWS and SES and decreases in NES and SWS (high confidence) with further decreases in NSA and SCA (medium confidence). There is medium confidence of an increase in river floods in SAM and SES. There is high confidence of an increase in drought duration in NES, an in the number of dry days and drought frequency in NSA and SAM. Dry climatic impact-drivers are projected to increase at the regional level with higher global warming levels. The strongest signal of future increase in agricultural and ecological drought, aridity and fire weather is over the Amazon region (high confidence).
12.4.4.3 Wind
Mean wind speed: Due to the lack of long-term homogeneous records or limited observations in the region, past wind speed trends are difficult to establish. Global climate models project an increase in wind speeds, under all future scenarios, augmenting wind power potential in most parts of Central and South America, especially in NES, where changes lie in the range 0–20% by 2050 under RCP8.5 and 0–40% under RCP8.5 (medium confidence) (Karnauskas et al., 2018a; Reboita et al., 2018; Jung and Schindler, 2019). In Patagonia, wind speeds are projected to decrease. For RCP4.5 changes remain marginal and have low confidence (low agreement) (Figure 12.4m–o).
Severe wind storm: Similar observational limitations inhibit an assessment of long-term extreme wind trends. However, Pes et al. (2017) found extreme wind increases in most of Brazil over the past decades. Future projections indicate a slight decrease in the number of extratropical cyclones in mid-latitudes (limited evidence, low confidence) (Reboita et al., 2018), and an increase of extreme winds in tropical areas (limited evidence, low confidence) (Kumar et al., 2015). Climate models project a shift and an intensification of southern storm tracks, with most effects offshore over the Southern Ocean (Chapter 4), with low confidence (low agreement) of significant extreme wind changes over land and coastal areas across the 21st century (Chang, 2017; Augusto Sanabria and Carril, 2018; Reboita et al., 2021).
Tropical cyclone: CMIP5 and CMIP6 simulations, including the new High Resolution Model Intercomparison Project (HighResMIP), project a decrease in the frequency of tropical cyclones in the Atlantic and Pacific coasts of Central America for the mid-century or under a 2°C GWL, accompanied with an increased frequency of intense cyclones (medium confidence) (Section 11.7.1.5; Diro et al., 2014; Knutson et al., 2020; Roberts et al., 2020).
In summary, there is limited evidence of current trends in observed wind speed and wind storms in Central and South America. Climate projections indicate a decrease in frequency of tropical cyclones in Central America accompanied with an increased frequency of intense cyclones, and an increase in mean wind speed and wind power potential in most parts of Central and South America (medium confidence).
12.4.4.4 Snow and Ice
Snow: Historical studies of seasonal snow cover are limited and restricted to the Andes Cordillera. Mernild et al. (2017) indicated that much of the area north of 23°S experienced a decrease in the number of snow cover days, while the southern half of the Andes Cordillera experienced the opposite. A reduction in snow cover of about 15% was simulated for areas with altitudes in the range of 3000–5000 m, whereas in regions with altitude below 1000 m (Patagonia) snow cover extent increased. The reduced snowfall over the Chilean and Argentinean Andes mountains, which has resulted in unprecedented reductions in river flow, reservoir volumes and groundwater levels, led to the most severe and long-lasting hydrological drought (2010–2015) reported in the adjacent semi-arid foothills of the central Andes (Garreaud et al., 2017; Rivera et al., 2017; Masiokas et al., 2020). Projections (based on process understanding) in Section 9.5.3.3 point to decreases in seasonal snow cover extent and duration across South America as global climate continues to warm (high confidence).
Glacier: Observation and future projection of Central and South America glacier mass changes are assessed in Section 9.5.1, grouped in two main regions: Low Latitude region (98% of which is glaciers in the Andes) and the Southern Andes region. An increase in the number and areal extent of glacial lakes in the Southern Andes was reported for the period 1986–2016 (Wilson et al., 2018). Similar changes are being observed in the central Andes (Colonia et al., 2017). Since 1800 at least 15 ice‐dammed lakes and 16 moraine‐dammed lakes have failed in the extratropical Andes, causing high-magnitude glacial lake outburst floods (Rojas et al., 2014; Cook et al., 2016; Wilson et al., 2018; Drenkhan et al., 2019). Partially due to glacier shrinkage and lake growth, the frequency of outburst floods has increased in the last 30–40 years (Carey et al., 2012; Iribarren Anacona et al., 2015).
Glaciers across South America are expected to continue to lose mass and glacier area in the coming century (high confidence) (Section 9.5). In terms of their mass, glaciers in the Low Latitude region are projected by GlacierMIP to lose 67 ± 42%, 86 ± 24% and 94 ± 13%, of their 2015 baseline mass by the end of the century under RCP2.6, RCP4.5 and RCP8.5 respectively (Marzeion et al., 2020). Glaciers in the Southern Andes show decreasing mass loss rates for RCP2.6, and increasing rates for RCP8.5, which peak in the mid to late 21st century. Glaciers in the Southern Andes are projected to lose 26 ± 27%, 33 ± 26% and 47 ± 26% of their 2015 mass by the end of the century under RCP2.6, RCP4.5 and RCP8.5 respectively (Section 9.5.1.3).
The central Andes will experience the highest disturbance to the thermal regime of the 21st century. As a consequence, in the Argentinean Andes up to 95% of rock glaciers in the southern desert Andes and in the central Andes will rest in areas above 0°C under the worst case scenario of warming (the freezing level might move up more than twice as much as during the entire Holocene; Drewes et al., 2018)
Permafrost: There is limited information on the ongoing changes and projections of permafrost conditions in the region. Based on model projections under the IPCC A1B scenario, permafrost areas in the Bolivian Andes will eventually be lost, but this could take years to decades or longer depending on permafrost thickness (Rangecroft et al., 2016).
In conclusion, glacier volume loss and permafrost thawing will continue in the Andes Cordillera under all climate scenarios (high confidence), causing important reductions in river flow and potentially high-magnitude glacial lake outburst floods.
12.4.4.5 Coastal and Oceanic
Relative sea level: Around Central and South America, over 1900–2018, a new tide gauge-based reconstruction finds a regional mean relative sea level (RSL) change of 2.07 [1.36 to 2.77] mm yr–1 in the South Atlantic, 2.49 [1.89 to 3.06] mm yr–1 in the subtropical North Atlantic and 1.20 [0.76 to 1.62] mm yr–1 in the East Pacific (Frederikse et al., 2020), compared to a global mean sea level (GMSL) change of around 1.7 mm yr–1Section 2.3.3.3 and Table 9.5). For the period 1993–2018, these RSLR rates, based on satellite altimetry, increased to 3.45 [3.04 to 3.86)] mm yr–1, 4.04 [2.77 to 5.24] mm yr–1 and 2.35 [0.70 to 4.06] mm yr–1 respectively (Frederikse et al., 2020), compared to a GMSL change of 3.25 mm yr–1Section 2.3.3.3 and Table 9.5).
Relative sea level rise is extremely likely to continue in the oceans around Central and South America. Regional mean RSLR projections for the oceans around Central and South America range from 0.3–0.5 m under SSP1-2.6 to 0.5–0.9 m under SSP5-8.5 for 2081–2100 relative to 1995–2014 (median values), which is around the projected GMSL change (Section 9.6.3.3). These RSLR projections may, however, be underestimated due to potential partial representation of land subsidence in their assessment (Section 9.6.3.2).
Coastal flood: The present-day 1-in-100-year ETWL ranges from 0.5 to 2.5 m around most of Central and South America, except in SSA and SWS, where 1-in-100-year ETWLs can be as large as 5 to 6 m (Vousdoukas et al., 2018). ETWL magnitude and occurrence frequency are expected to increase throughout the region (high confidence) (Figure 12.4p–r and Figure 12.SM.6). Across the region, the 5–95th percentile range of the 1-in-100-year ETWL is projected to increase (relative to 1980–2014) by 8–34 cm and by 10–43 cm by 2050 under RCP4.5 and RCP8.5 respectively (Vousdoukas et al., 2018; Kirezci et al., 2020). By 2100, this range is projected to be 21–93 cm and 34–190 cm under RCP4.5 and RCP8.5 respectively (Vousdoukas et al., 2018; Kirezci et al., 2020). Furthermore, under RCP4.5, the present-day 1-in-100-year ETWL is projected to have median return periods of 1-in-10-years to 1-in-50-years by 2050 and 1-in-1-year by 2100 in SES, SSA and SWS. In other regions of Central and South America, the present-day 1-in-100-year ETWL is projected to occur once per year or more by both 2050 and 2100 under RCP4.5. The present-day 1-in-50-year ETWL is projected to occur around three times a year by 2100 with a SLR of 1 m (Vitousek et al., 2017).
Coastal erosion: According to satellite data, shoreline retreat rates of around 1 m yr–1have been observed along the sandy coasts of SCA, SES and SSA over the period 1984–2015, while shoreline progradation rates of around 0.25 m yr–1has been observed in NWS and NSA. The sandy shorelines in NES and SWS have remained more or less stable over the same period (Luijendijk et al., 2018; Mentaschi et al., 2018). Using satellite observations, Mentaschi et al. (2018) report a coastal area loss of 250 km2 over a 30-year period (1984–2015) along the Pacific coast of South America, and of 780 km2 along the Atlantic coastlines.
Projections indicate that a majority of sandy coasts in the region will experience shoreline retreat throughout the 21st century (high confidence). Median shoreline change projections (CMIP5) for the mid-century period show that, relative to 2010, sandy shorelines will retreat by between 30 and 75 m in SCA, NES, SES and SSA under both RCP4.5 and RCP8.5, while the projected mid-century retreats are less than 30 m in NSA, NWS and SWS for both RCPs (Vousdoukas et al., 2020b). Parts of the coastline in these latter three regions are projected to prograde over the 21st century, if present ambient shoreline change trends continue (Vousdoukas et al., 2020b). By 2100, median retreats of more than 100 m are projected in SCA, NES, SES and SSA under both RCPs, while retreats between 50–100 m are projected for NSA, NWS and SWS under both RCPs (Figure 12.8). Notably, the projected shoreline retreats in SCA and SES approach 150 m by 2100 under RCP4.5 and 200 m under RCP8.5. The total length of sandy coasts in Central and South America that is projected to retreat by more than a median of 100 m by 2100 under RCP4.5 and RCP8.5 is about 12,000 and 15,000 km respectively, an increase of approximately 30%.
Marine heatwave: The mean sea surface temperature (SST) of the Atlantic Ocean and the Caribbean around Central and South America increased from 0.25°C to 1°C over the period 1982–1998 (Oliver et al., 2018). This mean ocean surface warming is connected to longer and more frequent marine heatwaves (MHW) in the region (Oliver et al., 2018). Over the period 1982–2016, the coastlines experienced on average more than 1.0 MHW per year, with the Pacific coast of Northern Central America and the coast of SES (Atlantic) experiencing on average 2.5–3 MHWs per year. The average duration was between 10 and 15 days, with the notable exception of the equatorial Pacific coastline, which experiences MHWs with >30 days average duration related to ENSO conditions. In the south-western Atlantic shelf (32–38°S), more than half of the days with MHWs have occurred since 2014, and the most intense event (1.7°C above previous maximum) took place in the austral summer of 2017 (Manta et al., 2018). Changes over the 20th century, derived from MHW proxies, show an increase in frequency between 0.5 and 2 MHW per decade in the South Atlantic, the Caribbean and the Pacific coast of Northern Central America, an increase in intensity per event in the South Atlantic, and a decrease along the equatorial Pacific coastline. The total number of MHW days per year increases around Central and South America, with the exception of the equatorial Pacific coastline (Oliver et al., 2018).
There is high confidence that MHWs will increase around Central and South America. Mean SST is projected to increase by 1°C (2°C) by 2100, with a hotspot of about 2°C (4°C) along the coast of South-Eastern South America and North-Western South America under RCP4.5 (RCP8.5; Interactive Atlas). More frequent MHWs are projected around the region for GWLs of 1.5°C, 2°C and 3.5°C relative to the modelled reference value for 1861–1880 (Frölicher et al., 2018). Projections for SSP1-2.6 and SSP5-8.5 both show an increase in MHWs around Central and South America by 2081–2100, relative to 1985–2014 (Box 9.2, Figure 1).
In summary, relative sea level rise is extremely likely to continue in the oceans around Central and South America, contributing to increased coastal flooding in low-lying areas (high confidence) and shoreline retreat along most sandy coasts (high confidence). Marine heatwaves are also expected to increase around the region over the 21st century (high confidence).
The assessed direction of change in climatic impact-drivers for Central and South America and associated confidence levels are illustrated in Table 12.6. No assessable literature could be found for sand and dust storm, lake and sea ice, heavy snowfall and ice storms, hail and snow avalanches, although these phenomena may be relevant in parts of the region.
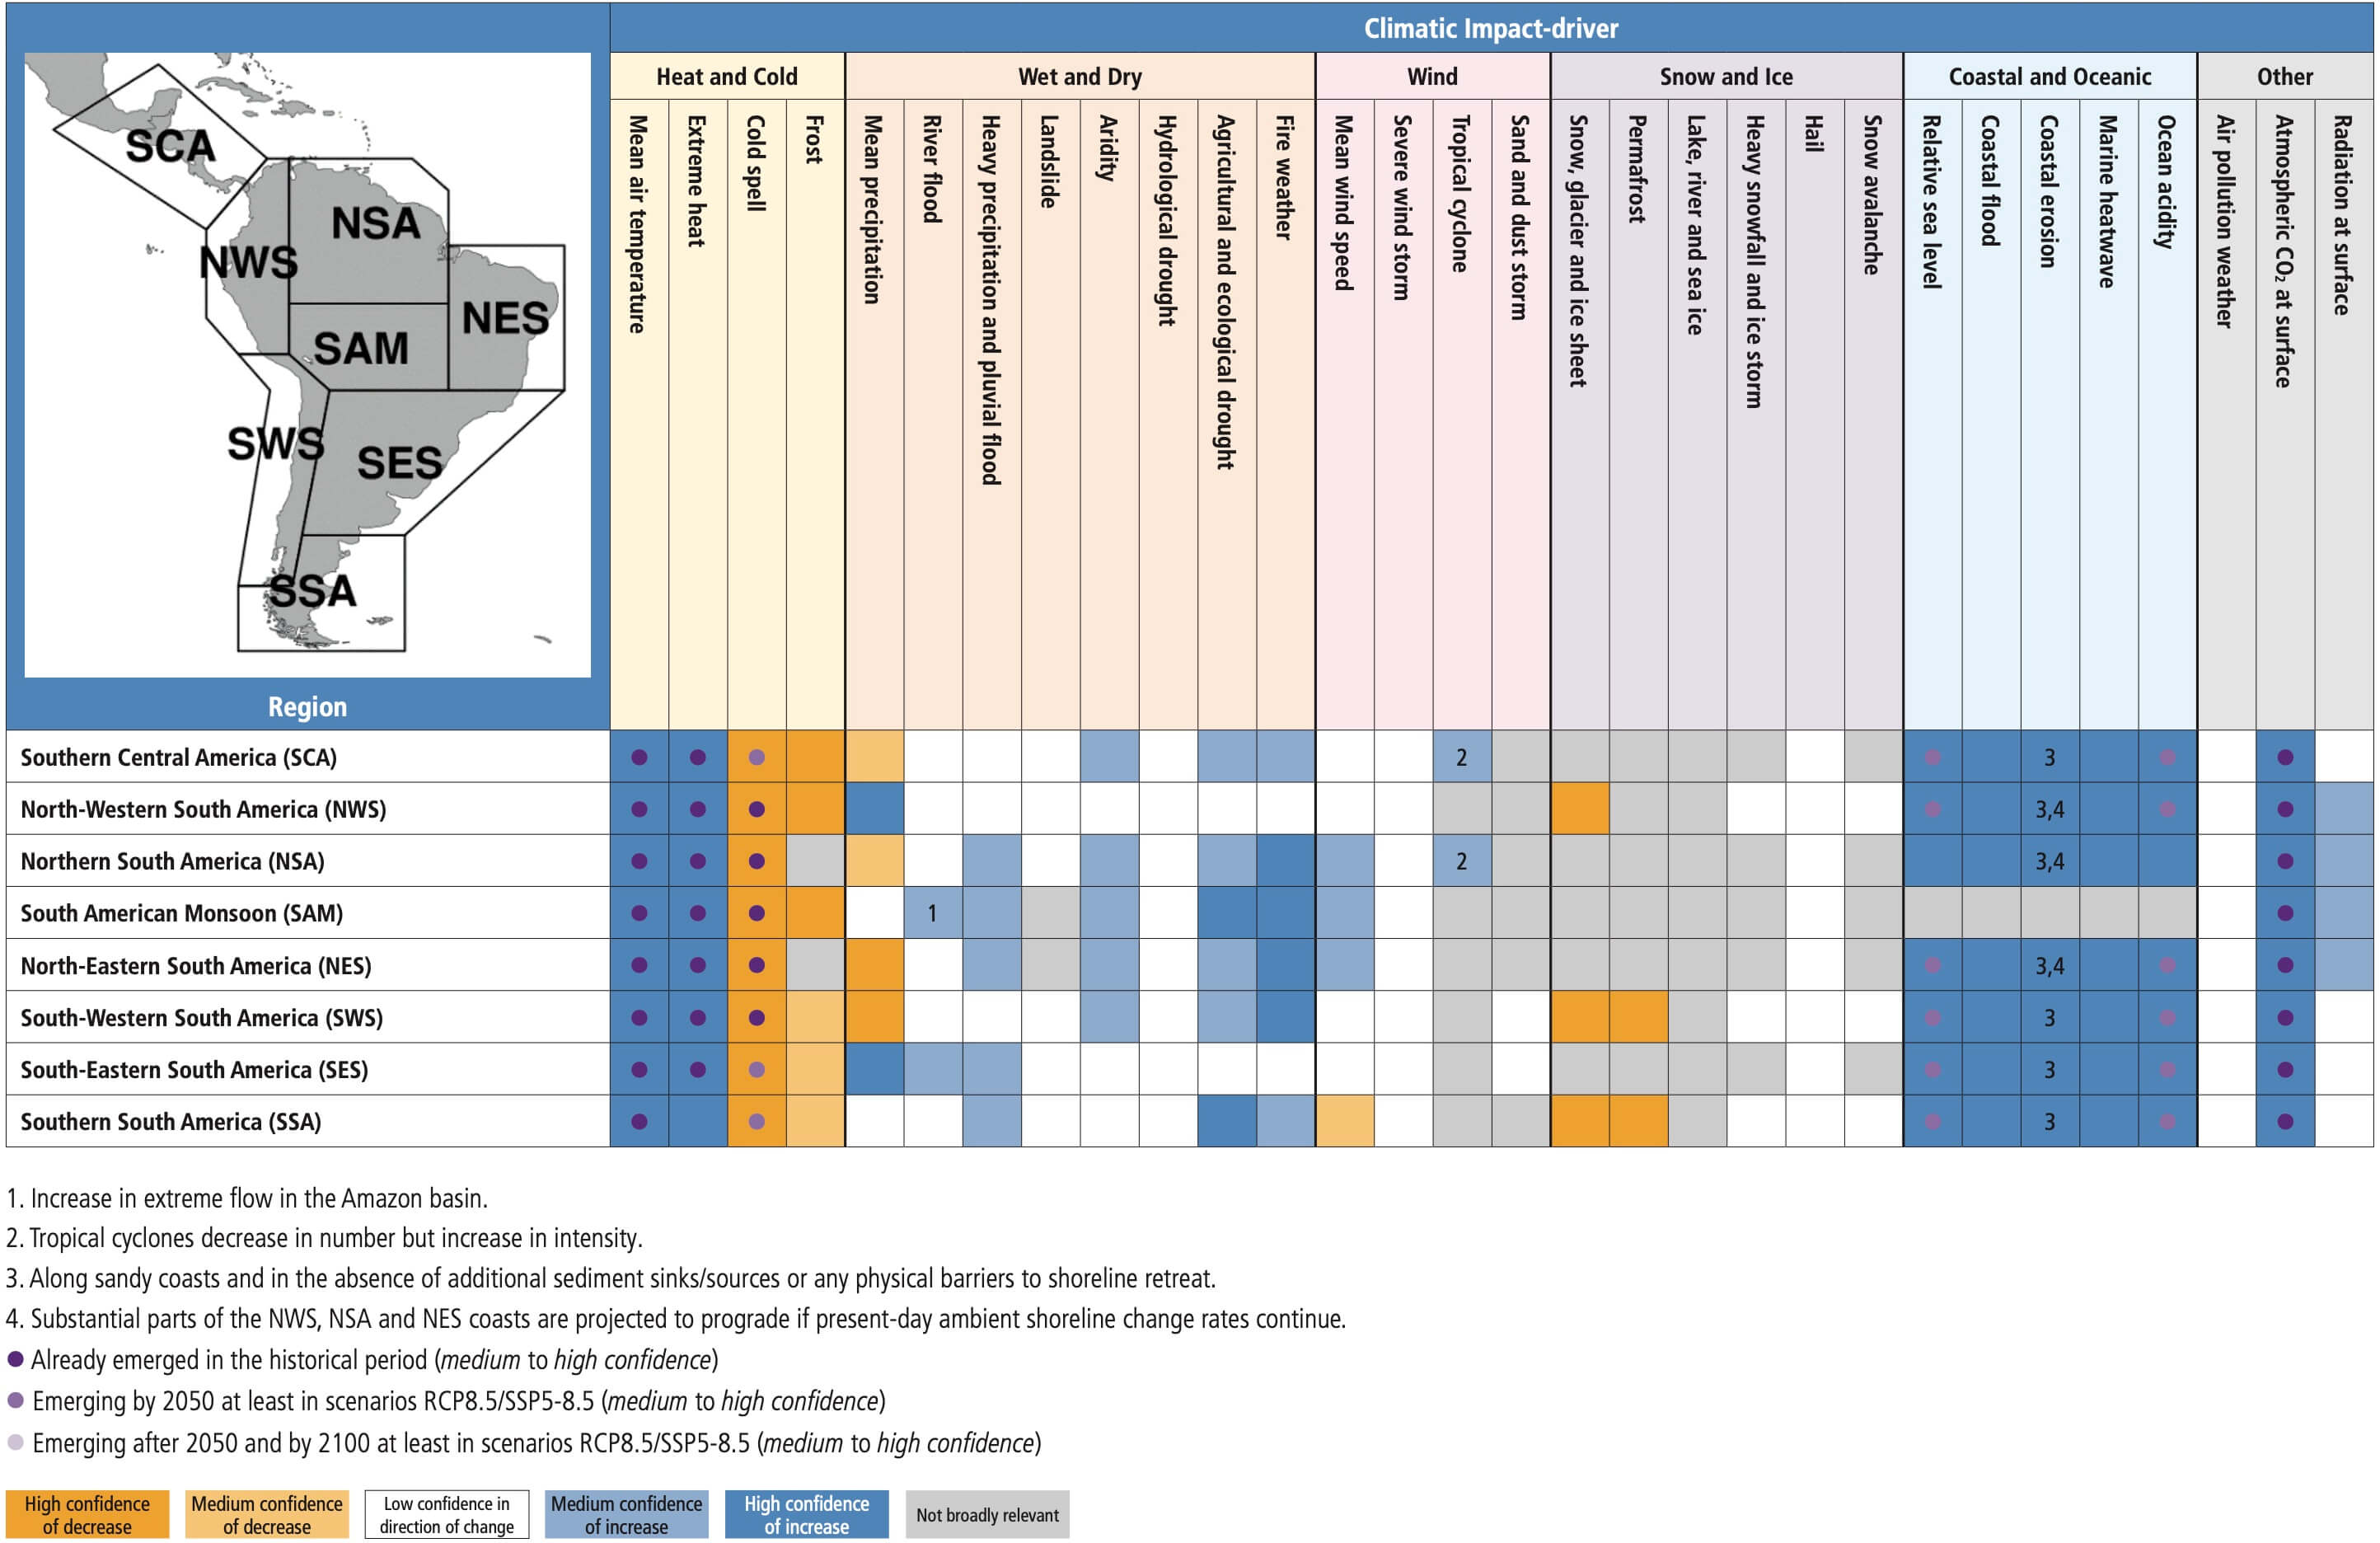
12.4.5 Europe
The regional European climate and main hazards have been previously assessed in SREX, AR5 WGII, SR1.5, SROCC and SRCCL and a summary of key findings can be found in the Europe section of Atlas.8.1. For the purpose of this assessment Europe is divided into four climatic regions: Northern Europe (NEU), Western and Central Europe (WCE), Eastern Europe (EEU) and Mediterranean (MED) (Figure Atlas.24).
Since AR5 and SR1.5, a large body of literature that uses the EURO-CORDEX and MED-CORDEX ensembles of high-resolution simulations (Jacob et al., 2014; Ruti et al., 2016; Kjellström et al., 2018; Vautard et al., 2020; Coppola et al., 2021a) to assess signals of climate change in Europe has emerged. These scenario-based simulations have been the basis of a number of impact studies (e.g., Jacob et al., 2014, 2018; Somot et al., 2018; Faggian and Decimi, 2019) highlighting the use of the climatic impact-drivers. The development of the science of attribution of weather events (Stott et al., 2016) has provided evidence of links between climate change and hazard changes such as the 2017 Mediterranean heatwave (Kew et al., 2019) and many others (Chapter 11).
The ability of global and regional models to reproduce the observed changes in mean and extreme temperature and precipitation in Europe is assessed in the literature (Atlas.8.3). In summary, both GCMs and RCMs have their limitations but, in general, the increased resolution of RCMs is shown to clearly add value in terms of resolving spatial patterns and seasonal cycles of precipitation and precipitation extremes in many European regions, especially in regions of complex topography such as the Alps and for quantities such as snowmelt-driven runoff, regional winds and Mediterranean hurricanes (Medicanes).
Examples of projected climatic impact-driver thresholds are illustrated in Figures 12.4 and 12.9 based on the most recently updated EURO-CORDEX RCM projections, CMIP5 and CMIP6 GCMs for comparison. For a more comprehensive representation of other climatic impact-driver index trends assessed in this section the reader is referred to the interactive Atlas.
12.4.5.1 Heat and Cold
Mean air temperature: Since AR5, studies have confirmed that the mean warming trend in Europe is increasing (Atlas.8.2). The observed warming trend patterns are largely consistent with those simulated by global and regional climate models and it is very likely that such trends are, in large part, due to human influence on climate (Section 3.3.1).
All temperature trends are very likely to continue for a global warming of 1.5°C or 2°C and 3°C (Atlas.8.4). Future warming leads to the exceedance of different temperature thresholds relevant for vector-borne diseases (medium confidence) (Caminade et al., 2012; Medlock et al., 2013), invasive allergens (medium confidence) (Storkey et al., 2014; Hamaoui-Laguel et al., 2015), SST thresholds in the Mediterranean (likely to exceed 20°C), or relevant for the Vibriobacteria development (Vezzulli et al., 2015). Future warming is also projected to lead to the exceedance of cooling degree day index (>22°C) thresholds, characterizing a potential increase in energy demand for cooling in southern Europe with increases likely exceeding 40% in some areas (Spinoni et al., 2015) by 2050 under RCP8.5 (high confidence) (Section 12.3 and Atlas.8; Coppola et al., 2021a).
Extreme heat: The frequency of heatwaves observed in Europe has very likely increased in recent decades due to human-induced change in atmospheric composition (Section 11.3) and a detectable anthropogenic increase in a summer heat stress index over all regions of Europe has been identified based on WBGT index trends for 1973–2012 (medium confidence, limited evidence) (Knutson and Ploshay, 2016).
It is very likely that the frequency of heatwaves will increase during the 21st century regardless of the emissions scenario in each European region, and for 1.5°C and 2°C GWLs (Section 11.3.5). Heat stress due to both high temperature and humidity, affecting morbidity, mortality and labour capacity (Section 12.3) is projected to increase under all emissions scenarios and GWLs by the middle of the century (Figure 12.4a–f). Under RCP8.5, the expected number of days with WBGT higher than 31°C is about 25, 30 and 40 days per year, as projected by EURO-CORDEX, CMIP5 and CMIP6 respectively on average over the Mediterranean region, and around 30, 40 and 60 days per year in low coastal plain areas such as the Po Valley, the Italian, Greek and Spanish coasts, and the Mediterranean islands (Coppola et al., 2021a). An average increase of a few days per year of maximum daily temperature exceeding 35°C, a typical critical threshold for crop productivity, is expected by the mid-century in central Europe, and an increase of 10–20 days is expected for the Mediterranean areas (Figure 12.4b; Coppola et al., 2021a). By contrast, under SSP1-2.6, the increase in this number of days remains limited to less than about 10 days, and confined to the Mediterranean regions. Mitigation is expected to have a strong effect, with the dangerous heat threshold of HI > 41°C projected to be crossed 5–10 days more per year in the Mediterranean regions and a few days per year more in WCE and EEU under SSP5-8.5, while such increases would be virtually absent under SSP1-2.6 (Figure 12.4d–f).
Cold spell and frost: Temperature observations for winter cold spells in Europe show a long-term decreasing frequency (Brunner et al., 2018), with their probability of occurrence projected to decrease in the future (high confidence) and virtually disappear by the end of the century (Section 11.3). The frequency of frost days will very likely decrease for all scenarios and all time horizons (Lindner et al., 2014; Coppola et al., 2021a) with consequences for agriculture and forests. A simple heating degree day index, characterizing heating demand, shows a large observed decreasing trend for winter heating energy demand in Europe (Spinoni et al., 2015). This trend is very likely to continue through the 21st century, with decreases in the range of 20–30% for Northern Europe, about 20% for central Europe and 35% for southern Europe, by mid-century under RCP8.5 (Spinoni et al., 2018b; Coppola et al., 2021a; Interactive Atlas).
In summary, irrespective of the scenario, it is virtually certain that warming will continue in Europe, and there is high confidence that the observed increase in heat extremes is due to human activities. It is very likely that the frequency of heat extremes will increase over the 21st century with an increasing gradient toward the southern regions. Extreme heat will exceed critical thresholds for health, agriculture and other sectors more frequently (high confidence), with strong differences between mitigation scenarios. It is very likely that the frequency of cold spells and frost days will keep decreasing over the course of this century and it is likely that cold spells will virtually disappear towards the end of the century.
12.4.5.2 Wet and Dry
Mean precipitation: Precipitation has generally increased in northern Europe and decreased in southern Europe, especially in winter (Fischer and Knutti, 2016; Knutson and Zeng, 2018) but in the latter, precipitation trends are strongly dependent on the examined period (Atlas.8). These trends in precipitation increases in the north and decreases in the south are also represented by global and regional climate simulations (Jacob et al., 2014; Rajczak and Schär, 2017; Lionello and Scarascia, 2018; Coppola et al., 2021a; Atlas.8.2) and have been attributed to climate change (Sections 3.3.2, 8.3.1).
Studies since AR5, together with EURO-CORDEX and MED-CORDEX experiments and the latest CMIP6 ensemble, have increased confidence in regional projections of mean and extreme precipitation (Prein et al., 2016) despite their wet bias, and show that it is very likely that precipitation will increase in Northern Europe in DJF and decrease in the Mediterranean in JJA under all climate scenarios except RCP2.6/SSP1-2.6 and for both mid- and end-century periods (Coppola et al., 2021a; Atlas.8.5).
River flood: There is high confidence of an observed increasing trend of river floods in Western and Central Europe (WCE) and medium confidence of a decrease in Northern (NEU) and southern Europe (MED).
The SR1.5 shows evidence of an increase in reported floods in the UK over the period 1884–2013, and increasing trends in annual maximum daily streamflow data over 1966–2005 in parts of Europe. Although high flow does not show uniform trends for the entire region (Hall et al., 2014; Mediero et al., 2015) or specific regions (Mudersbach et al., 2017; Vicente-Serrano et al., 2017; Tramblay et al., 2019), regional patterns of significant flood trends do exist. Based on the most extended river flow database spanning the period 1960–2010, an increase in floods frequency in north-western Europe, decreasing in medium and large catchments in southern Europe and decreasing floods in Eastern Europe has been detected (Blöschl et al., 2019) in line with Mediero et al. (2014), Arheimer and Lindström (2015), Gudmundsson et al. (2017), Krysanova et al. (2017), Kundzewicz et al. (2018) and Mangini et al. (2018).
There is high confidence of river floods increasing in Western and Central Europe (WCE) and medium confidence of a decrease in Northern (NEU), Eastern (EEU) and southern Europe (MED) for mid- and end-century under RCP8.5 and low confidence under RCP2.6. The projected increase in WCE is roughly 10% (18% by end of century) and the projected decrease in NEU is 5% (11% by end of century) for the peak flow with a return period of 100 years for mid-century, under RCP8.5 (Di Sante et al., 2021; Figure 12.9a for mid-century (Q100) projections of flood discharges per unit catchment area (Blöschl et al., 2019) based on EURO-CORDEX models).
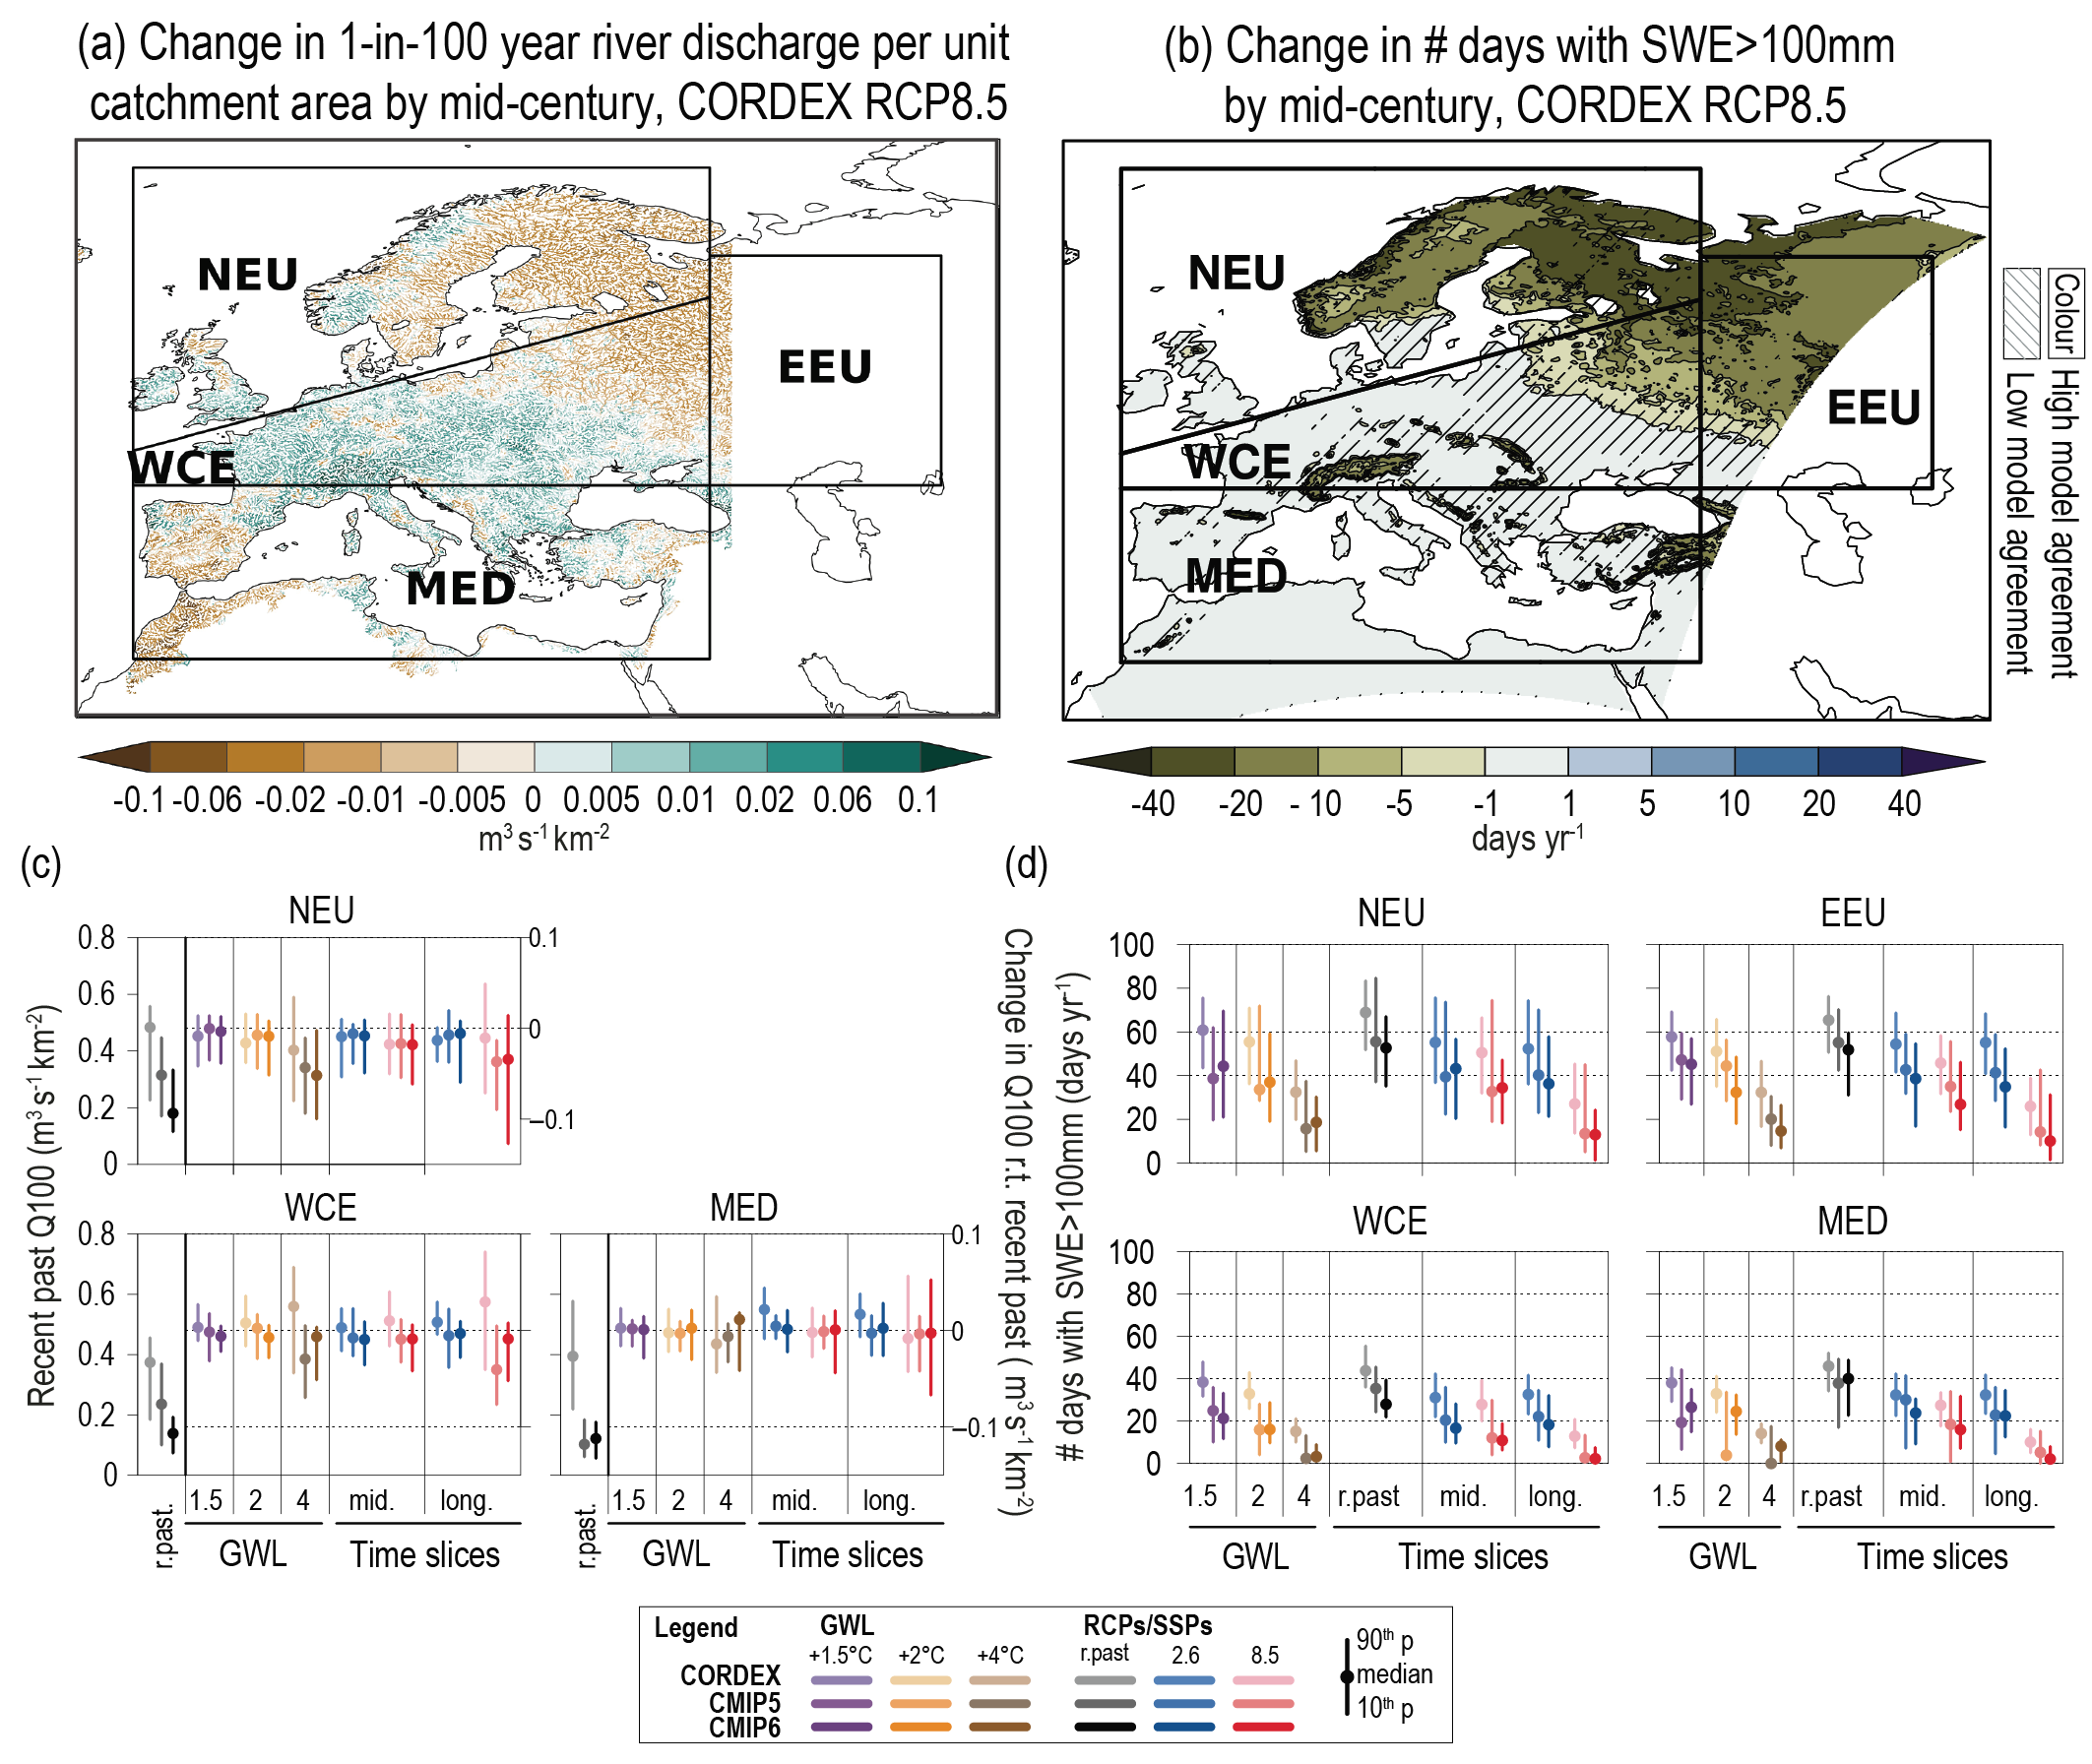 Figure 12.9 | Projected changes in selected climatic impact-driver indices for Europe. (a) Mean change in 1-in-100-year river discharge per unit catchment area (Q100, m3s–1km–2), and (b) median change in the number of days with snow water equivalent (SWE) over 100 mm (from November to March), from EURO-CORDEX models for 2041–2060 relative to 1995–2014 and RCP8.5. Diagonal lines indicate where less than 80% of models agree on the sign (direction) of change. (c) Bar plots for Q100 (m3s–1km–2) averaged over land areas for the AR6 WGI Reference Regions (defined in Chapter 1). The left-hand column within each panel (associated with the left-hand y-axis) shows the ‘recent past’ (1995–2014) Q100 absolute values in grey shades. The other columns (associated with the right-hand y-axis) show the Q100 changes relative to the recent past values for two time periods (‘mid’ 2041–2060 and ‘long’ 2081–2100) and for three global warming levels (defined relative to the pre-industrial period 1850–1900): 1.5°C (purple), 2°C (yellow) and 4°C (brown). The bars show the median (dots) and the 10–90th percentile range of model ensemble values across each model ensemble. CMIP6 is shown by the darkest colours, CMIP5 by medium, and CORDEX by light. SSP5-8.5/RCP8.5 is shown in red and SSP1-2.6/RCP2.6 in blue. (d) As for (c) but showing absolute values for number of days with SWE > 100mm, masked to grid cells with at least 14 such days in the recent past. See Technical (Annex VI for details of indices. Further details on data sources and processing are available in the chapter data table (Table 12.SM.1).
 Using frequency analysis of extreme peak flow events above a 100-year return period as a threshold, which is the average protection level of the European river network (Rojas et al., 2013), Alfieri et al. (2017) and Alfieri et al. (2015) show that Europe is one of the regions where the largest increases in flood risk may occur, with only few countries in Eastern Europe showing a decrease (Poland, Lithuania, Belarus) (Osuch et al., 2017). They find a significant increase of events with peak discharge above 100-year return period (Q100) in most of Europe in line with Rojas et al. (2012), Hirabayashi et al. (2013), Dankers et al. (2014), Forzieri et al. (2016), Roudier et al. (2016), Thober et al. (2018), and an increase in the magnitude of floods in southern Europe, although Giuntoli et al. (2015) projects no change. A modest but significant decrease in the 100-year return period river flood is projected for southern (due to reduction of precipitation) and north-eastern European regions, the latter because of the strong reduction in snowmelt induced river floods (Thober et al., 2018; Di Sante et al., 2021).
Heavy precipitation and pluvial flood: Heavy precipitation frequency trends have been detected in Europe with high confidence for the NEU and Alpine regions and with medium confidence in WCE, and also attributed to climate change with high confidence in NEU (Section 11.9). Guerreiro et al. (2017), based on observations, showed that 20% of city areas in WCE and MED regions are affected by pluvial flooding and less than 10% of city areas in the northern and western coastal cities.
Projections based on multiple lines of evidence from global to convective permitting model scales show high confidence in extreme precipitation increase in the northern, central and eastern European regions (NEU, WCE, EEU) and in the Alpine area. Increases with medium confidence are projected for the Mediterranean basin (with a negative gradient towards the south) for mid- and end-century under RCP4.5, RCP8.5 and SSP5-8.5 and for 2°C GWL and higher (Section 11.9; MedECC, 2020).
Landslide: Rainfall periods connected to landslides are projected to increase in central Europe by up to one more period per year in flat areas in low altitudes and by up to 14 more periods per year at higher altitudes by mid-century, becoming even more evident by the end of the century (Schlögl and Matulla, 2018). An increase of landslides by up to 45.7% and 21.2% is projected for southern Italy (Calabria region) by mid-century under both RCP4.5 and RCP8.5 (Gariano and Guzzetti, 2016) and by up to 40% in central Italy (Umbria) during the winter season (Ciabatta et al., 2016). A decrease of landslides is projected in the Peloritani mountains in southern Italy (RCP4.5 and 8.5) by mid-century (Peres and Cancelliere, 2018). A slight increase for a 10-year return period landslide is projected in the eastern Carpathians, the Moldavian Subcarpathians and the northern part of the Moldavian Tableland and a higher increase in the 100-year return period event is projected in the western hilly and plateau areas of Romania (Jurchescu et al., 2017).
Aridity: The Mediterranean region shows evidence of large-scale decreasing precipitation trends over 1901–2010, which are at least partly attributable to anthropogenic forcing according to CMIP5 models (Knutson and Zeng, 2018). Nevertheless, there is low agreement among studies on observed precipitation trend in the Mediterranean region (Section 11.9.4 and Atlas.8.2).
Precipitation is projected to decrease by mid- and end-century for the RCP8.5 and SSP5-8.5 with strong agreement among CMIP5, CMIP6 and CORDEX regional climate ensemble models on the direction of change. With both temperature increase and precipitation decrease there is high confidence on increased aridity in the MED region (Sections 8.4.1.6 and 11.9.4 and Atlas.8.2; Coppola et al., 2021a). In NEU there is high confidence of decrease in aridity linked to mean precipitation increase (Section 8.4.1.6, Atlas 8.2) and meteorological drought decrease based on indicators like Standardized Precipitation Index and consecutive dry days (Section 11.9.4, Figure 12.4, Coppola et al,, 2021a).
Hydrological drought: There is high confidence that hydrological droughts have increased in the Mediterranean basin with medium confidence in anthropogenic attribution of the signal, and high confidence that they will continue to increase through the 21st century for 2°C GWL and higher and all scenarios except RCP2.6/SSP1-2.6. (Sections 8.3.1.6, 8,4.1.6, and 11.9.4). There is medium confidence in hydrological drought increase in WCE and low confidence in direction of change for EEU and NEU from mid-century onwards and for 2°C GWL and higher and all scenarios except RCP2.6/SSP1-2.6 (Section 11.9 and Figure 12.4g–i).
Streamflow droughts are projected to become more severe and persistent in the Mediterranean and western Europe (current 100-year events could occur approximately every 2–5 years by 2080; Forzieri et al., 2016).
The opposite tendency is projected in Northern, Eastern and central Europe where higher precipitation that outweighs the effects of increased evapotranspiration is expected to result in a decrease in streamflow drought frequency (Forzieri et al., 2014). For a 2°C GWL droughts will become more intense in the MED and in France and longer mainly due to less rainfall and higher evapotranspiration. A reduction of drought length and magnitude is projected for NEU and EEU (Roudier et al., 2016). In the southern Alps, both winter and summer low flows are projected to be more severe, with a 25% decrease in the 2050s (Vidal et al., 2016).
Agricultural and ecological drought: There is medium confidence that agricultural and ecologicaldroughts have increased in Western and Central Europe and in the Mediterranean region, and medium confidence that anthropogenic drivers contributed to the Mediterranean increase (Sections 8.3.1.6 and 11.9).
(Chapter 11 assesses that agricultural and ecological droughts will increase in the Mediterranean regions (high confidence) and Western and Central Europe (medium confidence) by mid-century and with high confidence by the end of the century for the MED for 2°C GWL and higher and all scenarios except RCP2.6/SSP1-2.6 (Section 11.9.4). Low confidence in direction of change is assessed for EEU and NEU under all scenarios and global warming levels (Figure 12.4k).
Recent local studies provide additional risk-relevant context to changes in European drought. Agricultural and ecologicaldrought conditions are expected to intensify in southern Europe by end-of-century based on the 12-month rainfall Drought Severity Index (a soil moisture indicator), precipitation deficit SPI and SPEI indices. There will be regions in southern Europe where this type of drought could be up to 14 times worse than the worst drought in the historical period (Guerreiro et al., 2018). One-in-10-year drought events are projected to happen every second year (Mora et al., 2018; Ruosteenoja et al., 2018). The Mediterranean region will have 100 additional stress years (years with three consecutive months of precipitation deficits greater than 25%; Giorgi et al., 2018); an increase of both drought frequency (up to two events per decade) and severity (Spinoni et al., 2014, 2020) and an increase of consecutive dry days in the southern part of the MED region (Lionello and Scarascia, 2020). In contrast, droughts are expected to decrease in winter in Northern Europe (Section 11.9; Spinoni et al., 2018a). These findings are confirmed by the EURO-CORDEX, CMIP5 and CMIP6 ensemble that show a change of frequency of drought events in the MED between 2–3 events per decade by mid-century for scenario RCP8.5 (Figure 12.SM.3; Coppola et al., 2021a).
Fire weather: Fire weather conditions have been increasing since about 1980 over a few regions in Europe including Mediterranean areas (low confidence) (Venäläinen et al., 2014; Urbieta et al., 2019; Barbero et al., 2020; Giannaros et al., 2021). However, beyond a few studies, evidence is largely missing on attribution of these trends to anthropogenic climate change (Forzieri et al., 2016). An increase in fire weather is projected for most of Europe, especially western, eastern and central regions, by 2080 (current 100-year events will occur every 5–50 years), with a progressive increase in confidence and model agreement along the 21st century (medium confidence) (Forzieri et al., 2016; Abatzoglou et al., 2019). With increased drying and heat combined, in Mediterranean areas, an increase in fire weather indices is projected under RCP4.5 and RCP8.5, or SRES A1B, as early as by mid-century (high confidence) (Bedia et al., 2014; Abatzoglou et al., 2019; Dupuy et al., 2020; Fargeon et al., 2020; Ruffault et al., 2020) and an increase in burned area of 40% and 100% for a 2°C and 3°C GWL, respectively (Turco et al., 2018).
In summary, there is high confidence that river floods will increase in central and Western Europe and medium confidence that they will decrease in Northern, Eastern and southern Europe, for mid- and end of century under RCP8.5 and with low confidence under RCP2.6. There is high confidence that aridity will increase by mid- and end-century under the RCP8.5 and SSP5-8.5, and high confidence that agricultural, ecological and hydrological droughts will increase in the Mediterranean region by mid- and far end of century under all RCPs except RCP2.6/SSP1-2.6 and also for 2°C and higher GWLs. There is high confidence in fire weather increase in the Mediterranean region.
12.4.5.3 Wind
Mean wind speed: Mean surface wind speeds have decreased in Europe as in many other areas of the Northern Hemisphere over the past four decades (medium confidence) (AR5 WGI), with a reversal to an increasing trend in the last decade (low confidence) that is, however, not fully consistent across studies (Tian et al., 2019; Zeng et al., 2019; Z. Zhang et al., 2019; Deng et al., 2021; see Section 2.3.1.4.4). Re-analyses also show declining winds in Europe (Deng et al., 2021) with large interdecadal variability (Laurila et al., 2021). The declining trend has induced a corresponding decline in wind power potential indices across Europe (low confidence) (Tian et al., 2019). However, there is low agreement and limited evidence that climate model historical trends are consistent with observed trends (Tian et al., 2019; Deng et al., 2021). Several factors have been attributed to these trends, including forest growth, urbanization, local changes in wind measurement exposure and aerosols (Bichet et al., 2012), as well as natural variability (Zeng et al., 2019).
Due to changes in mean surface wind speed patterns (C. Li et al., 2018) and the poleward shift of the North Atlantic jet stream exit, mean surface wind speeds are projected to decrease in the Mediterranean areas under RCP4.5 and RCP8.5 by the middle of the century and beyond, or for GWLs of 2°C and higher (high confidence), with a subsequent decrease in wind power potential (medium confidence) (Hueging et al., 2013; Tobin et al., 2015, 2018; Davy et al., 2018; Karnauskas et al., 2018a; Kjellström et al., 2018; Moemken et al., 2018; Figure 12.4). However, sub-regional patterns of change are shown in regional climate models, such as an increase in wind speeds in the Aegean Sea and in the northern Adriatic Sea, where a reduction of Bora events and an increase of Scirocco events are projected for mid-century and beyond under RCP4.5 and RCP8.5 (medium confidence) (Tobin et al., 2016; Davy et al., 2018; Belušić Vozila et al., 2019). Projections (as cited above) also indicate a decrease in mean wind speed in Northern Europe (medium confidence, medium agreement) (Karnauskas et al., 2018a; Tobin et al., 2018; Jung and Schindler, 2019). Daily and interannual wind variability is projected to increase under RCP8.5 only in Northern Europe (low confidence) (Moemken et al., 2018), which can influence electrical grid management and wind energy production (low confidence). Wind speeds are projected to shift towards more frequent occurrences below thresholds inhibiting wind power production (Weber et al., 2018). Wind stagnation events may become more frequent in future climate scenarios in some areas of Europe in the second half of the 21st century (Horton et al., 2014; Vautard et al., 2018), with potential consequences on air quality (low confidence).
Severe wind storm: There are large uncertainties in past evolutions of windstorms and extreme winds in Europe. Extreme near-surface winds have been decreasing in the past decades (Smits et al., 2005; Tian et al., 2019; Vautard et al., 2019) according to near-surface observations. Significant negative trends of cyclone frequency in spring and positive trends in summer have been found in the Mediterranean basin for the period 1979–2008 (Lionello et al., 2016). By contrast increasing trends have been found in Arctic Ocean areas (Wickström et al., 2020). These trends are not associated with significant trends in extratropical cyclones (Sections 8.3.2.8 and 11.7.2).
There is medium confidence that serial clustering of storms, inducing cumulated economic losses, in future climate will increase in many areas in Europe under climate projections over Europe (Karremann et al., 2014; Economou et al., 2015). Strong winds and extratropical storms are projected to have a slightly increasing frequency and amplitude in the future in northern, western and Central Europe (Outten and Esau, 2013; Feser et al., 2015; Forzieri et al., 2016; Mölter et al., 2016; Ruosteenoja et al., 2019a; Vautard et al., 2019) under RCP8.5 and SRES A1B by the end of the century (medium confidence), as well as off the European coasts (Martínez-Alvarado et al., 2018) due to the increase of intensity of extratropical storms at a 2°C GWL or above (Zappa et al., 2013) in these areas. The frequency of storms, including Medicanes, is projected to decrease in Mediterranean regions, and their intensities are projected to increase, by the middle of the century and beyond for SRES A1B, A2 and RCP8.5 (medium confidence) (Nissen et al., 2014; Feser et al., 2015; Forzieri et al., 2016; Mölter et al., 2016; Tous et al., 2016; Romera et al., 2017; González-Alemán et al., 2019; MedECC, 2020; Chapter 11).
Projections of smaller-scale hazard phenomena such as tornadoes, wind gusts, hail storms and lightning are currently not directly available partly due to the inability of climate models to simulate such phenomena. Observational networks for such phenomena usually lack homogeneity over long periods, hindering clear trends to be detected. For instance, while no robust trends have been identified (Hermida et al., 2015; Mohr et al., 2015a; Burcea et al., 2016; Ćurić and Janc, 2016), hail storm environments (favourable atmospheric configurations) have increased in frequency (low confidence, limited evidence) (Sanchez et al., 2017). In future climate periods it is more likely than not that severe convection environments will become more frequent by the end of the century under RCP8.5 (Mohr et al., 2015b; Púčik et al., 2017), and there is medium confidence that such environments will become more frequent by the 2050s in RCP4.5. There is no evidence for changes in tornado frequencies in Europe in the observations (Groenemeijer and Kühne, 2014) as well as in future climate projections. Insufficient observational record length for lightning numbers does not allow an assessment of trends.
There is high confidence that mean wind speeds will decrease in Mediterranean areas and medium confidence of such decreases in Northern Europe for global warming levels of 2°C or more and beyond the middle of the century. A slightly increased frequency and amplitude of extratropical cyclones, strong winds and extratropical storms is projected for northern, central and western Europe by the middle of the century and beyond and for global warming levels of 2°C or higher (medium confidence). The frequency of Medicanes is projected to decrease (medium confidence), but their intensity is projected to increase by mid century and beyond and for global warming levels of 2°C or more. Proxies of intense convection indicate that the large-scale conditions conducive to severe convection will tend to increase in the future climate (low confidence).
12.4.5.4 Snow and Ice
Snow: Widespread and accelerated declines in snow depth (Fontrodona Bach et al., 2018) and snow water equivalent (Marty et al., 2017a; see Figure 12.9b) have been observed in Europe. In the Pyrenees a slow snow cover decline has been observed starting from the industrial period with a sharp increase since 1955 (López-Moreno et al., 2020). Under the RCP2.6, RCP4.5 and RCP8.5 scenarios the reliability elevation for snowmaking will rise by 200–300 m in the Alps and 400–600 m in the Pyrenees by mid-century. End of century projections of natural snow conditions are highly dependent on the scenario, being stationary for the RCP2.6 and continuously decreasing under RCP8.5 to not have any more natural snow conditions at any of the locations in the French Alps and Pyrenees (Spandre et al., 2019). Similarly Norway and Austria will also see a rising of the natural snow elevation with consequences for the ski season (Scott et al., 2020; Steiger and Scott, 2020). In the Alps, recent simulations project a reduction in snow water equivalent (SWE) at 1500 m above sea level of 80–90% by 2100 under the A1B scenario and a snow season that would start 2-4 weeks later and end 5-10 weeks earlier than the 1992–2012 average (Schmucki et al., 2015), which is equivalent to a shift in elevation of about 700 m (Marty et al., 2017b). For elevations above 3000 m above sea level, a decline in SWE of at least 10% is expected by the end of the century even when assuming the largest projected precipitation increase. Similar trends are observed for the Pyrenees and Scandinavia (López-Moreno et al., 2009; Räisänen and Eklund, 2012). For the northern French Alps above 1500 m and the Ötztal locations in the Austrian alps SWE has a similar decreasing trend altitudinally dependent for RCP2.6, RCP4.5 and RCP8.5 until mid-century and with significant differentiation among them in the second half of the century up to snow-free conditions under RCP8.5 (Hanzer et al., 2018; Verfaillie et al., 2018).
Glacier: Observations and future projections of European glacier mass changes are assessed in Section 9.5.1 grouped in two main regions: Scandinavia and central Europe regions. It is virtually certain that glaciers will shrink in the future and there is medium confidence in the timing and mass change rates (Section 9.5.1). Central Europe is one of the regions where glaciers are projected to lose substantial mass even under low-emissions scenarios (Section 9.5.1.3; MedECC, 2020). GlacierMIP projections indicate that glaciers in the central Europe region will lose 63 ± 31%, 80 ± 22% and 93 ± 13% of their 2015 mass by the end of the century under RCP2.6, RCP4.5 and RCP8.5 respectively (Marzeion et al., 2020). For the same scenarios, glaciers in Scandinavia are projected to lose 55 ± 33%, 66 ± 34% and 82 ± 24% of their 2015 mass. The virtually certainshrink in glaciers is bolstered by RCM simulations from the EURO-CORDEX ensemble, with the Global Glacier Evolution Model (GloGEM) indicating a substantial reduction of glacier ice volumes in the European Alps by 2050 (47–52% with respect to 2017 for RCP2.6, RCP4.5 and RCP8.5). Under RCP2.6, about two-thirds (63 ± 11%) of the present-day (2017) ice volume is projected to be lost by 2100. In contrast, under the strong warming of RCP8.5, glaciers in the European Alps are projected to largely disappear by 2100 (94 ± 4% volume loss compared to 2017; Zekollari et al., 2019).
Permafrost: In Europe, permafrost is found in high mountains and in Scandinavia, as well as in Arctic Islands (e.g., Iceland, Novaya Zemlia or Svalbard). In recent decades permafrost has been lost (Section 9.5.2) and accelerated warming at high altitudes and latitudes has favoured an increase of permafrost temperatures of the order of 0.2 ± 0.1°C between 2007 and 2016 (Romanovsky et al., 2018; Noetzli et al., 2019). Over the 21st century, permafrost is very likely to undergo increasing thaw and degradation under all scenarios (Hock et al., 2019) and it is virtually certain that permafrost extent and volume will decrease with increase of global warming (Section 9.5.2).
Permafrost thawing is projected to affect the frequency and magnitude of high-mountain mass wasting processes (Stoffel and Huggel, 2012). The temporal frequency of periglacial debris flows in the Alps is unlikely to change significantly by the mid-21st century but is likely to decrease during the second part of the century under the A1B scenario, especially in summer (Stoffel et al., 2011, 2014). There is medium confidence that most of the Northern Europe periglacial processes will disappear by the end of the century, even in the RCP2.6 scenario (Aalto et al., 2017). The magnitude of debris flow events might increase (Lugon and Stoffel, 2010) and the debris-flow season may last longer under the A1B scenario (Stoffel and Corona, 2018). Quantitative data for the European Alps is highly site dependent (Haeberli, 2013).
Heavy snowfall, ice storms and hail: There is low confidence that climate change will affect ice and snow-related episodic hazards (limited evidence). The change in snowpack in the Alps is expected to lead to a possible reduction in overall avalanche activity by end of the century (low confidence), except possibly in winter and at high altitudes (Castebrunet et al., 2014).
For ice storms, or freezing rainstorms, there is also limited evidence due to a limited number of studies. Heavy snowfalls have decreased in frequency in the past decades and this is expected to continue in the future climate (low confidence) (Beniston et al., 2018). Freezing rain is projected to increase in western, central and southern Europe by the end of the century under RCP4.5 and RCP8.5 (low confidence) (Kämäräinen et al., 2018). Rain-on-snow events, are decreasing in northern regions (Pall et al., 2019) and by 48% on average in southern Scandinavia (Poschlod et al., 2020) due to decreases in snowfall.
In summary, future snow cover extent and seasonal duration will reduce (high confidence) and it is virtually certain that glaciers will continue to shrink. A reduction of glacier ice volume is projected in the European Alps and Scandinavia (high confidence). There is high confidence that permafrost will undergo increasing thaw and degradation over the 21st century. Most of the Northern Europe periglacial will disappear by the end of the century even for a lower emissions scenario (medium confidence) and the debris-flow season may last longer in a warming climate (medium confidence).
12.4.5.5 Coastal and Oceanic
Relative sea level: Around Europe, over 1900–2018, a new tide gauge-based reconstruction finds a regional mean RSL change of 1.08 [0.79 to 1.38] mm yr–1 in the subpolar North Atlantic (Frederikse et al., 2020), compared to a GMSL change of around 1.7 mm yr–1Section 2.3.3.3 and Table 9.5). For the period 1993–2018, the RSLR rates around Europe, based on satellite altimetry, increased to 2.17 [1.66 to 2.66] mm yr–1 (Frederikse et al., 2020), compared to a GMSL change of 3.25 mm yr–1Section 2.3.3.3 and Table 9.5).
Relative sea level rise is extremely likely to continue in the oceans around Europe. Regional mean RSLR projections for the oceans around Europe range from 0.4–0.5 m under SSP1-2.6 to 0.7–0.8 m under SSP5-8.5 for 2081–2100 relative to 1995–2014 (median values), which means that there are locally large deviations from the projected GMSL change (Section 9.6.3.3). These RSLR projections may however be underestimated due to potential partial representation of land subsidence in their assessment (Section 9.6.3.2). The signal is strongest for the North Sea and Atlantic coasts, followed by the Black Sea. The Baltic Sea, on the contrary, shows the lowest increase due to land uplift (Vousdoukas et al., 2017). The model agreement is higher for the Mediterranean and in line with previous findings by Gualdi et al. (2013).
Coastal flood: The present-day 1-in-100-year ETWL is between 0.5 and 1.5 m in the MED basin and 2.5 and 5.0 m in the western Atlantic European coasts, around the UK and along the North Sea coast, and lower at 1.5–2.5 m along the Baltic Sea coast (Kirezci et al., 2020). Similar values are reported by Vousdoukas et al. (2018).
There is high confidence that extreme total water level (ETWL) magnitude and occurrence frequency will increase throughout Europe (see Figure 12.4p–r), except in the northern Baltic Sea. Across the region, the 5–95th percentile range of the 1-in-100-year ETWL is projected to increase (relative to 1980–2014) by 4–40 cm and by 6–47 cm by 2050 under RCP4.5 and RCP8.5, respectively. By 2100, this range is projected to be 6–88 cm and 25–186 cm under RCP4.5 and RCP8.5, respectively (Figure 12.SM.6; Vousdoukas et al., 2018; Kirezci et al., 2020). Mass addition across the Gibraltar Strait may play a role, although the extent of this contribution is currently unclear (Lionello et al., 2017). Furthermore, under RCP4.5, the present day 1-in-100-year ETWL is projected to have median return periods of between 1-in-5 and 1-in-20 years by 2050 and occur at least once per year by 2100 in the Mediterranean and Black Sea, while in the rest of Europe it is mostly projected to have median return periods of between 1-in-20-years and 1-in-50-years by 2050 and between 1-in-5-years and 1-in-20-years by 2100 (Vousdoukas et al., 2018). Under RCP8.5, occurrence of the present day 1-in-100-year ETWL is projected to increase further to median return periods of 1-in-1-year to 1-in-5-years by 2050 and occur more than once per year by 2100 in the Mediterranean and Black Sea, while in the rest of Europe it is mostly projected to have median return periods between 1-in-5-years and more than once per year by 2100.
Coastal erosion: Satellite-derived shoreline change estimates over 1984–2015 indicate shoreline retreat rates of around 0.5 m yr–1along the sandy coasts of WCE and MED, around 4 m yr–1 in EEU (Caspian Sea region) and more or less stable shorelines in NEU (Luijendijk et al., 2018; Mentaschi et al., 2018). Mentaschi et al. (2018) report a coastal area loss of 270 km2 over a 30-year period (1984–2015) along the Atlantic coastlines of Europe.
Projections indicate that sandy coasts throughout the continent (except those bordering the northern Baltic Sea) will experience shoreline retreat through the 21st century (high confidence). Median shoreline change projections (CMIP5) relative to 2010, show that, by mid-century, shorelines will retreat by between 25 m and 60 m along sandy coasts in WCE and MED under both RCP4.5 and RCP8.5 (Athanasiou et al., 2020; Vousdoukas et al., 2020b). Mid-century median projections for NEU indicate virtually no shoreline retreat under RCP4.5, but a retreat of around 40 m under RCP8.5. By 2100, median shoreline retreats of around 50 m are projected in NEU and MED under RCP4.5, increasing to around 80 m under RCP8.5. End-century median projections for WCE are far higher at 100 m (RCP4.5) and 160 m (RCP8.5). The total length of sandy coasts in Europe that is projected to retreat by more than a median of 100 m by 2100 under RCP4.5 and RCP8.5 is about 12,000 km and 18,000 km respectively, an increase of approximately 54% (Vousdoukas et al., 2020b).
Local assessments of both long term shoreline retreat and episodic coastal erosion are given by Li et al. (2014b), Toimil et al. (2017), Bon de Sousa et al. (2018) and Le Cozannet et al. (2019). In terms of episodic coastal erosion, 31–88% of all Aegean beaches are projected to experience complete erosion, with a RCP4.5 sea level rise of 0.5 m and a surge of 0.6 m, but with substantial uncertainty (Monioudi et al., 2017).
Marine heatwave: The mean SST of the Atlantic Ocean and the Mediterranean has increased between 0.25°C and 1°C since 1982–1998. This mean ocean surface warming is correlated to longer and more frequent marine heatwaves in the region (Oliver et al., 2018). Over the period 1982–2016, the coastlines of Europe experienced on average more than 2.0 MHW yr–1, with the eastern Mediterranean and Scandinavia experiencing 2.5–3 MHWs yr–1. The average duration was between 10 and 15 days. Changes over the 20th century, derived from MHW proxies, show an increase in frequency of between 1.0 and 2.0 MHWs per decade in Europe, although the trend is not statistically significant; with an increase in intensity per event in the North Atlantic and the Mediterranean, and a decrease in the Atlantic off the British Isles. The total number of MHW days per decade has increased in the Mediterranean (Oliver et al., 2018).
Mean SST is projected to increase by 1°C–3°C around Europe by 2100, with a hotspot of around 4°C–5°C along the Arctic coastline of Europe under RCP4.5 and RCP8.5 scenarios (see Interactive Atlas), leading to a continued increase in MHW frequency, magnitude and duration (Oliver et al., 2018; MedECC, 2020). Projections for SSP1-2.6 and SSP5-8.5 both show an increase in MHWs around Europe by 2081–2100, relative to 1985–2014 (Box 9.2, Figure 1). Darmaraki et al. (2019) project that, by the end of the 21st century and under RCP8.5, there will be one MHW occurring every year in the northern Mediterranean sea, and that these MHWs would be three months longer, four times more intense, and 42 times more severe than present day MHWs in the region. Frölicher et al. (2018) show that, in Europe, the change in the probability for the number of days of MHWs exceeding the 99th percentile of the pre-industrial level is 4%, 15% and 30% for global warming levels of 1°C, 2°C and 3.5°C, respectively. MHW increase in the Mediterranean will impact on many species that live in shallow waters and have reduced motility, with consequences for related economic activities (Galli et al., 2017).
In general, there is high confidence that most coastal/ocean-related climatic impact-drivers in Europe will increase over the 21st century for all scenarios and time horizons. Relative sea level rise is extremely likely to continue around Europe (except in the northern Baltic Sea), contributing to increased coastal flooding in low-lying areas and shoreline retreat along most sandy coasts (high confidence). Marine heatwaves are also expected to increase around the region over the 21st century (high confidence).
12.4.5.6 Other
Compound events: One typical compound event that is observed in the European area is compound flooding due to the combination of extreme sea level events and extreme precipitation events associated with high levels of runoff. In the present climate, the Mediterranean coasts are exposed to a higher probability of this type of compound flooding event (Bevacqua et al., 2019). Under RCP8.5, the probability of these events is projected to increase along northern European coasts (west coast of UK, northern France, the east and south coast of the North Sea, and the eastern half of the Black Sea), with the percentage of coastline now experiencing such events at least once every 6 years increasing by between 3% and 11% by the end of the 21st century (Bevacqua et al., 2019).
Under RCP8.5, regions in Russia, France and Germany are projected to experience an increase in the frequency and the length of wet and cold compound events, while Spain and Bulgaria are projected to stay longer in the hot and dry state by mid-century (Sedlmeier et al., 2016).
Compound events of dry and hot summers have increased in Europe. Manning et al. (2019) found that the probability of such compound events has increased across much of Europe between 1950–1979 and 1984–2013, notably in southern, eastern and western Europe. Compound hot and dry extremes are projected to increase in Europe by mid-century for the SRES A1B and RCP8.5 with a particularly strong signal projected in southern and eastern Germany and the Czech Republic (Sedlmeier et al., 2016).
The assessed direction of change in climatic impact-drivers for Europe and associated confidence levels are illustrated in Table 12.7, together with emergence time information (Section 12.5.2). No assessable literature could be found for sand and dust storms, although these phenomena may be relevant in parts of the region.
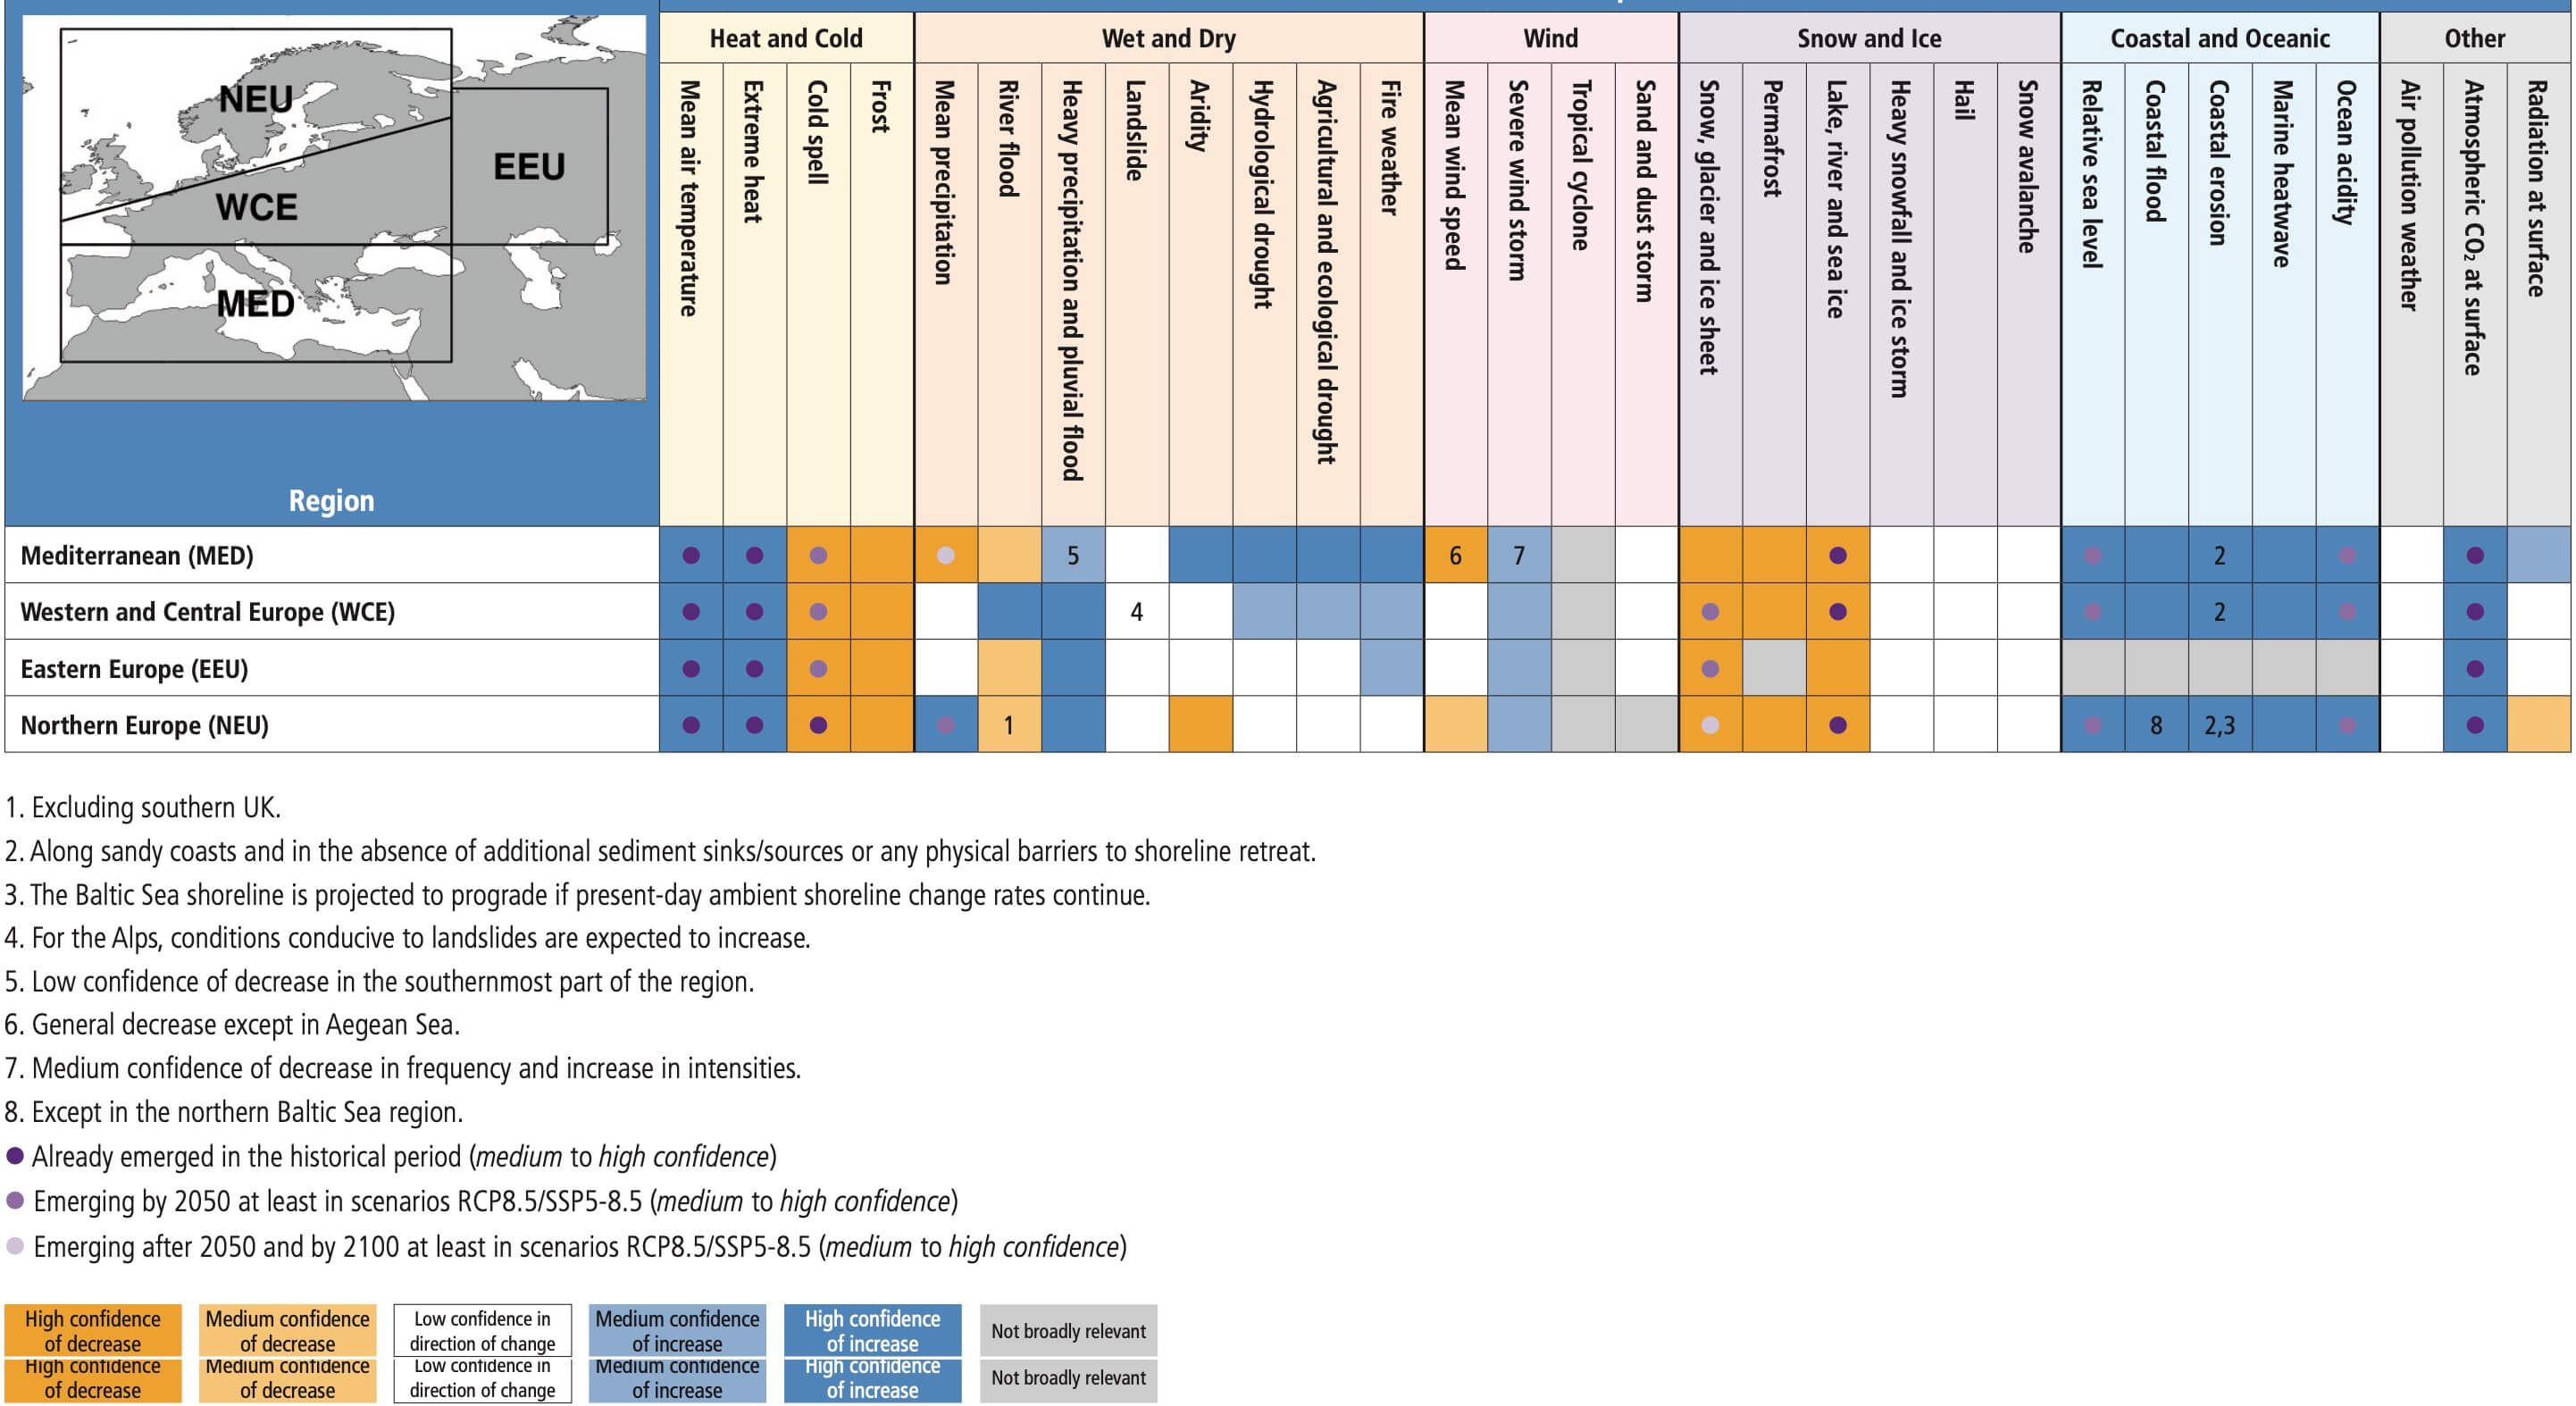
12.4.6 North America
Major changes in North American CIDs were assessed in WGII AR5 Chapter 26 (Romero-Lankao et al., 2014), with additional detail on connections to warming levels provided by SR1.5 (IPCC, 2018), and climate information related to land degradation and land-use suitability in SRCCL (IPCC, 2019c), and ocean and coastal hazards in the SROCC (IPCC, 2019b). Recent national assessments in the USA (USGCRP, 2017, 2018) and Canada (Bush and Lemmen, 2019) enhance the local perspective and assessments across a number of CIDs and their sectoral connections. For the purpose of this assessment, North America is sub-divided into six sub-regions, as defined in Chapter 1: North Central America (NCA), Western North America (WNA), Central North America (CNA), Eastern North America (ENA), North-Eastern North America (NEN), and North-Western North America (NWN). Greenland and Arctic regions of North-Eastern and North-Western North America are further assessed in Section 12.4.9, and the Caribbean and Hawaiian Islands are assessed in Section 12.4.7.
12.4.6.1 Heat and Cold
Mean air temperature: Atlas.9.2 assessed very likely mean warming in observations across North America, with highest increases at higher latitudes and in the winter season. Atlas.9.4 assessed very likely mean warming in future decades in all North American regions, with CMIP and CORDEX models showing median increases exceeding 2°C in much of the continental interior under RCP8.5 (2041–2060 compared to 1995–2014) and higher increases towards the north. Mean temperatures at the end of century show strong scenario dependence, rising between 1°C and 2.5°C in RCP2.6 and about 4°C to 8°C in RCP8.5 (Figures Atlas.12, Atlas.26 and Atlas.27). Warming also raises stream temperatures across the continent (DOE, 2015; Trtanj et al., 2016; van Vliet et al., 2016; Chapra et al., 2017), and Hill et al. (2014) projected US stream warming by 0.6°C (±0.3°C) per 1°C increase in local air temperature. Mean warming drives shifts in the seasonal timing of temperature thresholds, including increasing growing degree days (Mu et al., 2017), longer growing seasons (Gowda et al., 2018; G. Li et al., 2018; L.A. Vincent et al., 2018), reduced chill hours (Luedeling, 2012; Lee and Sumner, 2015; Xie et al., 2015; Parker and Abatzoglou, 2019), and longer pollen and allergy seasons (Fann et al., 2016; Anenberg et al., 2017; Sapkota et al., 2019). Warmer temperatures reduce heating degree days and increase cooling degree days (high confidence) (Bartos et al., 2016; US EPA, 2016; Craig et al., 2018; X. Zhang et al., 2019; Coppola et al., 2021b)
Extreme heat: Section 11.9 assessed that extreme temperatures in North America have increased in recent decades (medium evidence, medium agreement) other than in Central and Eastern North America (low confidence), and extreme heat in all regions is projected to increase with climate change (high confidence). Observed trends in extreme heat are more positive for heat extreme indices that include temperature and humidity given historical expansion of irrigation and intensification of agriculture (Mueller et al., 2017; Grotjahn and Huynh, 2018; Thiery et al., 2020). Several studies noted statistically significant increases in intensity and particularly the frequency, duration, and seasonal length of the physiologically hazardous extreme heat conditions across North America (Grineski et al., 2015; Habeeb et al., 2015; Martínez-Austria et al., 2016; Petitti et al., 2016; L.A. Vincent et al., 2018; García-Cueto et al., 2019).
Figure 12.4b shows over a month of additional days at CMIP6 SSP5-8.5 mid-century where temperatures exceed 35°C across much of southern Mexico and regions near the US–Mexico border, and these extreme temperatures occur at least once per year up to southern Canada. Coppola et al. (2021b) found similar patterns in CMIP5 and CORDEX-Core. Using locally tailored heat thresholds, Maxwell et al. (2018) found that ‘very hot’ days in five US cities will occur a median of three to five times more often by 2036–2065 under RCP8.5 (2 to 3.5 times more often in RCP4.5), Oleson et al. (2018) projected that annual heatwave duration will exceed one month in Houston in RCP8.5 2061–2080, and Anderson et al. (2018) projected 7 to 12 times more exceedances of thresholds associated with high-mortality by 2061–2080 under RCP8.5 (6 to 7 times more exceedances in RCP4.5). Schwingshackl et al. (2021) found that Central and Eastern North America are among the regions with the strongest trend in heat stress indicators. Studies also project increasingly surpassed heat extreme thresholds for North American crops (Gourdji et al., 2013), airplane weight restrictions (Coffel et al., 2017), and peak load energy systems (Auffhammer et al., 2017).
The number of days crossing dangerous heat thresholds such as HI > 41°C will be very sensitive to the mitigation scenario at the end of the century (Wuebbles et al., 2014; Zhao et al., 2015; Dahl et al., 2019; Schwingshackl et al., 2021). At the end of the century under SSP5-8.5, a CMIP6 median increase of exceedances of 75–150 days per year is projected over much of North Central America, Central North America and the south-western USA while this increase is projected to remain limited below 60 days under SSP1-2.6 (Figure 12.4d,f and Figure 12.SM.2). Steinberg et al. (2018) also projected more frequent and longer ‘heat-health’ events in California extending into October.
Cold spell: Chapter 11 assessed high confidence in decreasing frequency and intensity of cold spells over North America (Section 11.9). The number of days with extreme wind chill hours (humidex <–30) decreased at 76% of examined Canadian stations from 1953 to 2012 (Mekis et al., 2015) and cold days and coldest nights decreased in Mexico from 1980 to 2010 (García-Cueto et al., 2019).
Cold spells are projected to decrease over North America under climate change, with the largest decreases most common in the winter season (high confidence) (Section 11.9). Minimum winter temperatures are projected to rise faster than the mean winter temperature (Underwood et al., 2017) and alter cold-hardiness zones used to determine agricultural suitability (Parker and Abatzoglou, 2016). Wuebbles et al. (2014) projections for RCP8.5 end-of-century show that the four-day cold spell that happens on average once every five years is projected to warm by more than 10°C and CMIP5 models do not project current 1-in-20-year annual minimum temperature extremes to recur over much of the continent. Multiple studies have shown that Arctic warming can alter large-scale variability and change the frequency and duration of mid-latitude cold air outbreaks, potentially leading to increasing cold hazards in some regions (low agreement) (Barcikowska et al., 2019; Cohen et al., 2020; Zhou et al., 2021).
Frost: An expansion of the frost-free season is underway and projections for North America indicate a continuation of this trend in the future (high confidence). Significant decreases in frost days, consecutive frost days, and ice days were identified in 1948–2016 station observations across Canada, along with a resulting lengthening of the frost-free season by more than a month in many regions (L.A. Vincent et al., 2018). Frost days also declined in nearly all Mexican cities from 1980 to 2010 (García-Cueto et al., 2019), and a 1917–2016 decline of about three weeks in frigid winter conditions challenges ecosystems in the north-east USA and south-east Canada (Contosta et al., 2020). Studies connect projections of a longer frost-free season in North America to a longer outdoor construction season, shifts in frost variance to orchard damages, and lower weight tolerances for runways (Daniel et al., 2018; DeGaetano, 2018; Jacobs et al., 2018). Frosts are projected to persist as an episodic hazard in many regions given natural variability and cold air outbreaks even as mean temperature rises (high confidence).
Climate change is virtually certain to shift the balance of temperature towards warming trends and away from cold extremes, with increases in the magnitude, frequency, duration and seasonal and spatial extent of heat extremes driving impacts across North America. The frequency of dangerous heat threshold exceedance (such as HI > 41°C) is particularly sensitive to scenario pathway, with 7 5–1 50 days more under SSP5-8.5 but less than 60 days more under SSP1-2.6 by the end of the century in NCA, CNA and the south-western USA.
12.4.6.2 Wet and Dry
Mean precipitation: Atlas.9.2 found that trends in annual precipitation over 1960–2015 are generally non-significant, though there are consistent positive trends over parts of ENA and CNA, together with significant decreases in precipitation in parts of the south-western USA and north-western Mexico.
Atlas.9.4 assessed very high confidence in increases in mean precipitation over most of northern and Eastern North America, with medium confidence of decrease over Northern Central America and low confidence elsewhere (see Figure Atlas.26, and Cross-Chapter Box Atlas.1, Figure 1). Changes are most dramatic in the spring and winter, when wet conditions are projected to extend from the northern portions of the continent as far south as the central Great Plains, while Mexico becomes drier; in contrast, summer changes are uncertain across most of the continent other than wetter conditions in northern Canada (Easterling et al., 2017; Bukovsky and Mearns, 2020; Almazroui et al., 2021; Teichmann et al., 2021).
River flood: There is limited evidence and low agreement on observed climate change influences for river floods in North America (Section 11.5). Trends in streamflow indices are mixed and difficult to separate from river engineering influences, with large changes but little spatial coherence across the USA, making it difficult to identify trends with confidence (Peterson et al., 2013; Mallakpour and Villarini, 2015; Archfield et al., 2016; Wehner et al., 2017; Villarini and Slater, 2018; Hodgkins et al., 2019; Neri et al., 2019). There is high confidence in historical shifts in the timing of peak streamflow towards higher winter and earlier spring flows in snowmelt-driven basins in Canada (Burn and Whitfield, 2016; Bonsal et al., 2019) and the USA (Dudley et al., 2017; Wehner et al., 2017, Neri et al., 2020). Some rivers show ice-jam floods occurring a week earlier, but changes are mixed, given localized positive and negative changes across the continent (Rokaya et al., 2018). There is medium confidence that climate change will increase river floods over the USA and Canada but low confidence for changes in Mexico. Wobus et al. (2017a) used a regional hydrologic model for 57,000 streams to project more than a doubling in the frequency of current 1-in-100-year flow events in many portions of the USA for RCP8.5 2050 with additional contributions from earlier snowmelt. CMIP6 projections for SSP5-8.5 2065–2099 show strongest peak USA runoff increases in the east (Villarini and Zhang, 2020); however, several studies applying global hydrological models disagree with regional streamflow projections, indicating a decrease in the magnitude or frequency of floods over a large portion of North America (e.g., Hirabayashi et al., 2013; Arnell and Gosling, 2016; see Figure 12.10a,c).
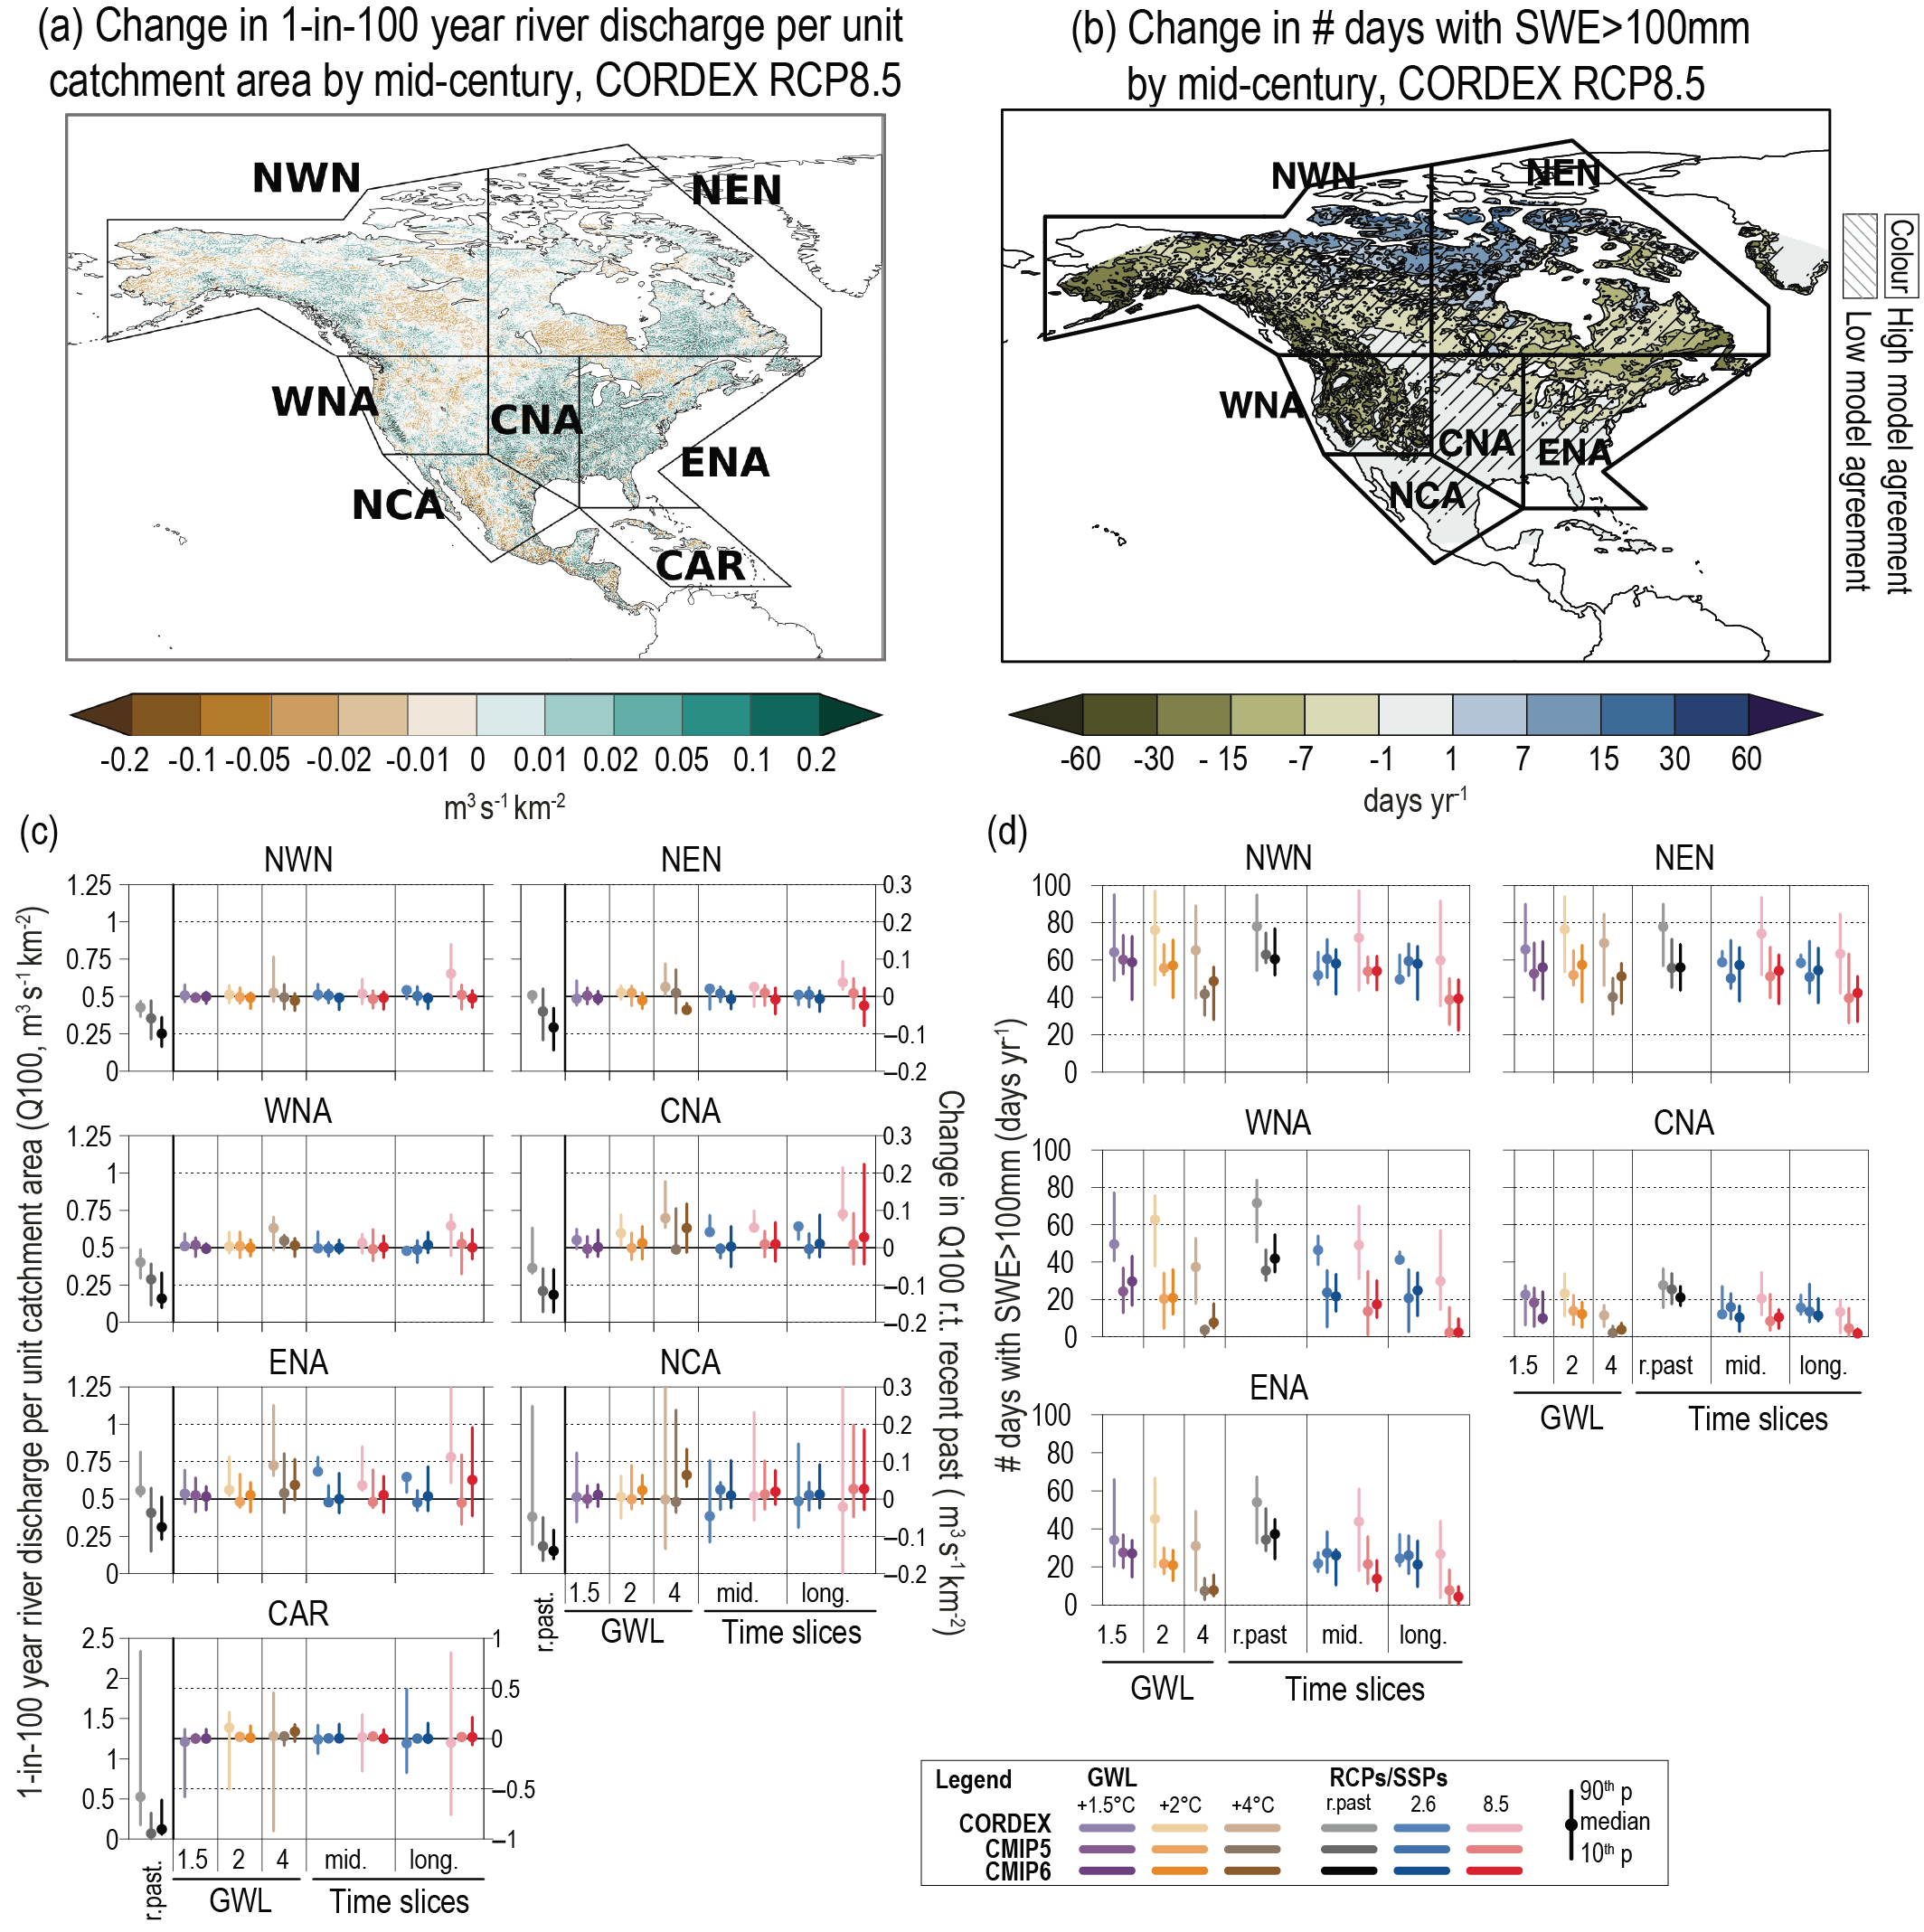 Figure 12.10 | Projected changes in selected climatic impact-driver indices for North America. (a) Mean change in 1-in-100-year river discharge per unit catchment area (Q100, m3s–1km–2), and (b) median change in the number of days with snow water equivalent (SWE) over 100 mm (from November to March), from CORDEX-North America models for 2041–2060 relative to 1995–2014 and RCP8.5. Diagonal lines indicate where less than 80% of models agree on the sign (direction) of change. (c) Bar plots for Q100 (m3s–1km–2) averaged over land areas for the AR6 WGI Reference Regions (defined in Chapter 1). The left-hand column within each panel (associated with the left-hand y-axis) shows the ‘recent past’ (1995–2014) Q100 absolute values in grey shades. The other columns (associated with the right-hand y-axis) show the Q100 changes relative to the recent past values for two time periods (‘mid’ 2041–2060 and ‘long’ 2081–2100) and for three global warming levels (defined relative to the pre-industrial period 1850–1900): 1.5°C (purple), 2°C (yellow) and 4°C (brown). The bars show the median (dots) and the 10–90th percentile range of model ensemble values across each model ensemble. CMIP6 is shown by the darkest colours, CMIP5 by medium, and CORDEX by light. SSP5-8.5/RCP8.5 is shown in red and SSP1-2.6/RCP2.6 in blue. (d) As for (c) but showing absolute values for number of days with SWE > 100 mm, masked to grid cells with at least 14 such days in the recent past. See Technical (Annex VI for details of indices. A Caribbean (CAR) Q100 bar plot is included here but assessed in the Small Islands section (Section 12.4.7). Further details on data sources and processing are available in the chapter data table (Table 12.SM.1).
 Heavy precipitation and pluvial flood: Section 11.4 assessed high confidence in observed increases in extreme precipitation events (including hourly totals) in Central and Eastern North America with low confidence in broad trends elsewhere in the continent despite observational increases in some portions of each region (L.A. Vincent et al., 2018; García-Cueto et al., 2019; X. Zhang et al., 2019).
(Section 11.4 found that high precipitation is projected to increase across North America (high confidence) except for portions of Western North America where projections are mixed (medium confidence of increase). Maxwell et al. (2018) identified regional ‘heavy precipitation day’ thresholds for five cities across the USA and projected that a tripling (or more) of these events is possible by RCP8.5 mid-century. Projections indicate changes to intensity-duration-frequency (IDF) curves typically used for construction design and automobile hazards, as well as increases in the 10-year recurrence level of 24-hour rainfall intensities that challenge storm water drainage systems (Hambly et al., 2013; Cheng and AghaKouchak, 2015; J.E. Neumann et al., 2015; Prein et al., 2017b; Hettiarachchi et al., 2018; Ragno et al., 2018). Precise levels of regional IDF characteristics may still depend substantially on the method and resolution of downscaling applied (DeGaetano and Castellano, 2017; L.M. Cook et al., 2020).
Landslide: There is growing yet limited evidence for unique climate-driven changes in landslide and rockfall hazards in North America, even as theory suggests decreases in slope and rockface stability due to more intense rainfall, rain-on-snow events, mean warming, permafrost thaw, glacier retreat, and coastal erosion (Cloutier et al., 2017; Coe et al., 2018; Handwerger et al., 2019; Hock et al., 2019; Patton et al., 2019) although dry trends can decelerate mass movements (Bennett et al., 2016). Landslide frequency has increased in British Columbia (Canada; Geertsema et al., 2006) and is expected to increase in North-Western North America given the combination of these factors (medium confidence) (Gariano and Guzzetti, 2016). Cloutier et al. (2017)projected an increase in landslides in western Canada due to wetter overall conditions and reduced return period for extreme rainfall. Robinson et al. (2017) used scenarios based upon projection of 50-year recurrence of 7-day precipitation periods to highlight the potential for increased landslide hazards near Seattle (USA). Broad projections for the USA are more uncertain given increases in evapotranspiration that will counteract precipitation changes over much of the country (Coe, 2016).
Aridity: Chapter 8 showed that aridity in North America generally moves opposite to mean precipitation change with an added evaporative demand from warmer temperatures (high confidence in aridity increase for Northern Central America; medium confidence for an increase in Central North America; high confidence for a decrease in North-Eastern North America; medium confidence decreases in Eastern and North-Western North America; see also Section 11.9). Projected soil moisture declines (Figure 12.4j–l) are most widespread across North America during the summer, with the largest declines in Mexico and the southern Great Plains but also extending into Canada (Section 8.4.1.6; Swain and Hayhoe, 2015; Easterling et al., 2017; Bonsal et al., 2019; J. Lu et al., 2019). Yoon et al. (2018) found net reduction in southern Great Plains groundwater storage in RCP8.5 mid-century projections despite increases in mean precipitation and both wet and dry extremes. Soil moisture drying could reach unprecedented levels by the CMIP6 RCP8.5 end-of-century, even when evaluating deeper soil columns relevant for crop rooting depth (B.I. Cook et al., 2020). Projected changes in the aridity index portray a shift the geographic range of temperate drylands northward and eastward in Central and Western North America (Schlaepfer et al., 2017; Seager et al., 2018) which also diminishes aquifer recharge rates in the southern Great Plains and in some western regions where snowpack is reduced (Meixner et al., 2016).
Hydrological drought: Section 11.9 asssessed low confidence of significant observational trends and projected future changes in the characteristics of episodic hydrological drought in North America given limited evidence and low agreement in modeled changes. C. Zhao et al. (2020) found that increases in hydrological drought frequency (particularly the 100 yr drought) were far more prevalent than for meteorological drought across 5797 watersheds in the USA and Canada, indicating a strong influence of evaporative demand. Reductions in the overall supply of meltwater from a declining snowpack also increase the potential for intermittent hydrological droughts in the western USA (Mote et al., 2018; Livneh and Badger, 2020).
Agricultural and ecological drought: Section 11.9 assessed medium confidence for an increase in agricultural and ecological drought in Western North America but otherwise found limited evidence for broadly observed changes in North American agricultural and ecological drought, even as increasing evaporative demand intensified vegetation stress and soil moisture deficits in recent events (Sections 11.6, 11.9). Section 11.9 asssessed medium confidence for more intense agricultural and ecological drought conditions over North Central America, Western North America and Central North America in a 2°C global warming level (about mid-century), with medium confidence extending to Eastern North America and high confidence for Northern Central America and Central North America under a 4°C global warming level associated with higher emissions scenarios past 2050. Figure 12.4g–i shows that the frequency of meteorological droughts (which often initiate hydrological, agricultural and ecological droughts) is largely projected to increase in North American areas where total precipitation decreases (and vice versa; see Section 11.9 and Coppola et al., 2021b), and higher evaporative demand will extend the regions where more intense ecological and agricultural droughts develop when meteorological droughts occur (Wehner et al., 2017; B.I. Cook et al., 2019, 2020). Studies utilizing a variety of drought indices and soil moisture projections consistently project increased drought extending from Mexico into the southern Canadian Plains during the summer (Swain and Hayhoe, 2015; Ahmadalipour et al., 2017; Feng et al., 2017; Bonsal et al., 2019; Tam et al., 2019; B.I. Cook et al., 2020).
Fire weather: Climatic conditions conducive to wildfire have increased in Mexico, Western and North-Western North America, primarily due to warming (high confidence). Abatzoglou and Williams (2016) found climate change led to higher values for eight fuel aridity indices over the western USA in recent decades, with 2000–2015 changes exposing 75% more forested area to high fuel aridity and adding nine more high fire-potential days each year, similar to 1979–2013 western USA and Mexico fire season expansion reported in Jolly et al. (2015). Increases in lightning-initiated fires have been distinguished from trends in man-made fire in western Canada and the USA (Balch et al., 2017; Hanes et al., 2019). Jain et al. (2017) identified a 1979–2015 expansion in fire weather season in eastern Canada and the south-western USA (with a smaller reduction in the northern Mountain West) along with regional shifts in the 99th percentile Canadian Fire Weather Index (FWI) and potential fire-spread days. Girardin and Wotton (2009) noted that 1951–2002 trends in the Monthly Drought Code fire index in eastern Canada could hardly be distinguished from decadal variability.
Climate change drives future increases in North American fire weather, particularly in the south-west (high confidence), although further studies on shifts in exposure and vulnerability are needed to understand overall fire risks (see WGII Chapter 14). A significant increase of FWI is apparent before 2050 under RCP8.5 in much of North America, including the frequency of 95th-percentile FWI days, peak seasonal FWI average, fire weather season length, and maximum fire weather index (Abatzoglou et al., 2019), and fire season across North America expands dramatically beyond 2°C global warming levels (Q. Sun et al., 2019; Jain et al., 2020). X. Wang et al. (2017b) simulated fire-spread days across Canada and found increases across most of the areas studied by 2071–2100, with median changes of –20 to +140% (RCP2.6), –20 to +250% (RCP4.5) and 40 to 360% (RCP8.5) compared to 1976–2015. Prestemon et al. (2016) found more conducive conditions for lightning-ignited fires in the south-eastern USA by mid-century, while warming conditions in Alaska increasingly push July temperatures above 13.4°C, a threshold for fire danger across Alaska’s tundra and boreal forest (Partain et al., 2016; Young et al., 2017). Longer and more intense fire seasons would also raise particulate matter and black carbon concentrations in the western USA, reducing visibility at many National Parks (Yue et al., 2013; Val Martin et al., 2015).
Changes in North American wet and dry climatic impact-drivers are largely organized by the ‘north-east (more wet) to south-west (more dry)’ pattern of mean precipitation change, although heavy precipitation increases are widespread and increasing evaporative demand expands aridity, agricultural and ecological drought, and fire weather (particularly in summer) (high confidence).
12.4.6.3 Wind
Mean wind speed: Mean wind speeds have declined in North America – as in other Northern Hemisphere areas – over the past four decades (medium confidence) (AR5 WGI) with a reversal in the last decade (low confidence) not fully consistent across studies (Tian et al., 2019; Zeng et al., 2019; Z. Zhang et al., 2019). Tian et al. (2019) found a corresponding reduction in the wind power potential across the eastern parts of North America.
Mean wind speeds are expected to decline over much of North America (Figure 12.4m–o), but the only broad signal of consistent change across model types is a reduction in wind speed in Western North America (high confidence). These declines reduce wind power endowment by 2050 and as early as the 2020–2040 near-term period in the USA Mountain West, while there is disagreement between global- and regional-model change projections in the upper and lower Great Plains, Ohio River Valley, Mexico and eastern Canada (Karnauskas et al., 2018a; Jung and Schindler, 2019; Chen, 2020).
Severe wind storm: There is limited evidence and low agreement in observed changes in North American CID indices associated with extratropical cyclones (Section 11.7), severe thunderstorms, severe wind bursts (derechos), tornadoes, or lightning strikes (Vose et al., 2014; Easterling et al., 2017; Kossin et al., 2017). Observational studies have indicated a reduction in the number of tornado days in the USA, but increases in outbreaks with 30 or more tornadoes in one day (Brooks et al., 2014), the density of tornado clusters (Elsner et al., 2015), and overall tornado power (Elsner et al., 2019).
There is medium confidence of a general decrease in the number of extratropical cyclones producing high wind speeds in North America, except over northernmost parts, for a global warming level of 2°C or by the end of the century under RCP4.5 and RCP8.5 (Kumar et al., 2015; Jeong and Sushama, 2018a; C. Li et al., 2018). GCMs cannot directly resolve tornadoes and severe thunderstorms, however projections of favourable environments for severe storms (based on convective available potential energy and wind shear) indicate medium confidence for more severe storms and a longer convective storm season in the USA, weaker increases extending north and east (Seeley and Romps, 2015; Glazer et al., 2021), and a corresponding increase in autumn and winter tornadic storms (H.E. Brooks, 2013; Diffenbaugh et al., 2013; Brooks et al., 2014; see also Section 11.7.2). Prein et al. (2017a) used a convection-permitting model to project a tripling of mesoscale convective systems over the USA for end-of-century RCP8.5.
Tropical cyclone: Section 11.7.1 identified recent reductions in tropical cyclone translation speed and higher tropical cyclone rainfall totals over the North Atlantic, as well as substantial natural variability. Projections indicate low confidence in change in North Atlantic tropical cyclone numbers, but medium confidence in Mexico and the US Gulf and Atlantic coasts for more intense storms with higher wind, precipitation, and storm surge totals when they do occur (Section 11.7.1; Diro et al., 2014; DOE, 2015; Walsh et al., 2016a; Kossin et al., 2017; Marsooli et al., 2019; Ting et al., 2019; Knutson et al., 2020). A more rapid intensification of tropical cyclone winds and destructive power also heightens the tropical cyclone hazard (Bhatia et al., 2019). Greenhouse gas forcing is projected to shift tropical cyclones poleward (Kossin et al., 2016), while also holding the potential for higher precipitation totals (Risser and Wehner, 2017; Knutson et al., 2020) particularly given evidence that storms increasingly stall near North American coastlines (Hall and Kossin, 2019).
Sand and dust storm: Land-use change has increased dust emissions in the western USA in the past 200 years (Neff et al., 2008). However, there is medium confidence for observed increases in Western North American sand and dust storm activity since 1980. In their study of Valley Fever spread, Tong et al. (2017) identified a rapid intensification of dust storm activity using PM10 and PM2.5 observations from 1980–2011 across 29 monitoring sites in the south-western USA, similar to contiguous USA observations by Brahney et al. (2013). Hand et al. (2016) attributed the earlier onset of spring dusts in the south-west in large part to the Pacific Decadal Oscillation, however. The increasing trend in dust since the 1990s in the south-western USA can be explained by precipitation deficit and surface bareness (Pu and Ginoux, 2018). Projections of future sand and dust storms over North America are based on aridity as a primary proxy for conducive conditions which lends medium confidence of an increase over Mexico and the south-western USA. Pu and Ginoux (2017) project about five more dusty days in spring and summer in the southern Great Plains under RCP8.5 at the end of the century, while dusty days decrease in northern regions where mean precipitation tends towards wetter conditions.
Tropical cyclones, severe wind and dust storms in North America are shifting towards more extreme characteristics, with a stronger signal towards heightened intensity than increased frequency, although specific regional patterns are more uncertain (medium confidence). Mean wind speed and wind power potential are projected to decrease in Western North America (medium confidence) with differences between global and regional models lending low confidence elsewhere.
12.4.6.4 Snow and Ice
Snow: The seasonal extent of snow cover has reduced over North America in recent decades (robust evidence, high agreement) (see also Sections 2.3.2.2 and 9.5.3, and Figure Atlas.25). The average snow-cover extent in North America decreased at a rate of about 8500 km2yr–1 over the 1972–2015 period, reducing the average snow cover season by two weeks, primarily due to earlier spring melt (US EPA, 2016). Observations indicate earlier spring snowpack melting (Dudley et al., 2017) and a reduction in end-of-season snowpack metrics important to water resources over the Rocky Mountains (particularly since 1980) and Pacific Northwest (Pederson et al., 2013; Kormos et al., 2016; Kunkel et al., 2016; Fyfe et al., 2017; Mote et al., 2018). In situ measurements in Canada show more heterogenous trends in snow amount and density (Brown et al., 2019).
Climate change is expected to reduce the total snow amount and the length of the snow cover season over most of North America, with a corresponding decrease in the proportion of total precipitation falling as snow and a reduction in end-of-season snowpack (high confidence) (see Atlas.9.5). Changes include a reduction in the number of days with snowfall in across all of North America, with the exception of northern Canada (Danco et al., 2016; McCrary and Mearns, 2019), a delay of about a week in first snowfall in the western USA by 2050 under RCP8.5 (Pierce and Cayan, 2013), and more prominent reductions in Canadian snow cover in the October –December period (Mudryk et al., 2018). Reduced total snowpack and earlier snowmelt lower dry season streamflow (Kormos et al., 2016; Rhoades et al., 2018). Figure 12.10b shows a reduction in days suitable for skiing (SWE > 10 cm; Wobus et al., 2017b) across the USA and southern Canada, although some portions of northern central Canada see an increase.
Glacier: Section 9.5.1 assessed that glaciers in Alaska, western Canada and the western USA are expected to continue to lose mass and areal extent (high confidence). Compared to their 2015 state, glaciers in the western Canada and the USA region will lose 62 ± 30%, 75 ± 29% and 85 ± 23%, of their mass by the end of the century for RCP2.6, RCP4.5 and RCP8.5 scenarios, respectively (Marzeion et al., 2020). Meanwhile glaciers in Alaska will lose 26 ± 21%, 31 ± 24% and 44 ± 27%, of their 2015 mass under the same scenarios. The overall loss of glacial mass can act as a meltwater supply for freshwater resources, although this is expected to peak in the middle of the century and then fade as glaciers disappear (Fyfe et al., 2017; Derksen et al., 2018). Continued shrinkage of glaciers is projected to create further glacial lakes (medium confidence) similar to those that have led to outburst floods in Alaska and Canada (Carrivick and Tweed, 2016; Harrison et al., 2018).
Permafrost: Warmer ground temperatures are expected to extend the geographical extent and depth of permafrost thaw across northern North America (very high confidence) (Section 9.5.2). Observations across Canada show that permafrost temperature is increasing and the active layer is getting thicker (Section 2.3.2.5; Derksen et al., 2018; Biskaborn et al., 2019; Romanovsky et al., 2020). Slater and Lawrence (2013) note that the RCP8.5 end-of-century period in North America only has shallow permafrost as the most probable condition in the Canadian Archipelago. Melvin et al. (2017) noted the loss of shallow permafrost in five RCP8.5 CMIP5 models across a wide swathe of southern Alaska by 2050, along with increases of active layer thickness. There is high confidence in continued reductions in mountain near-surface permafrost area with high spatial variability given local snow and temperature changes (Section 9.5.2; Peng et al., 2018; Hock et al., 2019).
Lake, river and sea ice: Anthropogenic warming reduces the seasonal extent of lake and river ice over many North American freshwater systems, with ice-free winter conditions pushing further north with rising temperatures (high confidence). Observations in Central and Eastern North America show reduced average seasonal lake-ice cover duration (Benson et al., 2012; Mason et al., 2016; US EPA, 2016). Satellite observations show declines in lake ice (Du et al., 2017) and loss of more than 20% of winter river-ice length in much of Alaska (2008–2018 compared to 1984–1994; Yang et al., 2020a). Spring lake and river ice in Canada is projected to break up 10–25 days earlier while autumn freeze-up occurs 5–15 days later by mid-century, with larger declines in lake-ice season closer to the coasts (Dibike et al., 2012) and for rivers in the Rocky Mountains and north-eastern USA (Yang et al., 2020a), although global models have difficulty with frozen freshwater system dynamics (Derksen et al., 2018). Substantial ice loss is projected over the Laurentian Great Lakes (Hewer and Gough, 2019; Matsumoto et al., 2019). The southern extent of lakes experiencing intermittent winter ice cover moves northward with rising temperature, pushing nearly out of the continental USA at low elevations under a 4.5°C GWL (Sharma et al., 2019). Higher spring flows and the potential for winter thaws are also projected to heighten the threat of ice jams (Rokaya et al., 2018; Bonsal et al., 2019) while reducing the seasonal viability of ice roads and recreational use (Pendakur, 2016; Mullan et al., 2017; Knoll et al., 2019).
Seasonal sea ice coverage along the majority of Canadian and Alaskan coastlines is declining (robust evidence, high agreement) and there is high confidence that sea ice loss continues under climate change, as further assessed in Section 12.4.9.
Heavy snowfall: There is low agreement (limited evidence) for observed changes in heavy snowfall in North America. Kluver and Leathers (2015) noted a 1930–2008 frequency increase for all snow intensities in the northern Great Plains but declines in heavier snow events in the Pacific Northwest and declines in the south-eastern USA. Changnon (2018) found that most extreme 30-day high-snowfall periods in the 1900–2016 record over the eastern USA occurred in the 1959–1987 period, which lies between the 1930s Dust Bowl and recent warming. There is low agreement and medium evidence for broad projected changes to heavy snowfall over North America given increased heavy precipitation and warmer winter temperatures. Several recent regional studies have projected that low-intensity events decrease more rapidly than heavy snowfall events, resulting in an increase in the snowfall proportion from heavy snowfall events even as the number of such events decreases (O’Gorman, 2014; Lute et al., 2015; Zarzycki, 2016; Janoski et al., 2018; Ashley et al., 2020).
Ice storm: There is limited evidence in the literature of unique changes in ice storms observed or projected over North America. Groisman et al. (2016) examined 40 years of observations and found weak decreases in freezing rain events over the south-eastern USA in the most recent decade. Ning and Bradley (2015) project that the average snow–rain transition line, which is associated with mixed precipitation, moves 2° latitude northward over Eastern North America by the end of the 21st century under RCP4.5 (4° under RCP8.5; see also Klima and Morgan, 2015).
Hail: There is limited evidence and low agreement for observed changes in the frequency or intensity of North American hail storms. J.T. Allen et al. (2015) and Allen (2018) found that temporal inconsistencies in the US and Canadian hail records made long-term climate analysis difficult, although B.H. Tang et al. (2019) identified an increasing frequency of environmental conditions conducive for large hail (diameter ≥ 5 cm) over the central and eastern USA. There is limited evidence and medium agreement in projections of increased hail damage potential over North America. Some regional and convective-permitting model projections indicate a longer hail season with fewer events and larger hail sizes that result in higher hail damage potential (Brimelow et al., 2017; Trapp et al., 2019).
Snow avalanche: There is limited evidence of directional changes in snow avalanches over North America. Mock and Birkeland (2000) identified a 1969–1995 decrease in snow avalanches over the western United States, although they note the heavy influence of natural variability. A similar decline was observed over western Canada (Bellaire et al., 2016; Sinickas et al., 2016), but clear trends are difficult to discern given sparse observations and shifts in avalanche management. We concur with the SROCC assessment of medium confidence and high agreement that snow avalanche hazards generally decrease at low elevations given lower snowpack, even as high elevations are increasingly susceptible to wet-snow avalanches (Hock et al., 2019; see also Lazar and Williams, 2008).
Observations and projections agree that snow and ice CIDs over North America are characterized by reduction in glaciers and the seasonality of snow and ice formation, loss of shallow permafrost, and shifts in the rain/snow transition line that alters the seasonal and geographic range of snow and ice conditions in the coming decades (very high confidence).
12.4.6.5 Coastal and Oceanic
Relative sea level: Chapter 9 found that observations indicate increasing sea levels along most North American coasts (robust evidence, high agreement), although there is substantial regional variation in relative sea level rise (robust evidence, high agreement). Around North America, over 1900–2018, a new tide gauge-based reconstruction finds a regional mean RSL change of 1.08 [0.79 to 1.38] mm yr–1 in the subpolar North Atlantic, 2.49 [1.89 to 3.06] mm yr–1 in the subtropical North Atlantic, and 1.20 [0.76 to 1.62] in the East Pacific (Frederikse et al., 2020), compared to a GMSL change of around 1.7 mm yr–1Section 2.3.3.3 and Table 9.5). For the period 1993–2018, these RSLR rates, based on satellite altimetry, increased to 2.17 [1.66 to 2.66] mm yr–1, 4.04 [2.77 to 5.24] mm yr–1 and 2.35 [0.70 to 4.06] mm yr–1, respectively (Frederikse et al., 2020), compared to a GMSL change of 3.25 mm yr–1Section 2.3.3.3 and Table 9.5). Relative sea level (RSL) is falling in portions of southern Alaska (Sweet et al., 2018) and much of the northern part of north-eastern Canada and around Hudson Bay (where land is rising by >10 mm/year; Greenan et al., 2018).
Relative sea level rise is virtually certain to continue in the oceans around North America, except in the northern part of north-eastern Canada and portions of southern Alaska. Regional mean RSLR projections for the oceans around North America range from 0.4–1.0 m under SSP1-2.6 to 0.7–1.4 m under SSP5-8.5 for 2081–2100 relative to 1995–2014 (median values), which means that there are locally large deviations from the projected GMSL change (Section 9.6.3.3), including decreases in RSL in northern north-eastern Canada from land uplift (see also Sweet et al., 2017; Greenan et al., 2018; Oppenheimer et al., 2019). The RSLR projections here may however be underestimated due to potential partial representation of land subsidence in their assessment (Section 9.6.3.2).
Coastal flood: Observations indicate that episodic coastal flooding is increasing along many coastlines in North America (robust evidence, high agreement), and this episodic coastal flooding will increase in many North American regions under future climate change (high confidence) although land uplift from glacial isostatic adjustment in northern and Hudson Bay portions of North-Eastern North America leads to only medium confidence of coastal flood increases in that region. Sweet et al. (2018) found 2000–2015 observed increases of about 125% in high-tide flooding frequencies along the southern Atlantic USA coastline, with 75% increases along the USA Gulf Coast and USA northern Atlantic coastlines. That same study noted that a GMSL of 0.5 m in 2100 would increase high tide (‘nuisance’) flooding from current rates of about once a month for most coastal regions to about once every other day along the USA Atlantic and Gulf coasts and smaller increases in frequency along the Pacific coast, and Dahl et al. (2017a) found similar trends on the USA East Coast prior to mid-century. The present day 1-in-50-year ETWL is projected to occur around three times per year by 2100 with an SLR of 1 m all around North America, except in most of Eastern North America where it is expected to have return periods of 1-in-1-year to 1-in-2-years (Vitousek et al., 2017). Ghanbari et al. (2019) projected corresponding shifts towards higher frequencies of major flooding events for 20 US cities. Figure 12.4r and Figure 12.SM.6 show increases of 70 cm or more in the 100-year return period extreme total water level (ETWL) over much of the USA East Coast, British Columbia, Alaska, and the Hudson Bay under RCP8.5 by 2100 (relative to 1980–2014), with lower increases in northern Mexico, northern Canada, Labrador, and the Pacific and Gulf coasts of the USA (Vousdoukas et al., 2018). Projected increases in coastal flooding generally follow patterns of RSL change, although sea ice loss in the north also increases open water storm surge (Greenan et al., 2018).
Coastal erosion: There is limited evidence of changes in North American episodic storm erosion caused by waves and storm surges. Observations show increased extreme wave energy on the Pacific coast, but no clear trend on other USA coasts given substantial natural variability (Bromirski et al., 2013; Vose et al., 2014). In terms of long-term coastal erosion, shoreline retreat rates of around 1 m yr–1have been observed during 1984–2015 along the sandy coasts of NWN and NCA while portions of the US Gulf Coast have seen a retreat rate approaching 2.5 m yr–1 (Luijendijk et al., 2018; Mentaschi et al., 2018). Sandy shorelines along ENA and WNA have remained more or less stable during 1984–2014, but a shoreline progradation rate of around 0.5 m yr–1has been observed in NEN. Mentaschi et al. (2018) report 1984–2015 coastal area land losses of 630 km2 and 1260 km2 along the Pacific and Atlantic coasts of the USA, respectively.
Projections indicate that sandy coasts in most of the region will experience shoreline retreat through the 21st century (high confidence). Median shoreline change projections presented by Vousdoukas et al. (2020b) show that sandy shorelines in NWN, ENA, and NCA will retreat by between 40 and 80 m by mid-century (relative to 2010) under both RCP4.5 and RCP8.5. Projections for NEN and WNA are lower at 20–30 m under the same RCPs. The highest median mid-century projection in the region is for CNA at around 125 m under both RCPs. RCP4.5 projections for 2100 show shoreline retreats of 100 m or more along the sandy coasts of NWN, CNA, and NCA, while retreats of between 40 and 80 m are projected in other regions. Under RCP8.5, retreats exceeding 100 m are projected in all regions except NEN and WNA (approximately 80 m) by 2100, with particularly high retreats in NWN (160 m) and CNA (330 m). The total length of sandy coasts in North America that are projected to retreat by more than a median of 100 m by 2100 under RCP4.5 and RCP8.5 is about 15,000 km and 25,000 km respectively, an increase of approximately 70%.
Marine heatwave: There is high confidence in observed increases in marine heatwave (MHW) frequency and future increases in marine heatwaves are very likely around North America (Box 9.2). The total number of MHW days per decade increased in the North American coastal zone, albeit somewhat more in the Pacific (Oliver et al., 2018; Smale et al., 2019). Projected increases in degree heating weeks (Heron et al., 2016) and degree heating months (Frieler et al., 2013) indicate increasing bleaching-level and mortality-level heating stress threshold events for reefs in Florida and Mexico.
Mean SST is projected to increase by 1°C (3°C) around North America by 2100, with a hotspot of around 4°C (5°C) off the North American Atlantic coastline under RCP4.5 (RCP8.5) conditions (see Interactive Atlas). Frölicher et al. (2018) projected increasing MHW frequency and spatial extent at a 2°C global warming level with the largest increases in the Gulf of Mexico and off the southern USA East Coast (>20×) as well as off the coast of the Pacific Northwest (>15×). Projections for SSP1-2.6 and SSP5-8.5 both show an increase in MHWs around North America by 2081–2100, relative to 1985–2014 (Box 9.2, Figure 1).
There is high confidence that most coastal CIDs in North America will continue to increase in the future with climate change. An observed increase in relative sea level rise is virtually certain to continue in North America (other than around the Hudson Bay and southern Alaska) contributing to more frequent and severe coastal flooding in low-lying areas (high confidence) and shoreline retreat along most sandy coasts (high confidence). Marine heatwaves are also expected to increase all around the region over the 21st century (high confidence).
The assessed direction of change in climatic impact-drivers for North America and associated confidence levels are illustrated in Table 12.8.
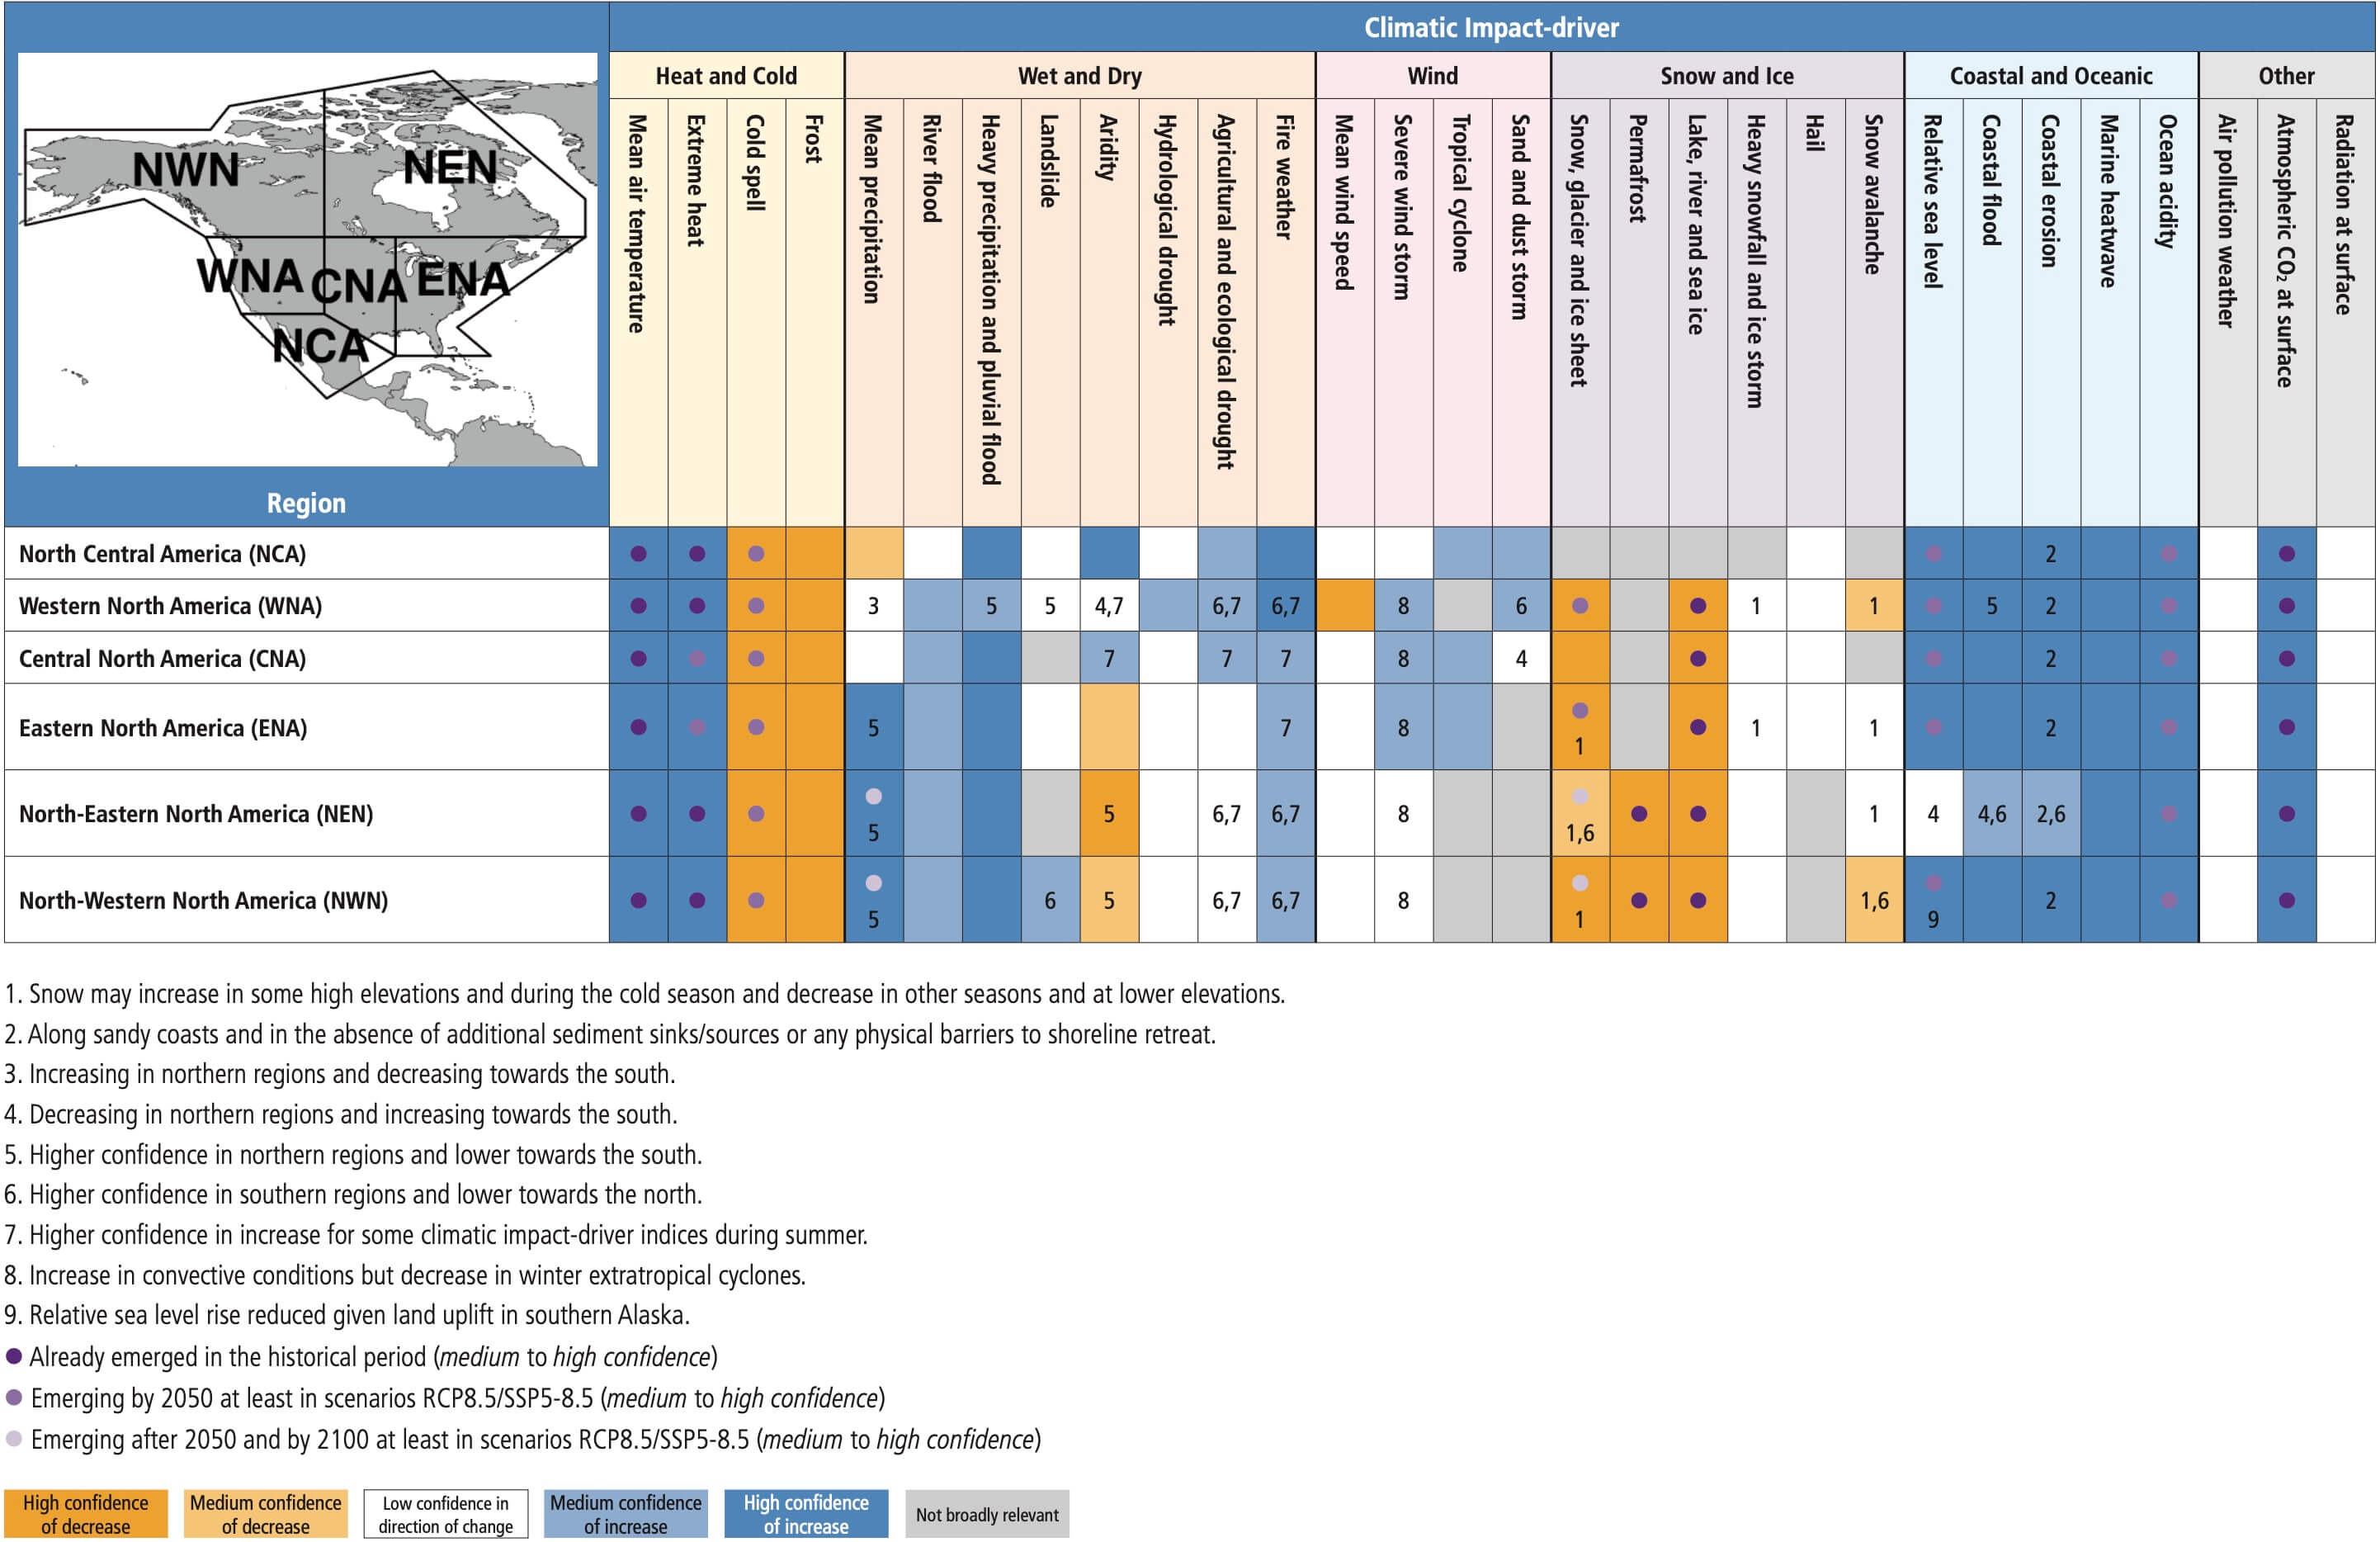
12.4.7 Small Islands
This section covers the climatic impact-drivers affecting small islands around the world (see definition of SIDS in the Glossary; Cross-Chapter Box Atlas.2) with a particular focus on small islands in the Caribbean (CAR) Sea and the Pacific Ocean. Caribbean and Pacific small islands have mostly tropical climates and local conditions are also influenced by diverse topography ranging from low-lying islands and atolls to volcanic and mountainous terrain. Climate variability in these islands is influenced by the trade winds, easterly waves, tropical cyclones (TC), and the migrations of the Inter-tropical Convergence Zone (ITCZ), the North Atlantic Subtropical High, and the South Pacific Convergence Zone (SPCZ), and other modes of climate variability as discussed in Cross-Chapter Box Atlas.2. Furthermore, changes in the ocean temperature and chemistry, and relative sea level have strong impacts on these small islands given their geographical location and dependence on coastal and marine ecosystem services.
The AR5 recognized the heterogeneity in these small islands in terms of physical geography, socio-economic and cultural backgrounds, as well as their vulnerability to the impacts of climate change. Similar to previous reports, these regions have been assessed together in this section, given the similarities in the challenges they face in addressing climate change impacts and risk, which were thought – until AR4 – to be dominated by sea level rise (Nurse et al., 2014; Betzold, 2015). Since then there has been a substantial increase in the number and complexity of the literature on the drivers and impacts of climate change on small islands (BOM and CSIRO, 2011, 2014; Nurse et al., 2014; Gould et al., 2018; Keener et al., 2018). There are also increasing efforts being made to produce higher resolution climate projections for small islands through downscaling methods (Elison Timm et al., 2015; McLean et al., 2015; Khalyani et al., 2016; C. Zhang et al., 2016; Stennett-Brown et al., 2017; Bhardwaj et al., 2018; Bowden et al., 2021).
The AR5 identified the key climate and ocean-related hazards affecting small islands, which occur at different time scales and have diverse impacts on multiple sectors (Christensen et al., 2013; Nurse et al., 2014). Recent findings from SR1.5 and SROCC emphasize that the multiple interrelated climate hazards currently faced by low-lying islands and coastal areas will be amplified in the future, especially at higher global warming levels (Hoegh-Guldberg et al., 2018; IPCC, 2019b).
12.4.7.1 Heat and Cold
Mean air temperature: Significant warming trends are clearly evident in the small islands, such as those in the Pacific, CAR, and western Indian Ocean, particularly over the latter half of the 20th century (see Figure Atlas.11; Atlas.10.2; Cross-Chapter Box Atlas.2, Table 1). This observed warming signal in the tropical western Pacific has been attributed to anthropogenic forcing (Wang et al., 2016). There is high confidence of warming over small islands even at 1.5°C GWL (Atlas.10.4 and Figure Atlas.28; Hoegh-Guldberg et al., 2018). Mean temperature is very likely to increase by 1°C–2°C (2°C–4°C) by 2041–2060 (2081–2100) under RCP8.5 (BOM and CSIRO, 2014) and SSP3-7.0 (Atlas.10.4, Figure 4.19 and Figure Atlas.12; Almazroui et al., 2021).
Extreme heat: Observational records indicate warming trends in the temperature extremes since the 1950s in CAR and the Pacific small islands (high confidence) (Sections 11.3.2 and 11.9, and Table 11.13). A detectable anthropogenic increase in summer heat stress has been identified over a number of island regions in CAR, western tropical Pacific, and tropical Indian Ocean, based on wet bulb globe temperature (WBGT) index trends for 1973–2012 (medium confidence) (Knutson and Ploshay, 2016). An increasing trend in the maximum daytime heat index is also noted in CAR during the 1980–2014 period, as well as more extreme heat events since 1991 (Ramirez-Beltran et al., 2017).
Compared with the recent past, it is likely that the intensity and frequency of hot (cold) temperature extremes will increase (decrease) in the small islands (Section 11.9 and Table 11.13; BOM and CSIRO, 2014). Warm spell conditions will occur up to half the year in CAR at 1.5°C GWL with an additional 70 days at 2°C (Hoegh-Guldberg et al., 2018; Taylor et al., 2018), with livestock temperature–humidity tolerance thresholds increasingly surpassed (Lallo et al., 2018). In CAR, a median increase of more than a month per year where temperatures exceed 35°C is projected by end of the 21st century under SSP5-8.5 (Figure 12.4a–c and Figure 12.SM.1). Heatwaves are projected to increase in CAR by the mid- and end-century under RCP8.5 (Sections 11.3.5 and 11.9, and Table 11.13). Figure 12.4d–f and Figure 12.SM.2 also show an increase of about 30–60 days in which HI exceeds 41°C by 2041–2060 under SSP5-8.5 relative to 1995–2014 in CAR, with an additional increase of about 50–100 days by end of the 21st century for RCP8.5/SSP5-8.5, but this increase remains below 50 days for RCP2.6/SSP1-2.6. The Pacific Islands region is also among those projected to have an increase in WBGT by end-century under RCP8.5, increasing the risk of heat stress in the region (Newth and Gunasekera, 2018).
It is very likely that the significant recent warming trends observed in the small islands will continue in the 21st century, which will likely further increase heat stress in these regions.
12.4.7.2 Wet and Dry
Mean precipitation: Observational datasets have generally revealed no significant long-term trends in rainfall in the Caribbean over the 20th century when analysed at seasonal and inter-decadal timescales, except for some areas where there is evidence for decreasing trends for the period 1901–2010 but not for the period 1951–2010 (Cross-Chapter Box Atlas.2, Table 1, and Atlas.10.2; Knutson and Zeng, 2018). Although there are spatial variations, annual rainfall trends in the western Indian Ocean are mostly decreasing, with generally non-significant trends in the western tropical Pacific since the 1950s (low confidence). Significant drying trends are noted in the southern Pacific subtropics and south-western French Polynesia during the 1951–2015 period (McGree et al., 2019), and in some areas of Hawaii during the 1920–2012 period (medium confidence) (Cross-Chapter Box Atlas.2, Table 1, and Atlas.10.2).
Atlas.10.4 projects precipitation reduction over the Caribbean (high confidence) (Almazroui et al., 2021) and parts of the Atlantic and Indian oceans, particularly in June to August, by end of 21st century under SSP5-8.5. Precipitation is generally projected to increase under SSP5-8.5 and for higher GWLs in the small islands in parts of the western and equatorial Pacific, but there is low confidence in broad changes given drier conditions projected for the southern subtropical and eastern Pacific Ocean (limited agreement given spatial and seasonal variability) (Atlas.10.4 and Figure Atlas.28).
River flood: There is limited evidence on observed changes in river flooding in the small islands. Long-term records in Hawaii indicate no clear trends in peak flow, except for the significant decrease in peak streamflow in Hawaii Island over the period 1967–2016 (Bassiouni and Oki, 2013; Clilverd et al., 2019). Similarly, there is no significant trend in the frequency and height (after adjusting for average sea level rise) of river flood in Fiji over the period 1892–2013 (McAneney et al., 2017). There is low confidence on the direction of future change of river flooding in the small islands due to the limited literature. In Oahu, Hawaii, extreme peak flow events with high return periods are projected to increase by end of the 21st century under RCP8.5, but there is also high uncertainty in these projections (Leta et al., 2018).
Heavy precipitation and pluvial flood: Heavy precipitation days in CAR have increased in magnitude, and have been more frequent in the northern part during the latter part of the 20th century (low confidence) (Section 11.4.2 and Table 11.14). The direction of change in extreme precipitation varies across the Pacific and depends on the season (low confidence) (Section 11.4.2 and Cross-Chapter Box Atlas.2, Table 1). Although pluvial flooding events have been observed in some islands, there is limited evidence for an assessment on past changes in pluvial flooding, unlike in other regions. There is low confidence in the projected change in magnitude of very heavy precipitation days in CAR across different GWLs (Table 11.14). On the other hand, there is high confidence in the increase in frequency and intensity of extreme rainfall events (i.e., 1-in-20-year rainfall events) in the western tropical Pacific in the 21st century, even for RCP2.6 scenario, based on model agreement and mechanistic understanding but low confidence in the magnitude of change in extreme rainfall due to model bias (BOM and CSIRO, 2014).
Landslide: Heavy rainfall, such as from tropical cyclones, can trigger landslides over steep terrain in the small islands (Bessette-Kirton et al., 2019). There is limited evidence to determine long-term trends in rainfall-induced landslides in the small islands (Kirschbaum et al., 2015; Sepúlveda and Petley, 2015; Froude and Petley, 2018; Bessette-Kirton et al., 2019). There is low confidence in future changes in landslides in the small islands. The direction of change may depend on future changes in precipitation, tropical cyclones, climate modes (e.g., El Niño–Southern Oscillation, ENSO), as well as human disturbance, but more data and understanding of the complexity of these relationships are needed, especially in these vulnerable areas (Sepúlveda and Petley, 2015; Gariano and Guzzetti, 2016; Froude and Petley, 2018).
Aridity: Current estimates identify many small islands as being under water stress and thus particularly sensitive to variations in rainfall and groundwater, population growth and demand, and land-use change, among others (Cross-Chapter Box Atlas.2; Holding et al., 2016). From 1950 to 2016, a heterogeneous but prevalent drying trend is found in CAR (low confidence), where drought variability is modulated by the tropical Pacific and North Atlantic oceans (Table 11.15 and Cross-Chapter Box Atlas.2, Table 1; Herrera and Ault, 2017). In the future, increased aridity and decreased freshwater availability are projected in many small islands due to higher evapotranspiration in a warmer climate that partially offsets increases or exacerbates reductions in precipitation (Karnauskas et al., 2016, 2018b; Hoegh-Guldberg et al., 2018). Increased aridity is projected for the majority of the small islands, such as in CAR, southern Pacific and western Indian Ocean, by 2041–2059 relative to 1981–1999 under RCP8.5 or at 1.5°C and 2°C GWLs, which will further intensify by 2081–2099 (medium confidence) (Karnauskas et al., 2016, 2018b). Groundwater recharge is projected to increase in Maui, Hawaii except on the leeward side of the island, which underscores the importance of topography and elevation on freshwater availability in different island microclimates (Brewington et al., 2019; Mair et al., 2019).
Hydrological drought: There is low confidence of widespread changes to hydrological drought in CAR or Pacific small islands in recent decades, although an increasing number of studies document local changes. Records in Hawaii indicate downward trends in low streamflow and base flow from 1913 to 2008 (Bassiouni and Oki, 2013). Decadal variability of Hawaiian streamflow coincides with rainfall fluctuations associated with the Pacific Decadal Variability although significant average declines in surface and baseflow runoff of about 8% and 11% per decade, respectively, have been noted during the 1987–2016 period (Clilverd et al., 2019).
There is low confidence in hydrological drought change projections, given low signal-to-noise ratios and the challenge in representing island scales in global analyses. Prudhomme et al. (2014) recognized CAR as one of the regions with the highest increase in regional deficit index (RDI; a measure of the fraction of area in hydrological drought conditions) by the end of the 21st century under RCP8.5. Daily streamflow and extreme low flows in two watersheds in Oahu, Hawaii are projected to decline by mid- and end of the 21st century under RCP4.5 and RCP8.5, which would result in more frequent hydrological droughts in this area (Leta et al., 2018).
Agricultural and ecological drought: Recent trends toward more frequent and severe droughts have been noted in the small islands but only with low confidence in broad trend patterns, given high spatial variability including heightened drought on the leeward side of islands (e.g., Frazier and Giambelluca, 2017; Herrera and Ault, 2017; McGree et al., 2019; see Table 11.15, Cross-Chapter Box Atlas.2, Table 1). Agricultural and ecological droughts are projected to increase in frequency, duration, magnitude, and extent in small islands, such as in CAR (medium confidence) and parts of the Pacific (low confidence), particularly where future declines in precipitation are compounded by higher evapotranspiration, under increasing levels of warming (Naumann et al., 2018; Taylor et al., 2018; Vichot-Llano et al., 2021). Relative to the period 1985–2014, decreases in annual surface and total column soil moisture become more robust in more areas in CAR by 2071–2100 under SSP3-7.0 and SSP5-8.5 scenarios (B.I. Cook et al., 2020), but reliably representing drought features in small island domains with global simulations is challenging (see also Section 11.9).
Fire weather: There is limited evidence on trends in wildfire in CAR and the Pacific. Records of wildfire in Hawaii from 2005 to 2011 indicate a peak in area burned during the hot and dry summer months, but Trauernicht et al. (2015) note the difficulty in establishing the link between past climate and wildfire trends due to human activities and vegetation changes. Availability of literature limits assessment on future fire weather in the small islands. Drying and warming trends tend to increase fire probability aside from the climate impact on fuel loading, for example, grassland fires in Hawaii (Trauernicht, 2019), and wildfires in Puerto Rico (Van Beusekom et al., 2018).
Observed and projected rainfall trends vary spatially across the small islands. Higher evapotranspiration under a warming climate are projected to partially offset future increases or amplify future reductions in rainfall, resulting in drier conditions and increased water stress in the small islands (medium confidence).
12.4.7.3 Wind
Mean wind speed: Scarcity of observations limits assessment of long-term changes in winds over the small islands in the Pacific and CAR. Records indicate that average daily wind speeds have slowly declined in Hawaii, but have remained constant across western and southern Pacific sites since the mid-20th century (Marra and Kruk, 2017). Recent studies of reanalyses and hindcast simulations indicate an intensification of the Pacific trade winds during the 1992–2011 period, which contributed to the ocean cooling in the tropical central and eastern Pacific (England et al., 2014; Takahashi and Watanabe, 2016). Projections estimate up to 0.4 m s–1 (8%) increase in annual winds in CAR under RCP8.5, which is associated with changes in the extension of the North Atlantic Subtropical High that enhances the Caribbean low-level jet during the wet season, and stronger local easterlies due to enhanced land–ocean temperature differences in the dry season (Costoya et al., 2019) (low confidence).
Tropical cyclone: Tropical cyclones have devastating impacts on the small islands due to intense winds, storm surge and rainfall, although the associated rainfall can also be beneficial for freshwater resources. It is likely that tropical cyclone intensity and intensification rates at a global scale have increased in the past 40 years but it is not clear if regional-scale changes are basin-wide or due to shifts in tropical cyclone tracks (Section 11.7.1.2). Other, less data-sensitive tropical cyclone features, such as the poleward migration of where tropical cyclones reach peak intensity in the western North Pacific since the 1940s (medium confidence) and the slowdown in tropical cyclone translational speed over contiguous USA since 1900 (medium confidence), can affect rainfall and flooding over small islands in CAR and the Pacific (Section 11.7.1.2).
Projections of global changes in tropical cyclones indicate more frequent Category 4–5 storms (high confidence) and increased rain rates (high confidence) (Knutson et al., 2020), with relative sea level rise exacerbating storm surge potential, but with large regional differences (see Section 11.7.1.5). By the late 21st century, tropical cyclones are projected to be less frequent in the basins of the western and eastern North Pacific, Bay of Bengal, Caribbean Sea and in the Southern Hemisphere, but will be more frequent in the subtropical central Pacific (Murakami et al., 2014; Yoshida et al., 2017; Bell et al., 2019; Knutson et al., 2020). Over CAR, tropical cyclone intensity is expected to increase by the end of the century under RCP8.5 due to higher sea surface temperatures but can be inhibited by increases in vertical wind shear in the region (medium confidence) (Kossin, 2017; Ting et al., 2019). The poleward movement of the area in which tropical cyclones reach peak intensity in the western North Pacific is likely to continue, which affects the tropical cyclone frequency over the small islands in the area (Section 11.7.1.5; Kossin et al., 2016). Projections also indicate an increase (decrease) in the tropical cyclone frequency during El Niño (La Niña) events in the Pacific at the end of the 21st century (Chand et al., 2017). RCP8.5 2080–2099 projections indicate a 2% increase in the number of tropical cyclones in the north-central Pacific relative to 1980–1999, with tracks shifting northward towards Hawaii (N. Li et al., 2018). Given projected reductions to the overall number of tropical cyclones but increases in storm intensity, total rainfall and storm surge potential, we assess medium confidence of overall changes to tropical cyclones affecting the Caribbean and Pacific small islands.
Projections indicate that small islands will generally face fewer but more intense tropical cyclones (medium confidence) although there is substantial variability across small island regions given projected regional shifts in storm tracks.
12.4.7.4 Coastal and Oceanic
Relative sea level: Relative sea level rise (RSLR) continues to be a major threat to small islands and atolls, since it can exacerbate the impacts of other climate hazards on low-lying coastal communities and infrastructures, ecosystems, and freshwater resources (Nurse et al., 2014; Hoegh-Guldberg et al., 2018). In the Indian Ocean–South Pacific region, a new tide gauge-based reconstruction finds a regional mean RSL change of 1.33 [0.80 to 1.86] mm yr–1 over 1900–2018 (Frederikse et al., 2020) compared to a GMSL change of around 1.7 mm yr–1Section 2.3.3.3 and Table 9.5). RSLR rates based on satellite altimetry for the period 1993–2018 in the region increased to 3.65 [3.23 to 4.08] mm yr–1 (Frederikse et al., 2020), compared to a GMSL change of 3.25 mm yr–1Section 2.3.3.3 and Table 9.5).
Relative sea-level rise is very likely to continue surrounding the oceans in the Small Island States. Around the small islands, regional mean RSLR projections vary widely, from 0.4–0.6 m under SSP1-2.6 to 0.7–1.6 m under SSP5-8.5 for 2081–2100 relative to 1995–2014 (median values), but in general they are situated in areas with RSL changes ranging from the mean projected GMSL change to above-average values (Section 9.6.3.3). These RSLR projections may however be underestimated due to potential partial representation of land subsidence in their assessment (Section 9.6.3.2).
Coastal flood: Relative sea level rise, storm surges and swells contribute to coastal inundation in the small islands, where studies on historical trends in coastal flooding are currently limited. For example, a swell event due to distant extratropical cyclones in December 2008 raised extreme water levels leading to flooding affecting five Pacific island nations: Marshall Islands, Micronesia, Papua New Guinea, Kiribati and Solomon Islands (Hoeke et al., 2013; Merrifield et al., 2014). Over low-lying atoll islands in the north-west tropical Pacific, potential increases in the frequency and areal extent of coastal flooding, especially at higher SLR scenarios, are expected to have negative consequences for freshwater resources and island habitability (Storlazzi et al., 2015, 2018). Select tide gauges across the Pacific also indicate increasing trends in the frequency of minor flooding since the 1960s (Marra and Kruk, 2017).
As relative sea levels increase, the potential for coastal flooding increases in the small islands (high confidence). Across the Pacific and CAR small islands, the 5–95th percentile range of the 1-in-100-year ETWL is projected to increase (relative to 1980–2014) by 10–35 cm and by 14–41 cm by 2050 under RCP4.5 and RCP8.5, respectively (Figure 12.4q). By 2100, this range is projected to be 27–81 cm and 44–188 cm under RCP4.5 and RCP8.5, respectively (Figure 12.4p,r; Vousdoukas et al., 2018; Kirezci et al., 2020). Furthermore, by 2050, the present-day 1-in-100-year ETWL is projected to have median return periods of between 1-in-1-year and 1-in-50-year in both the Pacific and CAR small islands, with some Pacific islands projected to experience the present-day 1-in-100-year ETWL more than once a year (Vousdoukas et al., 2018; Oppenheimer et al., 2019). By 2100, the present-day 1-in-50-year ETWL is projected to occur around three times a year by 2100 with an SLR of 1 m at Pacific and CAR small islands (Vitousek et al., 2017). In the western tropical Pacific, the magnitude and frequency of coastal flooding due to SLR can be modulated by changes in the wave climate (Shope et al., 2016).
Coastal erosion: Recent studies have indicated variable and dynamic changes in shorelines of reef islands (medium confidence), including both erosion and accretion, which suggest factors other than SLR affecting shoreline changes, such as in the central and western Pacific within the past 50-to-60-year timeframe (Webb and Kench, 2010; Le Cozannet et al., 2014; Ford and Kench, 2015; Duvat and Pillet, 2017). For example, islands on atolls in the central and western Pacific have not substantially eroded or reduced in size in the past decades while sea level has been rising, but their position and morphology have changed due to anthropogenic factors (e.g., seawalls, reclamation) and climate–ocean processes (Biribo and Woodroffe, 2013; McLean and Kench, 2015). Analysis of aerial and satellite imagery revealed severe shoreline retreat in six islands and the disappearance of five vegetated reef islands in Solomon Islands in the western Pacific between 1947 and 2014, which may be due to the interaction between SLR and waves (Albert et al., 2016). In French Polynesia, changes in shoreline and island area have been observed since the 1960s, partly due to the effect of TCs on sediment changes and human activities (Duvat and Pillet, 2017; Duvat et al., 2017). Coastal erosion has also been noted over the small, low-lying, sandy islands, such as in French Polynesia and Solomon Islands, among others (Luijendijk et al., 2018; Mentaschi et al., 2018). Average shoreline retreat rates between 1 and 2 m yr–1 are estimated for the islands in the equatorial Pacific and in CAR, while a retreat rate of 0.5 m yr–1is estimated for islands in the South Pacific, based on satellite observations from 1984–2016 (Luijendijk et al., 2018; Mentaschi et al., 2018). There was also a loss of 610 km2 compared with a gain of 520 km2 in coastal area in Oceania during the 1984–2015 period (Mentaschi et al., 2018).
Projections indicate that shoreline retreat will occur over most of the small islands in the Pacific and CAR throughout the 21st century with spatial variability (high confidence). Median shoreline change projections (CMIP5) relative to 2010, presented by Vousdoukas et al. (2020b), show that, by mid-century, shorelines in the islands in the equatorial Pacific and South Pacific will retreat by around 40 m, under both RCP4.5 and RCP8.5. In CAR islands, sandy shorelines are projected to retreat by about 80 m by mid-century under both RCPs. By 2100, more than 100 m of median shoreline retreat is projected for all small islands under both RCPs; notably in CAR where retreats approaching 200 m (relative to 2010) are projected under both RCPs. The total length of sandy coasts in CAR and Pacific small islands that is projected to retreat by more than a median of 100 m by 2100 under RCP4.5 and RCP8.5 is about 1100 km and 1200 km respectively, an increase of approximately 14%.
Marine heatwave: Ocean temperatures from satellite observations noted a moderate increase of 1–4 annual marine heat wave (MHW) events between 1982–1988 and 2000–2016 over some areas in the Indian Ocean, subtropical parts of the North and South Atlantic, and central and western parts of the North and South Pacific, but a decrease in frequency (two annual events) over the eastern Pacific Ocean (Box 9.2; Oliver et al., 2018). The intensity of MHWs has also increased between 0.2°C and 0.5°C over the equatorial portions of the North Atlantic and the South Pacific. Over the eastern tropical Pacific, the decrease in intensity and duration of MHW is between 0.5°C and 1.0°C and between 30 and 75 days, respectively (Box 9.2; Oliver et al., 2018). There is high confidence that MHWs will increase around all small island nations. Marine heatwaves are projected to be more intense and prolonged where the largest changes are noted in the equatorial region with maximum annual intensities up to 1.2°C (1.8°C) and annual mean duration reaching 100 days (200 days) at 1.5°C (2.0°C) warming levels (Frölicher et al., 2018). Projections for SSP1-2.6 and SSP5-8.5 both show an increase in MHWs around all small island nations by 2081–2100, relative to 1985–2014 (Box 9.2, Figure 1).
In summary, relative sea level rise is very likely in the oceans around small islands, and along with storm surges and waves will exacerbate coastal inundation in small islands. Shoreline retreat is projected along sandy coasts of most small islands (high confidence). There is high confidence that MHWs will increase around all small island nations.
The assessed direction of change in climatic impact-drivers for CAR and Pacific small islands and associated confidence levels are illustrated in Table 12.9. Cold, snow, and ice-related climatic impact-drivers, and sand and dust storms are not broadly relevant in the small islands that were assessed.
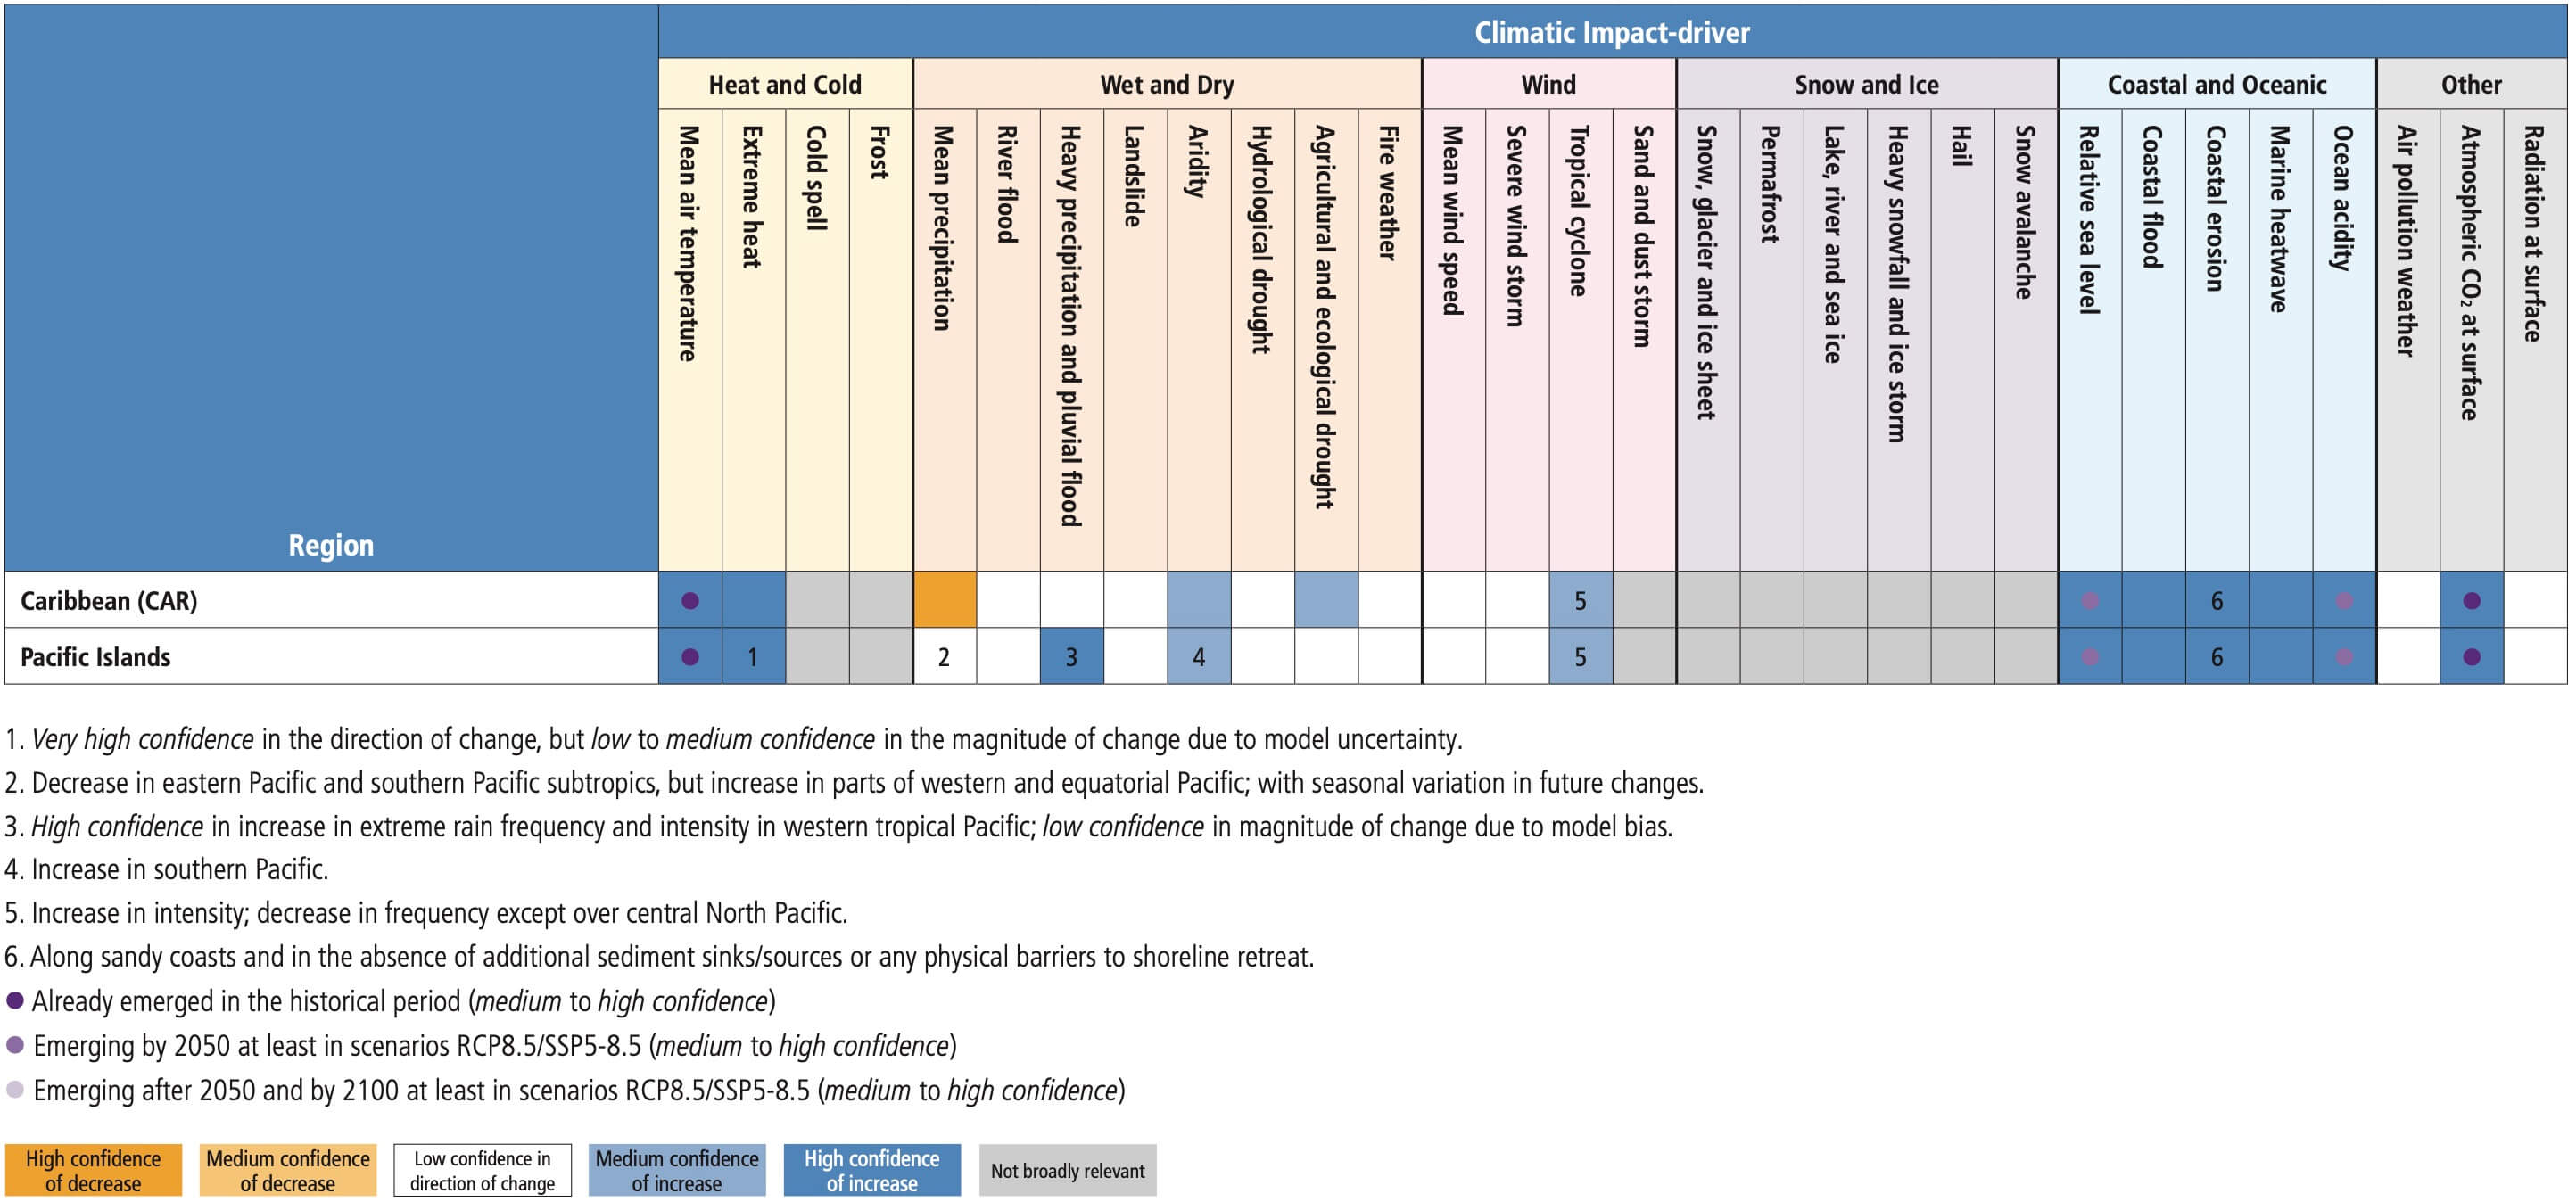
12.4.8 Open and Deep Ocean
Oceans face challenges from anthropogenic perturbations to the global Earth system, which cause increasing ocean warming, carbon dioxide-induced acidification and oxygen loss (Bindoff et al., 2019). Climate change will affect the major oceanic CIDs described in Section 12.2: mean ocean temperature, marine heatwave, ocean acidity, ocean salinity, and dissolved oxygen (O2), as well as severe wind storm and sea ice. These changes result in a shifting profile of hazards relevant to impact and risk assessments (Section 12.3). New evidence, the SROCC (IPCC 2019b) assessments and advances in the new CMIP6 climate simulations reinforce confidence in projected changes in climatic impact-drivers in the global oceans. As the ocean has taken up about 90% of the global warming for the period 1971–2018 (Section 7.2.2.2), the emergence of the sea surface temperature increase signal has already been observed in global oceans over the last century (Hawkins et al., 2020). The signal in sea ice extent decrease has already emerged in the Arctic Ocean (Landrum and Holland, 2020), while ocean acidification and low oxygen have also already emerged in many oceanic regions and will emerge in all global oceans by 2050 under RCP8.5 (Section 12.5.2 and Table 12.10). This section assesses key climatic impact-drivers that can be linked with sectoral and regional vulnerability and exposure in open and deep oceans, drawing from previous Chapters (Chapters 2, 3, 4, 5 and 9).
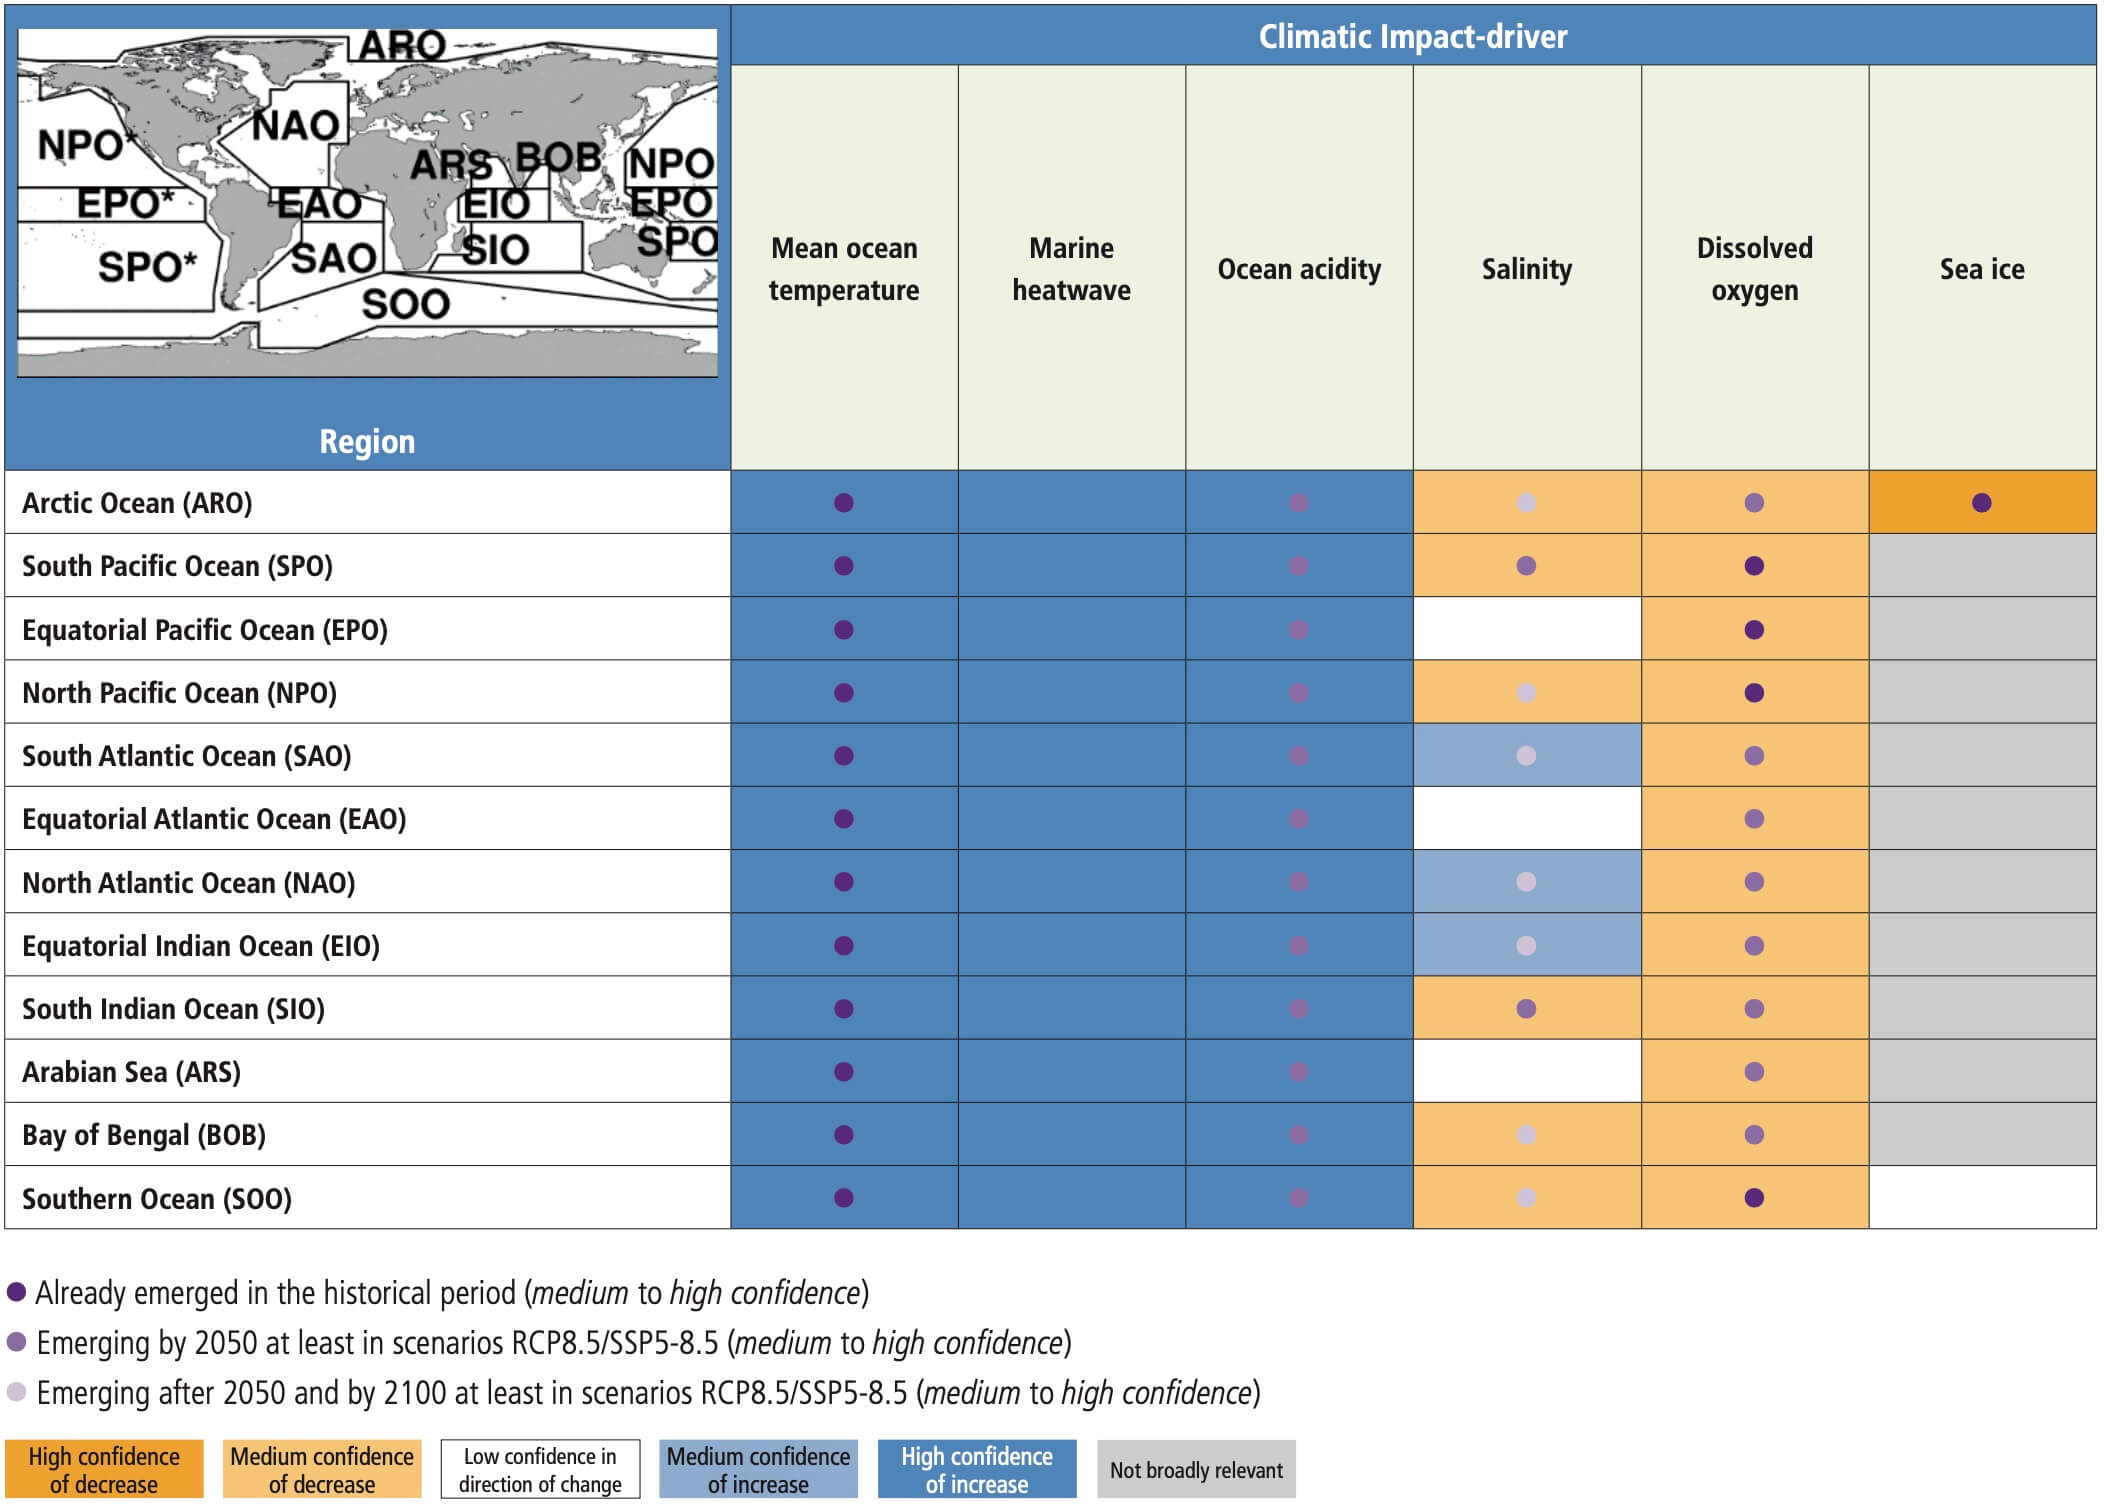
Mean ocean temperature: It is very likely that global mean sea surface temperature (SST) has increased by 0.88 [0.68 to 1.01] °C from 1850–1900 to 2011–2020, and 0.60 [0.44 to 0.74] °C from 1980 to 2020 (Section 2.3.1.1.6 and Table 2.4). There is very high confidence that the Indian Ocean, the western equatorial Pacific Ocean, and western boundary currents have warmed faster than the global average, while the Southern Ocean, the eastern equatorial Pacific, and the North Atlantic Ocean have warmed more slowly or slightly cooled (Section 9.2.1.1). It is virtually certain that global mean SST will continue to increase in the 21st century at a rate depending on future emissions scenario, with CMIP6 projections indicating an increase of 0.86°C (likely range 0.43°C–1.47°C) under SSP1-2.6 and 2.89°C (2.01°C–4.07°C) under SSP5-8.5, by 2081–2100, relative to 1995–2014 (Section 9.2.1.1). Global warming of 2°C above pre-industrial levels is projected to increase SST, resulting in the exceedance of numerous hazard thresholds for pathogens, seagrasses, mangroves, kelp forests, rocky shores, coral reefs and other marine ecosystems (medium confidence) (Poloczanska et al., 2013a, b, 2016; Liu et al., 2014; Pörtner et al., 2014; Graham et al., 2015; Schoepf et al., 2015; Gobler et al., 2017; Henson et al., 2017; Hoegh-Guldberg et al., 2017; Krueger et al., 2017; Hughes et al., 2018a, b; Perry et al., 2018). It is virtually certain that upper-ocean stratification has increased at a rate of 4.9 ± 1.5% during 1970–2018 and that this will continue to increase in the 21st century (Section 9.2.1.3), potentially leading to reduced nutrient supply and total productivity (low confidence) (Moore et al., 2018).
Marine heatwave: Marine heatwaves (MHWs) have increased in frequency over the 20th century, with an approximate doubling since the 1980s (high confidence), and their intensity and duration have also increased (medium confidence) (Box 9.2). Projections show that this increasing trend likely continues with 2–9 times more frequent MHWs (at global scale) projected by 2081–2100, relative to 1995–2014 under SSP1-2.6, and 4–18 times more frequent MWHs under SSP5-8.5. The largest changes in MHW frequency are likely to occur in the tropical ocean and the Arctic, while there is medium confidence of moderate increases in the mid-latitudes, and of small increases in the Southern Ocean (Box 9.2). Permanent MHWs (more than 360 days per year, relative to the historical climate conditions) are projected to occur in the 21st century in parts of the tropical ocean, in the Arctic Ocean, and around latitude 45°S, under SSP5-8.5 (Box 9.2). The occurrence of such permanent MHWs can be largely avoided under the SSP1-2.6 scenario (Box 9.2). MHWs can have devastating and long-term impacts on ecosystems (Oliver et al., 2018), making them an emerging hazard for marine ecosystems (Frölicher and Laufkötter, 2018; Smale et al., 2019). A series of MHWs that occurred in 2010–2011 had consequences for seagrass in western Australia (Wernberg et al., 2013; Arias-Ortiz et al., 2018), and for the lobster fishery in the Gulf of Maine (Pershing et al., 2018). The MHWs that occured western Australia in 2015/2016 led to the third-highest mass coral bleaching globally (Le Nohaïc et al., 2017).
Ocean acidity: With the increasing CO2 concentration, the global mean ocean surface pH is decreasing and is now the lowest it has been for at least a thousand years (very high confidence) (Section 2.3.3.5). It is very likely that, since the 1980s, ocean surface pH has changed at a rate of –0.016 to –0.019 per decade in the subtropical open oceans, at –0.010 to –0.026 per decade in the tropical Pacific, and at –0.003 to –0.026 per decade in open subpolar and polar zones (Sections 2.3.3.5 and 5.3.3.2). Over the period 1870–1899 to 2080–2099, ocean surface pH is projected to decline by –0.16 ± 0.002 under SSP1–2.6, and by –0.44 ± 0.005 under SSP5-8.5 (Sections 4.3.2.5 and 5.3.4.1). Declining ocean pH will exacerbate negative impacts on marine species (medium confidence) (Albright et al., 2016; Kwiatkowski et al., 2016; Watson et al., 2017).
Ocean salinity: Salinity contrasts have increased since the 1950s, near the ocean surface (virtually certain) and in the subsurface (very likely) , with high-salinity regions becoming more saline and low-salinity regions becoming fresher (Section 2.3.3.2). At the basin scale, it is very likely that the Pacific and the Southern Oceans have freshened and that the Atlantic has become more saline (Section 2.3.3.2). The SROCC (IPCC 2019b) assessment that a general pattern of fresh ocean regions getting fresher and salty ocean regions getting saltier will continue in the 21st century is confirmed in Section 9.2.2.2.
At the regional scale, by 2100 the average Arctic surface salinity is projected to decrease by 1.5 ± 1.1 psu (practical salinity units), and the liquid freshwater column in the Arctic Ocean is projected to increase by 5.4 ± 3.8 m under RCP8.5, (Shu et al., 2018). In the Indian Ocean, sea surface salinity is projected to decrease by between 0.49 and 0.75 psu by 2080, compared to 2015, under RCP2.6 and RCP2.6, respectively (Akhiljith et al., 2019). Projections for the North and South Atlantic oceans indicate increasing salinity in the upper layer (0–500 m) under both RCP4.5 and RCP8.5, due to the decreasing freshwater input from the equator and increasing net evaporation (Skliris et al., 2020). There is medium confidence that fresh ocean regions (Pacific, Southern and Indian oceans) will get fresher and salty ocean regions (Atlantic Ocean) will get saltier over the 21st century (Section 9.2.2.2; IPCC, 2019b). Ocean warming and high-latitude surface freshening is projected to continue to increase upper-ocean stratification in the 21st century (Section 9.2.1.3).
Dissolved oxygen: Since the middle of the 20th century, oxygen concentrations of open and coastal waters have been declining, and such deoxygenation affects biological and biogeochemical processes in the ocean (Schmidtko et al., 2017). In recent decades, low-oxygen zones in ocean ecosystems have expanded, and projections indicate an acceleration with global warming (medium confidence) (Diaz and Rosenberg, 2008; Gilly et al., 2013; Gobler et al., 2014). A 2% loss (4.8 ± 2.1 pmoles O2) in total dissolved oxygen in the upper ocean layer (100–600 m) has been observed during 1970–2010 (Section 2.3.4.2), with the highest oxygen loss of up to 30 mol m–2 per decade in the equatorial and North Pacific, the Southern Ocean and the South Atlantic Ocean (Section 5.3.3.2). Global mean ocean oxygen concentration is projected to decrease by 6.36 ± 2.92 mmol m–3under SSP1-2.6 and by 13.27 ± 5.28 mmol m–3under SSP5-8.5 in the subsurface (100–600 m) by 2080–2099, compared to 1870–1899, which is respectively 71% and 40% greater than previous estimates based on CMIP5 models (Section 5.3.3.2). In the benthic ocean, projected future losses of dissolved oxygen concentration by 2080–2099, compared to 1870–1899, are −5.14 ± 2.04 mmol m−3under SSP1-2.6 and −6.04 ± 2.19 mmol m−3under SSP5-8.5 (Kwiatkowski et al., 2020). Section 5.3.3.2 assessed very likely global decreases in ocean oxygen concentrations although there is medium confidence in specific regional declines that are expected to expand both anoxic and hypoxic zones, with such reductions of oxygen expected to persist for thousands of years (Yamamoto et al., 2015; Frölicher et al., 2020).
Sea ice: The Arctic sea ice area for September has decreased from 6.23 to 3.76 million km2 and for March from 14.52 to 13.42 million km2 between 1979–1988 and 2010–19 (Section 2.3.2.1.1). There is high confidence that sea ice in the Arctic will further decrease in the future under all emissions scenarios (Section 9.3.1.1). In contrast, there is no clear observed trend in the Antarctic sea ice area over the past few decades and there is low confidence of future changes (Section 9.3.1.1). The duration of the summer ice season in the Arctic has increased by 5 to 20 weeks between 1979 and 2013, with a significant trend ranging from 5 to 17 days per decade for earlier spring retreat and from 5 to 25 days per decade for later autumn advance, with consequences for Arctic marine mammals (AMMs) due to sea ice habitat loss (Laidre et al., 2015). The Arctic is projected to be ice-free more often during summer under 2°C global warming compared to 1.5°C global warming (Section 9.3.1.1; see also Sections 12.4.9 and 4.4.2.1), opening new shipping lanes for international commerce (Valsson and Ulfarsson, 2011) and lengthening the season for offshore resource extraction (Schaeffer et al., 2012). Iceberg numbers are expected to increase as a result of global warming, forming an elevated hazard to shipping and offshore facilities (Bigg et al., 2018).
It is virtually certain that global mean SST will continue to increase throughout the 21st century, resulting in the exceedance of numerous climatic impact-driver thresholds relevant to marine ecosystems (medium confidence). Marine heatwave days are projected to increase in global oceans, with a larger increase in the tropical ocean and Arctic Ocean (high confidence). It is virtually certain that upper-ocean stratification will continue to increase in the 21st century. Future ocean warming will very likely assist the development of both anoxic and hypoxic zones, with such reductions of oxygen expected to persist for thousands of years. Future projections also indicate freshening of the Pacific, Southern and Indian oceans and a saltier Atlantic Ocean (medium confidence).
The assessed direction of change in climatic impact-drivers for open and deep ocean regions and associated confidence levels are illustrated in Table 12.10, following the AR6 WGI ocean reference regions (Figure Atlas.2b).
12.4.9 Polar Terrestrial Regions
Several recent climate assessments of polar regions describe robust patterns of recent and future climatic changes driving impacts and risk for polar environmental, societal, and economic assets. These have included the IPCC SROCC (Meredith et al., 2019), the Report on Snow, Water, Ice and Permafrost in the Arctic (AMAP, 2017), and national assessments for the USA (Markon et al., 2018) and Canada (Derksen et al., 2018). This section examines Greenland and Iceland, the Russian Arctic, Antarctica, and the Arctic portions of Northern Europe and North America (Figure 1.18c).
12.4.9.1 Heat and Cold
Mean air temperature: Atlas.11.2 shows high confidence in warming of the Arctic in observations and projections, measuring among the fastest-warming places at more than twice the global mean, with substantially higher temperature increases in the cold season (see also AMAP, 2017; Meredith et al., 2019). Atlas.11.1 assessed very likely warming in observations of West Antarctica from 1957 to 2016, but limited evidence of mean air temperature change across East Antarctica even as there is high confidence in future warming across the continent (Figure Atlas.29; Meredith et al., 2019).
Extreme heat, cold spell and frost: Ecosystem and societal temperature thresholds in polar regions often reflect lower tolerance to heat and higher tolerance to cold. Extreme heat events have increased around the Arctic and Iceland since 1979, including increases in cold season warm days and nights, melt days, and Arctic winter warm events (T > –10°C) as well as decreases in cold days and nights (Mernild et al., 2014; Matthes et al., 2015; Vikhamar-Schuler et al., 2016; Graham et al., 2017; Sui et al., 2017; Dobricic et al., 2020; Peña-Angulo et al., 2020). Heatwaves causing high temperature records have been recently documented in West and East Antarctica (Wille et al., 2019; Robinson et al., 2020). There is high confidence that polar amplification will drive increases in Arctic heat extremes as well as continuing declines in the magnitude and frequency of cold extremes (Matthes et al., 2015; Kharin et al., 2018), although dynamical effects will still bring substantial cold air anomalies over the Arctic (Wu and Francis, 2019). There is medium confidence for equivalent changes in extreme heat in Antarctica based primarily on higher mean temperatures, with J.R. Lee et al. (2017) projecting more than 50 additional degree days above freezing (2098 RCP8.5 compared with 2014) over parts of the Antarctic Peninsula but smaller changes over mainland Antarctica.
12.4.9.2 Wet and Dry
Mean precipitation: Atlas.11.2 indicated medium confidence in observed increases in Arctic precipitation, with the largest rises in the cold season. Antarctic precipitation showed no significant overall trend since the 1970s, with a positive trend over the 20th century (Sections 9.4.2.1 and Atlas.11.1). Increases in Arctic and Antarctic precipitation during the 21st century are very likely , with projected percentage increases that are much higher than most subpolar regions of the world (Figure Atlas.29).
Floods and heavy precipitation: Observations and model projections indicate high confidence in increasing Arctic river runoff in response to increasing total precipitation (Box et al., 2019; Durocher et al., 2019; Meredith et al., 2019) with a shift towards earlier meltwater flooding (AMAP, 2017). Higher Arctic precipitable water totals are also connected with observed increases in heavy precipitation and convective activity (high confidence) (Ye et al., 2015; Kharin et al., 2018; Chernokulsky et al., 2019). Higher flood magnitudes are also driven by future increases in rain-on-snow event days, amounts, and runoff, which are more significant in the Arctic than in mid-latitudes (where seasonal snow cover is often further reduced; AMAP, 2017; Jeong and Sushama, 2018b).
Landslide and snow avalanche: There is a growing number of studies on mass movements in polar regions. Although there is low confidence in widespread observational trends for landslides or snow avalanches, a rise in the number of future landslides is supported by strong links to increases in heavy precipitation, glacier retreat, and thawing of ice-rich permafrost that can lead to retrogressive thaw slumps in Arctic regions (Section 2.3.2.5; Kokelj et al., 2015; Derksen et al., 2018; Lewkowicz and Way, 2019; Patton et al., 2019; Ward Jones et al., 2019).
Aridity and drought: Recent decades have seen a general decrease in Arctic aridity, with projections indicating a continuing trend towards reduced aridity (high confidence) as increased moisture transport leads to higher precipitation, humidity and streamflow (Meredith et al., 2019) and a corresponding decrease in dry days (Khlebnikova et al., 2019a). There is low confidence overall of recent or projected drought changes in polar regions (Section 11.9) even as increasing evidence shows that drainage from permafrost thaw, higher potential evapotranspiration, and changing seasonal patterns of melt have caused lake reduction and soil moisture deficits in several areas that match with projections of future drought increase despite overall precipitation increases (Andresen and Lougheed, 2015; Bring et al., 2016; Spinoni et al., 2018a; Feng et al., 2019; Finger Higgens et al., 2019).
Fire weather: Fire season lengthened from 1979 to 2015 over Arctic portions of North America (Jain et al., 2017), corresponding also to a 1975–2015 increase in lightning-ignited fires in Arctic North-Western North America (Girardin et al., 2013; Veraverbeke et al., 2017). Abatzoglou et al. (2019) climate model simulations project significant fire weather index increases in boreal forests of Arctic Europe, Arctic Russia and Arctic North-Eastern North America (medium confidence). Trends towards more frequent fires in tundra regions are expected to continue, driven in particular by increasing potential evapotranspiration and changes in vegetation (high confidence) (Hu et al., 2015; AMAP, 2017; Young et al., 2017).
12.4.9.3 Wind
Mean wind speed and severe storm: There is medium confidence of mean wind decrease over the Russian Arctic, Greenland and Iceland, and Arctic North-Eastern North America (Karnauskas et al., 2018a; Jung and Schindler, 2019), but low confidence of changes in the other Arctic regions and Antarctica. Bintanja et al. (2014) projected that a strengthening of the Southern Annular Mode would decrease easterlies along Antarctica’s coasts with only small changes in katabatic winds (although this effect may diminish with stratospheric ozone recovery). In contrast, Gorter et al. (2014) regional climate model projections indicated a reduction in mean winds over the interior of Greenland by RCP4.5 2100 while coastal winds increase. Reanalysis data and climate models indicate few coherent regional trends of polar cyclone frequency or relationships with cyclone depth and size (Akperov et al., 2018, 2019; Day and Hodges, 2018; Zahn et al., 2018).
12.4.9.4 Snow and Ice
Snow: Atlas.11.1 identified likely increases in surface mass balance (driven by snowfall) across Antarctica in the 20th century (medium confidence). In the Arctic, overall snow extent and seasonal duration are projected to continue recent declines (high confidence), although mid-winter snowpack increases in some of the coldest and high-elevation locations given higher precipitation totals (medium confidence) (Section 9.5.3, Atlas.9 and Atlas.11.2; Bring et al., 2016; Danco et al., 2016; AMAP, 2017; Meredith et al., 2019). Higher temperatures result in a higher percentage of Arctic precipitation falling as rain (particularly in autumn and spring) (high confidence), with most land regions (outside of Greenland and Antarctica) becoming dominated by rainfall (more than 50% of total precipitation) by RCP8.5 2100 (Bintanja and Andry, 2017; Irannezhad et al., 2017).
Glacier and ice sheet: Section 9.5.1 and Section 2.3.2.3 found that glaciers have lost mass in all polar regions since 2000 (high confidence), and Section 9.4 assessed high confidence in Greenland Ice Sheet mass losses since 1980 and Antarctic Ice Sheet losses since 1992 (dominated by West Antarctica, with losses in parts of East Antarctica in the past two decades). New simulations from GlacierMIP (Marzeion et al., 2020) indicate glaciers in Iceland will lose 31 ± 35%, 41 ± 46% and 53 ± 45% of their mass in 2015 by the end of the century for RCP2.6, RCP4.5 and RCP8.5 scenarios, respectively. Marzeion et al. (2020) projected mass losses (high confidence) for those same scenarios in the Greenland Periphery: 22 ± 23%, 29 ± 26%, and 42 ± 28%; Svalbard: 35 ± 34%, 50 ± 36%, and 66 ± 35%; Russian Arctic: 26 ± 26%, 38 ± 28%, and 52 ± 30%; Northern Arctic Canada: 12 ± 13%, 18 ± 12%, and 27 ± 18%; Southern Arctic Canada: 23 ± 27%, 33 ± 29%, and 48 ± 32%; and Antarctic Periphery: 7 ± 12%, 13 ± 10%, and 16 ± 19%. Areas with receding glaciers are also potentially vulnerable to glacial lake outburst floods (Harrison et al., 2018).
Permafrost: Observations from recent decades (assessed in Section 9.5.2 and Section 2.3.2.5) show increases in permafrost temperature (very high confidence) and active layer thickness (medium confidence) across the Arctic (AMAP, 2017; Derksen et al., 2018; Markon et al., 2018; Biskaborn et al., 2019; Farquharson et al., 2019; Meredith et al., 2019; Romanovsky et al., 2020). Section 9.5.2 noted that observations of active layer thickness in Antarctica are too limited to assess long-term trends (see also Hrbáček et al., 2018; Biskaborn et al., 2019). Future projections indicate continuing increases in permafrost temperature and active layer thickness with loss of permafrost across the Arctic (Section 9.5.2). Streletskiy et al. (2019) noted that changes to Russian permafrost temperature and active layer thickness are most pronounced in areas where permafrost is continuous (underlying >90% of landmass). CMIP5 analyses by Slater and Lawrence (2013) projected that, by RCP8.5 2100, shallow (<3 m) permafrost would be most probable only in portions of the Canadian Arctic Archipelago and the Russian Arctic coastal and eastern upland regions.
Sea ice: Consistent with SROCC (Meredith et al., 2019), Section 9.3.1 and Section 2.3.2.1.1 assess very high confidence that Arctic sea ice thickness, extent, and average age have significantly decreased over the past four decades, with largest declines in September (when sea ice is at an annual minimum). Declines in landfast ice are most rapid in the Laptev Sea (Selyuzhenok et al., 2015), with warming also breaking perennial landfast ice blocking ocean channels (‘ice plugs’) in the Canadian Archipelago (Pope et al., 2017), and landfast ice declining in the cold season by 7% per decade across the Arctic (1976–2007; Yu et al., 2014). Observed trends and projections suggest that perennial sea ice is being replaced by thin, seasonal ice, although multi-year ice will persist above the Canadian Archipelago and drift into sea transportation lanes (Howell et al., 2016; Derksen et al., 2018). Trends from 1979 to 2013 show slightly earlier spring melt for Arctic sea ice, but substantially delayed autumn freeze-up and a melt season lengthened by more than 3 days per decade off northern Alaska and Canada with the exception of portions of the Bering Sea (Parkinson, 2014; Stroeve et al., 2014). Section 9.3.2 assessed low confidence in long-term trends in sea ice extent or thickness near Antarctica.
Future declines in Arctic sea ice are virtually certain, although there is low confidence in declines of Antarctic sea ice given dynamical processes in the Southern Ocean and the recovery of stratospheric ozone (Section 9.3; Meredith et al., 2019). Projections of an ‘ice-free’ Arctic vary, depending on definitions representing transportation needs, however Laliberté et al. (2016) noted that the median of 42 CMIP5 models projected <5% sea ice for the month of September by 2050, with equivalent conditions for the entirety of the August–October period by 2090. Section 9.3.1 assessed high confidence that practically ice-free conditions (<1 million km2 in the September mean) would likely first appear before 2050 even under strong mitigation scenarios (Sigmond et al., 2018; Stroeve and Notz, 2018; Notz and SIMIP Community, 2020).
Lake and river ice: There is high confidence in observations of significant declines in seasonal ice cover thickness and duration over most Arctic lakes, with many lakes projected to lose more than one month of ice cover by mid-century (medium confidence) (Meredith et al., 2019; Sharma et al., 2019). Some lakes that previously froze to the bottom (‘bedfast’) now maintain liquid bottom water year round, and others shift from perennial to seasonal ice cover (Surdu et al., 2016; Engram et al., 2018). Yang et al. (2020a) identified a decline in Arctic cold-season river ice extent in satellite observations (particularly in Alaska) and projected reductions in average Northern Hemisphere seasonal river ice duration of 6.10 ± 0.08 days per degree global surface air temperature.
Heavy snowfall and ice storm: There is limited evidence of changes in heavy snowfall due to competing influences of shortened snowfall seasonality with more intense (and larger overall) precipitation in the Arctic. Episodic heavy snowfall trends in Antarctica are difficult to separate from large interannual variability (limited evidence) (Gorodetskaya et al., 2014, Turner et al., 2020). Limited evidence also hinders clear signals in ice storms, although warming shifts the freezing line (around which ice storms occur) poleward and upslope (Bintanja and Andry, 2017). Groisman et al. (2016) used 40 years of observations to identify an increase of freezing rain events in Norway, North America, and eastern and western Russia. Increases in winter rainfall have led to more frequent development of difficult wildlife and livestock grazing conditions as basal ice conditions coat the ground below snowpack (Peeters et al., 2019).
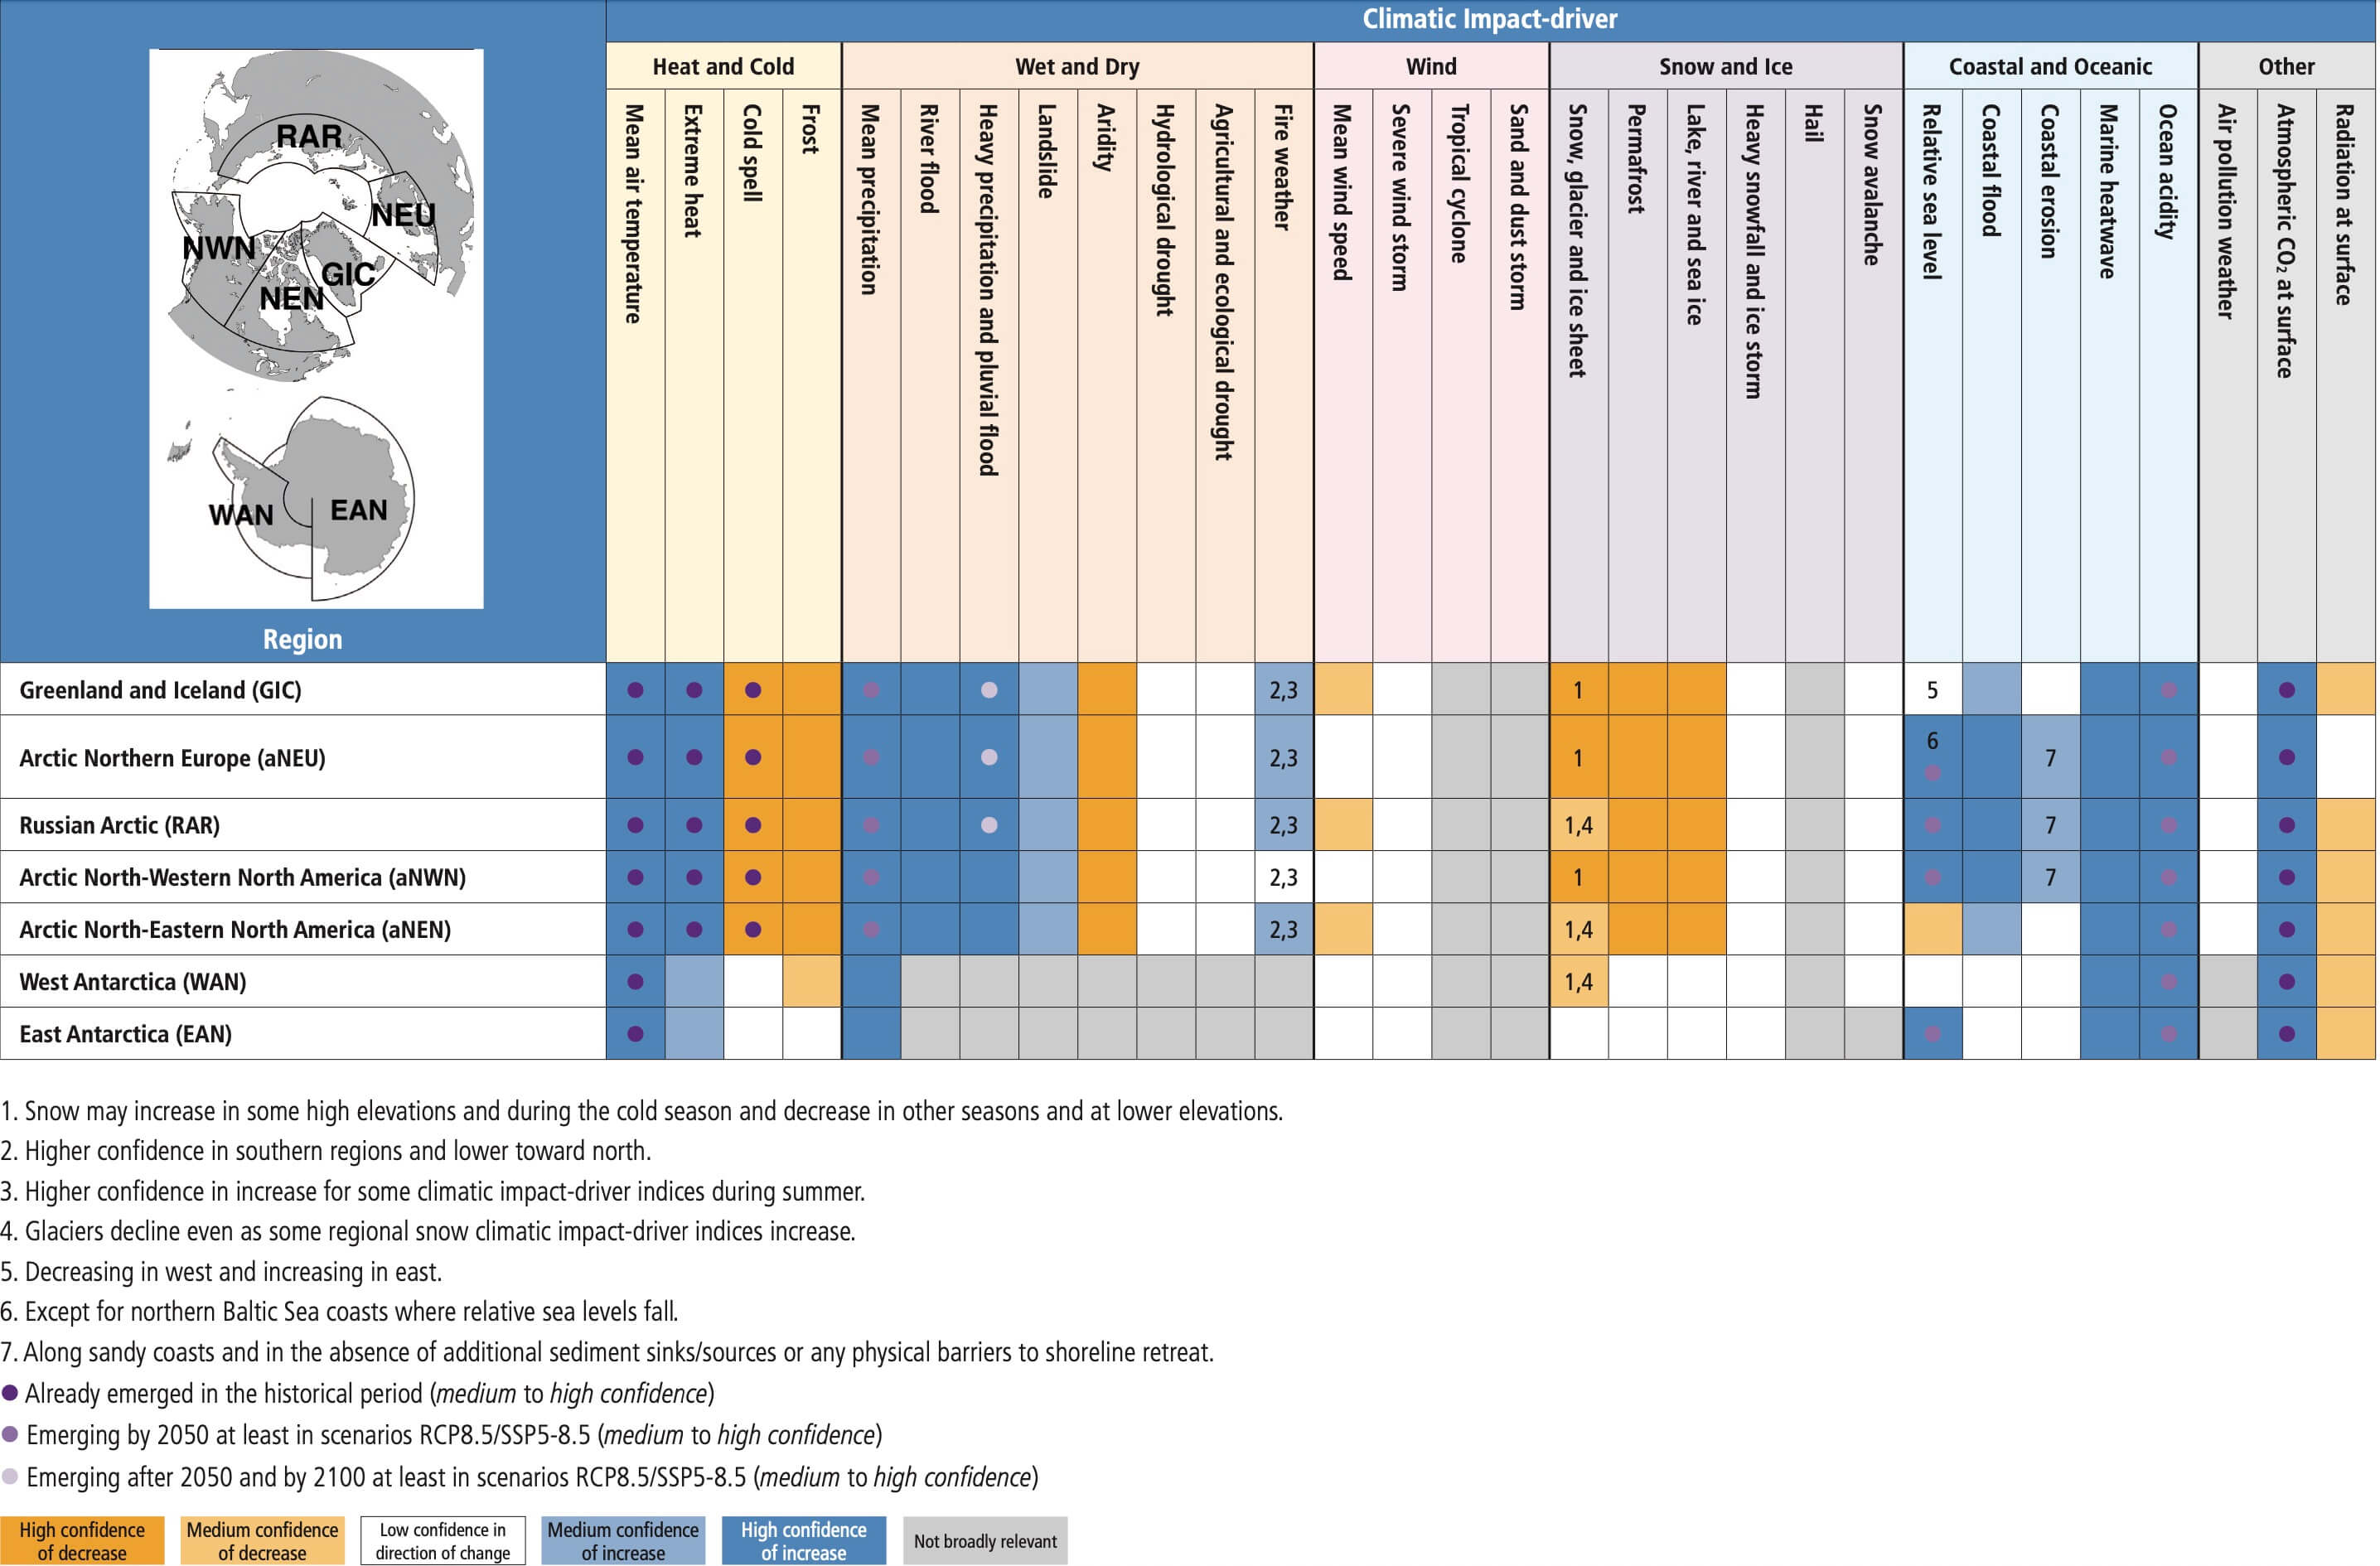
12.4.9.5 Coastal and Oceanic
Relative sea level: Satellite altimetry and tide data show that relative sea levels (with glacial isostatic adjustment) are rising in Arctic Europe and Arctic North-Western North America, declining in portions of southern Alaska and Arctic North-Eastern North America and no clear trend in Greenland and the Russian Arctic (Sweet et al., 2018; Rose et al., 2019), which is broadly consistent with findings in Oppenheimer et al. (2019). Areas with low or negative change have substantial land uplift counteracting the global mean sea level trend (Greenan et al., 2018; Sweet et al., 2018; Madsen et al., 2019). SROCC projections indicate high confidence in future rises in relative sea level for all Arctic regions other than areas of substantial land uplift in north-eastern Canada, the west coast of Greenland, and narrow portions of West Antarctica (Oppenheimer et al., 2019).
Coastal flooding and erosion: Higher sea levels and reduced coastal sea ice protection will increase future extreme sea levels in the Arctic (high confidence for Arctic Northern Europe, the Russian Arctic, and Arctic North-Western North America (medium confidence) for Greenland and Iceland and Arctic North-Eastern North America given glacial isostatic adjustment). Vousdoukas et al. (2018) project that the current 1-in-100-year extreme total water level would have median return periods of 1-in-20-years to 1-in-50-years by 2050, increasing to 1-in-5-years to 1-in-20-years by 2100 under RCP4.5 along nearly the entire Arctic coastline by 2100 (excluding GIC for which projections are not available). Projections for RCP8.5 indicate that the present-day 1-in-100-year ETWL would have median return periods of 1-in-10-years to 1-in-50-years by 2050 and would occur once every five years (or more frequently) by 2100. Arctic coastal erosion is also expected to increase with climate change (medium confidence; high agreement but limited evidence of projections), accelerated in some regions by subsurface permafrost thaw and increased wave energy (Gibbs and Richmond, 2015; Fritz et al., 2017; Oppenheimer et al., 2019; Casas-Prat and Wang, 2020). A longer ice-free season for the RCP8.5 2080s is projected to help drive more than 100 m of shoreline retreat in North-Western North America Arctic coastal communities (Melvin et al., 2017; Greenan et al., 2018; Magnan et al., 2019). Assessment of coastal flooding and erosion changes in Antarctica are limited by a lack of studies.
Marine heatwave: Recent years have seen marine heatwaves (MHWs) and increasing extreme coastal SSTs in Arctic systems (Lima and Wethey, 2012; Collins et al., 2019; Frölicher, 2019). Projections show increases in MHW intensity, frequency and duration will be larger over the Arctic Ocean than mid-latitude oceans due in part to low interannual variability under current sea ice (high confidence). Frölicher et al. (2018) used 12 CMIP5 models to project median MHW days increasing about 25-fold and 50-fold at the 2°C and 3.5°C GWLs, respectively, in response to mean ocean warming and sea ice loss, and the smallest global changes still leading to increases in the Southern Ocean around Antarctica (see also Cross-chapter Box 9.1).
Climate change has caused and will continue to induce an enhanced warming trend, increasing heat-related extremes and decreasing cold spells and frosts in the Arctic (high confidence), with similar changes in Antarctica but medium confidence for extreme heat increases and West Antarctic frost change decreases and low confidence for cold spell changes and East Antarctica frost. The water cycle is projected to intensify in polar regions, leading to more rainfall, higher river flood potential and more intense precipitation (high confidence). Projections indicate reductions in glaciers at both poles, with sea ice loss, enhanced permafrost warming, decreasing permafrost extent, and decreasing seasonal duration and extent of snow cover in the Arctic (high confidence) even as some of the coldest regions will see higher total snowfall given increased precipitation (medium confidence). Projections indicate relative sea level rises in polar regions (high confidence) , with the exception of regions with substantial land uplift including North-Eastern North America (high confidence), western Greenland, the northern Baltic Sea, and portions of West Antarctica. Higher sea levels also contribute to high confidence for projected increases of Arctic coastal flooding and higher coastal erosion (aided by sea ice loss) (medium confidence) with lower confidence for those CIDs in regions with substantial land uplift.
12.4.10 Specific Zones and Hotspots
This section focuses on CIDs affecting specific zones with heightened vulnerability and coherent characteristics that cut across traditional continental regions (see also Section 12.3). It is designed to match the structure of the Cross-Chapter Papers in the WGII Report, although polar regions were addressed in more extensive detail in Sections 12.4.8 and 12.4.9 of this Report and the Mediterranean Region will not be handled separately given that its climatic impact-drivers are discussed in Sections 12.4.1 and 12.4.5 as well as in Cross-Chapter Box 10.3.
12.4.10.1 Hotspots of Biodiversity (Land, Coasts and Oceans)
Hotspots of biodiversity are defined by the AR6 WGII as ‘geographic areas with exceptionally high richness of species, including rare (endemic) species’ (WGII Cross-Chapter Paper 1). The AR6 assessment is based on 238 distinctive regions often called the ‘Global 200 ecoregions’ (Olson and Dinerstein, 2002).
Mean temperature increase is a major climatic impact-driver for biodiversity hotspots, and it is very likely that it will affect all hotspot areas identified in the literature, at various rates in all climate scenarios, except those located in the North Atlantic where warming is uncertain (see Chapter 4). Terrestrial ecosystems will experience an enhanced warming compared to ocean ecosystems, because land temperatures are warming faster than ocean temperatures (Chapter 4). Marine ecoregions will experience ocean acidification and temperatures that increase faster in high latitudes (high confidence), but critical temperature and oxygen thresholds are projected to be crossed earlier (by mid-century RCP8.5) in tropical areas (Hughes et al., 2017a; Bruno et al., 2018). A warming trend is also expected for freshwater ecosystems, with different local magnitudes due to combined effects of groundwater system inertia as well as hydrology changes (Knouft and Ficklin, 2017). In tropical land areas, because interannual temperature variability is weak compared to mean changes, the temperature distribution range is likely to be shifted to a very different range in all projection scenarios, with unprecedented values relative to pre-industrial conditions. High climate velocities are particularly noteworthy for biodiversity hotspots given complex ecosystem dynamics and niche climates not easily replicated under shifted geographies (Burrows et al., 2014; Halpern et al., 2015; Dobrowski and Parks, 2016). In some regions (e.g., Central Africa, Amazon, South East Asia) the mean temperature change is already beyond the normal range of variations as it has reached levels higher than three (and up to six) times larger than the standard deviation of the interannual variations (Hawkins et al., 2020). Together with global warming, land and marine heatwaves are very likely to increase in the future climate in biodiversity hotspots (Sections 12.4.1–12.4.7).
There is low confidence in broad patterns of future drying or wet trends across the land and freshwater biodiversity hotspots in the humid tropics, although drying trends have been detected and predicted in parts of the Amazon (Fu et al., 2013; Boisier et al., 2015). There is medium confidence (limited evidence, high agreement) that in several regions the length of the dry season has already increased and is projected to further increase in some parts of the Mediterranean, Amazonia and sub-Saharan Africa (Debortoli et al., 2015; Dunning et al., 2018; Hochman et al., 2018; Saeed et al., 2018). Longer dry seasons also extend the seasonal length and geographical extent of fire weather in all future scenarios (medium confidence) (Jolly et al., 2015; Abatzoglou et al., 2019).
In conclusion, biodiversity hotspots around the world will each face unique challenges as climatic impact-drivers change. However, heat, drought and length of dry season, fire weather, sea surface temperature and deoxygenation are relevant drivers to terrestrial, freshwater and marine ecosystems, and have marked increasing trends.
12.4.10.2 Cities and Settlements by the Sea
Cities and settlements by the sea are exposed to specific climate and climate change patterns and to compound coastal hazard risks (AR6 WGII Cross-Chapter Paper 2). The AR5 WGII found that, in general, ‘urban climate change-related risks are increasing (including rising sea levels and storm surges, heat stress, extreme precipitation, inland and coastal flooding, landslides, drought, increased aridity, water scarcity, and air pollution)’ (Revi et al., 2014). Since AR5 a number of studies have been carried out to understand urban climate and its change. Box 10.3 identified a continuing strong role of the urban heat island in amplifying heat extremes in cities, although changes in the urban heat island are an order of magnitude smaller than projected localized warming trends (very high confidence).
Coastal cities’ proximity to the sea somewhat mitigates the effect of urban heat islands (high confidence) (Salvati et al., 2017; Santamouris et al., 2017; Y. Wang et al., 2018; Martinelli et al., 2020). Cities and settlements by the sea typically experience higher humidity levels than inland regions, combining with heat to enhance heat stress and induce exceedance of critical heat stress thresholds for outdoor activities, with potential enhanced exposure to heat for informal settlements (J. Wang et al., 2019). Such threshold exceedances are projected to increase for many coastal areas (high confidence), including the Persian Gulf where heat stress is projected to be extreme (Pal and Eltahir, 2016; Ahmadalipour and Moradkhani, 2018), and some low-lying areas in Europe such as the Po Valley and coastal Mediterranean areas (Coppola et al., 2021a; Schwingshackl et al., 2021; see also the heat stress index shown in Figure 12.4d–f).
Climate change-related variations in oceanic drivers (e.g., relative sea level, storm surge, ocean waves), combined with tropical cyclones, extreme precipitation and river flooding, are expected to lead to more frequent and more intense coastal flooding and erosion (very high confidence) impacting cities and settlements located especially in low-elevation coastal zones and mega-deltas (Chan et al., 2012, 2018; Karymbalis et al., 2012; Hemer et al., 2013; Aerts et al., 2014; B. Neumann et al., 2015; Hauer et al., 2016; Ranasinghe, 2016; Hinkel et al., 2018; Mavromatidi et al., 2018; Marcos et al., 2019; see also Sections 12.3, 12.4.1–12.4.7 and 12.4.9). Coastal erosion and flooding also pose challenges to critical infrastructure such as roads, subway tunnels, electricity and phone networks, wastewater management plants and buildings (Grahn and Nyberg, 2017; Pregnolato et al., 2017). Compound flooding due to simultaneous storm surges and high river flows have been found to be increasingly frequent in several cities and/or low-lying areas in Europe and the USA (high confidence) (Wahl et al., 2015; Bevacqua et al., 2019; Ganguli and Merz, 2019). Chapter 11 found that the frequency of such compound flood events is projected to increase (high confidence). In addition to changes induced by sea level change, many cities and settlements by the sea are in regions where tropical cyclones are projected to become more intense and severe tropical cyclones more frequent (high confidence) (Section 11.7).
The SROCC highlighted coastal settlements in the Arctic as being particularly exposed to several CID changes (Magnan et al., 2019). Enhanced waves, due to extended season of sea ice retreat, are projected to foster coastal flooding and erosion (Section 12.4.9; Gudmestad, 2018; Casas-Prat and Wang, 2020). Climate change is also affecting sea ice quality and season length along coasts of the Arctic Ocean where populations depend on sea ice for hunting or transportation (Section 12.4.9; Pearce et al., 2015).
In summary, coastal cities and settlements are particularly affected by a number of climatic impact-drivers that have already changed and will continue to change whatever the emissions scenario. These include increases in extreme heat, pluvial floods, coastal erosion and coastal flood (high confidence). Increasing relative sea level, compounding with increasing tropical cyclone storm surge and rainfall intensity, will increase the probability of coastal city flooding (high confidence). Arctic coastal settlements are particularly exposed to climate change due to sea ice retreat (high confidence).
12.4.10.3 Deserts and Semi-arid Areas
Drylands, which include hyper-arid, arid, semi-arid and dry sub-humid areas (IPCC, 2019c), lie on all continents and cover 46% of the global land area and host more than one-third of the current population (Olsson et al., 2019). Huang et al. (2016b) found that aridity changes have helped expand dryland area by about 4% from 1948 to 2004, with the largest expansion of drylands occurring in semi-arid regions since the early 1960s. Section 4.5.1 assessed high confidence of a future poleward expansion of the Hadley cell, leading to a poleward shift of dryland areas in all scenarios considered. There is no evidence of a future global trend in aridification of drylands (IPCC, 2019a), but high confidence of aridification in some areas (e.g., Mediterranean, Central America, Southern Africa; IPCC, 2019a; see also Figure 12.4j–l). However, drivers of desertification largely include land-cover changes and land-use management, along with climate change (IPCC, 2019a).
Warming temperatures and extreme heat are major climatic impact-drivers with multiple potential impacts on societies, health, and habitability in semi-arid and arid regions that are already near physiological limits for outdoor activities. Semi-arid regions will very likely undergo a warming in all future scenarios (Chapter 4 and Atlas) and likely undergo an increase in duration, magnitude and frequency of heatwaves (Chapter 11) (Figure 12.4a–c). It is likely that heat stress will be much more intense by the end of the century in many areas under all scenarios, such as deserts and semi-arid zones in Asia (Murari et al., 2015; Mishra et al., 2017), Australia and Africa (Zhao et al., 2015; Xia et al., 2016; Guo et al., 2017; Dosio et al., 2018; Schwingshackl et al., 2021), with consequences for labour productivity with respect to high heat-humidity conditions (Figure 12.4d–f).
Drought is another major climatic impact-driver for semi-arid areas, imposing major challenges on agriculture given existing water availability constraints (Kusunose and Lybbert, 2014; Barlow et al., 2016; Otto et al., 2018). Over the period 1961–2013, the annual area of drylands in drought has increased, on average by slightly more than 1% per year, with large interannual variability (Olsson et al., 2019). In general, droughts have increased in several arid and semi-arid areas over the last decades (medium confidence), and are likely to increase in the future as indicated by a number of indices calculated from climate (Liu et al., 2018b; Zkhiri et al., 2019; Coppola et al., 2021b; Driouech et al., 2021; see also Figure 12.4j–l).
Deserts and semi-arid areas are prone to dust storms, which can drive impacts on health and several other sectors (X. Zhang et al., 2016; Tong et al., 2017). The SRCCL indicated that the evolution of dust under climate change is uncertain (Mirzabaev et al., 2019), and there is a lack of evidence and agreement of a change in their frequency or intensity so far in most regions (Sections 12.4.1–12.4.9). Model projections of future changes in dust are hindered by the uncertainties in future regional wind and precipitation as the climate warms (Evan et al., 2016); in the effect of CO2 fertilization on source extent (Huang et al., 2017); and in the impact of human activities upon the land surface (Ginoux et al., 2012; see Chapter 10). Projected trends in dust storms and dust loads in deserts and semi-arid areas vary from region to region. Dust loadings are expected to decrease over most of the Sahara and Sahel (low confidence) (Section 12.4.1), increase over Mexico and the south-west USA (medium confidence) (Section 12.4.6), and there is low confidence of a future trend due to climate change in other continents (Sections 12.4.2–12.4.5).
In conclusion, desert and semi-arid areas are strongly affected by climatic impact-drivers such as extreme heat, drought and dust storms. Heat hazards are very likely increasing in all future climate scenarios, but uncertainty remains regarding any broadly consistent future changes in other climatic impact-drivers for deserts and semi-arid regions.
12.4.10.4 Mountains
Mountains cover about 30% of the land areas on Earth (not counting Antarctica) and deliver a number of vital services to humanity (WGII Cross-Chapter Paper 5; IPCC, 2019b). Climate change in high mountains was addressed in SROCC, which emphasized changes in several climatic impact-drivers. These included an observed general decline in low-elevation snow cover, glaciers and permafrost (high confidence), which induced changes in natural hazards such as decrease in slope stability (high confidence), changes to the frequency of glacial lake outbursts (limited evidence), and climate effects on other climatic impact-drivers (avalanche, rain-on-snow floods) with various degrees of confidence (Hock et al., 2019).
There is a growing body of literature indicating elevation-dependent warming (EDW; different rates of warming by altitude although not necessarily increasing with altitude) in several mountain regions but not globally (Hock et al., 2019; Pepin et al., 2019; Ahmed et al., 2020; B. Li et al., 2020; Williamson et al., 2020; You et al., 2020; Micu et al., 2021). Statistically significant elevational enhancement to long-term trends in maximum near-surface air temperatures and diurnal temperature range were observed in southern central Himalaya and in the Swiss Alps (Rottler et al., 2019; Thakuri et al., 2019). Aguilar-Lome et al. (2019) reported that winter daytime land surface temperatures in the Andean region between 7°S and 20°S show the strongest trends at higher elevations: +1.7°C per decade above 5000 m above sea level. Palazzi et al. (2019) identified changes in albedo and downward thermal radiation as key drivers of EDW according to the simulation outputs of a high-spatial-resolution model in three important mountainous areas: the Colorado Rocky Mountains, the Greater Alpine Region and the Himalayas–Tibetan Plateau, but mechanisms for EDW remain complex (Hock et al., 2019). Warming is also affecting mountain lake surface temperatures, increasing probabilities of ice-free winters and the frequency and duration of ‘lake heatwaves’ (high confidence) (O’Reilly et al., 2015; Woolway et al., 2020, 2021) with a high variability from lake to lake.
Elevation-dependent warming could speed up the observed, rapid upward shifts of the freezing level height (FLH) in several mountainous regions of the world and lead to faster changes in the snowline, the glacier equilibrium-line altitude and the snow/rain transition height (high confidence). In the Indus, Ganges and Brahmaputra basins in Asia, the FLH is projected to rise at a rate of 4.4 to 10.0 m yr–1under RCP8.5 (Viste and Sorteberg, 2015). In the Argentinian Andes, FLH is projected under RCP8.5 to move up more than twice as much by 2070 as during the entire Holocene under the worst case scenario (Drewes et al., 2018). On the western slope of the subtropical Andes (30°S–38°S) in central Chile, the mean value of the free tropospheric height of the 0°C isotherm under wet conditions is projected to be close to or higher than the upper quartile of the distribution in the current climate, towards the end of the century and under RCP8.5 (Mardones and Garreaud, 2020). In the Alps and the Pyrenees, Spandre et al. (2019) projected a rise in the natural snow elevation of between 200–300 m and 400–600 m by mid-century under RCP2.6 and RCP8.5, respectively. In the same region, the environmental equilibrium-line altitude is projected to exceed the maximum elevation of 69%, 81% and 92% of the glaciers by the end of the century under RCPs 2.6, 4.5 and 8.5, respectively (Žebre et al., 2021).
Orographic effects enhance convection and stratiform heavy precipitation (due to uplift) and make mountains prone to extreme precipitation events. These events are projected to increase in major mountainous regions (Alps, parts of the Andes, British Columbia, North-Western North America, Calabria, Carpathian, Hindu-Kush-Himalaya, Rocky Mountains, Umbria; medium to high confidence depending on location), with potential cascading consequences of floods, landslides and lake outbursts in mountainous areas in all scenarios (medium confidence) (Chapter 11 and Sections 12.4.1–12.4.9; Geertsema et al., 2006; Gaire et al., 2015; Kim et al., 2015; Ciabatta et al., 2016; Gariano and Guzzetti, 2016; Kharuk et al., 2016; Syed and Al Amin, 2016; Cloutier et al., 2017; Gądek et al., 2017; Jurchescu et al., 2017; Rajczak and Schär, 2017; Alvioli et al., 2018; Coe et al., 2018; Schlögl and Matulla, 2018; C.-W. Chen et al., 2019; Handwerger et al., 2019; Hock et al., 2019; Patton et al., 2019; Vaidya et al., 2019; Kirschbaum et al., 2020; Coppola et al., 2021b).
Declines in low-elevation snow depth and seasonal extent are projected for all SSP-RCPs (see Sections 12.4.1–12.4.6), along with reductions in mountain glacier surface area, increases in permafrost temperature, decreases in permafrost thickness, changes in lake and river ice, changes in the amount and seasonality of streamflows and hydrologic droughts in snow-dominated and glacier-fed river basins (e.g., in Central Asia; Sorg et al., 2014; Reyer et al., 2017b) (medium confidence), and decreases in the stability of mountain slopes and snowfields. Glacier recession could lead to the creation of new glacial lakes in places like the Himalaya-Karakoram region (Linsbauer et al., 2016) and in Alaska and Canada (Carrivick and Tweed, 2016; Harrison et al., 2018) (medium confidence). With increasing temperature and precipitation these can increase the occurrence of glacier lake outburst floods and landslides over moraine-dammed lakes (high confidence) (Carey et al., 2012; Rojas et al., 2014; Iribarren Anacona et al., 2015; Cook et al., 2016; Haeberli et al., 2017; Kapitsa et al., 2017; Narama et al., 2018; Wilson et al., 2018; Drenkhan et al., 2019; S. Wang et al., 2020).
In conclusion, mountains face complex challenges from specific climatic impact-drivers drastically influenced by climate change: regional elevation-dependent warming (high confidence), low-to-mid-altitude snow cover and sno w-sea son decrease even as some high elevations see more snow (high confidence), glacier mass reduction and permafrost thawing (high confidence), and increases in extreme precipitation and floods in most parts of major mountain ranges (medium confidence).
12.4.10.5 Tropical Forests
Tropical forests, which are among the world’s most biologically diverse ecosystems, are essentially located in Central and South America, Africa and South East Asia (AR6 WGII Cross-Chapter Paper 7). The AR5 and SR1.5 indicated several specific climatic impact-driver changes that are particularly important to tropical forests: mean temperature increase, long-term drying trends (including shifts in the length of the dry season), prolonged drought, wildfires and surface CO2 increase for inland forests (IPCC, 2013, 2018). The SRCCL assessed an enhanced risk and severity of wildfires in tropical rainforests (high confidence), but fires are not only a natural process but are also affected by deforestation and other human influences (IPCC, 2019a).
Temperature is rising in all tropical regions covered with forests and will very likely continue to rise, reaching levels unprecendented in recent decades as the temperature trends rapidly emerge from weak historical interannual variability (Sections 12.4.1–12.4.4 and 12.5.2; see also Chapter 4 and Atlas).
Regional patterns of increasing drought or unusual wet and dry periods are predicted with agreement over many climate models such as over the Amazon basin (Boisier et al., 2015; Duffy et al., 2015; Zulkafli et al., 2016; Coppola et al., 2021b). There is medium confidence (limited evidence, high agreement) that in several tropical-forest regions (e.g., Amazonia, West Africa) the dry season length has increased (Fu et al., 2013; Debortoli et al., 2015; Saeed et al., 2017; Dunning et al., 2018; Wadsworth et al., 2019), and there is low confidence (limited evidence) that deforestation influences the shift in the onset of the wet season in south Amazonia (Leite-Filho et al., 2019). In contrast, the wet season is increasing in northern Australia tropical forests (Catto et al., 2012).
Tropical forests typically reach peak fire weather conditions in the dry season (Taufik et al., 2017), in particular during long-lived droughts (Brando et al., 2014; Marengo et al., 2018), with consequences for tree mortality, forest and carbon sink loss (Brando et al., 2019), and on the hydrological cycle in South America (Martinez and Dominguez, 2014; Espinoza et al., 2020). Observations and reanalyses over the past three to four decades, combined into fire risk indices, show that the fire weather season length has been increasing by about 20% globally (Jolly et al., 2015), and this index exhibits particularly high trend values over tropical forest areas of South and Central America and Africa. There is generally low confidence in future projections of general fire weather risk evolution in tropical forests and evolutions depend on the region (Abatzoglou et al., 2019). Over the Amazon basin the fire risk increase is projected to emerge well before 2050 while for other equatorial forests no significant evolution is found. In Savanna areas the risk increase is found to be more general.
In conclusion, most tropical forests are challenged by a mix of emerging warming trends that are particularly large in comparison to historical variability (medium confidence). Water cycle changes bring prolonged drought, longer dry seasons, and increased fire weather to many tropical forests, with plants also responding to CO2 increases (medium confidence).
12.5 Global Perspective on Climatic Impact-drivers
12.5.1 A Global Synthesis
(Section 12.4 assessed changes in climatic impact-drivers by region, primarily based on a large number of local- and regional-scale studies (even though global studies are also used). This section presents an assessment of changes in CIDs at the global scale. It is based on both a bottom-up synthesis of the results in Section 12.4, and a top-down assessment from global-scale studies undertaken here. Cross-Chapter Box 12.1 summarizes global-scale CIDs with levels of warming.
Global-scale studies use similar indices of climatic impact-drivers across space, although these indices may not always be those used at the local or regional scale. Most published global-scale studies concentrate on single sectors or climatic impact-drivers, but some take a multi-sectoral perspective (e.g., Warszawski et al., 2014; Arnell et al., 2016, 2019; Schleussner et al., 2016; Mitchell et al., 2017; Betts et al., 2018; Byers et al., 2018; Mora et al., 2018; O’Neill et al., 2018; Zscheischler et al., 2018). Only a few published global-scale studies (e.g., Coppola et al., 2021; Schwingshackl et al., 2021) have used CMIP6 scenarios to date.
All regions will experience, before 2050, increased warming, an increase of extreme heat and a decrease in cold spells, regardless of the emissions trajectory (high confidence). Tropical regions, but also mid-latitude regions to a lesser extent, will experience an increasing number of days with heat indices crossing dangerous thresholds used to characterize heat stress, such as HI > 41°C (Figure 12.4). The increase, by the end of century, exceeds 100 days per year in most tropical areas under SSP5-8.5 but remains much more limited (almost half) under SSP1-2.6. Several global-scale studies have shown that high temperature extremes will increase everywhere (high confidence) (Gourdji et al., 2013; Perkins-Kirkpatrick and Gibson, 2017; Harrington et al., 2018; Jones et al., 2018; Lehner et al., 2018; Shi et al., 2018; Tebaldi and Wehner, 2018; Arnell et al., 2019; Russo et al., 2019; Schwingshackl et al., 2021), although the change depends on the indicator (see also Chapter 11). For example, by 2080, at least 80% of the land surface is expected to experience average summer temperatures greater than the historical (1920–2014) maximum with high (RCP8.5) emissions (Lehner et al., 2018). The areas of rice and maize cropland with damaging extreme temperatures during the reproductive season will increase by a factor of three under RCP8.5 (Gourdji et al., 2013). Under a high emissions scenario, heatwaves that are currently considered rare are projected to become the norm almost everywhere by the end of the century (Russo et al., 2014). Heat stress as a combined function of temperature and humidity also increases at the global scale, especially with high emissions (e.g., Matthews et al., 2017). Growing degree-days and cooling degree-days also increase everywhere (Arnell et al., 2019) with the absolute and proportional changes depending on temperature threshold. Increases in temperatures will result in reductions in heating degree days (Arnell et al., 2019; Coppola et al., 2021b) and a widespread reduced frequency of cold extremes (high confidence).
Integrating the results of the regional assessments in Section 12.4 shows that changes in CIDs linked with the water cycle or atmospheric dynamics (e.g., storms) vary more among regions, largely due to the spatial pattern of changes in atmospheric circulation and changes in precipitation and evaporation (Chapters 8 and 11). There is high confidence that heavy precipitation and pluvial floods will be increasing in a majority of land regions, primarily due to the well-understood Clausius–Clapeyron relationship describing the increase in moisture content with air temperature (Chapters 8 and 11), but there is a large spatial variability in fluvial flood hazards. Top-down global-scale studies show that although fluvial flood hazards are projected to decrease in regions where there are large reductions in seasonal rainfall totals or where warmer temperatures mean less accumulated snow, at the global scale, fluvial flood hazard (characterized as the area affected, size of peak or likelihood of an event) is projected to increase substantially through the century (Giuntoli et al., 2015; Arnell and Gosling, 2016; Winsemius et al., 2016; Alfieri et al., 2017; Dottori et al., 2018; Arnell et al., 2019). Projected changes in agricultural and hydrological drought characteristics are dependent on the indicator used to define drought (Sections 11.6 and Section 12.3.2), but there is at least medium confidence of an increase in the drought hazard in many parts of the world. This is also reflected in global-scale studies, with Naumann et al. (2018), for example, showing that the global mean average drought duration (based on the SPEI index which is calculated from the difference between precipitation and potential evaporation) increased from 7 months with the current climate to 18.5 months for a global warming level of 3°C. The apparent global increase in drought occurrence is greater when evaporation is captured in the drought indicator (e.g., SPEI) than when the indicator is based on precipitation alone (as in SPI; Carrão et al., 2018). There is evidence that the likelihood of simultaneous events in several locations will increase: Trnka et al. (2019) found that the proportion of wheat-growing areas experiencing simultaneous severe water stress events (based on SPEI) in a year increased from 15% under current conditions to up to 60% at the end of the 21st century under high emissions.
The regional assessment in Section 12.4 shows that fire weather is projected to increase with medium or high confidence in every continent of the world, including Arctic polar regions. Globally, fire weather is projected to increase in future, primarily due to higher temperatures and exacerbated where precipitation reduces. By 2050, 60% of the global land area would see a significant increase in fire weather under RCP8.5 (Abatzoglou et al., 2019). There is less confidence in the projected distribution of change in fire weather across regions in global-scale studies. For example, Moritz et al., (2012) projected an increase in fire weather in mid- and high latitudes but a reduction in the tropics, whilst Yu et al. (2019) and Bedia et al. (2015) projected an increase in the tropics. These differences reflect differences in methodologies and fire weather indices adopted in different studies.
Integration of the results of (Section 12.4 shows that the total number of tropical cyclones is projected to decrease through the 21st century, particularly with high emissions, but the number of very intense tropical cyclones is projected to increase in most areas (at least medium confidence) (e.g., Bacmeister et al., 2018; see Section 11.7.1). Furthermore, regions with glaciers will lose glacier mass and regions concerned with snow cover will see a reduction in snow depth, the duration, or extent of cover (medium confidence in polar regions , high confidence elsewhere).
Relative sea level rise (RSLR) is projected in all regions (except for a few Arctic polar regions) with likelihoods varying from very likely to virtually certaindepending on the region. This will increase the frequency of extreme sea levels and, depending on the level of coastal flood protection, coastal flooding (Vousdoukas et al., 2018; Kirezci et al., 2020). In terms of globally averaged extreme total water level (ETWL) frequency changes, the present-day 1-in-100-year event is projected to become 1-in-30-year and 1-in-20-year events by 2050 under RCP4.5 and RCP8.5, respectively. The present day 1-in-100-year ETWL is projected to become a 1-in-5-year event by 2100 under RCP4.5, while under RCP8.5, such events are projected to occur more than once a year (Vousdoukas et al., 2018).
There is high confidence that most of the world’s sandy coasts will experience shoreline retreat, in the absence of terrestrial or offshore sediment sources. Median projections presented by (Vousdoukas et al., 2020b) indicate that 13.6% (36,097 km) and 15.2% (40,511 km) of the world’s sandy beaches could retreat by more than 100 m by 2050 (relative to 2010) under RCP4.5 and RCP8.5 respectively, implying a 12% increase in severely threatened shoreline length under RCP8.5, relative to RCP4.5. These median projections increase to 35.7%–49.5% (RCP4.5 and RCP8.5, respectively; or 95,061 km–131,745 km) by the end of the century, implying a 38% increase in severely threatened shoreline length under RCP8.5, relative to RCP4.5.
Figure 12.11 highlights that each region will, with high confidence, experience changes in multiple CIDs, challenging the vulnerability of the region and its adaptation and mitigation capacity. All non-polar regions with a coastline will see an increase in relative sea level, extreme sea level and coastal erosion, and will also see an increase in hot extremes, a decrease in cold extremes, and many will experience an increase in heavy precipitation. One cluster of regions – East Southern and West Southern Africa regions, the Mediterranean, Northern Central America, Western North America, several regions in South America and Australia – will experience, in addition to the aforementioned globally changing CIDs, increases in either drought/aridity or fire weather (high confidence). This will impact upon agricultural resources, infrastructure and health and ecosystems. A second cluster of regions including mountainous areas or regions with seasonal snow cover will experience (in addition to increases in heat extremes, more intense short-duration rainfall, and increases in coastal hazards where coasts exist) reductions in snow and ice cover and/or increases in river flooding in many cases (Western, North-Western, Central and Eastern North America, Arctic regions, Andes regions, Europe, Siberia, Central and East Asia, Southern Australia and New Zealand) (high confidence). These are places where energy production, ski tourism, river transportation, and infrastructure could in particular face increased risks.
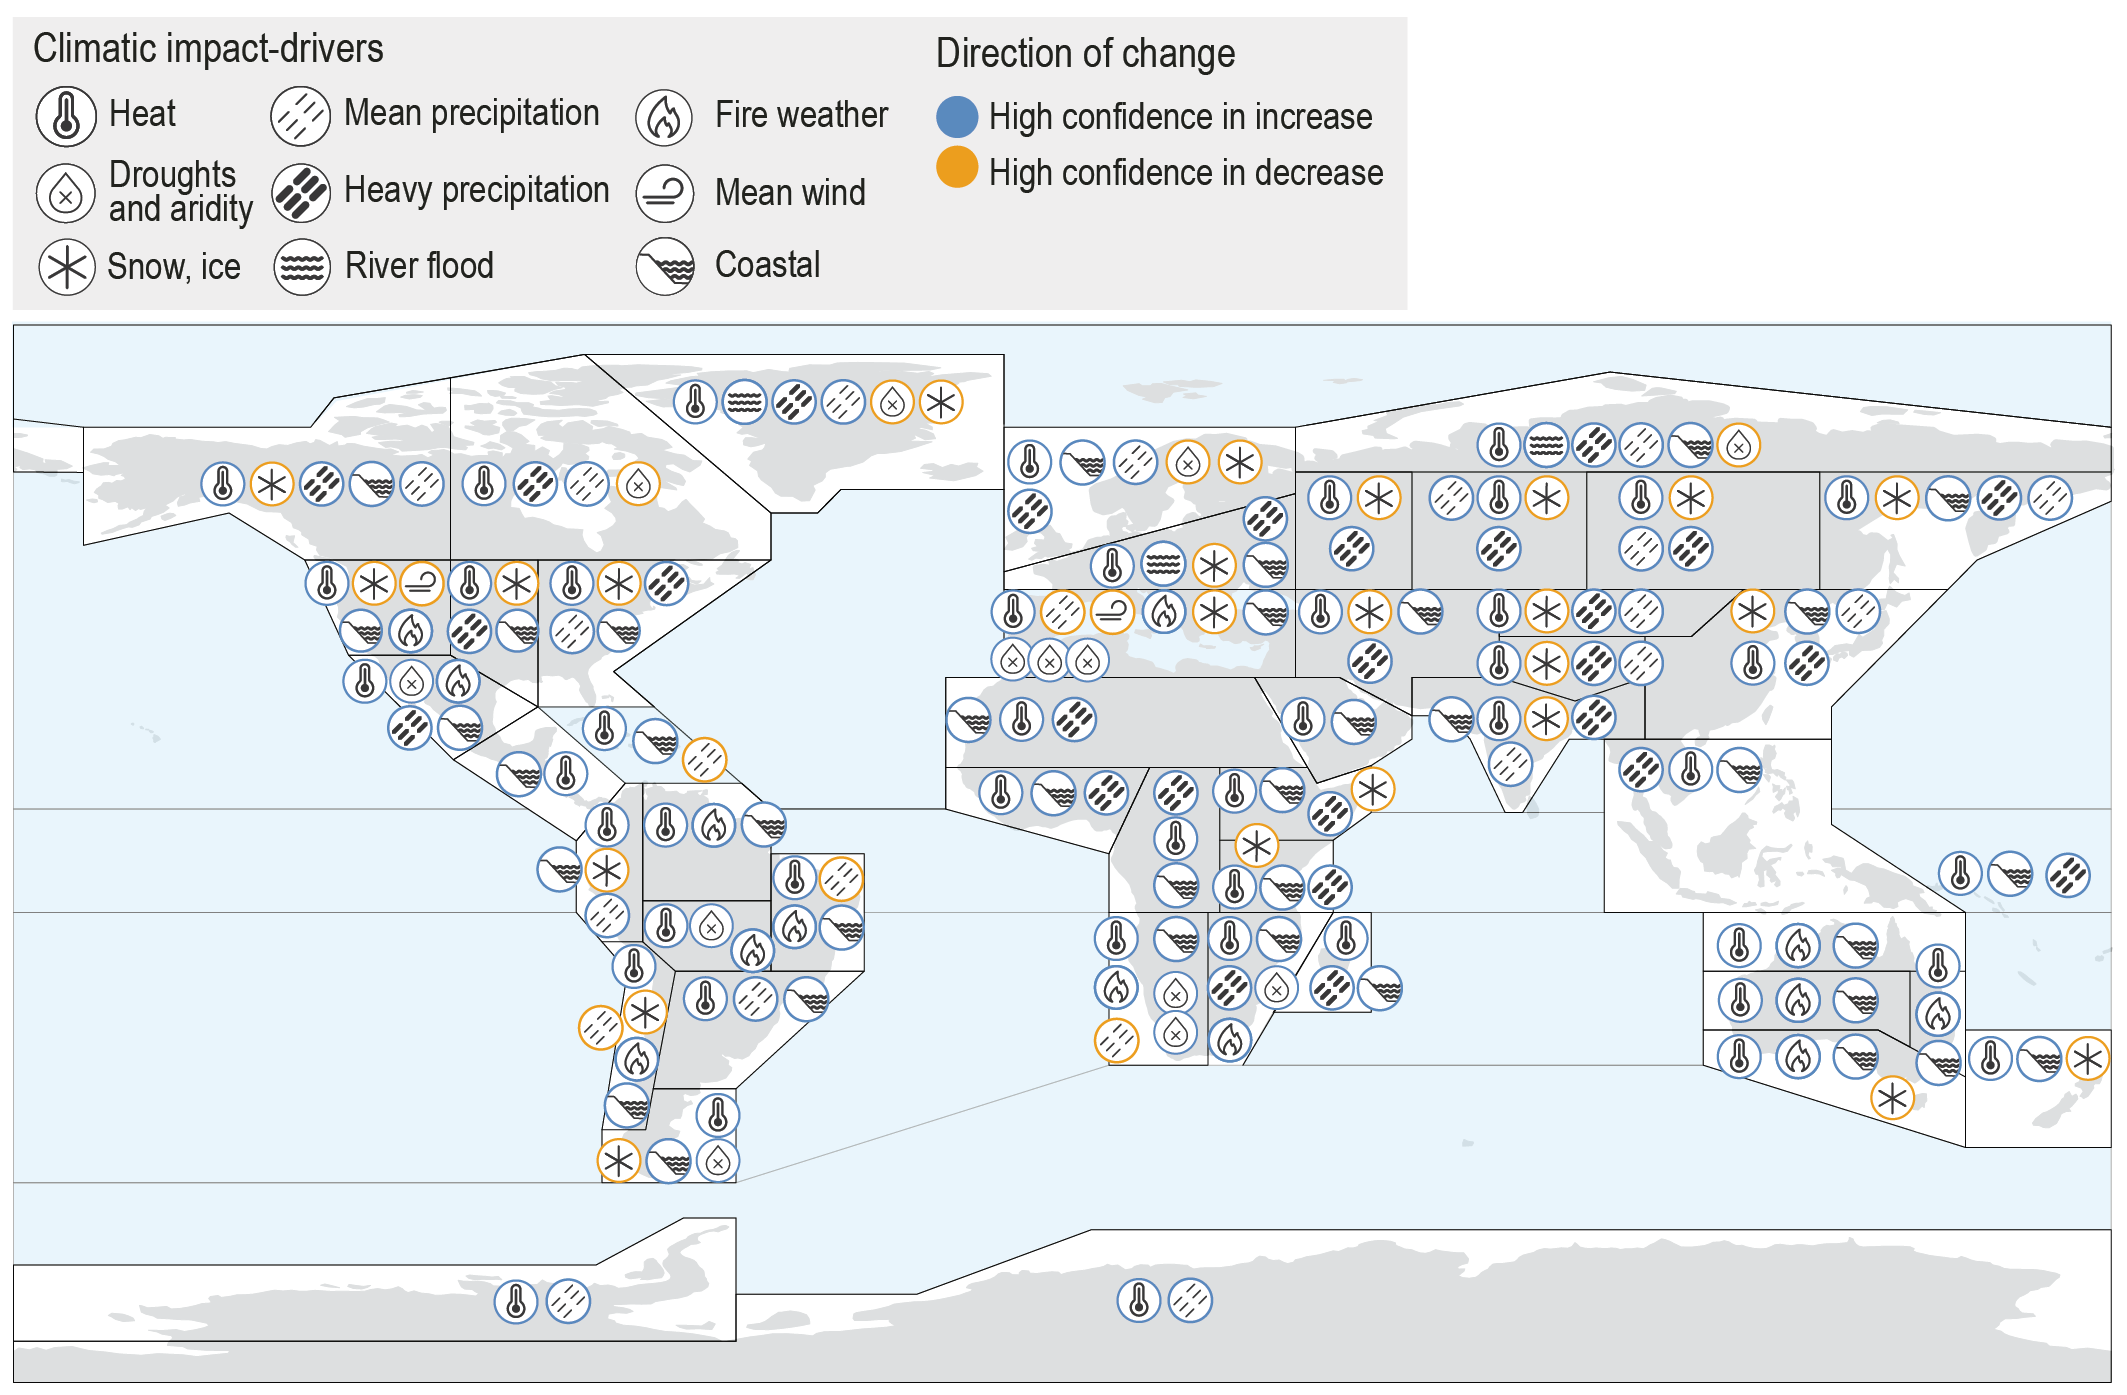 Figure 12.11 | Synthesis of the climatic impact-driver (CID) changes projected by 2050 (2041–2060) with high confidence, relative to reference period (1995–2014), together with the sign (direction) of change. Information is taken from the CID tables in Section 12.4. Some CIDs are grouped in order to streamline the information in order to fit in all information in the figure. Mean temperature, extreme heat, cold spells and frost are grouped under a single ‘heat’ icon, as they are projected to change simultaneously, albeit heat and cold are changing in opposite directions. Coastal CIDs (relative sea level, coastal flooding and coastal erosion at sandy beaches) are also grouped. In the figure, the ‘coastal’ icon indicates regions where at least two of the three individual coastal CIDs are projected to change with high confidence. Cases where only two of the three CIDs increase with high confidence are in Arctic Northern Europe, Russian Arctic and Arctic North-Western North America. A single icon is used for aridity, hydrological drought, and agricultural and ecological drought, and only the number of drought types that change is indicated. For the ‘Snow, ice’ icon, information is taken from the evolution of the ‘Snow, glacier and ice sheet’ CID; most regions also have similar changes for ‘permafrost’ and ‘lake, river and sea ice’. Exceptions are for North-Eastern North America, Russian Arctic and Arctic North-Western North America where snow is decreasing with medium confidence (thus not appearing in the figure), while permafrost and lake, river and sea ice is decreasing with high confidence. The location of the icons within the regions is arbitrary. Icon sources: https://www.flaticon.com/authors/freepik.
 In a few other regions, only a small number of CIDs are projected to change with high confidence (e.g., Sahara, Central Africa, Western Africa, Madagascar, Arabian Peninsula, South-Eeastern South America, New Zealand, Small Islands). The lower confidence levels associated with changes in CIDs in these regions can be due either to weaker change signals compared to natural variability, or due to limited evidence and model uncertainties leading to low agreement, and does not mean that climate change will affect these regions any less than in other regions.
In summary, there is high confidence that all regions of the world will experience changes in several climatic impact-drivers by mid-century, albeit at region-specific rates of change and confidence levels for each CID. Consequently, changing CIDs have the potential to affect climate-related risks in all regions of the world.
12.5.2 Emergence of Climatic Impact-drivers Across Time and Scenarios
The emergence of a climate change signal occurs when that signal exceeds some critical threshold (usually taken to be a measure of natural variability; see for example, Hawkins and Sutton, 2012) or when the probability distribution of an indicator becomes significantly different to that over a reference period (e.g., Chadwick et al., 2019; see also Chapter 10 and Section 1.4.2), in which case external anthropogenic forcings can be detected as causal factors. The ‘time of emergence’ (ToE) or ‘temperature of emergence’ is the time or global warming level thresholds associated with this exceedance. Emergence is particularly relevant to impacts, risk assessment and adaptation because human and natural systems are largely adapted to natural variability but may be vulnerable if exposed to changes that go beyond this variability range; this is not to say that changes within natural variability have no impact, as occurrence of damaging extremes proves. Emergence also informs the timing of adaptation measures. The emergence of a change is always relative to a reference period (e.g., the pre-industrial period or a recent past), depending on the framing question. In the former case, the goal is to estimate the amplitude of an anthropogenically driven change while in the latter, it is to estimate the amplitude of change relative to a baseline that is familiar to stakeholders. Both questions are important for risk assessment, but the former may be more directly interpretable in a mitigation context. The variability also refers to a time scale, generally interannual to inter-decadal. See (Section 1.4.2 and Chapter 10 for more details about how emergence is defined and used in the literature.
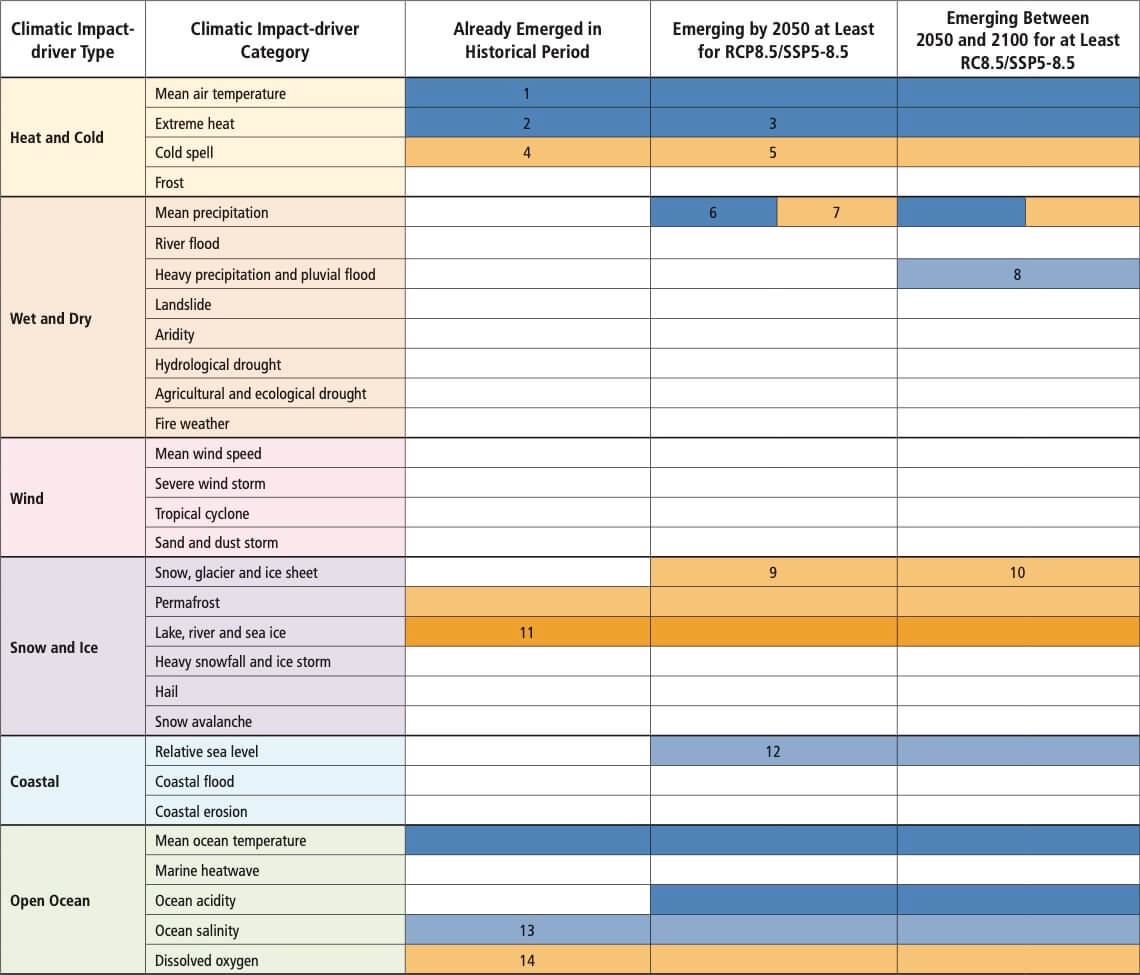
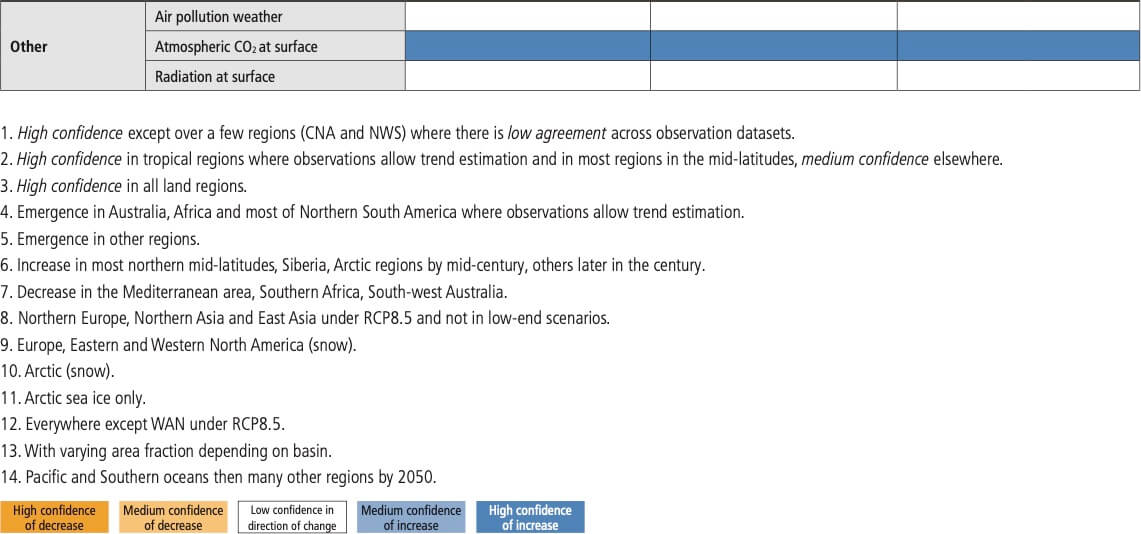
Changes in climatic impact-drivers may remain within the range of natural variability or have a time of emergence that varies by region and scenario. This section assesses the evidence for the effects of anthropogenic climate change on the emergence of changes in CID index, past, present and future, as evidenced by the literature assessed in other chapters, as well as additional literature assessed here, at both global and regional scales. In many cases, however, sufficient literature for a robust region-by-region assessment of ToE is lacking. The assessment herein is made by CID. Regional emergence assessment is reported in Tables 12.3–12.11 but is undertaken in this section.
Estimations of ToE must be done with caution given the many sources of inherent uncertainties, such as observations representing only a single realization of climate history, internal variability (whose frequency – e.g., annual or decadal – needs to be precisely defined), model biases, and potential low-frequency changes in variability (Chapter 10; Lehner et al., 2017). In addition, a homogeneous interpretation of multiple studies is hampered by heterogeneous methodologies used to calculate emergence. In this section, we assess emergence and its confidence level based on such multiple methods as provided by the literature, and unless specified otherwise, emergence here refers to a signal to noise ration S/N > 1 relative to a pre-industrial baseline and interannual variability (the ‘noise’). Furthermore, observed trends and attribution are taken into account in combination with climate simulations (historical or projections) for assessing whether a trend has already emerged in the historical period.
Mean air temperature: Warming of mean annual temperatures has already emerged in all land regions, as obtained from past observations and confirmed by historical simulations (high confidence) (Figure 1.13; King et al., 2015; Hawkins et al., 2020), with S/N ratios larger than two. In the current climate, the highest S/N ratios exceed five over Central Africa, Amazonia, East and South East Asia. Seasonal warming emergence depends on the season. Because the temperature variability in the mid-latitudes is higher in winter than in summer, the emergence of seasonal warming occurs for summer but not for winter in most of this part of the world. In Europe, summer warming has emerged in all regions (medium confidence, medium agreement), and in North America, it has emerged only over Eastern and Western regions while in winter there is low confidence of an emergence in warming in all regions for both Europe and North America (Lehner et al., 2017; Hawkins et al., 2020). When considering the climate of the end of the 20th century (i.e., recent past) as a baseline, the emergence of mean temperature is projected at very different times depending on the scenario. For instance, emergence is reached by 2050 under RCP8.5 in most areas of Europe, Australia or East Asia, but it does not occur within the 21st century under RCP2.6 (medium confidence) (Sui et al., 2014; Im et al., 2021). This means that under RCP2.6, mean temperatures stay within the recent climate variability range observed in the mid-latitudes. However, even under RCP2.6, mean temperatures in tropical regions that have not already emerged are projected to emerge before 2050 (medium confidence).
Extreme heat and cold: An increase in heat extremes has emerged or will emerge in the coming three decades in most land regions (high confidence) (Chapter 11; King et al., 2015; Seneviratne and Hauser, 2020), relative to the pre-industrial period, as found by testing significance of differences in distributions of yearly temperature maxima in simulated 20-year periods. In tropical regions, wherever observed changes can be established with statistical significance, and in most mid-latitude regions, there is high confidence that hot and cold extremes have emerged in the historical period, but only medium confidence elsewhere. In other regions emergence is projected at the latest in the first half of the 21st century under RCP8.5 (high confidence) (King et al., 2015; Seneviratne and Hauser, 2020). Relative to the end of 20th-century conditions, changes in humid heat stress as characterized by wet bulb temperature, indicates a ToE as early as in the first two decades of the 21st century in RCP8.5 at least in many tropical regions (most of Africa in the band 20°S–20°N, South Asia and South East Asia) (medium confidence) (Im et al., 2021). By 2050 and under RCP8.5, wet bulb temperature is projected to emerge in many other areas such as Southern Africa, North Africa, Europe, and most of Central, Southern and Eastern Asia and Northern and Eastern Australia, while under RCP2.6, emergence is either reached later in the century (Europe, Central Asia, Northern Australia), or never reached in the century (Im et al., 2021). Decrease of cold spells has already emerged above the interannual variability in Australasia, Africa and most of Northern South America, and they are projected to emerge before 2050 in the northern mid-latitudes and in Southern South America (King et al., 2015) under RCP8.5 (medium confidence, limited evidence and high agreement).
Mean precipitation: Mean precipitation changes only emerged over a few regions in the historical period (increase in Northern and Eastern Europe and decrease in West Africa and Amazonia) from observations with an S/N ratio larger than one (low confidence) (Hawkins et al., 2020). The emergence of increasing precipitation before the middle of the 21st century is found across scenarios in Siberian regions, Russian Far East, Northern Europe, Arctic regions and the northernmost parts of North America (high confidence) and later in other northern mid-latitude areas, depending on the scenario, albeit with different methods and emergence definitions used in climate projections (Chapter 8; Giorgi and Bi, 2009; Maraun, 2013; King et al., 2015; Akhter et al., 2018; Kumar and Ganguly, 2018; Nguyen et al., 2018; Barrow and Sauchyn, 2019; Rojas et al., 2019; Kusunoki et al., 2020; Pohl et al., 2020; W. Li et al., 2021). Decreases in mean precipitation are projected to emerge in parts of Africa by the middle of the century, and later in the Mediterranean and Southern Australia, but the emergence depends on the scenario, and specific seasons for crop growth (Nguyen et al., 2018; Rojas et al., 2019). Mean precipitation does not emerge in any of these regions at any time in the 21st century under RCP2.6, but emerges in all under RCP8.5. ToE under RCP4.5 is projected to be around 25 years later relative to RCP8.5 in many of the early emergence regions, highlighting the importance of mitigation to gain more time for adaptation.
Heavy precipitation and floods: There is low confidence in the emergence of heavy precipitation and pluvial and river flood frequency in observations, despite trends that have been found in a few regions (Chapters 8 and Chapter 11, and across (Section 12.4). In climate projections, the emergence of increase in heavy precipitation strongly depends on the scale of aggregation (Kirchmeier-Young et al., 2019), with, in general, no emergence before a 1.5°C or 2°C warming level, and before the middle of the century (medium confidence), but results depend on the method used for the calculation of the ToE (Maraun, 2013; King et al., 2015; Kusunoki et al., 2020). Emergent increases in heavy precipitation are found in several regions when aggregated at a regional scale in Northern Europe, Northern Asia and East Asia, at latest by the end of the century in SRES A1B or RCP8.5 scenarios or when considering the decadal variability as a reference (medium confidence) (Maraun, 2013; W. Li et al., 2018, 2021; Kusunoki et al., 2020). There have been few emergence studies for streamflow and flooding, although one study showed emergence of different hydrological regimes at different times during the 21st century across the USA (Leng et al., 2016). Variability in extreme streamflows from year to year can be high relative to a trend (Zhuan et al., 2018). Given the heterogeneity of methods and results, there is only low confidence in the emergence of heavy precipitation and flood signals in any region when considering the S/N ratio.
Droughts, aridity and fire weather: There is low confidence in the emergence of drought frequency in observations, for any type of drought, in all regions. Even though significant drought trends are observed in several regions with at least medium confidence (Sections 11.6 and 12.4), agricultural and ecological drought indices have interannual variability that dominates trends, as can be seen from their time series (medium confidence) (H. Guo et al., 2018; Spinoni et al., 2019; Haile et al., 2020; M. Wu et al., 2020). Studies of the emergence of drought with systematic comparisons between trends and variability of indices are lacking, precluding a comprehensive assessment of future drought emergence. Historical climate simulations indicate that fire weather indices have already emerged in several regions (the Amazon basin, Mediterranean, Central America, West and Southern Africa) (low confidence, limited evidence) (Abatzoglou et al., 2019), and emergence is projected with low confidence by the middle of the century in several other regions (Southern Australia, Siberia, most of North America and Europe) when considering several indices together.
Wind: Observed mean surface wind speed trends are present in many areas (Section 12.4), but the emergence of these trends from the interannual natural variability and their attribution to human-induced climate change remains of low confidence due to various factors such as changes in the type and exposure of recording instruments, and their relation to climate change is not established. For future conditions, there is limited evidence of the emergence of trends in mean wind speeds due to the lack of studies quantifying wind speed changes and their interannual variability. The same limitation also holds for wind extremes (severe storms, tropical cyclones, sand and dust storms).
Snow and ice: The decrease in the Northern Hemisphere snow cover extent in spring has already emerged from natural variability (Section 3.4.2). The snow cover duration period is projected to emerge over large parts of Eastern and Western North America and Europe by the mid-century both in spring and autumn, and emergence is expected in the second half of the 21st century in the Arctic regions in the high RCP8.5 scenario (medium confidence) (Chapter 9, SROCC). For snow depth or snow water equivalent, there is low confidence (limited evidence) of the emergence of a decrease before 2050 because climate change also increases the variability of the snow depth signal, for example in Europe (Section 3.4.2; Willibald et al., 2020). Terrestrial permafrost is warming worldwide due to climate change (Sections 2.3.2.5 and 9.5.2). Due to weak interannual variability of permafrost temperatures, terrestrial permafrost warming has emerged above natural variability in almost all observed time series of the Northern Hemisphere (medium confidence, limited evidence, high agreement) (Biskaborn et al., 2019), but the active layer thickness exhibits considerable interannual variability inhibiting evidence for emergence (Chapter 9).
Sea ice: Sea ice area decrease in the Arctic in all seasons has already emerged from the interannual variability (high confidence) (Chapter 9). By contrast, the Antarctic sea ice area shows no significant trend, and therefore no emergence.
For other snow and ice CIDs (heavy snowfall and ice storm, hail, snow avalanche), there is limited evidence of emerging signals.
Relative sea level, coastal flood and coastal erosion: Near-coast RSLR will emerge before 2050 for RCP4.5 along the coasts of all AR6 regions (with coasts) except East Asia, the Russian Far East, Madagascar, the southern part of Eastern North America and the Antarctic regions (medium confidence) (Section 9.6.1.4; Bilbao et al., 2015). Under RCP8.5, emergence of near-coast RSLR is projected by mid-century along the coasts of all AR6 regions (with coasts), except WAN where emergence is projected to occur before 2100 (Section 9.6.1.4; Lyu et al., 2014) (medium confidence). Emergence studies for ETWL and coastal erosion are lacking and hence it is not currently possible to robustly assess emergence in these CIDs.
Mean ocean temperature and marine heatwave: The emergence of the sea surface temperature increase signal has been observed in global oceans over the last century, and the largest S/N values are found in the tropical Atlantic and tropical Indian oceans (Hawkins et al., 2020). There is high confidence in the widespread occurrence of marine heatwaves in all basins and marginal seas over the last decades (Chapter 9), but the emergence of this signal above the natural variability has not yet been addressed in detail.
Ocean acidity, ocean salinity and dissolved oxygen: The global ocean pH decline has very likely emerged from natural variability for more than 95% of the global open ocean (SROCC, Chapter 2). The regional signals are more variable, but in all ocean basins, the signal of ocean acidification in the surface ocean is projected to emerge in the early 21st century (Chapter 5). The mean ToE for acidity in the coastal subtropical to temperate north-east Pacific and north-west Atlantic is above two decades (high agreement, medium evidence) (Section 5.3.5.2). Salinity change signals have already emerged with 20–45% of the zonally averaged basin in the Atlantic, 20–55% in the Pacific and 25–50% in the Indian oceans and will be reaching 35–55% in the Atlantic in 2050 to 55–65% in 2080; 45–65% to 60–75% in the Pacific; and 45–65% to 60–80% in the Indian oceans (Chapter 9; Silvy et al., 2020). Deoxygenization has already emerged in many open oceans. The signal is most evident in the Pacific and Southern oceans but not evident in the North Atlantic Ocean (Andrews et al., 2013; Levin, 2018). However, there is medium confidence in the emergence of the anthropogenic signal in many other oceanic regions by 2050 (Henson et al., 2017; Levin, 2018).
There is high confidence that several CID changes have already emerged above historical period natural variability in many regions (e.g., mean temperature in most regions, heat extremes in tropical areas, sea ice, salinity). Heat and cold CIDs (excluding frost) that have not already emerged will emerge by 2050 whatever the scenario in almost all land regions (medium confidence). The emergence of increasing precipitation before the middle of the century is also projected in Siberian regions, Russian Far East, Northern Europe and the northernmost parts of North America and Arctic regions across scenarios with the various methods and emergence definitions used (high confidence). Studies are missing to properly assess S/N emergence for droughts and for wind CIDs. Arctic sea ice extent declines have mostly emerged above noise level (medium to high confidence), and the emergence of declining snow cover is expected by the end of the century under RCP8.5. There is medium confidence that, under RCP8.5, the anthropogenic forced signal in near-coast relative sea level change will emerge by mid-century in all regions with coasts, except in the West Antarctic region where emergence is projected to occur before 2100. In all ocean basins, the signal of ocean acidification in the surface ocean is projected to emerge before 2050 (high confidence).
Cross-Chapter Box 12.1 | Projections by Warming Levels of Hazards Relevant to the Assessment of Representative Key Risks and Reasons for Concern
Contributors: Claudia Tebaldi (United States of America), Guofinna Aoalgeirsdottir (Iceland), Sybren Drijfhout (United Kingdom), John Dunne (United States of America), Tamsin Edwards (United Kingdom), Erich Fischer (Switzerland), John Fyfe (Canada), Richard Jones (United Kingdom), Robert Kopp (United States of America), Charles Koven (United States of America), Gerhard Krinner (France), Friederike Otto (United Kingdom/Germany), Alex C. Ruane (United States of America), Sonia I. Seneviratne (Switzerland), Jana Sillmann (Norway/Germany), Sophie Szopa (France), Prodromos Zanis (Greece)
A consistent risk framework (Reisinger et al., 2020) has been adopted across the three Working Groups (WGs) in IPCC AR6 while recognizing the diversity of risk concepts across disciplines. WGI is assessing changes in climatic impact-drivers (CIDs), which are physical climate system conditions (e.g., means, events and extremes) that affect an element of society or ecosystems. Depending on system tolerance, CIDs and their changes can be detrimental, beneficial, neutral, or a mixture of each across interacting system elements and regions (Sections 12.1–12.3). In the assessment of Representative Key Risk (RKR) categories and Reasons for Concern (RFCs) in WGII Chapter 16, the focus lies on the adverse consequences of climate change, for which many types of CIDs (i.e., ‘hazards’ in the context of identified risks) play a key role. This box synthesizes the assessment of such hazards according to global warming levels (GWLs) from various chapters of WGI to inform understanding of their potential changes and associated risks with temperature levels in general, and in particular to facilitate WGII integrated assessments of RKRs and RFCs. Cross-Chapter Box 11.1, connects the organization of regional information according to GWLs to the other common dimension along which future projections are organized: that is, scenarios. Section 1.6 describes all dimensions of integration adopted in this Report, adding cumulative carbon emissions to GWLs and scenarios.
Eight RKRs are identified within WGII Chapter 16:
- RKR-A: risk to the low-lying coastal socio-ecological systems;
- RKR-B: risk to terrestrial and ocean ecosystems;
- RKR-C: risks associated with critical physical infrastructure, networks and services;
- RKR-D: risk to living standards;
- RKR-E: risk to human health;
- RKR-F: risk to food security;
- RKR-G: risk to water security; and
- RKR-H: risks to peace and to human mobility.
RFCs further synthesize the landscape of risks from climatic changes into five categories (from the IPCC Third Assessment Report onward; Smith et al., 2001):
- RFC1: risks to unique and threatened systems;
- RFC2: risks associated with extreme weather events;
- RFC3: risks associated with the distribution of impacts;
- RFC4: risks associated with global aggregate impacts; and
- RFC5: risks associated with large-scale singular events.
Importantly, the assessment of risk in WGII considers hazards as only one component of an integrated assessment that involves their complex interaction with exposure and vulnerability of the systems at risk (Reisinger et al., 2020).
Hazards relevant to RKRs and RFCs are identified among aspects of the climate system that have an episodic, short-term nature, like extreme events (particularly relevant to RFC2 but contributing to many other risk categories). Increasing GWLs translate into changing characteristics of frequency, duration, intensity, seasonality and spatial extent for many of these hazards that are also apparent in scenario-based results (Chapters 11 and 12, and Sections 12.4 and 12.5.1). Other relevant hazards coincide with long-term trends embodying a gradual change that may result in unfavourable environmental conditions. Also, increasing GWLs increase the likelihood of compound temporal or spatial occurrence of similar or different hazards (Section 11.8). Furthermore, RFC5’s focus on singular events includes concern surrounding potential tipping points and irreversible behaviour in the physical climate system.
Cross-Chapter Box 12.1, Table 1 organizes information by hazard and presents current state and future change assessments with increasing GWLs (defined by increasing global surface air temperature, GSAT; see Cross-Chapter Box 2.3). We draw on individual chapters across the WGI report for the assessment of how these hazards vary with GWL. Hazards for which a relation to GWLs has not been assessed are not reported in the table.
Cross-Chapter Box 12.1
Cross-Chapter Box 12.1, Table 1 | Summary of CIDs/hazards that are identified as driving RKRs and RFCs. The behaviour of each (in most cases considered at the global scale, but for some types in terms of spatially resolved patterns) as a function of GWLs is described and when possible quantified, together with the level of confidence of the assessment, to be found in more detail in the chapter/sections indicated in the corresponding column. For the relation with GSAT levels, two columns detail current state, which can be associated to about 1°C of global warming, and future behaviour. Tipping Points and Irreversibility are comprehensively assessed with CMIP6 models up to GWL = 3°C, with fewer studies and lower confidence at higher GWLs up to 5°C.
Hazard Category Sub-category | RKR/RFC Relevance | Behaviour at About 1°C (Present) | Behaviour as a Function of GWL (Future) | WGI Chapter References |
Extreme Events | ||||
Hot and Cold Extremes | All RKRs; RFC2, RFC3 | Frequency and intensity of hot extremes increased and cold extremes decreased at the global scale and in most regions since 1950 (GSAT change about 0.6°C) (virtually certain). Number of warm days and nights increased; intensity and duration of heatwaves increased; number of cold days and nights decreased (virtually certain). Regional-to-continental scale trends generally consistent with global-scale trends (high confidence). Limited data in a few regions (especially Africa) hampers trend assessment. | Strong linear relation between magnitude and intensity of heat and cold extremes and GSAT, detectable from warming as low as 1.5°C; changes in the extreme metrics twice as large (in mid-latitude regions) or more (in high-latitude regions) than GSAT warming (very likely) ; metrics related to frequency of exceedance may show stronger than linear relationships (exponential) (very likely) . Compared to today, changes in extremes at +2°C at least two times larger than at +1.5°C, and four times larger at +3°C. | Sections 11.3, 11.9, 12.4; Figures 11.3, 11.4, 11.6, 11.11, 11.12; Table 11.2. |
Extreme Precipitation Events | All RKRs; RFC2, RFC3 | Frequency and intensity of heavy precipitation events increased at the global scale over a majority of land regions with good observational coverage (high confidence) and at the continental scale in North America, Europe and Asia. Larger percentage increases in heavy precipitation observed in the northern high latitudes in all seasons, and in the mid-latitudes in the cold season (high confidence). Regional increases in the frequency and/or intensity of heavy rainfall also observed in most parts of Asia, north-west Australia, northern Europe, South-Eastern South America, and most of the USA (high confidence), and West and Southern Africa, Central Europe, the eastern Mediterranean region, Mexico, and North-Western South America (medium confidence). GHGs likely the main cause. | Precipitation events – including those associated with tropical cyclones (TCs) – increase with GSAT. For GWLs >2°C very rare (e.g., 1-in-10 or more years) heavy precipitation events more frequent and more intense over all continents (virtually certain) and nearly all AR6 regions (likely) . Likelihood lower at lower GWLs and for less-rare events. At the global scale, intensification of heavy precipitation generally follows Clausius–Clapeyron (about 6–7% per °C of GSAT warming; high confidence). Increase in frequency of heavy precipitation events accelerates with warming, higher for rarer events (high confidence), with approximately a doubling and tripling frequency of 10-year and 50-year events, respectively, at 4°C of global warming. | Sections 11.4, 11.7, 12.4; Figures 11.4, 11.7, 11.15, 11.16; Table 11.2. |
Drought | All RKRs; RFC2, RFC3 | Increased atmospheric evaporative demand in dry seasons over a majority of land areas due to human-induced climate change (medium confidence). Especially observed in dry summer climates in Europe, North America and Africa (high confidence). | Upward trend with GSAT (high confidence). | Sections 11.6, 12.4; Figure 11.18; Table 11.2. |
Inland Floods | All RKRs; RFC2, RFC3 | Upward trend with GSAT for flooded area extent, starting from 2°C compared with 1.5°C and higher levels. Increase in the frequency and magnitude of pluvial floods (high confidence). Increasing flood potential in urban areas where heavy precipitation projected to increase, especially at high GWLs (high confidence). | Sections 11.5, 12.4; Table 11.2. | |
Tropical Cyclones (TCs) | All RKRs; RFC2, RFC3 | Human contribution to extreme rainfall amount from specific TC events (high confidence). Global proportion of major TC intensities likely increased over the past four decades. | Increase in precipitation from TC with GSAT; average peak TC wind speeds, proportion of intense TCs, and peak wind speeds of most intense TCs increase globally with GSAT (high confidence). Decrease or lack of change in global frequency of TCs (all categories) with GSAT (medium confidence). | Sections 11.7.1, 12.4; Table 11.2. |
Marine Heatwaves (MHWs) | RKR A,B,F; RFC1,2,3 | High confidence that MHWs have increased in frequency over the 20th century, with an approximate doubling from 1982 to 2016, and medium confidence that they have become more intense and longer since the 1980s. | MHWs very likely become 2–9 times more frequent in 2081–2100 compared to 1985–2014 under SSP1-2.6 corresponding to a GWL of 2.0 [1.3 to 2.8] °C (95% CI), or 3–15 times more frequent under SSP5-8.5 corresponding to a GWL of 4.8 [3.6 to 6.5] °C. Spatial heterogeneity with larger changes in the tropical oceans and Arctic Ocean (medium confidence). | Section 12.4; Box 9.2. |
Concurrent Events in Time and Space | All RKRs; RFC2, RFC3 | Higher frequency already detected: more frequent concurrent heatwaves and droughts. Increased compound flooding risk (storm surge, extreme rainfall and/or river flow) in some locations; the probability of concurrent events likely increased. | Higher frequency with increasing GSAT. Increasing trend in more frequent concurrent heatwaves and droughts with GSAT (high confidence). More frequent concurrent (in time) extreme events at different locations with increasing GSAT, for GWLs > 2°C (high confidence). Compound flooding risk (storm surge, extreme rainfall and/or river flow) increasing with GSAT (high confidence). | Section 11.8; Table 11.2; Boxes 11.2, 11.4. |
Trends | ||||
Fire Weather Trends | RKR-B, C; RFC1,2,3 | Weather conditions that promote wildfire (compound hot, dry and windy events) more probable in some regions over the last century (medium confidence). | Weather conditions promoting wildfire (compound hot, dry and windy events)likely more frequent with GSAT. | Section 12.4; Table 11.2. |
Air Pollution Weather | RKR-E; RFC3 | Not discernible. | Behaviour to first order controlled by emissions and policies, not by meteorology. Ozone decreases with GSAT in low-polluted regions (−0.2 to –2 ppbv per °C). Ozone increases with GSAT in regions close to sources of precursors (0.2 to 2 ppbv per °C). | Sections 6.5, 12.4. |
Patterns of Mean Warming | RKR-B, D, F, RFC1,3,4 | Spatial patterns of temperature changes associated with the 0.5°C difference in GMST warming between 1991–2010 and 1960–1970 consistent with projected changes under 1.5°C and 2°C of global warming. | Temperatures scale approximately linearly with GSAT, largely independently of scenario (high confidence). High latitudes of Northern Hemisphere warm faster (virtually certain). Antarctic polar amplification smaller than Arctic (high confidence). Arctic annual mean temperatures warm between 2 and 2.4 times faster for GWLs between 1.5°C and 4°C. In the Southern Hemisphere relatively high rates of warming in subtropical continental areas of South America, Southern Africa and Australia (high confidence). | Sections 4.6.1.1, 12.4; Atlas; Figures 4.31, Atlas.13 and all (Atlas Sections’ figures for mean temperature changes. |
Arctic Warming Trends | RKR-A,C,G,H; RFC1, RFC3 | Emerged already from internal variability. | Very likely more pronounced (2–2.4 times faster) than the global average over the 21st century (high confidence). | Sections 4.6.1, 7.4.4.1, 12.4.9 Atlas.11; Figures 4.19, 4.31, Atlas.29; Table 4.2. |
Patterns of Precipitation Change | RKR-B, D, F, RFC1, RFC3 | Regional patterns of recent trends, over at least the past three decades, consistent with documented increase in precipitation over tropical wet regions and decrease over dry areas. | Changes in large-scale atmospheric circulation and precipitation with each 0.5°C of warming (high confidence). Stable pattern of change over time and scenarios. Some departures from linearity possible at regional scale (medium confidence). Precipitation increase on land higher at 3°C and 4°C compared to 1.5°C and 2°C. Precipitation increases in large parts of the monsoon regions, tropics and high latitudes, decreases in the Mediterranean and large parts of the subtropics (high confidence). | Sections 2.3.1.3.4, 4.5.1, 4.6.1, 12.4; Figures 2.15, 4.32, Atlas.13. |
Sea Surface Temperature (SST) Warming | RKR-A, B, D; RFC1, RFC4 | Increased 0.81 (0.65–0.94) per °C of GSAT (1850–1900 average compared with 2009–2018 average). | Models and observations show globally averaged SSTs warming at a lower rate of about 80% that of GSAT. It is virtually certain that SST will continue to increase at a rate depending on future emissions scenario ranging from 0.4°C–1.5°C in 2081–2100 relative to 1995–2014 under SSP1-2.6, corresponding to a GWL of 2.0 [1.3 to 2.8] °C, to 2°C–4°C under SSP5-8.5, corresponding to a GWL of 4.8 [3.6 to 6.5] °C. | Sections 2.3.1.1.3, 9.2.1, 12.4. |
Ocean Acidification/pH | RKR-A,B; RFC1, RFC4 | Virtually certaindecline of surface pH globally over the last 40 years at a rate of 0.017–0.027 pH units per decade; decline also in the subsurface over the past 2–3 decades (medium confidence). Surface pH now the lowest of at least the last 26,000 years (very high confidence). | Increase of net ocean carbon flux throughout the century irrespective of the emissions scenario considered (high confidence). Decrease of ocean surface pH through the 21st century, except for SSP1-1.9 and SSP1-2.6 where values increase slightly starting from 2070–2100 (high confidence). | Sections 2.3.3.5, 4.3.2.4, 5.3.4, 5.4.2, 12.4; Figure 4.8. |
SPEI Index Global | RKR-B,F,G,H; RFC3 | 9.4% chance of at least three months of drought in a year at current levels (about 1°C). | Increase at the global scale in the chance of at least three months of drought in a year to about 20 [15 to 30] % at 1.5°C, 35 [20 to 45] % at 2°C to 60 [45 to 75] % at 4°C. | Sections 12.4, 12.5.1. |
El Niño–Southern Oscillation (ENSO) Variability | RKR-B,D,F,G; RFC2,3,5 | Medium confidence that both ENSO amplitude and frequency of high-magnitude events since 1950 higher than over the pre-industrial period (before 1850) but low confidence of this being outside the range of internal variability. No clear evidence shifts in ENSO or associated features or its teleconnections. | No change in the amplitude of ENSO variability (medium confidence); enhanced ENSO-related variability of precipitation under SSP2-4.5 and higher (high confidence). Likelyshift eastward of the pattern of teleconnection over North Pacific and North America. | Sections 2.4.2, 4.3.3.2, 4.5.3.2; Figure 4.10. |
Sea Ice Loss | RKR-A, B, H; RFC1,3,5 | Arctic sea ice area decreased for all months since 1970s; strongest decrease in summer (very high confidence). Arctic sea ice younger, thinner and faster moving (very high confidence). Current pan-Arctic sea ice levels unprecedented since 1850 (high confidence). Low confidence in all aspects of Antarctic sea ice prior to the satellite era. Antarctic sea ice area experienced little net change since 1979 (high confidence). | The Arctic Ocean will likely become sea ice-free in September before 2050 in all considered SSP scenarios; such disappearance consistently occurring in most years at 2°C–3°C (medium confidence) and including several months in most years at 3°C–5°C (high confidence). | Sections 2.3.2, 4.3.2.1, 9.3.1, 9.3.2, 12.4.9; Figures 4.2c, 4.5. |
Permafrost Thaw | RKR-A,C; RFC3,5 | Increases in permafrost temperatures in the upper 30 m over the past three to four decades throughout the permafrost regions (high confidence). | Global permafrost volume in the top 3 m decreasing by about 25 ± 5% per °C for GWLs <4°C. Relative to 1995–2014: at 1.5°C and 2°C decreasing by less than 40% (medium confidence), at 2°C and 3°C by less than 75% (medium confidence), at 3°C and 5°C by more than 60% loss (medium confidence). | Sections 2.3.2.5, 9.5.2, 12.4.9. |
Sea Level Change | RKR-A,C,D,E,F,G,H; RFC1,3,4 | Gobal mean sea level (GMSL) is rising at an accelerated rate since the 19th century (high confidence), almost doubled during past two decades (about 0.1 mm yr–2). GMSL increase over the 20th century faster than over any preceding century in at least the last three millennia (high confidence). | Up to 2050, limited scenario/GWL dependency (likely sea level rise about 0.15–0.30 m). By 2100, likely GMSL rise with respect to 1995–2014 of 0.51 (0.40–0.69) m, 0.62 (0.50–0.81) m and 0.70 (0.58–0.91) m for, respectively, GWLs of 2.0°C, 3.0°C, and 4.0°C (medium confidence). Deep uncertainty in projections for GWLs >3°C because of ice-sheet behaviour. For example, incorporation of low confidence ice-sheet processes under SSP5-8.5 (approximately 5°C) leads to a rise of 0.6-1.6 m rather than 0.7–1.1 m. | Sections 9.6.1.2, 9.6.3.3, 9.6.3.4, 12.4. |
Sea-Level Change Commitment (2,000 years after peak GWL) | RFC5 | GMSL commitment (over the 2000-year-long period following peak warming) of 2–6 m for 2°C peak warming, 4–10 m for 3°C peak warming, 12–16 m for 4°C peak warming, and 19–22 m for 5°C peak warming (medium agreement, limited evidence). | ||
Northern Hemisphere (NH) Spring Snow Cover | RKR-G, RFC1,3 | Substantial reductions in spring snow cover extent in the NH since 1978 (very high confidence). Since 1981, general decline in NH spring snow water equivalent (high confidence). | Linear change of NH snow cover in spring of about 8% (area) per °C ofglobal warming (for GWLs <4°C). Relative to 1995–2014: at 1.5°C–2°C NH spring snow cover extent likely decreases by less than 20% (medium confidence); at 2°C–3°C likely decreases by less than 30%; at 3°C–5°C, likely decreases by more than 25%. | Sections 2.3.2.2, 9.5.3, 12.4. |
Mass Loss of Glaciers | RKR-B,G; RFC1, RFC3 | Very high confidence global glaciers continuing retreat since about 1850. Current global glacier mass loss highly unusual over at least the last 2000 years (medium confidence). Increased rate of glacier mass loss over the last 3 to 4 decades (high confidence). Glaciers not in balance with respect to current climate conditions and will continue to lose mass for at least several decades. | For 1.5°C–2°C about 50–60% (low confidence) of glacier mass outside the two ice sheets and excluding peripheral glaciers in Antarctica remaining, predominantly in the polar regions. At 2°C–3°C about 40–50% (low confidence) of current glacier mass outside Antarctica remaining. At sustained 3°C–5°C 25–40% (low confidence) of current glacier mass outside Antarctica remaining. Likely nearly all glacier mass lost in low latitudes, Central Europe, Caucasus, western Canada and USA, North Asia, Scandinavia and New Zealand. | Sections 2.3.2.3, 9.5.1, 12.4. |
Tipping Points/Irreversibility | ||||
Amazon Forest Dieback | RFC1, RFC5 | Highly dependent on human disturbance. | Amazon drying and deforestation expected to cause a rapid change in the regional water cycle, possibly linked to the crossing of a climate threshold. Low confidence change will occur by 2100. | Sections 5.4.9, 8.6.2.1, 12.4.10; Table 4.10. |
Boreal Forest Dieback | RFC1, RFC5 | Highly dependent on human disturbance. | Possible if climate threshold is exceeded, but counteracted by poleward expansion. | |
Ice Sheets | RFC5 | Greenland Ice Sheet mass-loss rate increased substantially since the turn of the 21st century (high confidence). The Antarctic Ice Sheet has lost mass between 1992 and 2017 (very high confidence), with an increasing mass-loss rate over this period (medium confidence). | At sustained warming levels between 1.5°C and 2°C, the ice sheets will continue to lose mass (high confidence); on time scales of multiple centuries, the Greenland and West Antarctic ice sheets will partially be lost (medium confidence); there is limited evidence that the Greenland and West Antarctic ice sheets will be lost almost completely and irreversibly over multiple millennia; at sustained warming levels between 2°C and 3°C, there is limited evidence that the Greenland and West Antarctic ice sheets will be lost almost completely and irreversibly over multiple millennia, and high confidence in increasing risk of complete loss and increasing rate of mass loss for higher warming; At sustained warming levels between 3°C and 5°C, near-complete loss of the Greenland Ice Sheet and complete loss of the West Antarctic Ice Sheet will occur irreversibly over multiple millennia (medium confidence); substantial parts or all of Wilkes Subglacial Basin in East Antarctica will be lost over multiple millennia (low confidence). | Sections 2.3.2.4, 9.4.1, 9.4.2; Table 4.10. |
Glaciers | RFC5 | See Trends section of this table. | Continuing substantial global mass loss. | Sections 9.5.1, 12.4.9. |
Global Ocean Temperature | RFC5 | See Trends section of this table. | Centennial-scale irreversibility of ocean warming. | Sections 4.7.2, 9.6.3; Table 4.10. |
Sea Level Rise (SLR) | RFC5 | See Trends section of this table. | Centennial-scale irreversibility of sea level rise. Tipping point linked to ice-sheet behaviour. Deep uncertainty on SLR above 3°C warming. | Sections 4.7.2, 9.6.3; Table 4.10. |
Atlantic Meridional Overturning Circulation (AMOC) | RFC5 | Low agreement on 20th century trend between models and most reconstructions. Observed decline since the mid-2000s cannot be distinguished from internal variability (high confidence). | There is medium confidence an abrupt collapse will not occur before 2100; for 1.5–2°C, 2–3°C, 3–5°C warming in 2100, AMOC decline is 29, 32 and 39%, respectively, of its pre-industrial strength. | Sections 2.3.3.4.1, 9.2.3.1; Table 4.10. |
Permafrost Carbon | RFC5 | See Trends section of this table. | Will contribute as a feedback with warming, of approximately 18 ± 12 PgC per °C. Possibly non-linear but low confidence in the value of any threshold for such behaviour. Likely irreversible at centennial time scales. | Section 5.4.9; Table 4.10; Box 5.1. |
Arctic Sea Ice | RFC5 | Abrupt change already observed. | Reversible within years to decades; no tipping point or threshold beyond which loss of ice becomes irreversible (high confidence). | Sections 4.3.2, 9.3.1; Table 4.10. |
Snow Cover of Northern Hemisphere | RFC5 | See Trends section of the table | Not anticipated to present tipping point/irreversible behaviour. | |
Global Monsoon | RFC5 | Has likely increased over the last 40 years (medium confidence) and can be explained by a phase change in Atlantic Multi-decadal Variability. | Not anticipated to present tipping point/irreversible behaviour, unless AMOC collapse occurs. | Sections 4.4.1.4, 4.5.1.5, 8.6.1; Table 4.10. |
ENSO | RFC5 | See Trends section of the table. | Not anticipated to present tipping point/irreversible behaviour. | |
Methane Clathrates | RFC5 | Methane release from shelf clathrates is <10 TgCH4yr–1. | Not anticipated to present tipping point/irreversible behaviour. | Section 5.4.9; Table 4.10. |
12.6 Climate Change Information in Climate Services
Climate services are a significantly evolving source of climate change information to support adaptation, mitigation and risk management decisions. As an evolving field, there are multiple definitions of climate services (Brasseur and Gallardo, 2016). The Global Framework for Climate Services defines a climate service as the provision of climate information to assist decision-making. The service includes appropriate engagement from users and providers, is based on scientifically credible information and expertise, has an effective access mechanism, and responds to user needs (Hewitt et al., 2012).
The AR5 WGII introduced climate services as bridging the generation and application of climate knowledge, also describing their history and concepts (Jones et al., 2014). Since then, this transdisciplinary field has been growing rapidly (Brasseur and Gallardo, 2016; Hewitt et al., 2020a), with the social sciences in particular pointing out knowledge requirements for co-design and co-development of climate services (Larosa and Mysiak, 2019; Daniels et al., 2020; Steynor et al., 2020). Climate services differ from more research-driven vulnerability, impacts, and adaptation research in their orientation towards decision support (Stone and Meinke, 2005; Ruane et al., 2016; Golding et al., 2019), but overlaps exist (Bruno Soares and Buontempo, 2019). Climate services are often targeted at building resilience to climate-related hazards from near real-time to seasonal and multi-decadal time horizons, to inform adaptation to climate variability and change (Hewitt et al., 2012), widely recognized as an important challenge for sustainable development and risk management (Moss et al., 2010; Jones et al., 2014; Vaughan et al., 2018). This section focuses largely on climate change time scales (past, present and future), which are the focus of AR6 WGI.
This section introduces the current climate services landscape, assesses climate service practices and products related to climate change information and associated challenges. Cross-Chapter Box 12.2 provides concrete examples of climate services. The section builds on the introduction to climate services in Section 1.2.3.3 and the assessment of regional climate information construction – including storylines – discussed in Sections 10.3.4.2, 10.5.3 and Cross-Chapter Box 10.3. The (Atlas supports the provision of climate information across WGs by providing interactive maps and further details to the material made publicly accessible for use in climate services. WGII (Chapter 17) further elaborates on climate services as enablers for climate risk management.
12.6.1 Context of Climate Services
The idea of climate services is not new and has its roots in meteorology and climatology (Larosa and Mysiak, 2019). It can be traced back to the late 1970s and the US National Climate Program Act of 1978 (Henderson, 2016). The development of the Global Framework for Climate Services (GFCS) after the World Climate Conference-3 in Geneva brought international attention and renewed impetus to the climate services field (Hewitt et al., 2012). As a result, large investments have been made globally and regionally in the development of user-driven climate services. WMO has created Regional Climate Centres (RCCs) to facilitate climate service development by regional and national providers (Hewitt et al., 2020a). The European Union declared its ambition to stimulate ‘the creation of a community of climate services application developers and users that matches supply and demand for climate information and prediction’, giving primacy to climate services that are user-driven and science-informed (Lourenço et al., 2016), thus embracing concepts of co-design, co-development and co-evaluation of climate services (Street, 2016). Diverse and action-driven international initiatives allowed climate services to progressively shift from mitigation towards adaptation (Larosa and Mysiak, 2019). Opportunities for the development of climate services have emerged through the 2015 Agendas (Paris Agreement, Sustainable Development Goals and Sendai Framework), Nationally Determined Contributions, National Adaptation Plans, Multilateral Development Banks and Task Force on Climate-related Financial Disclosure (see Section 1.2.2).
Scientific advancements in climate services related to meteorology and climatology are still closely linked to essential climate variables (Larosa and Mysiak, 2019) and benefit from consistently growing computational power, infrastructure and storage capacity to meet the demands of higher spatially and temporally resolved climate information (Buontempo et al., 2020). Climate services also focus on impact chains, providing decision makers with information on climate change with cross-sectoral impact assessments for adaptation (Jacob and Solman, 2017). Today there is a diversity of climate services that involve interpretation, analysis, and communication of different sources of climate data, ideally combining different types of knowledge (scientific/technical, experiential, indigenous, etc.), to a targeted group of decision makers (Parris et al., 2016; Olazabal et al., 2018; Pezij et al., 2019). Jacobs and Street (2020) argue that climate services should be expanded to also address societal challenges, such as system transformation, that include climate in the context of other risks and development challenges.
Climate services are undertaken in public and private sectors at global, regional, national, and local scales (Hewitt et al., 2012, 2020b; Cortekar et al., 2020). Intermediaries such as private sector consulting companies, national climate service providers, research organizations, government agencies or academic institutions provide climate services that translate aspects of climate research to the specific context of decision makers (see also Section 10.5). The EU Roadmap for Climate Services (EC, 2015; Street, 2016) focuses on developing a market for climate services comprising of both public and private domains. The GFCS, under the leadership of several United Nations Agencies, emphasizes the public domain by supporting national and regional capacity building and development of climate services mainly through National Meteorological and Hydrological Services (Hewitt et al., 2012; Domingos et al., 2016; Sivakumar and Lucio, 2018; WMO, 2018). There are ongoing debates about the commercialization of climate services (M.S. Brooks, 2013; WMO, 2015; Webber and Donner, 2017; Hoa, 2018; Troccoli et al., 2018; Bruno Soares and Buontempo, 2019; Hewitt et al., 2020a). Some argue that the commercialization of climate services is needed to meet the diverse needs of specific clients and to drive innovation in the field (M.S. Brooks, 2013; Troccoli, 2018a). Others argue that if climate services shift incentives for climate science away from the public interest towards profit-seeking, this will result in less publicly accessible and transparent climate information and more private knowledge (Keele, 2019; Tart et al., 2020).
Some climate adaptation planning already uses climate information as provided by the IPCC. However, depending on the decision context, this information may be too coarse, too broad or too disciplinary to directly inform decision-making at the scale where adaptation measures are taken (Howarth and Painter, 2016; Nissan et al., 2019). Thus, while the IPCC’s role is clearly perceived as that of a reference – an authoritative starting point – there is a need for complementary information to translate the assessments at the national, local or sectoral level (Howarth and Painter, 2016; Kjellström et al., 2016; van den Hurk et al., 2018; Vaughan et al., 2018). The AR6 Interactive Atlas (see Atlas.2) does provide a collection of observational data and global and regional climate projections. It is designed as a climate service towards the needs of WGI and beyond, to assess the state of the climate by offering data, maps and a level of expert analysis by aggregation of results to regions, scenarios and warming levels.
12.6.2 Assessment of Climate Services Practice and Products Related to Climate Change Information
The climate services landscape is fast growing and very broad, as reflected in the vast diversity of practices and products that can be found in the peer-reviewed literature (very high confidence). However, a large part of climate services practices and products is published in ‘grey’ literature (i.e., non-peer reviewed or non-academic) by private consultancy and non-scientific civil organizations, many of which are not in the public domain. In addition, the respective climate service context of a specific stakeholder in a sector dictates what climate information is required and on what scales and in what format it is most usefully provided. The extent and type of engagement between scientists and users is another critical aspect of climate services (see Cross-Chapter Box 12.2, Figure 1, and Section 10.5). The assessment here can thus only provide a partial and rather general representation of available practices and products in the evolving climate services field.
User needs and decision-making contexts are very diverse and there is no ‘one size fits all’ solution to climate services (very high confidence) (Hewitt et al., 2017b; K. Vincent et al., 2018b). In many cases this requires recognizing that stakeholders make decisions through a combination of scientific information and additional values (Vanderlinden et al., 2017; Parker and Lusk, 2019; see also Sections 1.2.3 and 10.5.4). The emerging climate service literature may clarify some features of climate information requested by users, for instance climatic impact-driver identification and prioritization through stakeholder engagement; the specification of thresholds for various regions/sectors; the types of metrics (magnitude/intensity, frequency, duration, timing, spatial extent) that are of primary interest; and decision support systems where informatics allow stakeholders to custom-make impact-relevant thresholds and then query databases to understand current and future characteristics (Bachmair et al., 2016; Buontempo et al., 2020). However, users also ask for capacity building activities related to basic knowledge in climate change sciences and climate-related risks (De Bruin et al., 2020; Sultan et al., 2020).
Since AR5 and SROCC (Chapter 2) there has been considerable progress in understanding climate information user needs (Baztan et al., 2017; Golding et al., 2017a, b, 2019; Bruno Soares et al., 2018a; Hewitt and Golding, 2018; Singh et al., 2018; Sivakumar and Lucio, 2018; Bessembinder et al., 2019; Hewitt et al., 2020b; Sultan et al., 2020; Y. Wang et al., 2020), better facilitation of user engagement (Buontempo et al., 2014, 2018; Buontempo and Hewitt, 2018) and an appreciation from climate scientists of the need to involve communication specialists and social scientists to support the co-design and co-development process that is fundamental to a successful climate service (Buontempo et al., 2014; Gregow et al., 2016; Damm et al., 2020).
Climate services require user engagement and can take various forms in which climate information and data are delivered or communicated to the users (very high confidence). Different levels of user engagement exist, which can range from passive engagement to interactive group activities, to focused relationships between climate service provider and users. These result in different types of climate service products including websites, capacity building, and co-design of tailored climate indices (Cross-Chapter Box 12.2, Figure 1; Hewitt et al., 2017a). The fundamental basis for climate service development is the co-production process between climate service provider and user (Valiela, 2006; Briley et al., 2015; Golding et al., 2017a; K. Vincent et al., 2018a; Bruno Soares and Buontempo, 2019; Schipper et al., 2019), which can be very resource intensive (Buontempo et al., 2018; Falloon et al., 2018; Kolstad et al., 2019) and varies strongly from case to case (Reinecke, 2015; Bremer et al., 2019; Goodess et al., 2019; Jung and Schindler, 2019). Climate services scholars and practitioners can better facilitate and embrace the knowledge co-production process if it is recognized as a multi-faceted phenomenon with several dimensions (e.g., constitutive, interactional, institutional, pedagogical, empowerment) (Kruk et al., 2017; Knaggård et al., 2019; Weichselgartner and Arheimer, 2019).
Information moves from ‘useful’ to ‘usable’ only when users effectively incorporate this information into a decision process (Lemos et al., 2012; Bruno Soares and Dessai, 2016; Prokopy et al., 2017; see also WGII, Chapter 17). Climate services include a range of knowledge brokerage activities such as: identifying knowledge needs; dissemination of knowledge; coordinating and networking; compiling and translating; building capacity through informed decision-making; analysing, evaluating and developing policy; and personal consultation (e.g., De Bruin et al., 2020). When analysing four European climate services, Reinecke (2015) found that different climate services emphasized different knowledge brokerage activities.
There are various types of climate service providers and products related to key sectors and regions, such as those described in Sections 12.3 and 12.4 (Hewitt et al., 2017b). For instance, studies have described sectoral climate services in support of agriculture (Falloon et al., 2018; Hansen et al., 2019), health (Jancloes et al., 2014; Lowe et al., 2017), tourism (Morin et al., 2018; Damm et al., 2020; Matthews et al., 2021), energy (Troccoli, 2018b; Goodess et al., 2019; Soret et al., 2019), disaster risk reduction (Golding et al., 2019; Street et al., 2019), water (van den Hurk et al., 2016; Vano et al., 2018), ocean and coastal ecosystems (Weisse et al., 2015; Le Cozannet et al., 2017), cities (Rosenzweig and Solecki, 2014; Rosenzweig et al., 2015; Gidhagen et al., 2020), and cultural heritage (ICOMOS, 2019). Many countries (including almost every country in Europe – see Atlas.8.2) have established a climate service centre, which follow different practices of user engagement and provide different products (e.g., Kjellström et al., 2016; Skelton et al., 2017; Kolstad et al., 2019). Climate services in other countries may be distributed across agencies and programmes, although these are often not centrally coordinated (Parris et al., 2016). One of the key pillars of the GFCS is the Climate Services Information System (CSIS), which is the principal mechanism through which information about past, present and future climate is archived, analysed, modelled, exchanged and processed for users (Hewitt et al., 2020a). Some national governments also have organized national climate projections to be used for official planning (e.g., EEA, 2018). A list of available national products (e.g., observational datasets) and projections can be found in the Atlas (e.g., Atlas.1.4).
Figure 12.12 maps a general categorization of practices and products that have emerged from reviewing climate service literature and user interviews (Visscher et al., 2020). The categories range from very generic products or expert analysis focused particularly on climate information (climate-centric approaches) to more integrated products that include shared open-source products and capacity building as well as tailored products that treat climate information as part of a larger decision-making context (climate-inclusive approaches). Three specific examples that elaborate in more detail on specific practices and products related to those general categories are provided in Cross-Chapter Box 12.2.
 Figure 12.12 | Illustration of different types of climate services. Products, for instance, can focus only on climate-related information or can be designed to integrate climate information with other decision-relevant context (vertical axis) and they can be very generic in terms of relevance to a wide range of sectors or stakeholders or customized to fit the needs of a specific sector or stakeholder (horizontal axis). Figure adapted from Visscher et al. (2020).
 12.6.3 Challenges
Climate services set new scientific challenges to physical climate research (high confidence). Over at least the last decade, for instance, many questions have appeared in terms of optimal estimation of changes and uncertainties from projections of model ensembles, ensemble optimization, or adjustment of model biases while preserving essential information on trends and cross-variable, time and space consistencies, downscaling information at the local scale (Benestad et al., 2017; Hewitt et al., 2017b; Marotzke et al., 2017; Hewitt and Lowe, 2018; Knutti, 2019; see also Section 10.5). Other challenges related to climate services are the inter-operability of data (Giuliani et al., 2017), access to data (open/FAIR Guiding principles; Wilkinson et al., 2016; Georgeson et al., 2017), format of data (including moving away from percentile-based probabilistic forecasts (e.g., Haines, 2019)) and funding mechanisms (Bruno Soares and Buontempo, 2019).
Understanding and modelling of weather and climate extremes is of great relevance for climate services and is continuing to set challenges for research, such as modelling changes in impact-relevant threshold exceedance and return periods for a variety of extremes (Maraun et al., 2015; Sillmann et al., 2017; Hewitt et al., 2021; Schwingshackl et al., 2021; see also Chapter 11). Extreme event attribution has also been used in context of climate services (Philip et al., 2020) as it is of interest to some stakeholder groups (Sippel et al., 2015; Marjanac and Patton, 2018; Jézéquel et al., 2019, 2020). The usefulness or applicability of available extreme event attribution methods (Section 11.2.4 and Cross-Working Group Box on Attribution in Chapter 1) for assessing climate-related risks remains subject to debate (Shepherd, 2016; Mann et al., 2017; Lloyd and Oreskes, 2018).
The design of climate services involves addressing certain key challenges, such as a domain challenge where users, tasks and data may be unknown; or an informational challenge related to the use and adoption of novel and complex scientific data (Christel et al., 2018). This includes challenges in the uptake of climate information in terms of coordinated delivery of data, information, expertise and training by public research institutes, the inclusion of climate change adaptation in public and private regulation, and uncertainties and confidence in climate projections (Cavelier et al., 2017). Quality control and quality assurance are still weak elements in the development of climate service products (Jacob, 2020). Quality criteria or standards (that go beyond good practice) will have to be developed and agreed (Baldissera Pacchetti et al., 2021). These challenges reflect the dilemma that exists at the interface between the climate modelling community and climate services regarding: (i) the purposes of the models for climate research versus service development; (ii) the gap between the spatial and temporal scales of the models versus the scales needed in applications; and (iii) tailoring climate model results to real-world applications (Benestad et al., 2017; Hackenbruch et al., 2017; van den Hurk et al., 2018).
Climate services require a sustained engagement between scientists, service providers and users that is often hindered by limited resources for the co-design and co-production process(high confidence). There are recurring challenges related to successful climate service applications: (i) climate services are not visible and are poorly understood by ‘end users’ (Weichselgartner and Arheimer, 2019); (ii) data can be of unknown or poor quality, data formats can be hard to access or process, and it can be difficult to utilize data disseminated from large databases (e.g., Section 1.5.4) without appropriate user guidance; (iii) users are unsure how to choose from available climate services to meet their needs (Rössler et al., 2019); (iv) building trust between climate service users and providers (Baztan et al., 2020); (v) the lack of understanding of users and their contexts by the climate science and service community (Porter and Dessai, 2017); (vi) the difficulty in scaling up services (Tall et al., 2014; van Huysen et al., 2018); (vii) the lack of trained scientists skilled at conducting societally relevant research (Rozance et al., 2020).
Challenges also arise in determining the effectiveness and added value of climate services, particularly in terms of providing quantitative estimates of economic benefits and making a business case for climate services (Bruno Soares, 2017). The market for climate services is still in its infancy (Cavelier et al., 2017; Bruno Soares et al., 2018b; Tall et al., 2018; Damm et al., 2020). One form of value may be determined by a particular user community’s willingness to pay (Acquah and Onumah, 2011; Ouédraogo et al., 2018; Antwi-Agyei et al., 2021), which however cannot reflect the value of climate services as a public good and for society as a whole (Hewitt et al., 2012). Literature is only recently emerging on the socio-economic benefits of weather and climate services (Vaughan et al., 2019). Early studies and guidelines from the WMO focus on cost–benefit ratios (Perrels et al., 2013; WMO, 2015). Issues related to demand-driven versus supply-driven climate services (Lourenço et al., 2016; Street, 2016; Daniels et al., 2020), public versus private climate services (Hewitt et al., 2020a) and business models for climate services (Hoa, 2018) have been raised. A large share of climate services documented in peer-reviewed literature is currently provided in non-market frameworks (e.g., public service obligations and research and development grants) (Hoa, 2018; Kolstad et al., 2019; Cortekar et al., 2020).
Other challenges related to governance and dealing with complex systems are sometimes acknowledged but less well described in the climate services domain (Hewitt et al., 2020a). Importantly, decision contexts are strongly rooted in past practice (which often does not even make optimal use of past climate information), stakeholder experience, and history. Even important emerging concepts of co-production, entry points, and champions do not always fall naturally into these realities without significant effort. The social sciences have an important role in helping understand and tackle these challenges (Bruno Soares and Buontempo, 2019).
Cross-Chapter Box 12.2 | Climate Services and Climate Change Information
Contributing Authors: Suraje Dessai (United Kingdom/Portugal), Jana Sillmann (Norway/Germany), Carlo Buontempo (United Kingdom/Italy), Cecilia Conde (Mexico), Aida Diongue-Niang (Senegal), Francisco J. Doblas-Reyes (Spain), Christopher Jack (South Africa), Richard Jones (United Kingdom), Benjamin Lamptey (Niger/Ghana), Xianfu Lu (United Kingdom/China), Douglas Maraun (Austria/Germany), Ben Orlove (United States of America), Roshanka Ranasinghe (Netherlands/Sri Lanka/Australia), Alex C. Ruane (United States of America), Anna Steynor (South Africa), Bart van den Hurk (Netherlands), Robert Vautard (France)
Climate services involve the provision of climate information in such a way as to assist decision-making. The service needs to have appropriate engagement from users and providers; be based on scientifically credible information and expertise; have an effective access mechanism; and meet the users’ needs (Hewitt et al., 2012). Predominantly, climate services are targeted at informing and enabling risk management in adaptation to climate variability and change (Jones et al., 2014; Vaughan et al., 2018). Chapter 1 introduces climate services in a broader context of interaction between science and society, including how climate information can be tailored and co-produced for greatest utility in specific contexts. Chapter 10 assesses the key foundations for the generation of climate information about regional climate change. Chapters 11, 12 and Atlas comprehensively assess regional climate change information. The Interactive Atlas gives access to various repositories of quantitative climate information. In WGII, Chapter 17 assesses climate services in the context of climate risk management.
Cross-Chapter Box 12.2
Climate service contexts are diverse and complex. They can be characterized using different factors such as sectors, regions, purposes, time horizons, data sources, level of processing of climate data, background knowledge, type of climate service providers, as well as the nature of the interactions between providers, users and other stakeholders (Bessembinder et al., 2019). To illustrate the wide diversity of climate change information in climate services, a useful categorization is by user –provider engagement of climate services (Cross-Chapter Box 12.2, Figure 1). One broad category includes ‘websites and web tools’ which generally focuses on data and information provision (Hewitson et al., 2017). Websites are generally able to reach many users, but engagement is passive through one-way transfer of information. The second broad category involves ‘interactive group activities’, such as workshops, meetings and interactive forums, which create a stronger dialogue between climate service providers and decision makers. Multi-way communication and regular interaction enable building of trust, co-learning and co-production of products and services. The third broad category involves ‘focused relationships’ which are tailored, targeted and address very specific needs of the user. Effective engagement arises from an iterative process between the provider and user to ensure the user’s needs are being addressed appropriately (Hewitt et al., 2017a).
The diversity of climate services practices and products is illustrated here using three case studies each representing one of the broad categories of user –provider engagement (Cross-Chapter Box 12.2, Figure 1).
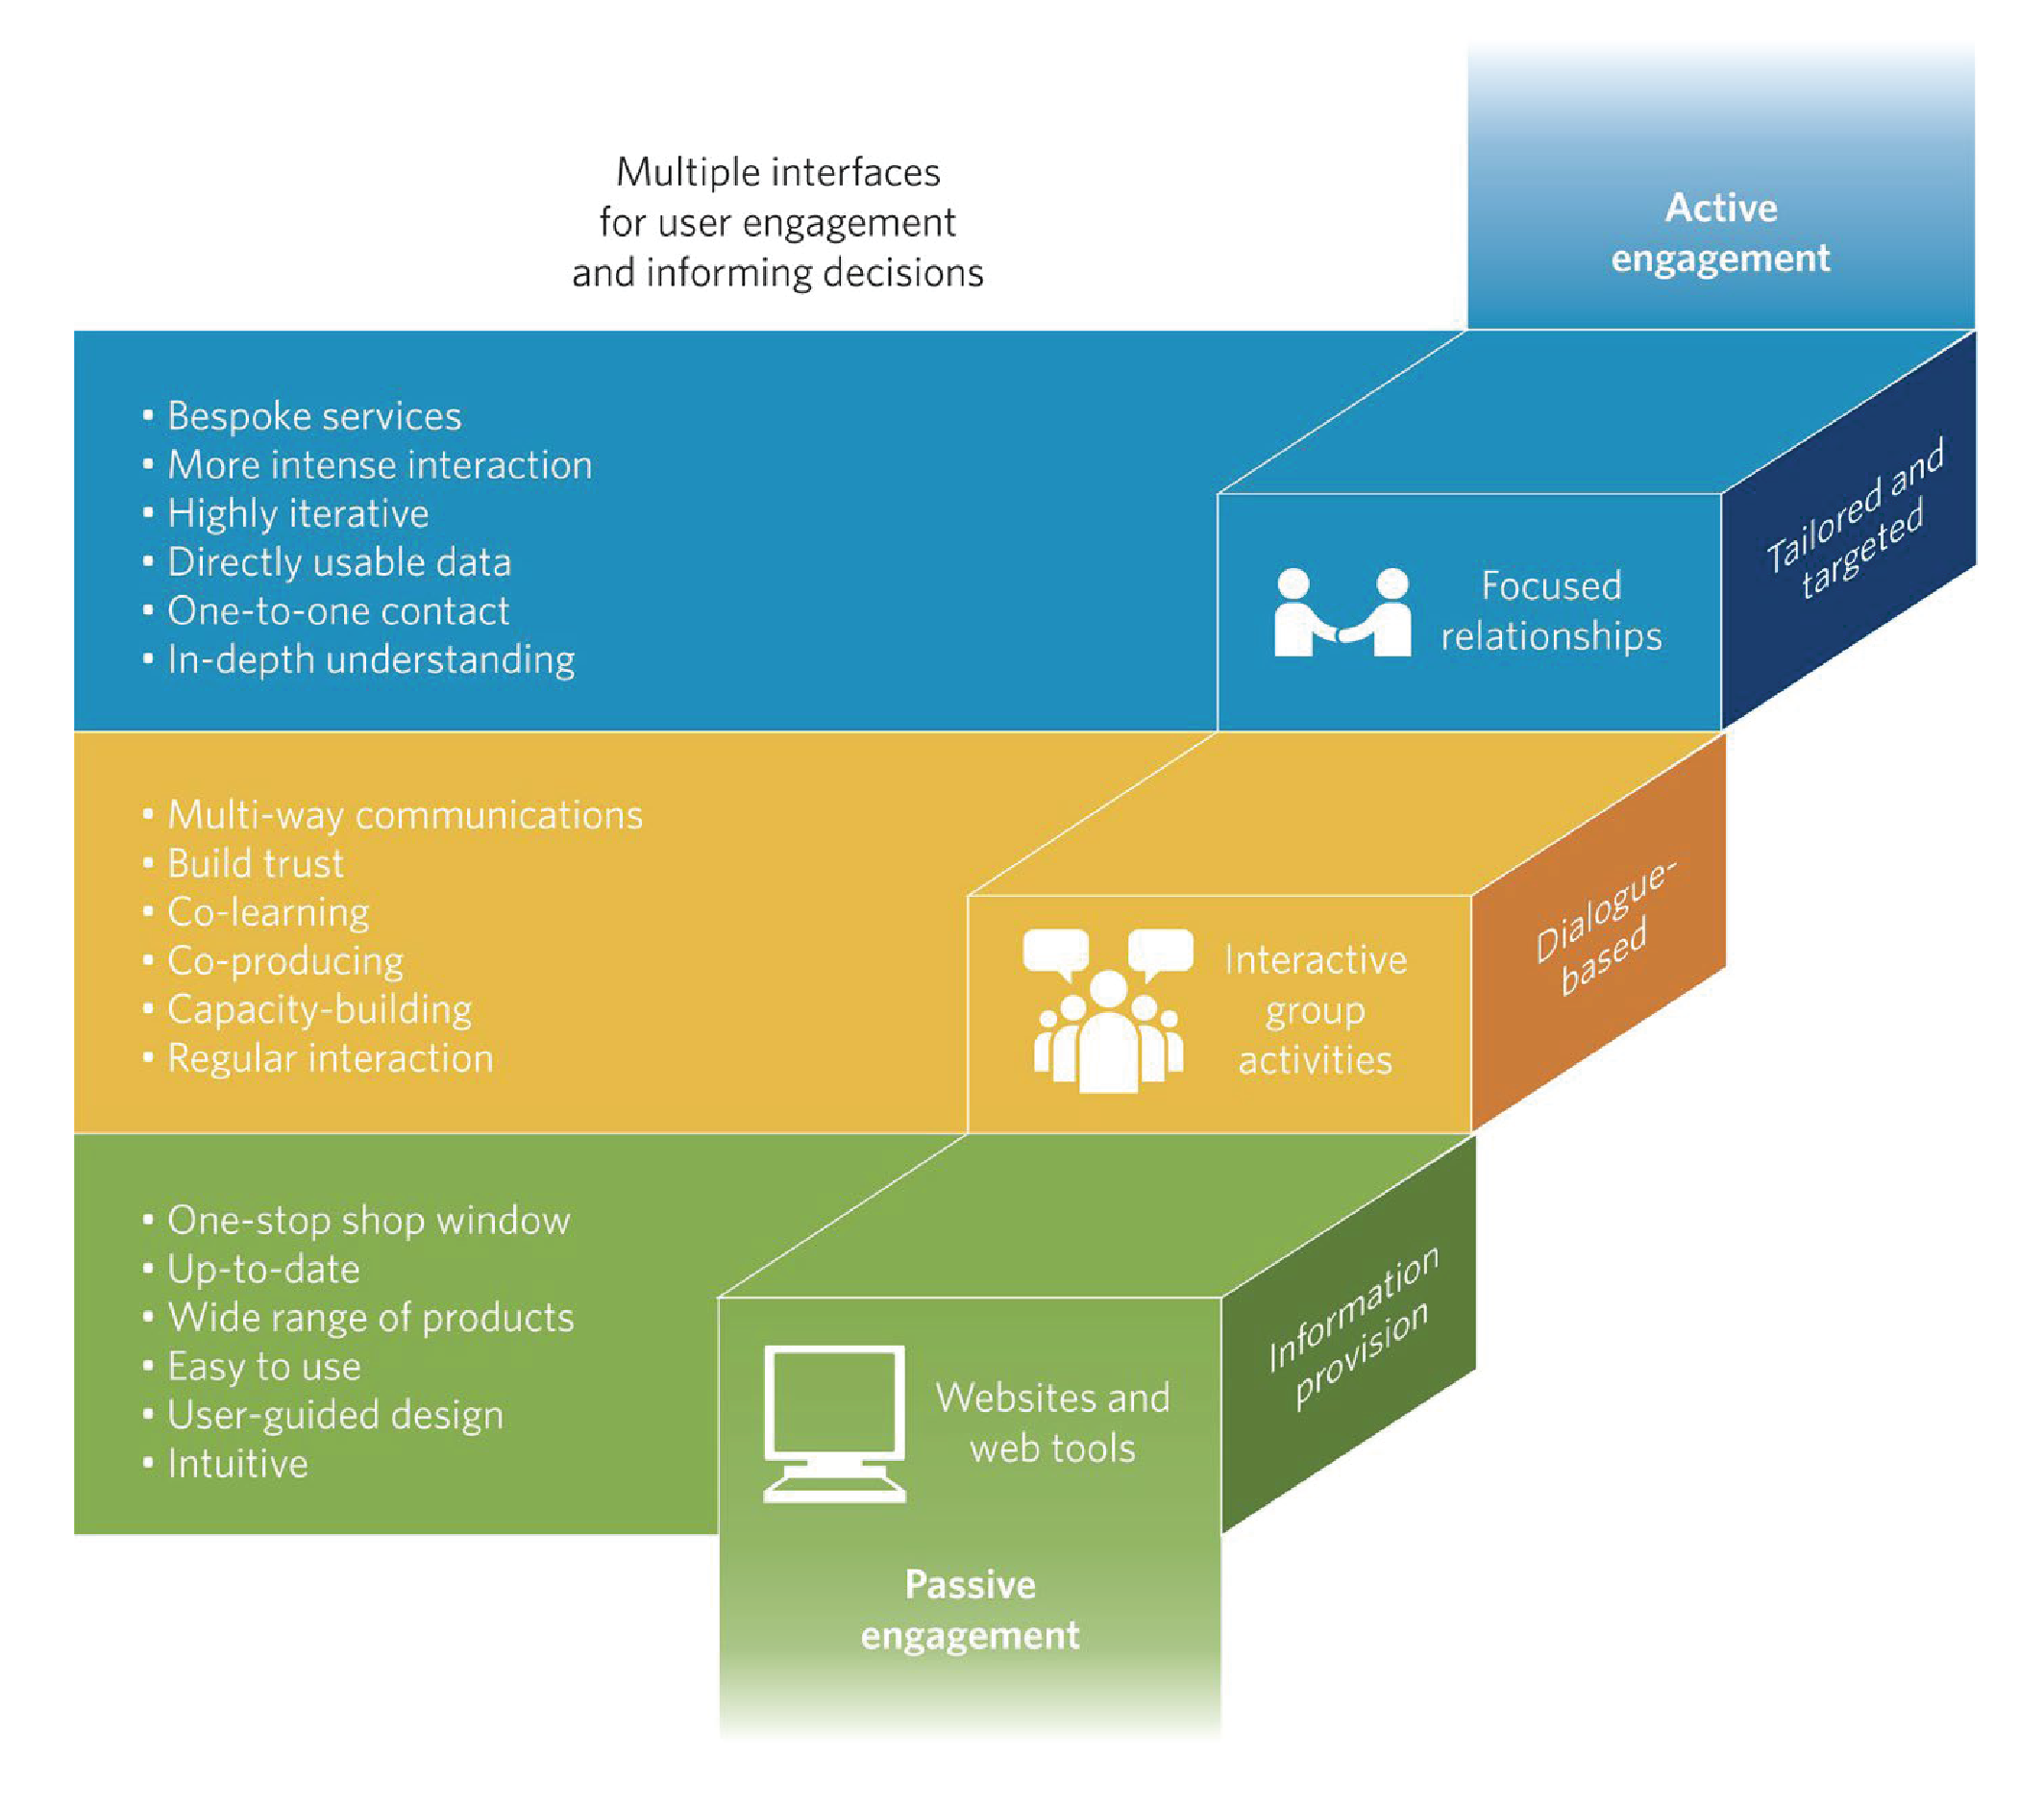
Cross-Chapter Box 12.2, Figure 1 | Schematic of three broad categories of engagement between users and providers of climate services. Figure adapted from Hewitt et al. (2017a) .
Case study 1: Websites and web tools
The Copernicus Climate Change Service (C3S) provides free and open access to climate data, tools and information through a website. It also includes demonstration projects that show how C3S data can be used in practice through case studies, training sessions and workshops (Thepaut et al., 2018). A large audience of the service is composed of intermediate users, loosely defined as the community of operators in one of the intermediate steps between the primary producers of climate data and the ultimate beneficiaries.
To address this audience, the strategy of C3S is to provide free and open access climate data and tools such as historical observations (both satellite and ground-based), climate data records relevant for a number of Essential Climate Variables (Bojinski et al., 2014), global and regional reanalyses, climate monitoring bulletins, seasonal predictions, as well as both global (a selection of simulations from the Coupled Model Intercomparison Project, CMIP; Taylor et al., 2012; Eyring et al., 2016) and regional climate projections from the Coordinated Regional Downscaling Experiment (Euro- and Med-CORDEX; Jacob et al., 2014; Ruti et al., 2016). A number of indices for various sectors can be calculated through cloud-based tools. For instance, in order to address the specific needs of key sectoral users, climate impact indicators for common variables such as ‘heating degree days’ can be calculated by the users and made available to others (Buontempo et al., 2020). All this material is quality controlled following a standardized, transparent and traceable framework.
C3S also facilitates the tailoring process, by providing a series of working open-source, cloud-based demonstrators which show how climate data can be transformed into actionable information to meet specific user requirements. This tailoring process covers the chain between the definition of key indicators all the way to the user interface. The definition and production of C3S products involve scientists that produced and assessed the data. A variety of potential users are involved in the definition of indicators and other products.
Through its quality assurance process and demonstrators, C3S provides a basic evaluation of all climate data; it provides access, and it encourages the users to develop their own case-specific analysis within the C3S infrastructure. Trustworthiness and relevance of such an analysis are substantially strengthened through a distillation process, co-designed by the user and data provider, and drawing upon multiple lines of evidence and process-based evaluation of model fitness (Section 10.5).
Case study 2: Interactive group activities
Science-application engagement is extremely challenging, especially in critically important but complex contexts such as rapidly growing cities in developing nations (Culwick and Patel, 2017). The publicly funded Future Resilience for African CiTies And Lands (FRACTAL) project was conceived and designed in response to extensive and strong evidence and experience that useful and useable climate services require strong mutual relationships across the science-application interface that can be built using supportive processes and structures (A. Taylor et al., 2017).
Informed by this understanding, FRACTAL was grounded in a very reflexive and context-guided approach with city decision-making at its core (A. Taylor et al., 2017). Representatives from selected southern African cities were included in the proposal design and, throughout the project, a core principle was to allow the city partners to lead and guide the process.
Two important elements were deployed in FRACTAL: ‘embedded researchers’ and ‘learning labs’. Embedded researchers were seconded into the municipality and served as the essential connection for the learning process within each city (Steynor et al., 2020). Learning labs (Arrighi et al., 2016) were interactive structures in which participants from academia, local city government and councils, state-owned enterprises, communities and community development institutions, and others could interact. Embedded researchers and learning labs were the backbone of ongoing learning processes within each city and resulted in more focused small-group dialogues, capacity development and training processes, and within-city research and engagement activities. Each learning lab focused initially on identifying ‘burning issues’ without a requirement that they involve strong climate linkages. However, with the overarching focus on resilience, discussions evolved in that direction and the burning issues identified often centred around water in peri-urban areas, for example in Windhoek, Namibia (Scott et al., 2018).
The learning labs also introduced and developed the concept of Climate Risk Narratives (CRNs) as a process and product to generate and integrate climate and socio-economic information relevant to adaptation and resilience (see Cross-Chapter Box 12.2, Figure 2, and Box 10.2 on storylines) (Jack et al., 2020). The first CRNs were informed primarily by climate evidence, but also included some tentative socio-economic impact elements gleaned from literature and other studies. Their content was intentionally provocative and designed to promote debate and discussion, and subsequent iteration. Many participants noted that this was the first time that various important conversations across governance structures and disciplinary areas had occurred around what climate change may actually mean. This demonstrates the engagement value of CRNs as a key element in an iterative co-production process to ensure important details are included correctly, such as the local context, terms and names as well as providing reality checks on the impacts and societal responses (Jack et al., 2020).
Cross-Chapter Box 12.2
This case study emphasizes the positive contributions of the fit, tailoring and contextualization of climate information with respect to the specific decision-making needs of particular users (Section 10.5; AR6 WGII Section 17.4.4.2.2), the importance of participatory planning for risk management in urban areas (AR6 WGII Sections 6.3.3.3 and 6.4.2) and the importance of networks and organizations which link researchers, policymakers and end-users to promote adaptation in African cities (AR6 WGII Box 9.4). Upscaling this type of interactive activity to cater for the large number of user demands remains a challenge.
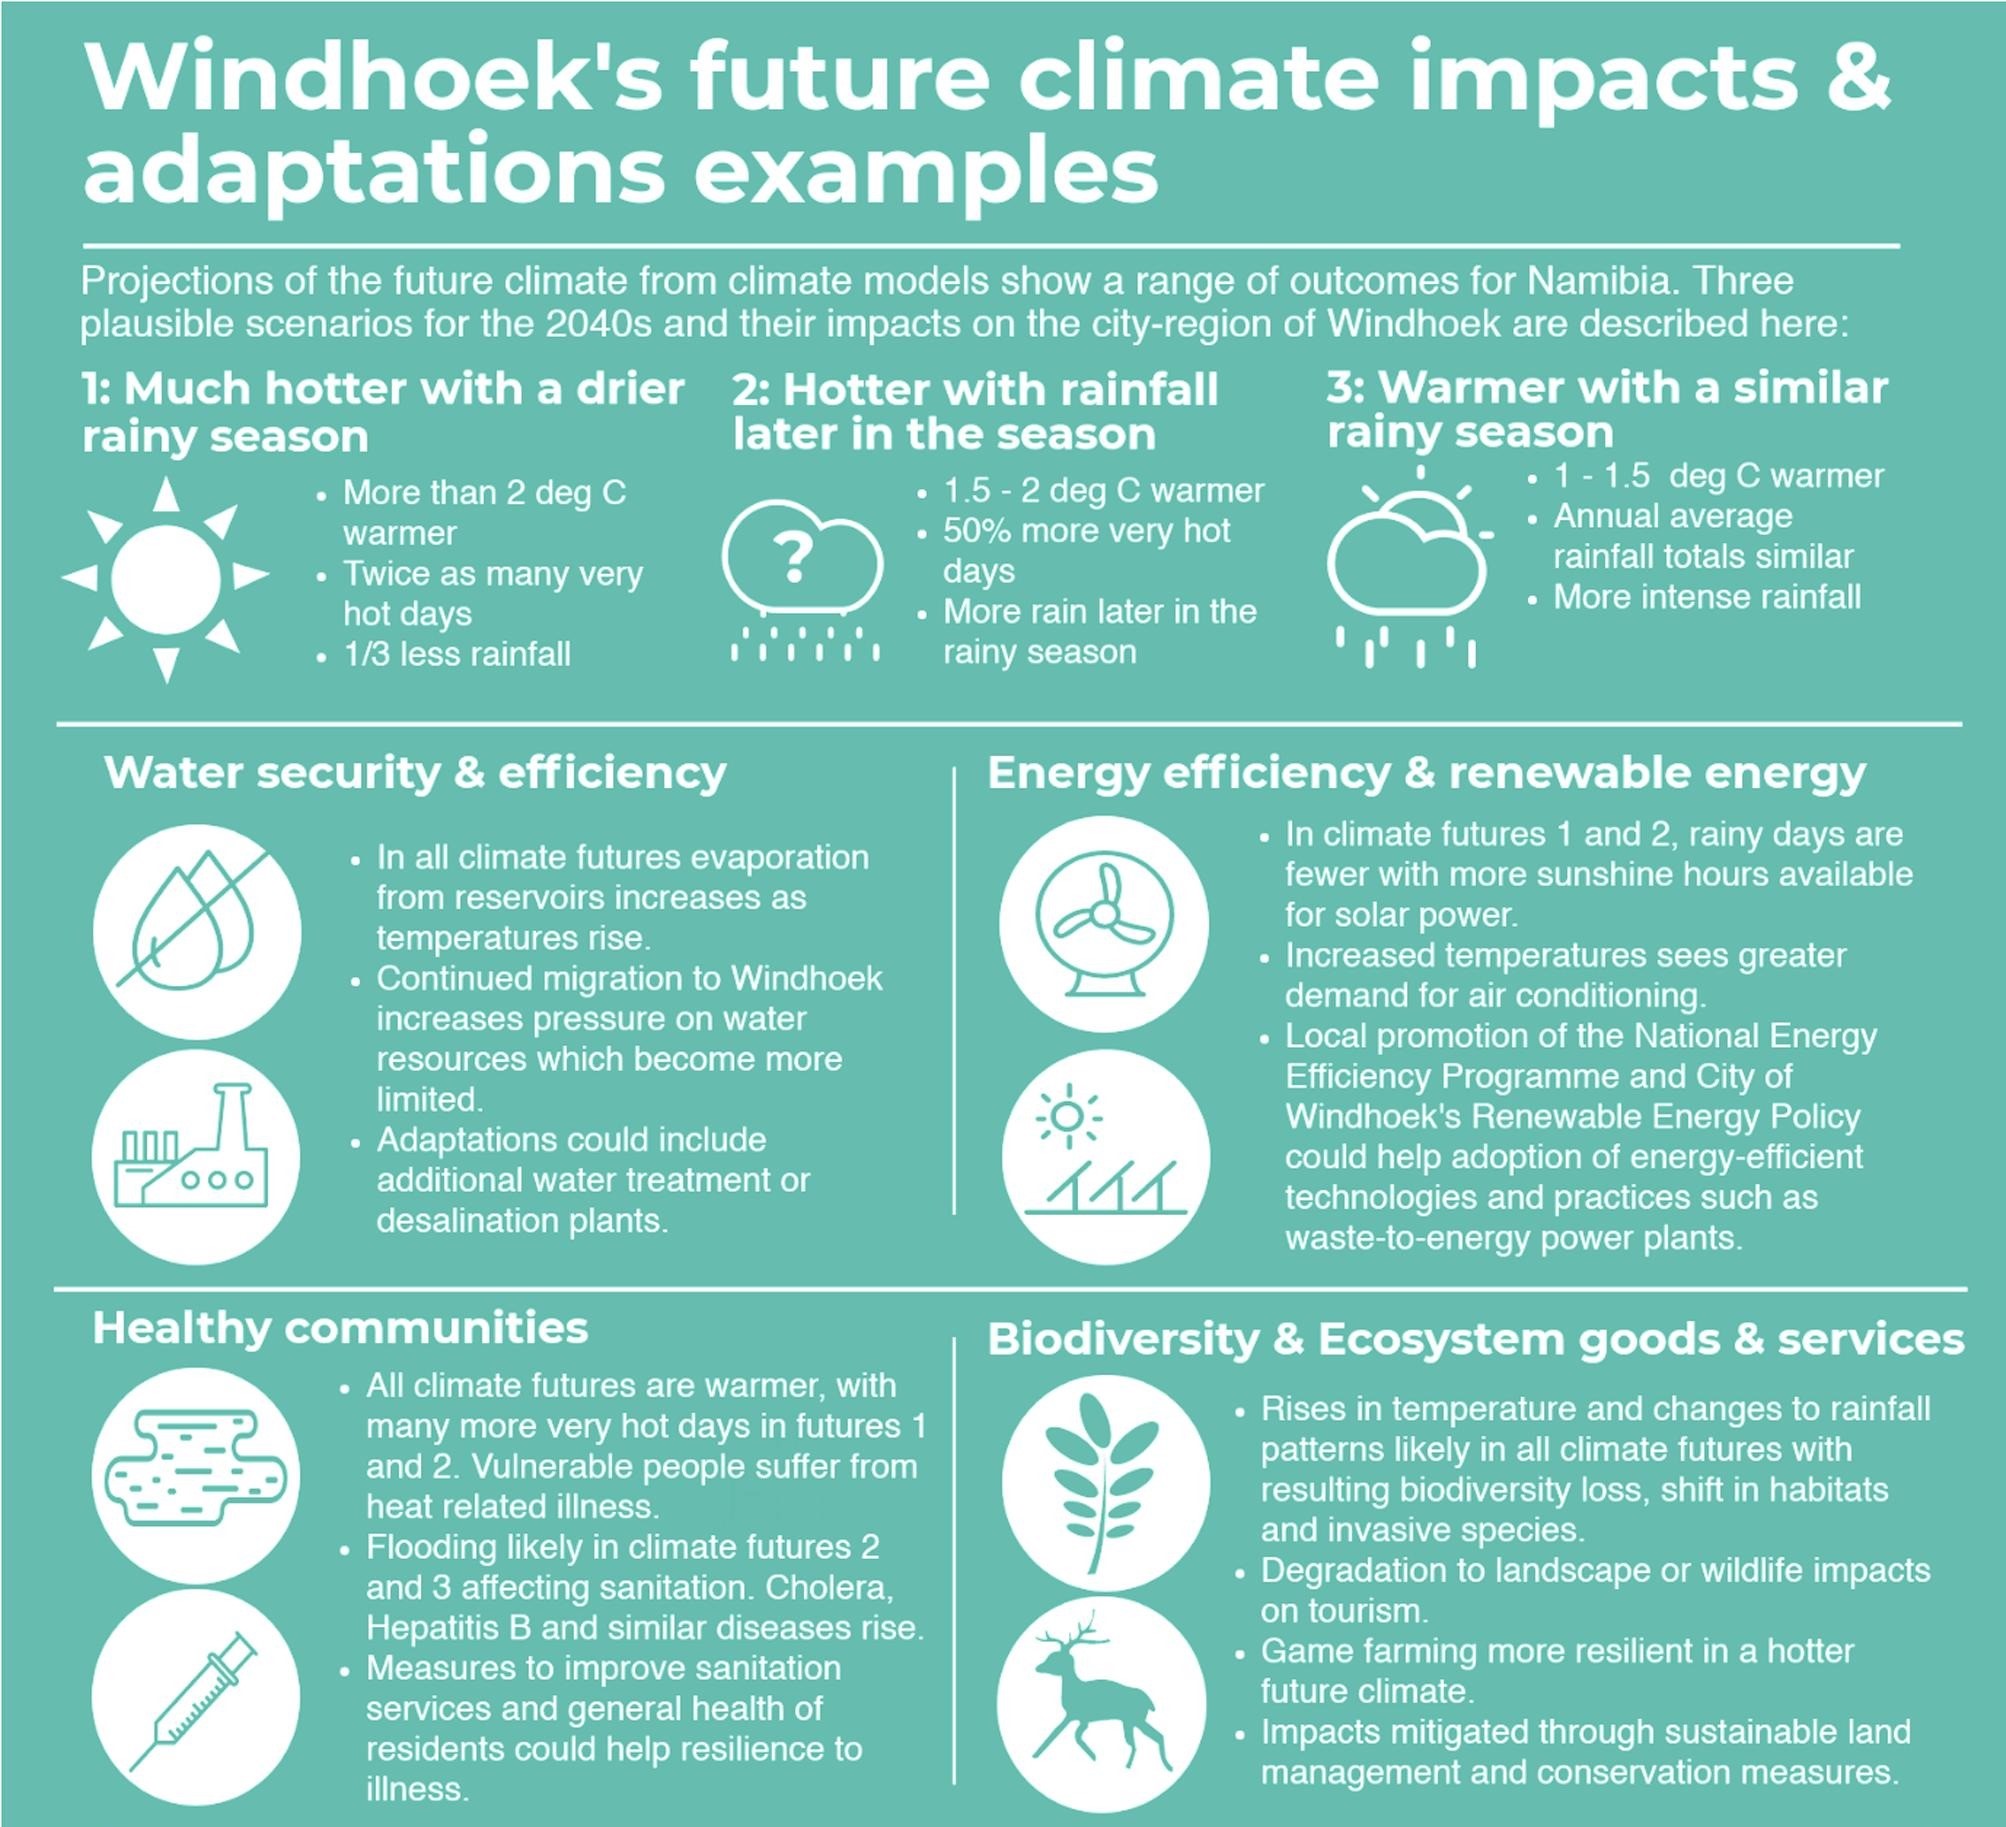
Cross-Chapter Box 12.2, Figure 2 | Climate Risk Narrative infographic developed through the FRACTAL Windhoek Learning Lab process. Figure adapted from Jack et al. (2020).
Case study 3: Focused relationships
This broad category involves one-to-one engagement between a provider and a user with very specific needs. One such user is the Asian Development Bank (ADB), which has committed to making all its investments climate resilient by implementing a climate risk management framework (ADB, 2014, 2018; Lu, 2019). The climate risk management framework mandates all climate-sensitive investment projects undertake a climate risk and adaptation assessment, to identify material risks of a changing climate to the proposed project and potential adaptive measures to be incorporated into project design, implementation, maintenance and/or monitoring. Typically, loan project processing teams procure consulting services for a bespoke climate risk and adaptation assessment (CRA) for a specific project. The user –provider engagement is highly targeted and goal-oriented. An example of such a focused user –provider engagement is the CRA carried out as part of an investment project in Vietnam, the Water Efficiency Improvement in Drought-Affected Provinces (WEIDAP) project.
In the wake of the El Niño-induced 2015–2016 severe drought, which caused major damage to agricultural land in the Central Highlands of Vietnam, the WEIDAP project was initiated to improve water productivity of irrigated agriculture. Proposed project interventions include a package of both ‘soft’ (e.g., policy, institutional and capacity building, on-farm water efficiency practices) and ‘hard’ (modernized irrigation schemes) activities. To ensure that the project delivers expected benefits under a changing climate, consultants were recruited to carry out a detailed CRA, working as part of the overall project processing team. Through extensive consultations with the rest of the project team and review of literature including relevant climate projections, the CRA consultants chose to construct three broad climate scenarios for the 2050s (a time frame appropriate for the lifetime of the irrigation schemes being proposed under the project): a warm-and-wet, a hot-and-wet, and a hotter future. Outputs from a selection of CMIP5 models were analysed under these three scenarios, to derive changes in temperature, rainfall and potential evapotranspiration, which in turn were used as inputs to hydrological, crop and agro-economics models to assess the impacts of climate change on the overall project performance. Table 1 presents the summary of the key parameters under the three scenarios. Recommendations from the CRA included (largely minor) refinements and additional activities for drought planning, detailed engineering design of the relevant project components (such as access roads, river crossings and foundations), and support for poorer farmers who may not be able to afford access to water and climate-resilient technologies.
This case study illustrates that climate information distillation including a sustained iterative engagement between climate information users, producers and translators can improve the quality of the information and the decision-making (Section 10.5; WGII Section 17.4.4.2.2).
Cross-Chapter Box 12.2, Table 1 | Summary of annual province-level changes in temperature, precipitation and evapotranspiration under the three broad scenarios in southern Vietnam. Scenario 1: warm-and-wet; Scenario 2: hot-and-wet; Scenario 3: hotter. Source: Table 3 in ADB (2020).
Item | Province and Scenario Number | ||||||||||||||
Bình Thuân | Ðă´k Lă´k | Ðă´k Nông | Khánh Hòa | Ninh Thuân | |||||||||||
1 | 2 | 3 | 1 | 2 | 3 | 1 | 2 | 3 | 1 | 2 | 3 | 1 | 2 | 3 | |
ΔT (°C) | 1.1 | 1.8 | 2.6 | 1.1 | 1.5 | 2.0 | 1.2 | 2.1 | 2.7 | 1.1 | 1.8 | 2.6 | 1.1 | 1.5 | 2.6 |
ΔP (%) | 28 | –12 | 4 | 8 | 17 | –8 | 8 | –8 | 7 | 3 | –10 | 7 | 27 | 1 | 5 |
ΔPET (%) | 3 | 6 | 8 | 4 | 5 | 7 | 4 | 7 | 9 | 3 | 6 | 8 | 3 | 5 | 8 |
ΔT = change in temperature; ΔP = change in precipitation; ΔPET = change in potential evapotranspiration.
Note: Colour scale indicates significance of changes for the water balance.
12.7 Final Remarks
The assessment in this chapter is based on a rapidly growing body of new evidence from the peer-reviewed literature, direct calculations of climate projections from several new model ensembles, and results from other AR6 WGI chapters. Although a large amount a new information on CID changes and their uptake in climate services has become available since AR5, some challenges still remain. This section summarizes some of these main challenges, with a view to facilitating improved assessments in future. The section is organized following the order of chapter sections and consolidated according to key assessment components.
- The adoption of the climatic impact-driver (CID) framework could benefit from stronger connections across disciplines, including between physical climate and impact scientists, and between the science community and practitioners/stakeholders on the ground. Co-development of CID index definitions with impact scientists or stakeholders helps ensure their salience and utility (Sections 12.1, 12.2, 12.3 and 12.6).
- The ability to project all aspects of shifting CID profiles and their effects at fine, local scales is often reliant on dynamical downscaling and additional impact modelling steps, making a robust and full quantification of the uncertainties involved more challenging. Availability of multiple models and ease of connecting physical climate models at different scales can facilitate assessment (Sections 12.2, 12.3, 12.4 and 12.5).
- Regional and sub-regional differences in coverage and access of homogeneous historical records, in the deployment of regional model ensembles and the exploration of scenarios, and ultimately in peer-reviewed studies addressing the full range of past and current behaviour, detection and attribution, and future projections challenge a uniformly robust assessment across all CIDs and regions of the world (Sections 12.4 and 12.5).
- Efforts to assess a consistent global, large-scale view of CID changes across regions and sectors would benefit from additional coordinated studies adopting common CID indices, model protocols, time horizons and scenarios or global warming levels (Sections 12.3 and 12.5).
- Even though the body of peer-reviewed literature regarding climate services practices and products is growing, a large part is still documented only in grey literature arising from commercial consultancy, and thus is not publicly and freely accessible (Section 12.6).
Frequently Asked Questions
FAQ 12.1 | What Is a Climatic Impact-driver (CID)?
A climatic impact-driver is a physical climate condition that directly affects society or ecosystems. Climatic impact-drivers may represent a long-term average condition (such as the average winter temperatures that affect indoor heating requirements), a common event (such as a frost that kills off warm-season plants), or an extreme event (such as a coastal flood that destroys homes). A single climatic impact-driver may lead to detrimental effects for one part of society while benefiting another, while others are not affected at all. A climatic impact-driver (or its change caused by climate change) is therefore not universally hazardous or beneficial, but we refer to it as a ‘hazard’ when experts determine it is detrimental to a specific system.
Climate change can alter many aspects of the climate system, but efforts to identify impacts and risks usually focus on a smaller set of changes known to affect, or potentially affect, things that society cares about. Theseclimatic impact-drivers(CIDs) are formally defined in this Report as ‘physical climate system conditions (e.g., means, events, extremes) that affect an element of society or ecosystems. Depending on system tolerance, CIDs and their changes can be detrimental, beneficial, neutral, or a mixture of each across interacting system elements and regions’. Because people, infrastructure and ecosystems interact directly with their immediate environment, climate experts assess CIDs locally and regionally. CIDs may relate to temperature, the water cycle, wind and storms, snow and ice, oceanic and coastal processes or the chemistry and energy balance of the climate system. Future impacts and risk may also be directly affected by factors unrelated to the climate (such as socio-economic development, population growth, or a viral outbreak) that may also alter the vulnerability or exposure of systems.
CIDs capture important characteristics of the average climate and both common and extreme events that shape society and nature (see FAQ 12.2). Some CIDs focus on aspects of the average climate (such as the seasonal progression of temperature and precipitation, average winds or the chemistry of the ocean) that determine, for example, species distribution, farming systems, the location of tourist resorts, the availability of water resources and the expected heating and cooling needs for buildings in an average year. CIDs also include common episodic events that are particularly important to systems, such as thaw events that can trigger the development of plants in spring, cold spells that are important for fruit crop chill requirements, or frost events that eliminate summer vegetation as winter sets in. Finally, CIDs include many extreme events connected to impacts such as hailstorms that damage vehicles, coastal floods that destroy shoreline property, tornadoes that damage infrastructure, droughts that increase competition for water resources, and heatwaves that can strain the health of outdoor labourers.
Many aspects of our daily lives, businesses and natural systems depend on weather and climate, and there is great interest in anticipating the impacts of climate change on the things we care about. To meet these needs, scientists engage with companies and authorities to provide climate services – meaningful and possibly actionable climate information designed to assist decision-making. Climate science and services can focus on CIDs that substantially disrupt systems to support broader risk management approaches. A single CID change can have dramatically different implications for different sectors or even elements of the same sector, so engagement between climate scientists and stakeholders is important to contextualize the climate changes that will come. Climate services responding to planning and optimization of an activity can focus on more gradual changes in operating climate conditions.
FAQ 12.1, Figure 1 tracks example outcomes of seasonal snow cover changes that connect climate science to the need for mitigation, adaptation and regional risk management. The length of the season with snow on the ground is just one of many regional climate conditions that may change in the future, and it becomes a CID because there are many elements of society and ecosystems that rely on an expected seasonality of snow cover. Climate scientists and climate service providers examining human-driven climate change may identify different regions where the length of the season with snow cover could increase, decrease, or stay relatively unaffected. In each region, change in seasonal snow cover may affect different systems in beneficial or detrimental ways (in the latter case, changing seasonal snow cover would be a ‘hazard’), although systems such as coastal aquaculture remain relatively unaffected. The changing profile of benefits and hazards connected to these changes in the seasonal snow cover CID affects the profile of impacts, risks and benefits that stakeholders in the region will grapple with in response to climate change.
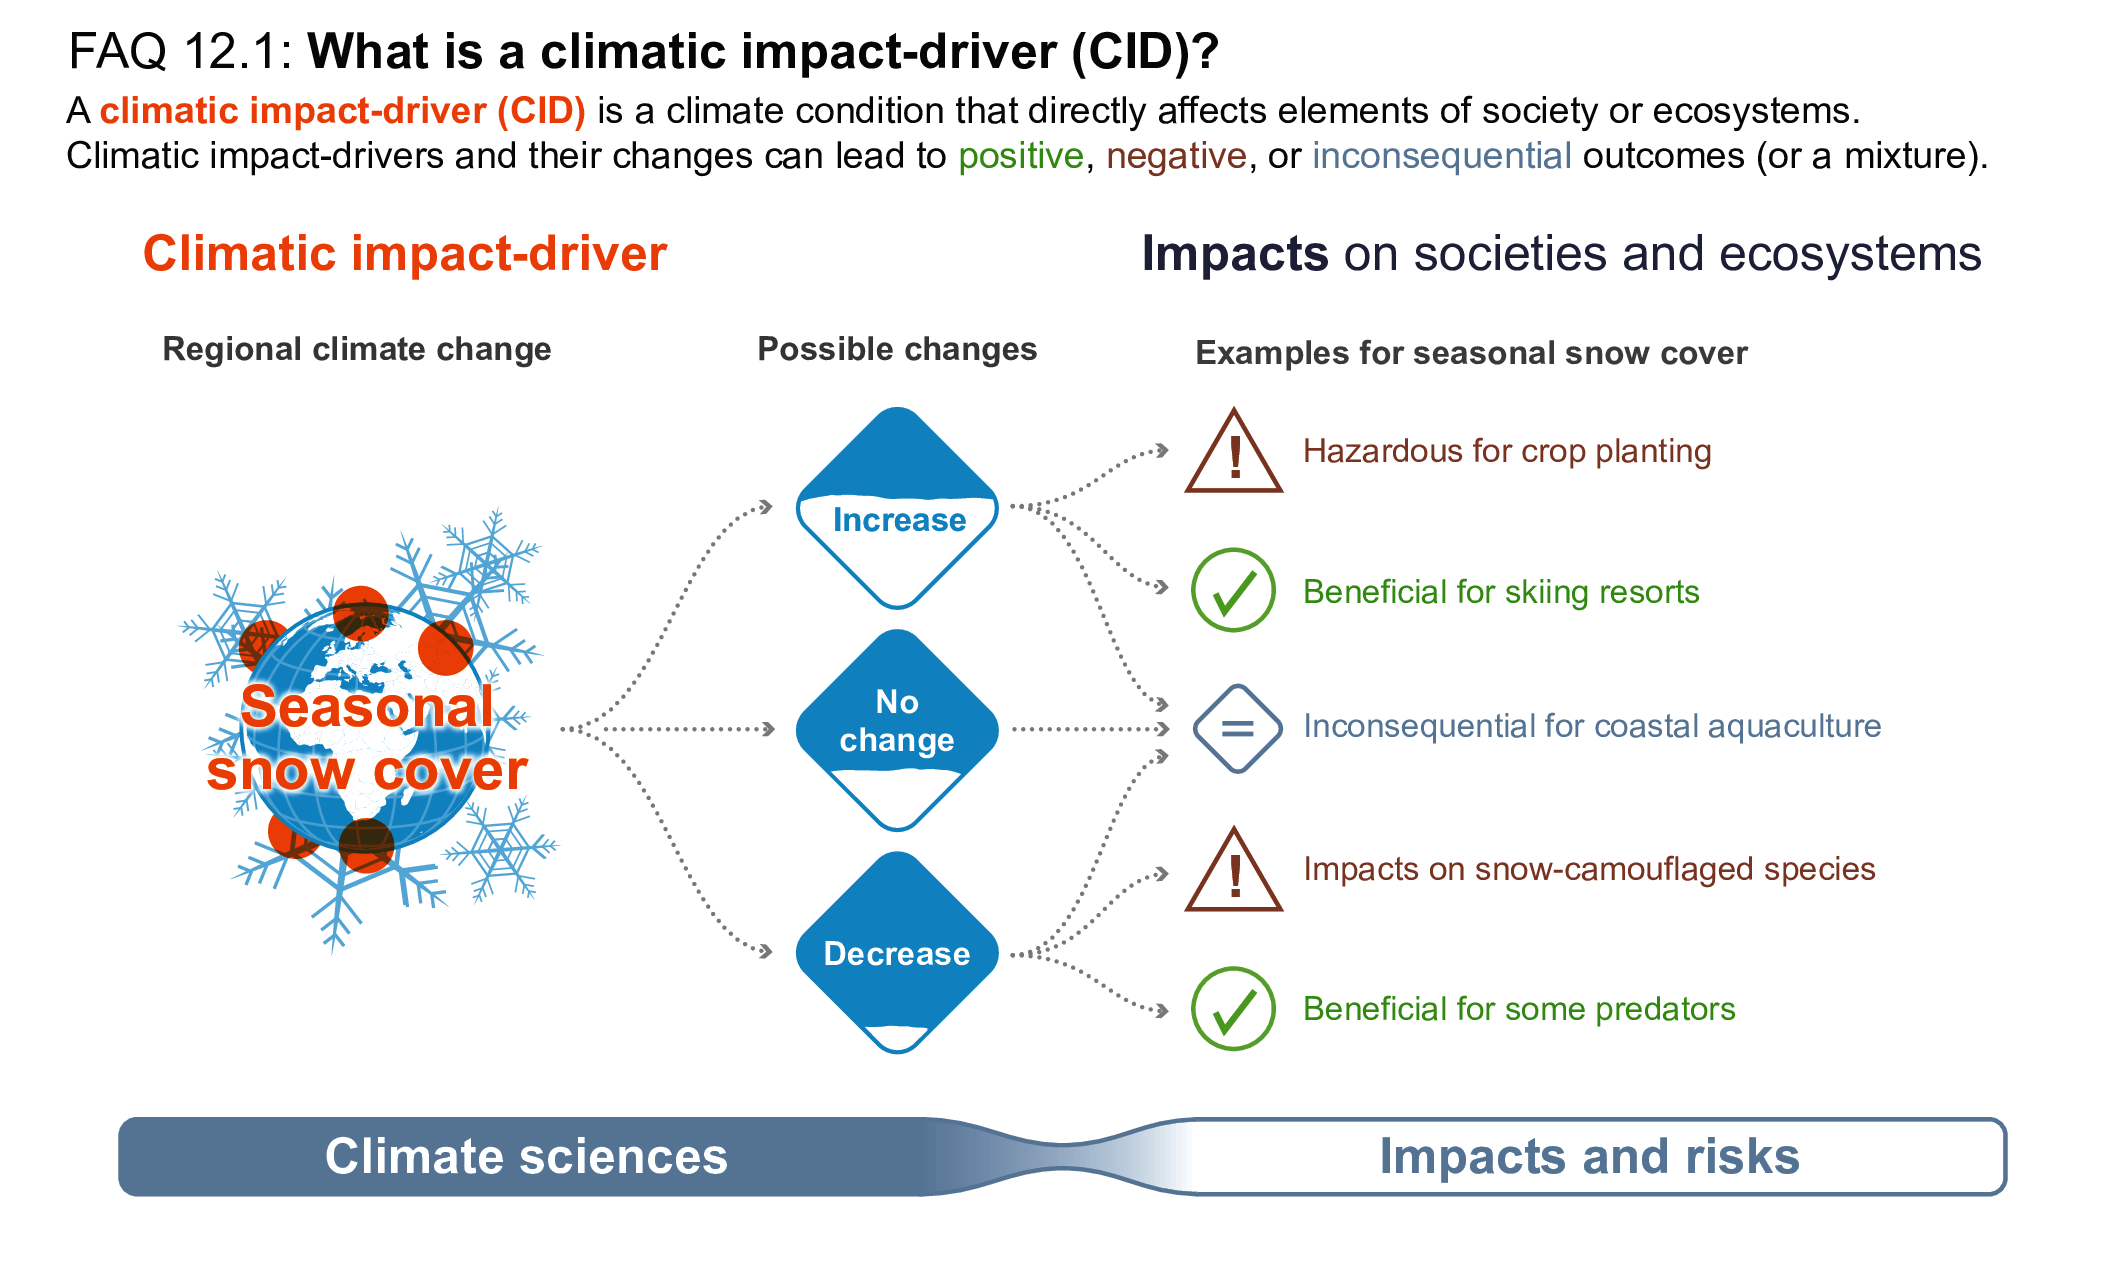
FAQ 12.1, Figure 1 | A single climatic impact-driver can affect ecosystems and society in different ways. A variety of impacts from the same climatic impact-driver change, illustrated with the example of regional seasonal snow cover.
FAQ 12.2 | What Are Climatic Thresholds and Why Are They Important?
Climatic thresholds tell us about the tolerance of society and ecosystems so that we can better scrutinize the types of climate changes that are expected to impact things we care about. Many systems have natural or structural thresholds. If conditions exceed those thresholds, the result can be sudden changes or even collapses in health, productivity, utility or behaviour. Adaptation and risk management efforts can change these thresholds, altering the profile of climate conditions that would be problematic and increasing overall system resilience.
Decision makers have long observed that certain weather and climate conditions can be problematic, or hazardous, for things they care about (i.e., things with socio-economic, cultural or intrinsic value). Many elements of society and ecosystems operate in a suitable climate zone selected naturally or by stakeholders considering the expected climate conditions. However, as climate change moves conditions beyond expected ranges, they may cross a climatic ‘threshold’ – a level beyond which there are either gradual changes in system behaviour or abrupt, non-linear and potentially irreversible impacts.
Climatic thresholds can be associated with either natural or structural tolerance levels. Natural thresholds, for instance, include heat and humidity conditions above which humans cannot regulate their internal temperatures through sweat, drought durations that heighten competition between species, and winter temperatures that are lethal for pests or disease-carrying vector species. Structural thresholds include engineered limits of drainage systems, extreme wind speeds that limit wind turbine operation, the height of coastal protection infrastructure, and the locations of irrigation infrastructure or tropical cyclone sheltering facilities.
Thresholds may be defined according to raw values (such as maximum temperature exceeding 35°C) or percentiles (such as the local 99th percentile daily rainfall total). They also often have strong seasonal dependence (see FAQ 12.3). For example, the amount of snowfall that a deciduous tree can withstand depends on whether the snowfall occurs before or after the tree sheds its leaves. Most systems respond to changes in complex ways, and those responses are not determined solely or precisely by specific thresholds of a single climate variable. Nonetheless, thresholds can be useful indicators of system behaviours, and an understanding of these thresholds can help inform risk management decisions.
FAQ 12.2 Figure 1 illustrates how threshold conditions can help us understand climate conditions that are suitable for normal system operation and the thresholds beyond which impacts occur. Crops tend to grow most optimally within a suitable range of daily temperatures that is influenced by the varieties being cultivated and the way the farm is managed. As daily temperatures rise above a ‘critical’ temperature threshold, plants begin to experience heat stress that reduces growth and may lower resulting yields. If temperatures reach a higher ‘limiting’ temperature threshold, crops may suffer leaf loss, pollen sterility, or tissue damage that can lead to crop failure. Farmers typically select a cropping system with some consideration to the probability of extreme temperature events that may occur within a typical season, and so identifying hot temperature thresholds helps farmers select their seed and field management strategies as part of their overall risk management. Climate experts may therefore aim to assist farm planning by providing information about the climate change-induced shifts to the expected frequency of daily heat extremes that exceed crop tolerance thresholds.
Adaptation and other changes in societies and environment can shift climatic thresholds by modifying vulnerability and exposure. For example, adaptation efforts may include breeding new crops with higher heat tolerance levels so that corresponding dangerous thresholds occur less frequently. Likewise, increasing the height of a flood embankment protecting a given community can increase the level of river flow that may be tolerated without flooding, reducing the frequency of damaging floods. Stakeholders therefore benefit from climate services that are based on a co-development process, with scientists identifying system-relevant thresholds and developing tailored climatic impact-driver indices that represent these thresholds (FAQ 12.1). These thresholds help focus the provision of action-relevant climate information for adaptation and risk management.

FAQ 12.2, Figure 1 | Crop response to maximum temperature thresholds. Crop growth rate responds to daily maximum temperature increases, leading to reduced growth and crop failure as temperatures exceed critical and limiting temperature thresholds, respectively. Note that changes in other environmental factors (such as carbon dioxide and water) may increase the tolerance of plants to increasing temperatures.
FAQ 12.3 | How Will Climate Change Affect the Regional Characteristics of a Climate Hazard?
Human-driven climate change can alter the regional characteristics of a climate hazard by changing the magnitude or intensity of the climate hazard, the frequency with which it occurs, the duration that hazardous conditions persist, the timing when the hazard occurs, or the spatial extent threatened by the hazard. By examining each of these aspects of a hazard’s profile change, climate services may provide climate risk information that allows decision makers to better tailor adaptation, mitigation and risk management strategies.
A climate hazard is a climate condition with the potential to harm natural systems or society. Examples include heatwaves, droughts, heavy snowfall events and sea level rise. Climate scientists look for patterns in climatic impact-drivers to detect the signature of changing hazards that may influence stakeholder planning (FAQ 12.1). Climate service providers work with stakeholders and impacts experts to identify key system responses and tolerance thresholds (FAQ 12.2) and then examine historical observations and future climate projections to identify associated changes to the characteristics of a regional hazard’s profile. Climate change can alter at least five different characteristics of the hazard profile of a region (FAQ 12.3, Figure 1):
Magnitude or intensity is the raw value of a climate hazard, such as an increase in the maximum yearly temperature or in the height of flooding that results from a coastal storm with a 1% change of occurring each year.
Frequency is the number of times that a climate hazard reaches or surpasses a threshold over a given period. For example, increases to the number of heavy snowfall events, tornadoes, or floods experienced in a year or in a decade.
Duration is the length of time over which hazardous conditions persist beyond a threshold, such as an increase in the number of consecutive days where maximum air temperature exceeds 35°C, the number of consecutive months of drought conditions, or the number of days that a tropical cyclone affects a location.
Timingcaptures the occurrence of a hazardous event in relation to the course of a day, season, year, or other period in which sectoral elements are evolving or co-dependent (such as the time of year when migrating animals expect to find a seasonal food supply). Examples include a shift towards an earlier day of the year when the last spring frost occurs or a delay in the typical arrival date for the first seasonal rains, the length of the winter period when the ground is typically covered by snow, or a reduction in the typical time needed for soil moisture to move from normal to drought conditions.
Spatial extent is the region in which a hazardous condition is expected, such as the area currently threatened by tropical cyclones, geographical areas where the coldest day of the year restricts a particular pest or pathogen, terrain where permafrost is present, the area that would flood following a common storm, zones where climate conditions are conducive to outdoor labour, or the size of a marine heatwave.
Hazard profile changes are often intertwined or stem from related physical changes to the climate system. For example, changes in the frequency and magnitude of extreme events are often directly related to each other as a result of atmospheric dynamics and chemical processes. In many cases, one aspect of hazard change is more apparent than others, which may provide a first emergent signal indicating a larger set of changes to come (FAQ 1.2).
Information about how a hazard has changed or will change helps stakeholders prioritize more robust adaptation, mitigation and risk management strategies. For example, allocation of limited disaster relief resources may be designed to recognize that tropical cyclones are projected to become more intense even as the frequency of those storms may not change. Planning may also factor in the fact that even heatwaves that are not record-breaking in their intensity can still be problematic for vulnerable populations when they persist over a long period. Likewise, firefighters recognize new logistical challenges in the lengthening of the fire weather season and an expansion of fire conditions into parts of the world where fires were not previously a great concern. Strong engagement between climate scientists and stakeholders therefore helps climate services tailor and communicate clear information about the types of changing climate hazards to be addressed in resilience efforts.
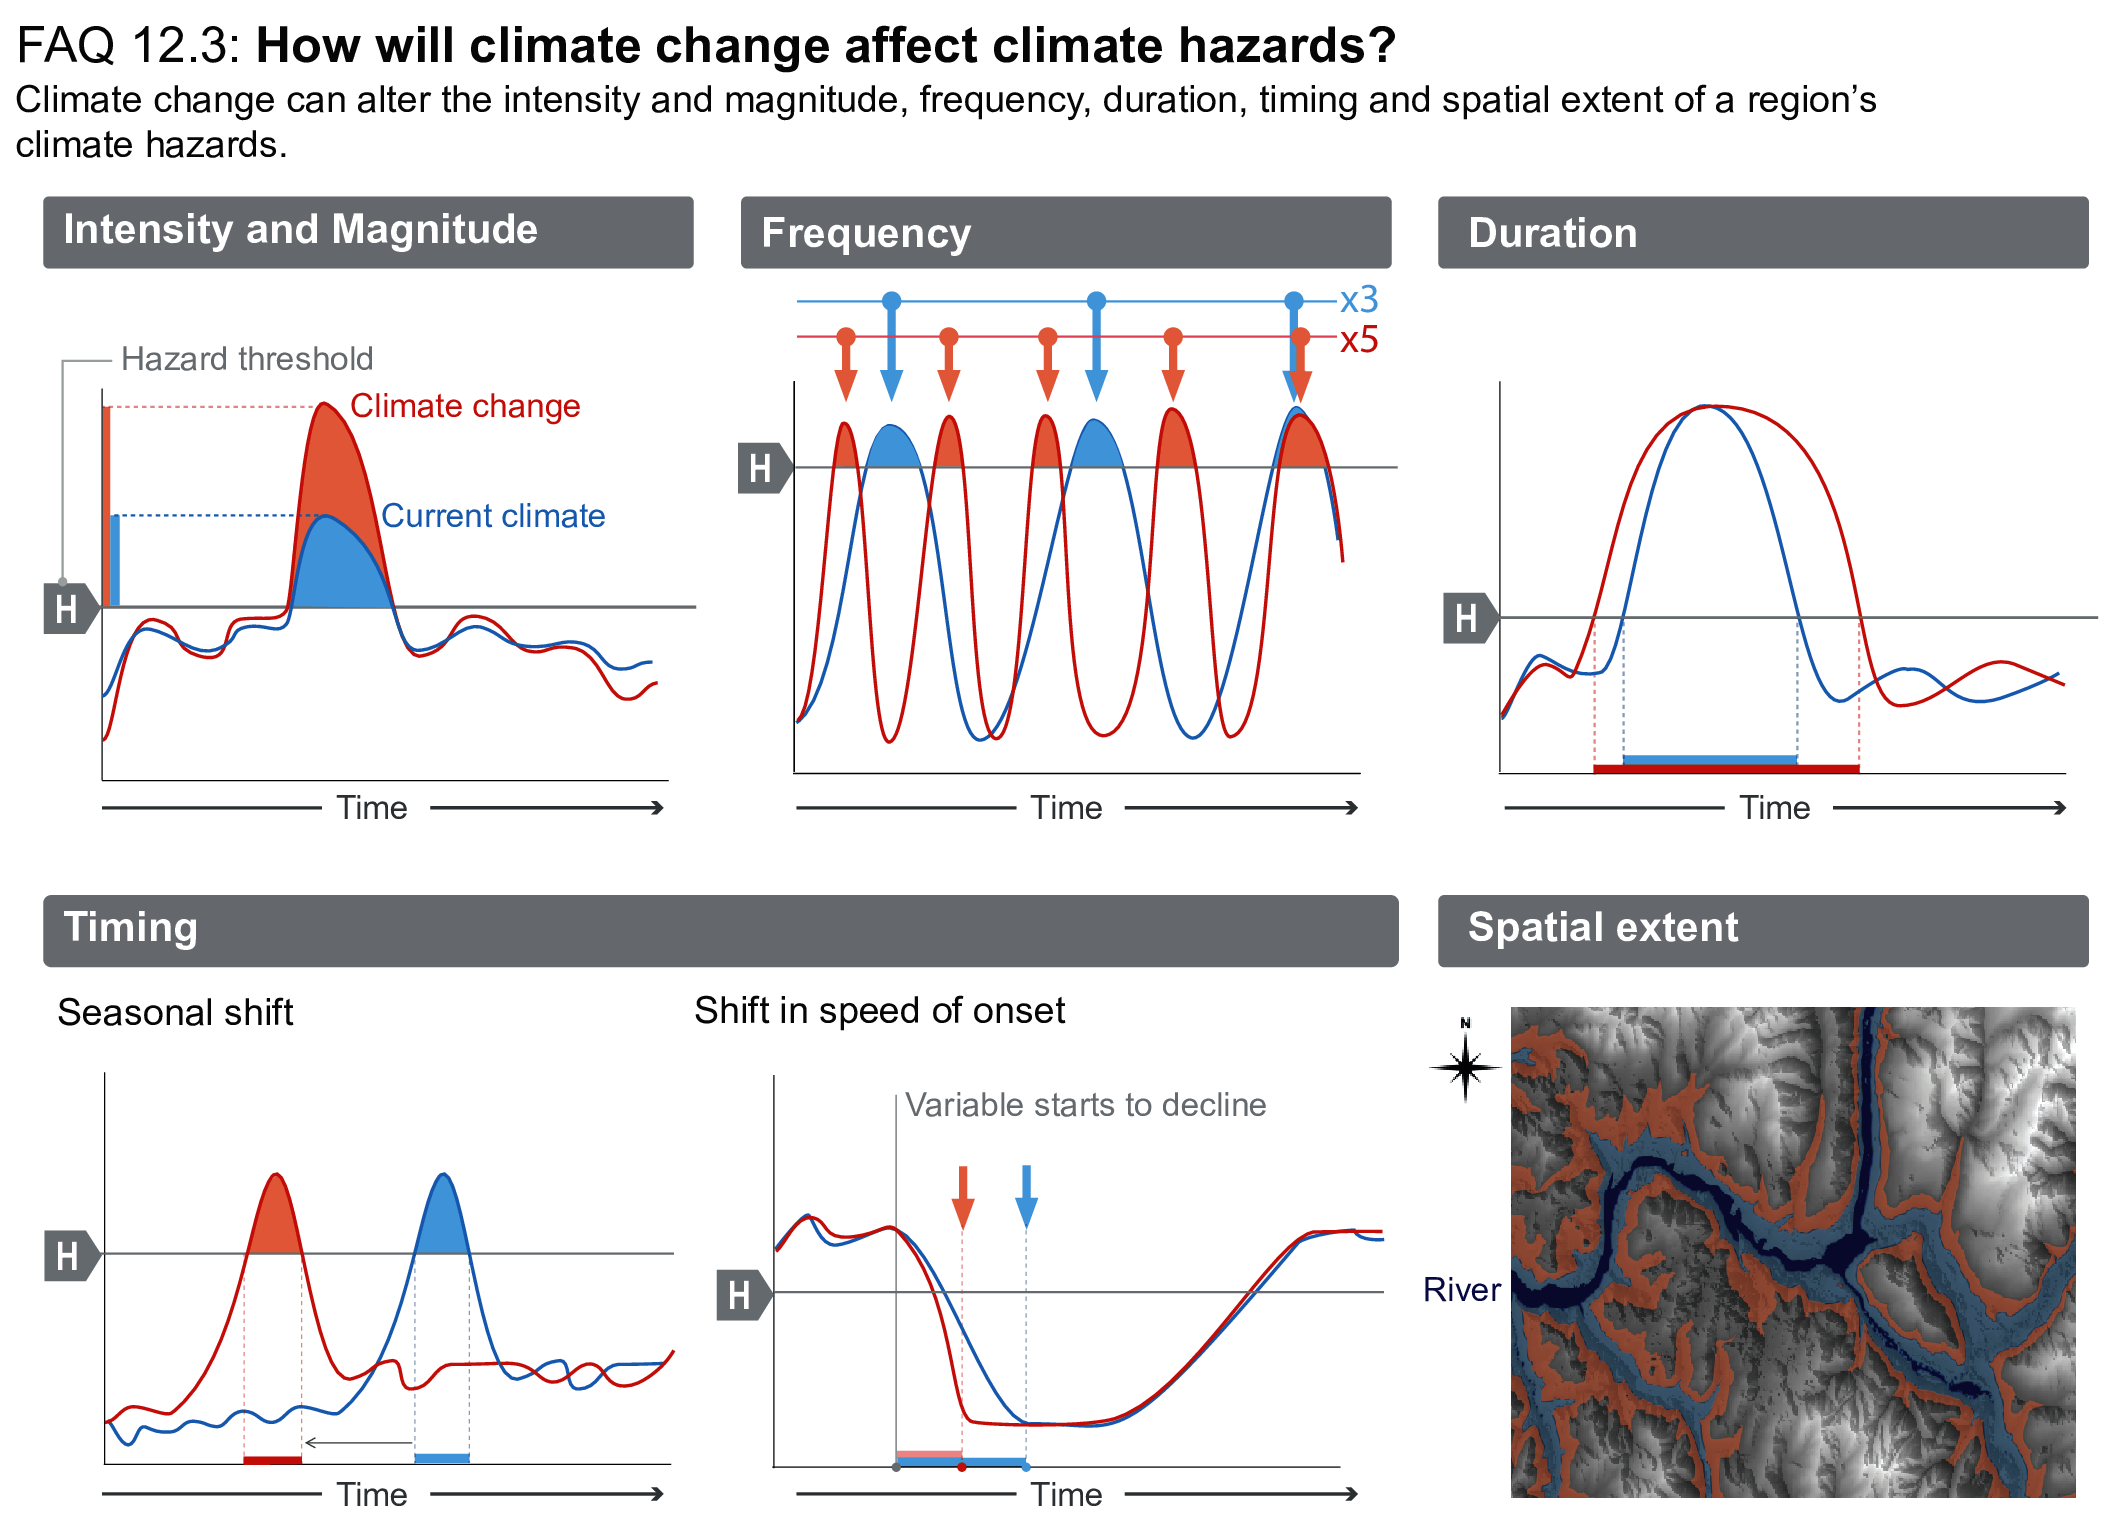
FAQ 12.3, Figure 1 | Types of changes to a region’s hazard profile. The first five panels illustrate how climate changes can alter a hazard’s intensity (or magnitude), frequency, duration, and timing (by seasonality and speed of onset) in relation to a hazard threshold (horizontal grey line, marked ‘H’). The difference between the historical climate (blue) and future climate (red) shows the changing aspects of climate change that stakeholders will have to manage. The bottom right-hand panel shows how a given climate hazard (such as a current once-in-100-year river flood, geographic extent in blue) may reach new geographical areas under a future climate change (extended area in red).
References
Aalto, J., S. Harrison, and M. Luoto, 2017: Statistical modelling predicts almost complete loss of major periglacial processes in Northern Europe by 2100. Nature Communications, 8(1), 515, doi: 10.1038/s41467-017-00669-3.
Abatzoglou, J.T. and A.P. Williams, 2016: Impact of anthropogenic climate change on wildfire across western US forests. Proceedings of the National Academy of Sciences, 113(42), 11770–11775, doi: 10.1073/pnas.1607171113.
Abatzoglou, J.T., A.P. Williams, and R. Barbero, 2019: Global Emergence of Anthropogenic Climate Change in Fire Weather Indices. Geophysical Research Letters, 46(1), 326–336, doi: 10.1029/2018gl080959.
Abegg, B. et al., 2021: Overloaded! Critical revision and a new conceptual approach for snow indicators in ski tourism. International Journal of Biometeorology, 65(5), 691–701, doi: 10.1007/s00484-020-01867-3.
Abiodun, B.J., N. Makhanya, B. Petja, A.A. Abatan, and P.G. Oguntunde, 2019: Future projection of droughts over major river basins in Southern Africa at specific global warming levels. Theoretical and Applied Climatology, 137(3–4), 1785–1799, doi: 10.1007/s00704-018-2693-0.
Abram, N.J. et al., 2021: Connections of climate change and variability to large and extreme forest fires in southeast Australia. Communications Earth & Environment, 2(1), 8, doi: 10.1038/s43247-020-00065-8.
Acar Deniz, Z. and B. Gönençgil, 2015: Trends of summer daily maximum temperature extremes in Turkey. Physical Geography, 36(4), 268–281, doi: 10.1080/02723646.2015.1045285.
Acquah, H.-G. and E.E. Onumah, 2011: Farmers Perception and Adaptation to Climate Change: An Estimation of Willingness to Pay. AGRIS on-line Papers in Economics and Informatics, 3, 31–39, doi: 10.22004/ag.econ.120241.
ADB, 2014: Climate Risk Management in ADB Projects. Publication Stock No. ARM146926-2, Asian Development Bank (ADB), Manila, Philippines, 6 pp., www.adb.org/sites/default/files/publication/148796/climate-risk-management-adb-projects.pdf .
ADB, 2018: Strategy 2030: Achieving a Prosperous, Inclusive, Resilient, and Sustainable Asia and the Pacific. Publication Stock No. TCS189401-2, Asian Development Bank (ADB), Manila, Philippines, 34 pp., doi: 10.22617/tcs189401-2.
ADB, 2020: Climate Change Risk and Adaptation Assessment for Irrigation in Southern Viet Nam: Water Efficiency Improvements in Drought-Affected Provinces. Publication Stock No. TCS200351-2, Asian Development Bank (ADB), Manila, Philippines, 80 pp., doi: 10.22617/tcs200351-2.
Addo, K.A. and I.A. Addo, 2016: Coastal erosion management in Accra: Combining local knowledge and empirical research. Journal of Disaster Risk Studies, 8(1), 274, doi: 10.4102/jamba.v8i1.274.
Aerts, J.C.J.H. et al., 2014: Evaluating Flood Resilience Strategies for Coastal Megacities. Science, 344(6183), 473–475, doi: 10.1126/science.1248222.
Agafonova, S.A., N.L. Frolova, I.N. Krylenko, A.A. Sazonov, and P.P. Golovlyov, 2017: Dangerous ice phenomena on the lowland rivers of European Russia. Natural Hazards, 88(S1), 171–188, doi: 10.1007/s11069-016-2580-x.
Agier, L. et al., 2013: Seasonality of meningitis in Africa and climate forcing: aerosols stand out. Journal of The Royal Society Interface, 10(79), 20120814, doi: 10.1098/rsif.2012.0814.
Aguilar-Lome, J. et al., 2019: Elevation-dependent warming of land surface temperatures in the Andes assessed using MODIS LST time series (2000–2017). International Journal of Applied Earth Observation and Geoinformation, 77, 119–128, doi: 10.1016/j.jag.2018.12.013.
Ahmadalipour, A. and H. Moradkhani, 2018: Escalating heat-stress mortality risk due to global warming in the Middle East and North Africa (MENA). Environment International, 117, 215–225, doi: 10.1016/j.envint.2018.05.014.
Ahmadalipour, A., H. Moradkhani, and M.C. Demirel, 2017: A comparative assessment of projected meteorological and hydrological droughts: Elucidating the role of temperature. Journal of Hydrology, 553, 785–797, doi: 10.1016/j.jhydrol.2017.08.047.
Ahmed, K., S. Shahid, and N. Nawaz, 2018: Impacts of climate variability and change on seasonal drought characteristics of Pakistan. Atmospheric Research, 214, 364–374, doi: 10.1016/j.atmosres.2018.08.020.
Ahmed, K., S. Shahid, X. Wang, N. Nawaz, and N. Khan, 2019: Spatiotemporal changes in aridity of Pakistan during 1901–2016. Hydrology and Earth System Sciences, 23(7), 3081–3096, doi: 10.5194/hess-23-3081-2019.
Ahmed, N., S. Thompson, and M. Glaser, 2019: Global Aquaculture Productivity, Environmental Sustainability, and Climate Change Adaptability. Environmental Management, 63(2), 159–172, doi: 10.1007/s00267-018-1117-3.
Ahmed, N. et al., 2020: Temperature trends and elevation dependent warming during 1965–2014 in headwaters of Yangtze River, Qinghai Tibetan Plateau. Journal of Mountain Science, 17(3), 556–571, doi: 10.1007/s11629-019-5438-3.
Aich, V. et al., 2014: Comparing impacts of climate change on streamflow in four large African river basins. Hydrology and Earth System Sciences, 18(4), 1305–1321, doi: 10.5194/hess-18-1305-2014.
Aich, V., B. Koné, F.F. Hattermann, and E.N. Paton, 2016a: Time Series Analysis of Floods across the Niger River Basin. Water, 8(4), 165, doi: 10.3390/w8040165.
Aich, V. et al., 2016b: Flood projections within the Niger River Basin under future land use and climate change. Science of The Total Environment, 562, 666–677, doi: 10.1016/j.scitotenv.2016.04.021.
Aich, V. et al., 2017: Climate Change in Afghanistan Deduced from Reanalysis and Coordinated Regional Climate Downscaling Experiment (CORDEX)–South Asia Simulations. Climate, 5(2), 38, doi: 10.3390/cli5020038.
Aitsi-Selmi, A., S. Egawa, H. Sasaki, C. Wannous, and V. Murray, 2015: The Sendai Framework for Disaster Risk Reduction: Renewing the Global Commitment to People’s Resilience, Health, and Well-being. International Journal of Disaster Risk Science, 6(2), 164–176, doi: 10.1007/s13753-015-0050-9.
Akhiljith, P.J. et al., 2019: Climatic Projections of Indian Ocean During 2030, 2050, 2080 with Implications on Fisheries Sector. Journal of Coastal Research, 86(sp1), 198, doi: 10.2112/si86-030.1.
Akhter, J., L. Das, J.K. Meher, and A. Deb, 2018: Uncertainties and time of emergence of multi-model precipitation projection over homogeneous rainfall zones of India. Climate Dynamics, 50(9), 3813–3831, doi: 10.1007/s00382-017-3847-y.
Akperov, M. et al., 2018: Cyclone Activity in the Arctic From an Ensemble of Regional Climate Models (Arctic CORDEX). Journal of Geophysical Research: Atmospheres, 123(5), 2537–2554, doi: 10.1002/2017jd027703.
Akperov, M. et al., 2019: Future projections of cyclone activity in the Arctic for the 21st century from regional climate models (Arctic-CORDEX). Global and Planetary Change, 182, 103005, doi: 10.1016/j.gloplacha.2019.103005.
Al Ameri, I.D.S., R.M. Briant, and S. Engels, 2019: Drought severity and increased dust storm frequency in the Middle East: a case study from the Tigris–Euphrates alluvial plain, central Iraq. Weather, 74(12), 416–426, doi: 10.1002/wea.3445.
Albert, S. et al., 2016: Interactions between sea-level rise and wave exposure on reef island dynamics in the Solomon Islands. Environmental Research Letters, 11(5), 54011, doi: 10.1088/1748-9326/11/5/054011.
Albright, R. et al., 2016: Reversal of ocean acidification enhances net coral reef calcification. Nature, 531(7594), 362–365, doi: 10.1038/nature17155.
Alexander, L. and J.M. Arblaster, 2017: Historical and projected trends in temperature and precipitation extremes in Australia in observations and CMIP5. Weather and Climate Extremes, 15, 34–56, doi: 10.1016/j.wace.2017.02.001.
Alfieri, L., L. Feyen, F. Dottori, and A. Bianchi, 2015: Ensemble flood risk assessment in Europe under high end climate scenarios. Global Environmental Change, 35, 199–212, doi: 10.1016/j.gloenvcha.2015.09.004.
Alfieri, L. et al., 2017: Global projections of river flood risk in a warmer world. Earth’s Future, 5(2), 171–182, doi: 10.1002/2016ef000485.
Aljaryian, R. and L. Kumar, 2016: Changing global risk of invading greenbugSchizaphis graminumunder climate change. Crop Protection, 88, 137–148, doi: 10.1016/j.cropro.2016.06.008.
Allen, C.D., D.D. Breshears, and N.G. McDowell, 2015: On underestimation of global vulnerability to tree mortality and forest die-off from hotter drought in the Anthropocene. Ecosphere, 6(8), 1–55, doi: 10.1890/es15-00203.1.
Allen, J.T., 2018: Climate Change and Severe Thunderstorms. In: Oxford Research Encyclopedia of Climate Science. Oxford University Press, Oxford, UK, doi: 10.1093/acrefore/9780190228620.013.62.
Allen, J.T., M.K. Tippett, and A.H. Sobel, 2015: An empirical model relating U.S. monthly hail occurrence to large-scale meteorological environment. Journal of Advances in Modeling Earth Systems, 7(1), 226–243, doi: 10.1002/2014ms000397.
Allen, S. and C. Huggel, 2013: Extremely warm temperatures as a potential cause of recent high mountain rockfall. Global and Planetary Change, 107, 59–69, doi: 10.1016/j.gloplacha.2013.04.007.
Almazroui, M., S. Saeed, F. Saeed, M.N. Islam, and M. Ismail, 2020: Projections of Precipitation and Temperature over the South Asian Countries in CMIP6. Earth Systems and Environment, 4(2), 297–320, doi: 10.1007/s41748-020-00157-7.
Almazroui, M. et al., 2021: Projected Changes in Temperature and Precipitation Over the United States, Central America, and the Caribbean in CMIP6 GCMs. Earth Systems and Environment, 5(1), 1–24, doi: 10.1007/s41748-021-00199-5.
Alobaidi, M., M. Almazroui, A. Mashat, and P.D. Jones, 2017: Arabian Peninsula wet season dust storm distribution: regionalization and trends analysis (1983–2013). International Journal of Climatology, 37(3), 1356–1373, doi: 10.1002/joc.4782.
Alongi, D.M., 2015: The Impact of Climate Change on Mangrove Forests. Current Climate Change Reports, 1(1), 30–39, doi: 10.1007/s40641-015-0002-x.
Altieri, A.H. and K.B. Gedan, 2015: Climate change and dead zones. Global Change Biology, 21(4), 1395–1406, doi: 10.1111/gcb.12754.
Altman, J. et al., 2018: Poleward migration of the destructive effects of tropical cyclones during the 20th century. Proceedings of the National Academy of Sciences, 115(45), 11543–11548, doi: 10.1073/pnas.1808979115.
Alvioli, M. et al., 2018: Implications of climate change on landslide hazard in Central Italy. Science of The Total Environment, 630, 1528–1543, doi: 10.1016/j.scitotenv.2018.02.315.
AMAP, 2017: Snow, Water, Ice and Permafrost in the Arctic (SWIPA) 2017. Arctic Monitoring and Assessment Programme (AMAP), Oslo, Norway, 269 pp., www.amap.no/documents/doc/snow-water-ice-and-permafrost-in-the-arctic-swipa-2017/1610.
Ambika, A.K. and V. Mishra, 2020: Substantial decline in atmospheric aridity due to irrigation in India. Environmental Research Letters, 15(12), 124060, doi: 10.1088/1748-9326/abc8bc.
Amos, C.B. et al., 2014: Uplift and seismicity driven by groundwater depletion in central California. Nature, 509(7501), 483–486, doi: 10.1038/nature13275.
Andela, N. et al., 2017: A human-driven decline in global burned area. Science, 356(6345), 1356–1362, doi: 10.1126/science.aal4108.
Anderson, G.B., K.W. Oleson, B. Jones, and R.D. Peng, 2018: Projected trends in high-mortality heatwaves under different scenarios of climate, population, and adaptation in 82 US communities. Climatic Change, 146(3–4), 455–470, doi: 10.1007/s10584-016-1779-x.
Andresen, C.G. and V.L. Lougheed, 2015: Disappearing Arctic tundra ponds: Fine-scale analysis of surface hydrology in drained thaw lake basins over a 65 year period (1948–2013). Journal of Geophysical Research: Biogeosciences, 120(3), 466–479, doi: 10.1002/2014jg002778.
Andrews, O.D., N.L. Bindoff, P.R. Halloran, T. Ilyina, and C. Quéré, 2013: Detecting an external influence on recent changes in oceanic oxygen using an optimal fingerprinting method. Biogeosciences, 10(3), 1799–1813, doi: 10.5194/bg-10-1799-2013.
Anenberg, S.C. et al., 2017: Impacts of oak pollen on allergic asthma in the United States and potential influence of future climate change. GeoHealth, 1(3), 80–92, doi: 10.1002/2017gh000055.
Antwi-Agyei, P., K. Amanor, J.N. Hogarh, and A.J. Dougill, 2021: Predictors of access to and willingness to pay for climate information services in north-eastern Ghana: A gendered perspective. Environmental Development, 37, 100580, doi: 10.1016/j.envdev.2020.100580.
Araghi, A., C.J. Martinez, J. Adamowski, and J.E. Olesen, 2018: Spatiotemporal variations of aridity in Iran using high-resolution gridded data. International Journal of Climatology, 38(6), 2701–2717, doi: 10.1002/joc.5454.
Archfield, S.A., R.M. Hirsch, A. Viglione, and G. Blöschl, 2016: Fragmented patterns of flood change across the United States. Geophysical Research Letters, 43(19), 10232–10239, doi: 10.1002/2016gl070590.
Arheimer, B. and G. Lindström, 2015: Climate impact on floods: Changes in high flows in Sweden in the past and the future (1911–2100). Hydrology and Earth System Sciences, 19(2), 771–784, doi: 10.5194/hess-19-771-2015.
Arias-Ortiz, A. et al., 2018: A marine heatwave drives massive losses from the world’s largest seagrass carbon stocks. Nature Climate Change, 8(4), 338–344, doi: 10.1038/s41558-018-0096-y.
Arnell, N.W. and S.N. Gosling, 2013: The impacts of climate change on river flow regimes at the global scale. Journal of Hydrology, 486, 351–364, doi: 10.1016/j.jhydrol.2013.02.010.
Arnell, N.W. and B. Lloyd-Hughes, 2014: The global-scale impacts of climate change on water resources and flooding under new climate and socio-economic scenarios. Climatic Change, 122(1–2), 127–140, doi: 10.1007/s10584-013-0948-4.
Arnell, N.W. and S.N. Gosling, 2016: The impacts of climate change on river flood risk at the global scale. Climatic Change, 134(3), 387–401, doi: 10.1007/s10584-014-1084-5.
Arnell, N.W. et al., 2016: The impacts of climate change across the globe: A multi-sectoral assessment. Climatic Change, 134(3), 457–474, doi: 10.1007/s10584-014-1281-2.
Arnell, N.W. et al., 2019: The global and regional impacts of climate change under representative concentration pathway forcings and shared socioeconomic pathway socioeconomic scenarios. Environmental Research Letters, 14(8), 084046, doi: 10.1088/1748-9326/ab35a6.
Arp, C.D. et al., 2018: Contrasting lake ice responses to winter climate indicate future variability and trends on the Alaskan Arctic Coastal Plain. Environmental Research Letters, 13(12), 125001, doi: 10.1088/1748-9326/aae994.
Arrighi, J. et al., 2016: Unpacking the ‘City Learning Lab’ approach. Working Paper Series No. 7, Red Cross/Red Crescent Climate Centre, International Federation of Red Cross and Red Crescent Societies, The Hague, Netherlands, 15 pp., www.climatecentre.org/downloads/files/RCCC_JA_wps%207%20City%20Learning%20Lab%20v2.pdf .
Asadieh, B. and N.Y. Krakauer, 2017: Global change in streamflow extremes under climate change over the 21st century. Hydrology and Earth System Sciences, 21(11), 5863–5874, doi: 10.5194/hess-21-5863-2017.
Ashfaq, M. et al., 2021: Robust late twenty-first century shift in the regional monsoons in RegCM-CORDEX simulations. Climate Dynamics, 57(5–6), 1463–1488, doi: 10.1007/s00382-020-05306-2.
Ashley, W.S., A.M. Haberlie, and V.A. Gensini, 2020: Reduced frequency and size of late-twenty-first-century snowstorms over North America. Nature Climate Change, 10(6), 539–544, doi: 10.1038/s41558-020-0774-4.
Asseng, S. et al., 2015: Rising temperatures reduce global wheat production. Nature Climate Change, 5(2), 143–147, doi: 10.1038/nclimate2470.
Aström, C. et al., 2013: Heat-related respiratory hospital admissions in Europe in a changing climate: a health impact assessment. BMJ open, 3(1), e001842, doi: 10.1136/bmjopen-2012-001842.
Athanasiou, P. et al., 2020: Uncertainties in projections of sandy beach erosion due to sea level rise: an analysis at the European scale. Scientific Reports, 10(1), 11895, doi: 10.1038/s41598-020-68576-0.
Auffhammer, M., P. Baylis, and C.H. Hausman, 2017: Climate change is projected to have severe impacts on the frequency and intensity of peak electricity demand across the United States. Proceedings of the National Academy of Sciences, 114(8), 1886–1891, doi: 10.1073/pnas.1613193114.
Augusto Sanabria, L. and A.F. Carril, 2018: Maps of wind hazard over South Eastern South America considering climate change. Climatic Change, 148(1–2), 235–247, doi: 10.1007/s10584-018-2174-6.
Ault, T.R., M.D. Schwartz, R. Zurita-Milla, J.F. Weltzin, and J.L. Betancourt, 2015: Trends and Natural Variability of Spring Onset in the Coterminous United States as Evaluated by a New Gridded Dataset of Spring Indices. Journal of Climate, 28(21), 8363–8378, doi: 10.1175/jcli-d-14-00736.1.
Ávila, Á, F. Guerrero, Y. Escobar, and F. Justino, 2019: Recent Precipitation Trends and Floods in the Colombian Andes. Water, 11(2), 379, doi: 10.3390/w11020379.
Azorin-Molina, C., J.H. Dunn, C.A. Mears, P. Berrisford, and T.R. McVicar, 2018: Surface winds [in “State of the Climate in 2017”]. Bulletin of the American Meteorological Society, 99 (8), S41–S44, d oi: 10.1175/2018bamsstateoftheclimate.1.
Babur, M., M. Babel, S. Shrestha, A. Kawasaki, and N. Tripathi, 2016: Assessment of Climate Change Impact on Reservoir Inflows Using Multi Climate-Models under RCPs – The Case of Mangla Dam in Pakistan. Water, 8(9), 389, doi: 10.3390/w8090389.
Bachmair, S. et al., 2016: Drought indicators revisited: the need for a wider consideration of environment and society. WIREs Water, 3(4), 516–536, doi: 10.1002/wat2.1154.
Bacmeister, J.T. et al., 2018: Projected changes in tropical cyclone activity under future warming scenarios using a high-resolution climate model. Climatic Change, 146(3), 547–560, doi: 10.1007/s10584-016-1750-x.
Bajracharya, A.R., S.R. Bajracharya, A.B. Shrestha, and S.B. Maharjan, 2018: Climate change impact assessment on the hydrological regime of the Kaligandaki Basin, Nepal. Science of the Total Environment, 625, 837–848, doi: 10.1016/j.scitotenv.2017.12.332.
Baker-Austin, C. et al., 2013: Emerging Vibriorisk at high latitudes in response to ocean warming. Nature Climate Change, 3(1), 73–77, doi: 10.1038/nclimate1628.
Bakun, A. et al., 2015: Anticipated Effects of Climate Change on Coastal Upwelling Ecosystems. Current Climate Change Reports, 1(2), 85–93, doi: 10.1007/s40641-015-0008-4.
Balch, J.K. et al., 2017: Human-started wildfires expand the fire niche across the United States. Proceedings of the National Academy of Sciences, 114(11), 2946–2951, doi: 10.1073/pnas.1617394114.
Baldissera Pacchetti, M.B., S. Dessai, S. Bradley, and D.A. Stainforth, 2021: Assessing the Quality of Regional Climate Information. Bulletin of the American Meteorological Society, 102(3), E476–E491, doi: 10.1175/bams-d-20-0008.1.
Ballesteros-Cánovas, J.A., D. Trappmann, J. Madrigal-González, N. Eckert, and M. Stoffel, 2018: Climate warming enhances snow avalanche risk in the Western Himalayas. Proceedings of the National Academy of Sciences, 115(13), 3410–3415, doi: 10.1073/pnas.1716913115.
Ballinger, J., B. Jackson, I. Pechlivanidis, and W. Ries, 2011: Potential flooding and inundation on the Hutt River. School of Geography, Environment and Earth Sciences, and Climate Change Research Institute, Victoria University of Wellington, Wellington, New Zealand, 37 pp., www.victoria.ac.nz/sgees/research-centres/documents/potential-flooding-and-inundation-on-the-hutt-river.pdf .
Bamunawala, J., S. Maskey, T. Duong, and A. van der Spek, 2018: Significance of Fluvial Sediment Supply in Coastline Modelling at Tidal Inlets. Journal of Marine Science and Engineering, 6(3), 79, doi: 10.3390/jmse6030079.
Barange, M. et al., 2014: Impacts of climate change on marine ecosystem production in societies dependent on fisheries. Nature Climate Change, 4(3), 211–216, doi: 10.1038/nclimate2119.
Barbero, R., J.T. Abatzoglou, F. Pimont, J. Ruffault, and T. Curt, 2020: Attributing Increases in Fire Weather to Anthropogenic Climate Change Over France. Frontiers in Earth Science, 8, 527278832, doi: 10.3389/feart.2020.00104.
Barcikowska, M.J., G. Muñoz, S.J. Weaver, S. Russo, and M. Wehner, 2019: On the potential impact of a half-degree warming on cold and warm temperature extremes in mid-latitude North America. Environmental Research Letters, 14(12), 124040, doi: 10.1088/1748-9326/ab4dea.
Barichivich, J. et al., 2018: Recent intensification of Amazon flooding extremes driven by strengthened Walker circulation. Science Advances, 4(9), doi: 10.1126/sciadv.aat8785.
Barlow, M. et al., 2016: A Review of Drought in the Middle East and Southwest Asia. Journal of Climate, 29(23), 8547–8574, doi: 10.1175/jcli-d-13-00692.1.
Barnes, P.W. et al., 2019: Ozone depletion, ultraviolet radiation, climate change and prospects for a sustainable future. Nature Sustainability, 2(7), 569–579, doi: 10.1038/s41893-019-0314-2.
Barreau, T. et al., 2017: Physical, Mental, and Financial Impacts From Drought in Two California Counties, 2015. American Journal of Public Health, 107(5), 783–790, doi: 10.2105/ajph.2017.303695.
Barros, V.R. et al., 2015: Climate change in Argentina: trends, projections, impacts and adaptation. WIREs Climate Change, 6(2), 151–169, doi: 10.1002/wcc.316.
Barrow, E.M. and D.J. Sauchyn, 2019: Uncertainty in climate projections and time of emergence of climate signals in the western Canadian Prairies. International Journal of Climatology, 39(11), 4358–4371, doi: 10.1002/joc.6079.
Bartiko, D., D.Y. Oliveira, N.B. Bonumá, and P.L.B. Chaffe, 2019: Spatial and seasonal patterns of flood change across Brazil. Hydrological Sciences Journal, 64(9), 1071–1079, doi: 10.1080/02626667.2019.1619081.
Bartók, B. et al., 2017: Projected changes in surface solar radiation in CMIP5 global climate models and in EURO-CORDEX regional climate models for Europe. Climate Dynamics, 49(7–8), 2665–2683, doi: 10.1007/s00382-016-3471-2.
Bartos, M. et al., 2016: Impacts of rising air temperatures on electric transmission ampacity and peak electricity load in the United States. Environmental Research Letters, 11(11), 114008, doi: 10.1088/1748-9326/11/11/114008.
Basha, G. et al., 2017: Historical and Projected Surface Temperature over India during the 20th and 21st century. Scientific Reports, 7(1), 2987, doi: 10.1038/s41598-017-02130-3.
Bassiouni, M. and D.S. Oki, 2013: Trends and shifts in streamflow in Hawai’i, 1913–2008. Hydrological Processes, 27(10), 1484–1500, doi: 10.1002/hyp.9298.
Bassu, S. et al., 2014: How do various maize crop models vary in their responses to climate change factors?Global Change Biology, 20(7), 2301–2320, doi: 10.1111/gcb.12520.
Basu, S., X. Zhang, and Z. Wang, 2018: Eurasian Winter Storm Activity at the End of the Century: A CMIP5 Multi-model Ensemble Projection. Earth’s Future, 6(1), 61–70, doi: 10.1002/2017ef000670.
Baztan, J., M. Cordier, J.-M. Huctin, Z. Zhu, and J.-P. Vanderlinden, 2017: Life on thin ice: Insights from Uummannaq, Greenland for connecting climate science with Arctic communities. Polar Science, 13, 100–108, doi: 10.1016/j.polar.2017.05.002.
Baztan, J., J.-P. Vanderlinden, L. Jaffrès, B. Jorgensen, and Z. Zhu, 2020: Facing climate injustices: Community trust-building for climate services through arts and sciences narrative co-production. Climate Risk Management, 30, 100253, doi: 10.1016/j.crm.2020.100253.
Beach, R.H. et al., 2019: Combining the effects of increased atmospheric carbon dioxide on protein, iron, and zinc availability and projected climate change on global diets: a modelling study. The Lancet Planetary Health, 3(7), e307–e317, doi: 10.1016/s2542-5196(19)30094-4.
Bebber, D.P., 2015: Range-Expanding Pests and Pathogens in a Warming World. Annual Review of Phytopathology, 53(1), 335–356, doi: 10.1146/annurev-phyto-080614-120207.
Bedia, J., S. Herrera, A. Camia, J.M. Moreno, and J.M. Gutiérrez, 2014: Forest fire danger projections in the Mediterranean using ENSEMBLES regional climate change scenarios. Climatic Change, 122(1–2), 185–199, doi: 10.1007/s10584-013-1005-z.
Bedia, J. et al., 2015: Global patterns in the sensitivity of burned area to fire-weather: Implications for climate change. Agricultural and Forest Meteorology, 214–215, 369–379, doi: 10.1016/j.agrformet.2015.09.002.
Behrenfeld, M.J. et al., 2016: Revaluating ocean warming impacts on global phytoplankton. Nature Climate Change, 6(3), 323–330, doi: 10.1038/nclimate2838.
Bell, J.D. et al., 2013: Mixed responses of tropical Pacific fisheries and aquaculture to climate change. Nature Climate Change, 3(6), 591–599, doi: 10.1038/nclimate1838.
Bell, S.S. et al., 2019: Projections of southern hemisphere tropical cyclone track density using CMIP5 models. Climate Dynamics, 52(9–10), 6065–6079, doi: 10.1007/s00382-018-4497-4.
Bellaire, S., B. Jamieson, S. Thumlert, J. Goodrich, and G. Statham, 2016: Analysis of long-term weather, snow and avalanche data at Glacier National Park, B.C., Canada. Cold Regions Science and Technology, 121, 118–125, doi: 10.1016/j.coldregions.2015.10.010.
Belušić Vozila, A., I. Güttler, B. Ahrens, A. Obermann-Hellhund, and M. Telišman Prtenjak, 2019: Wind Over the Adriatic Region in CORDEX Climate Change Scenarios. Journal of Geophysical Research: Atmospheres, 124(1), 110–130, doi: 10.1029/2018jd028552.
Ben-Ari, T. et al., 2018: Causes and implications of the unforeseen 2016 extreme yield loss in the breadbasket of France. Nature Communications, 9(1), 1627, doi: 10.1038/s41467-018-04087-x.
Benestad, R. et al., 2017: New vigour involving statisticians to overcome ensemble fatigue. Nature Climate Change, 7(10), 697–703, doi: 10.1038/nclimate3393.
Beniston, M. and M. Stoffel, 2014: Assessing the impacts of climatic change on mountain water resources. Science of The Total Environment, 493, 1129–1137, doi: 10.1016/j.scitotenv.2013.11.122.
Beniston, M. et al., 2018: The European mountain cryosphere: a review of its current state, trends, and future challenges. The Cryosphere, 12(2), 759–794, doi: 10.5194/tc-12-759-2018.
Bennett, G.L. et al., 2016: Historic drought puts the brakes on earthflows in Northern California. Geophysical Research Letters, 43(11), 5725–5731, doi: 10.1002/2016gl068378.
Benson, B.J. et al., 2012: Extreme events, trends, and variability in Northern Hemisphere lake-ice phenology (1855–2005). Climatic Change, 112(2), 299–323, doi: 10.1007/s10584-011-0212-8.
Berghuijs, W.R., R.A. Woods, and M. Hrachowitz, 2014: A precipitation shift from snow towards rain leads to a decrease in streamflow. Nature Climate Change, 4(7), 583–586, doi: 10.1038/nclimate2246.
Bessembinder, J. et al., 2019: Need for a common typology of climate services. Climate Services, 16, 100135, doi: 10.1016/j.cliser.2019.100135.
Bessette-Kirton, E.K. et al., 2019: Landslides Triggered by Hurricane Maria: Assessment of an Extreme Event in Puerto Rico. GSA Today, 29(6), 4–10, doi: 10.1130/gsatg383a.1.
Betts, R.A. et al., 2015: Climate and land use change impacts on global terrestrial ecosystems and river flows in the HadGEM2-ES Earth system model using the representative concentration pathways. Biogeosciences, 12(5), 1317–1338, doi: 10.5194/bg-12-1317-2015.
Betts, R.A. et al., 2018: Changes in climate extremes, fresh water availability and vulnerability to food insecurity projected at 1.5°C and 2°C global warming with a higher-resolution global climate model. Philosophical Transactions of the Royal Society A: Mathematical, Physical and Engineering Sciences, 376(2119), 20160452, doi: 10.1098/rsta.2016.0452.
Betzold, C., 2015: Adapting to climate change in small island developing states. Climatic Change, 133(3), 481–489, doi: 10.1007/s10584-015-1408-0.
Bevacqua, E. et al., 2019: Higher probability of compound flooding from precipitation and storm surge in Europe under anthropogenic climate change. Science Advances, 5(9), eaaw5531, doi: 10.1126/sciadv.aaw5531.
Bezerra, B.G., L.L. Silva, C.M. Santos e Silva, and G.G. de Carvalho, 2019: Changes of precipitation extremes indices in São Francisco River Basin, Brazil from 1947 to 2012. Theoretical and Applied Climatology, 135(1–2), 565–576, doi: 10.1007/s00704-018-2396-6.
Bhardwaj, A. et al., 2018: Downscaling future climate change projections over Puerto Rico using a non-hydrostatic atmospheric model. Climatic Change, 147(1–2), 133–147, doi: 10.1007/s10584-017-2130-x.
Bhatia, K.T. et al., 2019: Recent increases in tropical cyclone intensification rates. Nature Communications, 10(1), 635, doi: 10.1038/s41467-019-08471-z.
Bhattachan, A. et al., 2018: Evaluating the effects of land-use change and future climate change on vulnerability of coastal landscapes to saltwater intrusion. Elementa: Science of the Anthropocene, 6(62), doi: 10.1525/elementa.316.
Bichet, A., M. Wild, D. Folini, and C. Schär, 2012: Causes for decadal variations of wind speed over land: Sensitivity studies with a global climate model. Geophysical Research Letters, 39(11), L11701, doi: 10.1029/2012gl051685.
Bigg, G.R. et al., 2018: A model for assessing iceberg hazard. Natural Hazards, 92(2), 1113–1136, doi: 10.1007/s11069-018-3243-x.
Bilbao, R.A.F., J.M. Gregory, and N. Bouttes, 2015: Analysis of the regional pattern of sea level change due to ocean dynamics and density change for 1993–2099 in observations and CMIP5 AOGCMs. Climate Dynamics, 45(9), 2647–2666, doi: 10.1007/s00382-015-2499-z.
Bilskie, M. et al., 2016: Dynamic simulation and numerical analysis of hurricane storm surge under sea level rise with geomorphologic changes along the northern Gulf of Mexico. Earth’s Future, 4(5), 177–193, doi: 10.1002/2015ef000347.
Bindoff, N. et al., 2019: Changing Ocean, Marine Ecosystems, and Dependent Communities. In: IPCC Special Report on the Ocean and Cryosphere in a Changing Climate[Pörtner, H.-O., D.C. Roberts, V. Masson-Delmotte, P. Zhai, M. Tignor, E. Poloczanska, K. Mintenbeck, A. Alegría, M. Nicolai, A. Okem, J. Petzold, B. Rama, and N.M. Weyer (eds.)]. In Press, pp. 447–588, www.ipcc.ch/srocc/chapter/chapter-5.
Bintanja, R. and O. Andry, 2017: Towards a rain-dominated Arctic. Nature Climate Change, 7(4), 263–267, doi: 10.1038/nclimate3240.
Bintanja, R., C. Severijns, R. Haarsma, and W. Hazeleger, 2014: The future of Antarctica’s surface winds simulated by a high-resolution global climate model: 2. Drivers of 21st century changes. Journal of Geophysical Research: Atmospheres, 119(12), 7160–7178, doi: 10.1002/2013jd020848.
Biribo, N. and C.D. Woodroffe, 2013: Historical area and shoreline change of reef islands around Tarawa Atoll, Kiribati. Sustainability Science, 8(3), 345–362, doi: 10.1007/s11625-013-0210-z.
Birkmann, J. et al., 2014: Cross-chapter box on a selection of the hazards, key vulnerabilities, key risks, and emergent risks identified in the WGII contribution to the fifth assessment report. In: Climate Change 2014: Impacts, Adaptation, and Vulnerability. Part A: Global and Sectoral Aspects. Contribution of Working Group II to the Fifth Assessment Report of the Intergovernmental Panel on Climate Change[Field, C.B., V.R. Barros, D.J. Dokken, K.J. Mach, M.D. Mastrandrea, T.E. Bilir, M. Chatterjee, K.L. Ebi, Y.O. Estrada, R.C. Genova, B. Girma, E.S. Kissel, A.N. Levy, S. MacCracken, P.R. Mastrandrea, and L.L. White (eds.)]. Cambridge University Press, Cambridge, United Kingdom and New York, NY, USA, pp. 113–121, doi: 10.1017/cbo9781107415379.005.
Bisbis, M.B., N. Gruda, and M. Blanke, 2018: Potential impacts of climate change on vegetable production and product quality – A review. Journal of Cleaner Production, 170, 1602–1620, doi: 10.1016/j.jclepro.2017.09.224.
Bisht, D.S., V. Sridhar, A. Mishra, C. Chatterjee, and N.S. Raghuwanshi, 2019: Drought characterization over India under projected climate scenario. International Journal of Climatology, 39(4), 1889–1911, doi: 10.1002/joc.5922.
Biskaborn, B.K. et al., 2019: Permafrost is warming at a global scale. Nature Communications, 10(1), 264, doi: 10.1038/s41467-018-08240-4.
Blackport, R., J.A. Screen, K. van der Wiel, and R. Bintanja, 2019: Minimal influence of reduced Arctic sea ice on coincident cold winters in mid-latitudes. Nature Climate Change, 9, 697–704, doi: 10.1038/s41558-019-0551-4.
Blanford, J.I. et al., 2013: Implications of temperature variation for malaria parasite development across Africa. Scientific Reports, 3, 1300, doi: 10.1038/srep01300.
Blöschl, G. et al., 2019: Changing climate both increases and decreases European river floods. Nature, 573(7772), 108–111, doi: 10.1038/s41586-019-1495-6.
Boé, J., 2016: Modulation of the summer hydrological cycle evolution over western Europe by anthropogenic aerosols and soil–atmosphere interactions. Geophysical Research Letters, 43(14), 7678–7685, doi: 10.1002/2016gl069394.
Boé, J., S. Somot, L. Corre, and P. Nabat, 2020: Large discrepancies in summer climate change over Europe as projected by global and regional climate models: causes and consequences. Climate Dynamics, 54(5–6), 2981–3002, doi: 10.1007/s00382-020-05153-1.
Boisier, J.P., P. Ciais, A. Ducharne, and M. Guimberteau, 2015: Projected strengthening of Amazonian dry season by constrained climate model simulations. Nature Climate Change, 5(7), 656–660, doi: 10.1038/nclimate2658.
Boisier, J.P. et al., 2018: Anthropogenic drying in central-southern Chile evidenced by long-term observations and climate model simulations. Elementa: Science of the Anthropocene, 6(1), 74, doi: 10.1525/elementa.328.
Bojinski, S. et al., 2014: The Concept of Essential Climate Variables in Support of Climate Research, Applications, and Policy. Bulletin of the American Meteorological Society, 95(9), 1431–1443, doi: 10.1175/bams-d-13-00047.1.
Bolch, T. et al., 2019: Status and Change of the Cryosphere in the Extended Hindu Kush Himalaya Region. In: The Hindu Kush Himalaya Assessment: Mountains, Climate Change, Sustainability and People[Wester, P., A. Mishra, A. Mukherji, and A.B. Shrestha (eds.)]. Springer, Cham, Switzerland, pp. 209–255, doi: 10.1007/978-3-319-92288-1_7.
BOM and CSIRO, 2011: Climate Change in the Pacific: Scientific Assessment and New Research. Volume 1: Regional Overview. Volume 2: Country Reports. Australian Bureau of Meteorology (BoM) and Commonwealth Scientific and Industrial Research Organisation (CSIRO), 257 pp., w ww.pacificclimatechangescience.org/publications/reports/report-climate-change-in-the-pacific-scientific-assessment-and-new-research/.
BOM and CSIRO, 2014: Climate Variability, Extremes and Change in the Western Tropical Pacific: New Science and Updated Country Reports. Pacific-Australia Climate Change Science and Adaptation Planning Program Technical Report, Australian Bureau of Meteorology (BoM) and Commonwealth Scientific and Industrial Research Organisation (CSIRO), Melbourne, Australia, 372 pp., www.pacificclimatechangescience.org/publications/reports/climate-variability-extremes-and-change-in-the-western-tropical-pacific-2014/.
Bon de Sousa, L., C. Loureiro, and O. Ferreira, 2018: Morphological and economic impacts of rising sea levels on cliff-backed platform beaches in southern Portugal. Applied Geography, 99, 31–43, doi: 10.1016/j.apgeog.2018.07.023.
Bonsal, B.R., D.L. Peters, F. Seglenieks, A. Rivera, and A. Berg, 2019: Changes in freshwater availability across Canada, Chapter 6. In: Canada’s Changing Climate Report[Bush, E. and D.S. Lemmen (eds.)]. Government of Canada, Ottawa, ON, Canada, pp. 261–342, www.nrcan.gc.ca/sites/www.nrcan.gc.ca/files/energy/Climate-change/pdf/CCCR-Chapter6-ChangesInFreshwaterAvailabilityAcrossCanada.pdf .
Borges, P.A., C. Bernhofer, and R. Rodrigues, 2018: Extreme rainfall indices in Distrito Federal, Brazil: Trends and links with El Niño southern oscillation and Madden–Julian oscillation. International Journal of Climatology, 38(12), 4550–4567, doi: 10.1002/joc.5686.
Borges de Amorim, P. and P.B. Chaffe, 2019: Towards a comprehensive characterization of evidence in synthesis assessments: the climate change impacts on the Brazilian water resources. Climatic Change, 155(1), 37–57, doi: 10.1007/s10584-019-02430-9.
Botai, C., J. Botai, J. de Wit, K. Ncongwane, and A. Adeola, 2017: Drought Characteristics over the Western Cape Province, South Africa. Water, 9(11), 876, doi: 10.3390/w9110876.
Bowden, J.H. et al., 2021: High-resolution dynamically downscaled rainfall and temperature projections for ecological life zones within Puerto Rico and for the U.S. Virgin Islands. International Journal of Climatology, 41(2), 1305–1327, doi: 10.1002/joc.6810.
Box, J.E. et al., 2019: Key indicators of Arctic climate change: 1971–2017. Environmental Research Letters, 14(4), 045010, doi: 10.1088/1748-9326/aafc1b.
Bozkurt, D., M. Rojas, J.P. Boisier, and J. Valdivieso, 2018: Projected hydroclimate changes over Andean basins in central Chile from downscaled CMIP5 models under the low and high emission scenarios. Climatic Change, 150(3–4), 131–147, doi: 10.1007/s10584-018-2246-7.
Bragança, R. et al., 2016: Impactos das mudanças climáticas no zoneamento agroclimatológico do café arábica no Espírito Santo. Revista Agro@mbiente On-line, 10(1), 77, doi: 10.18227/1982-8470ragro.v10i1.2809.
Brahney, J., A.P. Ballantyne, C. Sievers, and J.C. Neff, 2013: Increasing Ca2+deposition in the western US: The role of mineral aerosols. Aeolian Research, 10, 77–87, doi: 10.1016/j.aeolia.2013.04.003.
Brander, K., K. Cochrane, M. Barange, and D. Soto, 2017: Climate Change Implications for Fisheries and Aquaculture. In: Climate Change Impacts on Fisheries and Aquaculture: A Global Analysis, I[Phillips, B.F. and M. Pérez-Ramírez (eds.)]. John Wiley & Sons, Ltd, Chichester, UK, pp. 45–62, doi: 10.1002/9781119154051.ch3.
Brando, P.M. et al., 2014: Abrupt increases in Amazonian tree mortality due to drought-fire interactions. Proceedings of the National Academy of Sciences, 111(17), 6347–6352, doi: 10.1073/pnas.1305499111.
Brando, P.M. et al., 2019: Droughts, Wildfires, and Forest Carbon Cycling: A Pantropical Synthesis. Annual Review of Earth and Planetary Sciences, 47(1), 555–581, doi: 10.1146/annurev-earth-082517-010235.
Brasseur, G.P. and L. Gallardo, 2016: Climate services: Lessons learned and future prospects. Earth’s Future, 4(3), 79–89, doi: 10.1002/2015ef000338.
Breitburg, D. et al., 2018: Declining oxygen in the global ocean and coastal waters. Science, 359(6371), eaam7240, doi: 10.1126/science.aam7240.
Bremer, S. et al., 2019: Toward a multi-faceted conception of co-production of climate services. Climate Services, 13, 42–50, doi: 10.1016/j.cliser.2019.01.003.
Brewington, L., V. Keener, and A. Mair, 2019: Simulating Land Cover Change Impacts on Groundwater Recharge under Selected Climate Projections, Maui, Hawai‘i. Remote Sensing, 11(24), 3048, doi: 10.3390/rs11243048.
Briley, L., D. Brown, and S.E. Kalafatis, 2015: Overcoming barriers during the co-production of climate information for decision-making. Climate Risk Management, 9, 41–49, doi: 10.1016/j.crm.2015.04.004.
Brimelow, J.C., W.R. Burrows, and J.M. Hanesiak, 2017: The changing hail threat over North America in response to anthropogenic climate change. Nature Climate Change, 7(7), 516–522, doi: 10.1038/nclimate3321.
Bring, A. et al., 2016: Arctic terrestrial hydrology: A synthesis of processes, regional effects, and research challenges. Journal of Geophysical Research: Biogeosciences, 121(3), 621–649, doi: 10.1002/2015jg003131.
Broeckx, J. et al., 2020: Landslide mobilization rates: A global analysis and model. Earth-Science Reviews, 201, 102972, doi: 10.1016/j.earscirev.2019.102972.
Bromirski, P.D., D.R. Cayan, J. Helly, and P. Wittmann, 2013: Wave power variability and trends across the North Pacific. Journal of Geophysical Research: Oceans, 118(12), 6329–6348, doi: 10.1002/2013jc009189.
Brönnimann, S. et al., 2018: Changing seasonality of moderate and extreme precipitation events in the Alps. Natural Hazards and Earth System Sciences, 18(7), 2047–2056, doi: 10.5194/nhess-18-2047-2018.
Brooks, H.E., 2013: Severe thunderstorms and climate change. Atmospheric Research, 123, 129–138, doi: 10.1016/j.atmosres.2012.04.002.
Brooks, H.E., G.W. Carbin, and P.T. Marsh, 2014: Increased variability of tornado occurrence in the United States. Science, 346(6207), 349–52, doi: 10.1126/science.1257460.
Brooks, M.S., 2013: Accelerating Innovation in Climate Services: The 3 E’s for Climate Service Providers. Bulletin of the American Meteorological Society, 94(6), 807–819, doi: 10.1175/bams-d-12-00087.1.
Brouillet, A. and S. Joussaume, 2019: Investigating the Role of the Relative Humidity in the Co-Occurrence of Temperature and Heat Stress Extremes in CMIP5 Projections. Geophysical Research Letters, 46(20), 11435–11443, doi: 10.1029/2019gl084156.
Brown, R.D., B. Fang, and L. Mudryk, 2019: Update of Canadian Historical Snow Survey Data and Analysis of Snow Water Equivalent Trends, 1967–2016. Atmosphere-Ocean, 57(2), 149–156, doi: 10.1080/07055900.2019.1598843.
Brown, S. et al., 2018: Quantifying Land and People Exposed to Sea-Level Rise with No Mitigation and 1.5°C and 2.0°C Rise in Global Temperatures to Year 2300. Earth’s Future, 6(3), 583–600, doi: 10.1002/2017ef000738.
Brunetti, M.T. et al., 2010: Rainfall thresholds for the possible occurrence of landslides in Italy. Natural Hazards and Earth System Sciences, 10(3), 447–458, doi: 10.5194/nhess-10-447-2010.
Brunner, L., N. Schaller, J. Anstey, J. Sillmann, and A.K. Steiner, 2018: Dependence of Present and Future European Temperature Extremes on the Location of Atmospheric Blocking. Geophysical Research Letters, 45(12), 6311– 6320, doi: 10.1029/2018gl077837.
Bruno, J.F. et al., 2018: Climate change threatens the world’s marine protected areas. Nature Climate Change, 8(6), 499–503, doi: 10.1038/s41558-018-0149-2.
Bruno Soares, M., 2017: Assessing the usability and potential value of seasonal climate forecasts in land management decisions in the southwest UK: challenges and reflections. Advances in Science and Research, 14, 175–180, doi: 10.5194/asr-14-175-2017.
Bruno Soares, M. and S. Dessai, 2016: Barriers and enablers to the use of seasonal climate forecasts amongst organisations in Europe. Climatic Change, 137(1), 89–103, doi: 10.1007/s10584-016-1671-8.
Bruno Soares, M. and C. Buontempo, 2019: Challenges to the sustainability of climate services in Europe. WIREs Climate Change, 10(4), e587, doi: 10.1002/wcc.587.
Bruno Soares, M., M. Alexander, and S. Dessai, 2018a: Sectoral use of climate information in Europe: A synoptic overview. Climate Services, 9, 5–20, doi: 10.1016/j.cliser.2017.06.001.
Bruno Soares, M., M. Daly, and S. Dessai, 2018b: Assessing the value of seasonal climate forecasts for decision-making. WIREs Climate Change, 9(4), e523, doi: 10.1002/wcc.523.
Bukovsky, M.S. and L.O. Mearns, 2020: Regional climate change projections from NA-CORDEX and their relation to climate sensitivity. Climatic Change, 162(2), 645–665, doi: 10.1007/s10584-020-02835-x.
Bullock, J.M. et al., 2012: Modelling spread of British wind-dispersed plants under future wind speeds in a changing climate. Journal of Ecology, 100(1), 104–115, doi: 10.1111/j.1365-2745.2011.01910.x.
Buontempo, C. and C. Hewitt, 2018: EUPORIAS and the development of climate services. Climate Services, 9, 1–4, doi: 10.1016/j.cliser.2017.06.011.
Buontempo, C., C.D. Hewitt, F.J. Doblas-Reyes, and S. Dessai, 2014: Climate service development, delivery and use in Europe at monthly to inter-annual timescales. Climate Risk Management, 6, 1–5, doi: 10.1016/j.crm.2014.10.002.
Buontempo, C. et al., 2018: What have we learnt from EUPORIAS climate service prototypes?Climate Services, 9, 21–32, doi: 10.1016/j.cliser.2017.06.003.
Buontempo, C. et al., 2020: Fostering the development of climate services through Copernicus Climate Change Service (C3S) for agriculture applications. Weather and Climate Extremes, 27, 100226, doi: 10.1016/j.wace.2019.100226.
Burcea, S., R. Cică, and R. Bojariu, 2016: Hail Climatology and Trends in Romania: 1961–2014. Monthly Weather Review, 144(11), 4289–4299, doi: 10.1175/mwr-d-16-0126.1.
Burkart, K. et al., 2011: The effect of atmospheric thermal conditions and urban thermal pollution on all-cause and cardiovascular mortality in Bangladesh. Environmental Pollution, 159(8), 2035–2043, doi: 10.1016/j.envpol.2011.02.005.
Burkett, V., 2011: Global climate change implications for coastal and offshore oil and gas development. Energy Policy, 39(12), 7719–7725, doi: 10.1016/j.enpol.2011.09.016.
Burls, N.J. et al., 2019: The Cape Town “Day Zero” drought and Hadley cell expansion. npj Climate and Atmospheric Science, 2(1), 1–8, doi: 10.1038/s41612-019-0084-6.
Burn, D.H. and P.H. Whitfield, 2016: Changes in floods and flood regimes in Canada. Canadian Water Resources Journal, 41(1–2), 139–150, doi: 10.1080/07011784.2015.1026844.
Burrows, M.T. et al., 2014: Geographical limits to species-range shifts are suggested by climate velocity. Nature, 507(7493), 492–495, doi: 10.1038/nature12976.
Bush, E. and D.S. Lemmen (eds.), 2019: Canada’s Changing Climate Report. Government of Canada, Ottawa, ON, Canada, 444 pp., https://changingclimate.ca/CCCR2019.
Byers, E. et al., 2018: Global exposure and vulnerability to multi-sector development and climate change hotspots. Environmental Research Letters, 13(5), 055012, doi: 10.1088/1748-9326/aabf45.
Cabré, M.F., S. Solman, and M. Núñez, 2016: Regional climate change scenarios over southern South America for future climate (2080–2099) using the MM5 Model. Mean, interannual variability and uncertainties. Atmósfera, 29(1), 35–60, doi: 10.20937/atm.2016.29.01.04.
Cai, W.-J. et al., 2017: Redox reactions and weak buffering capacity lead to acidification in the Chesapeake Bay. Nature Communications, 8(1), 369, doi: 10.1038/s41467-017-00417-7.
Cai, Y., C.-Q. Ke, G. Yao, and X. Shen, 2020: MODIS-observed variations of lake ice phenology in Xinjiang, China. Climatic Change, 158(3), 575–592, doi: 10.1007/s10584-019-02623-2.
Cai, Y. et al., 2019: Variations of Lake Ice Phenology on the Tibetan Plateau From 2001 to 2017 Based on MODIS Data. Journal of Geophysical Research: Atmospheres, 124(2), 825–843, doi: 10.1029/2018jd028993.
Callaghan, J. and S.B. Power, 2011: Variability and decline in the number of severe tropical cyclones making land-fall over eastern Australia since the late nineteenth century. Climate Dynamics, 37(3–4), 647–662, doi: 10.1007/s00382-010-0883-2.
Caminade, C. et al., 2012: Suitability of European climate for the Asian tiger mosquito Aedes albopictus: recent trends and future scenarios. Journal of The Royal Society Interface, 9(75), 2708–2717, doi: 10.1098/rsif.2012.0138.
Caminade, C. et al., 2014: Impact of climate change on global malaria distribution. Proceedings of the National Academy of Sciences, 111(9), 3286–3291, doi: 10.1073/pnas.1302089111.
Cammarano, D. et al., 2016: Uncertainty of wheat water use: Simulated patterns and sensitivity to temperature and CO2. Field Crops Research, 198, 80–92, doi: 10.1016/j.fcr.2016.08.015.
Camus, P. et al., 2017: Statistical wave climate projections for coastal impact assessments. Earth’s Future, 5(9), 918–933, doi: 10.1002/2017ef000609.
Carey, M., C. Huggel, J. Bury, C. Portocarrero, and W. Haeberli, 2012: An integrated socio-environmental framework for glacier hazard management and climate change adaptation: lessons from Lake 513, Cordillera Blanca, Peru. Climatic Change, 112(3–4), 733–767, doi: 10.1007/s10584-011-0249-8.
Carey-Smith, T., S. Deana, J. Vialb, and C. Thompsona, 2010: Changes in precipitation extremes for New Zealand: climate model predictions. Weather and Climate, 30, 23–48, doi: 10.2307/26169712.
Carmona, A.M. and G. Poveda, 2014: Detection of long-term trends in monthly hydro-climatic series of Colombia through Empirical Mode Decomposition. Climatic Change, 123(2), 301–313, doi: 10.1007/s10584-013-1046-3.
Carrão, H., G. Naumann, and P. Barbosa, 2018: Global projections of drought hazard in a warming climate: a prime for disaster risk management. Climate Dynamics, 50(5–6), 2137–2155, doi: 10.1007/s00382-017-3740-8.
Carrasco, A.R., O. Ferreira, and D. Roelvink, 2016: Coastal lagoons and rising sea level: A review. Earth-Science Reviews, 154, 356–368, doi: 10.1016/j.earscirev.2015.11.007.
Carrivick, J.L. and F.S. Tweed, 2016: A global assessment of the societal impacts of glacier outburst floods. Global and Planetary Change, 144, 1–16, doi: 10.1016/j.gloplacha.2016.07.001.
Casas-Prat, M. and X.L. Wang, 2020: Projections of extreme ocean waves in the Arctic and potential implications for coastal inundation and erosion. Journal of Geophysical Research: Oceans, 125(8), e2019JC015745, doi: 10.1029/2019jc015745.
Cassou, C. and J. Cattiaux, 2016: Disruption of the European climate seasonal clock in a warming world. Nature Climate Change, 6(6), 589–594, doi: 10.1038/nclimate2969.
Castebrunet, H., N. Eckert, G. Giraud, Y. Durand, and S. Morin, 2014: Projected changes of snow conditions and avalanche activity in a warming climate: the French Alps over the 2020–2050 and 2070–2100 periods. The Cryosphere, 8(5), 1673–1697, doi: 10.5194/tc-8-1673-2014.
Catto, J.L., C. Jakob, and N. Nicholls, 2012: The influence of changes in synoptic regimes on north Australian wet season rainfall trends. Journal of Geophysical Research: Atmospheres, 117, D10102, doi: 10.1029/2012jd017472.
Cavanaugh, K.C. et al., 2014: Poleward expansion of mangroves is a threshold response to decreased frequency of extreme cold events. Proceedings of the National Academy of Sciences, 111(2), 723–727, doi: 10.1073/pnas.1315800111.
Cavelier, R. et al., 2017: Conditions for a market uptake of climate services for adaptation in France. Climate Services, 6, 34–40, doi: 10.1016/j.cliser.2017.06.010.
Cavicchia, L., H. von Storch, and S. Gualdi, 2014: Mediterranean Tropical-Like Cyclones in Present and Future Climate. Journal of Climate, 27(19), 7493–7501, doi: 10.1175/jcli-d-14-00339.1.
Cha, E.J., T.R. Knutson, T.-C. Lee, M. Ying, and T. Nakaegawa, 2020: Third assessment on impacts of climate change on tropical cyclones in the Typhoon Committee Region – Part II: Future projections. Tropical Cyclone Research and Review, 9(2), 75–86, doi: 10.1016/j.tcrr.2020.04.005.
Chadwick, C., J. Gironás, S. Vicuña, and F. Meza, 2019: Estimating the Local Time of Emergence of Climatic Variables Using an Unbiased Mapping of GCMs: An Application in Semiarid and Mediterranean Chile. Journal of Hydrometeorology, 20(8), 1635–1647, doi: 10.1175/jhm-d-19-0006.1.
Chagas, V.B.P. and P.L.B. Chaffe, 2018: The Role of Land Cover in the Propagation of Rainfall Into Streamflow Trends. Water Resources Research, 54(9), 5986–6004, doi: 10.1029/2018wr022947.
Challinor, A.J. et al., 2014: A meta-analysis of crop yield under climate change and adaptation. Nature Climate Change, 4(4), 287–291, doi: 10.1038/nclimate2153.
Chan, F. et al., 2008: Emergence of Anoxia in the California Current Large Marine Ecosystem. Science, 319(5865), 920–920, doi: 10.1126/science.1149016.
Chan, F.K.S., G. Mitchell, O. Adekola, and A. McDonald, 2012: Flood Risk in Asia’s Urban Mega-deltas: Drivers, Impacts and Response. Environment and Urbanization ASIA, 3(1), 41–61, doi: 10.1177/097542531200300103.
Chan, F.K.S., C.J. Chuah, A.D. Ziegler, M. Dąbrowski, and O. Varis, 2018: Towards resilient flood risk management for Asian coastal cities: Lessons learned from Hong Kong and Singapore. Journal of Cleaner Production, 187, 576–589, doi: 10.1016/j.jclepro.2018.03.217.
Chand, S.S., K.J. Tory, H. Ye, and K.J.E. Walsh, 2017: Projected increase in El Niño-driven tropical cyclone frequency in the Pacific. Nature Climate Change, 7(2), 123–127, doi: 10.1038/nclimate3181.
Chang, E.K.M., 2017: Projected Significant Increase in the Number of Extreme Extratropical Cyclones in the Southern Hemisphere. Journal of Climate, 30(13), 4915–4935, doi: 10.1175/jcli-d-16-0553.1.
Changnon, D., 2018: A Spatial and Temporal Analysis of 30-Day Heavy Snowfall Amounts in the Eastern United States, 1900–2016. Journal of Applied Meteorology and Climatology, 57(2), 319–331, doi: 10.1175/jamc-d-17-0217.1.
Chapman, L., J.A. Azevedo, and T. Prieto-Lopez, 2013: Urban heat & critical infrastructure networks: A viewpoint. Urban Climate, 3, 7–12, doi: 10.1016/j.uclim.2013.04.001.
Chapra, S.C. et al., 2017: Climate Change Impacts on Harmful Algal Blooms in U.S. Freshwaters: A Screening-Level Assessment. Environmental Science & Technology, 51(16), 8933–8943, doi: 10.1021/acs.est.7b01498.
Cheal, A.J., M.A. MacNeil, M.J. Emslie, and H. Sweatman, 2017: The threat to coral reefs from more intense cyclones under climate change. Global Change Biology, 23(4), 1511–1524, doi: 10.1111/gcb.13593.
Chen, A.-A., N.-L. Wang, Z.-M. Guo, Y.-W. Wu, and H.-B. Wu, 2018: Glacier variations and rising temperature in the Mt. Kenya since the Last Glacial Maximum. Journal of Mountain Science, 15(6), 1268–1282, doi: 10.1007/s11629-017-4600-z.
Chen, C.-W. et al., 2019: Assessing landslide characteristics in a changing climate in northern Taiwan. CATENA, 175, 263–277, doi: 10.1016/j.catena.2018.12.023.
Chen, L., 2020: Impacts of climate change on wind resources over North America based on NA-CORDEX. Renewable Energy, 153, 1428–1438, doi: 10.1016/j.renene.2020.02.090.
Chen, L., 2021: Uncertainties in solar radiation assessment in the United States using climate models. Climate Dynamics, 56(1), 665–678, doi: 10.1007/s00382-020-05498-7.
Chen, W. et al., 2016: Influence of sea level rise on saline water intrusion in the Yangtze River Estuary, China. Applied Ocean Research, 54, 12–25, doi: 10.1016/j.apor.2015.11.002.
Chen, X., G. Tian, Z. Qin, and X. Bi, 2019: High Daytime and Nighttime Temperatures Exert Large and Opposing Impacts on Winter Wheat Yield in China. Weather, Climate, and Society, 11(4), 777–790, doi: 10.1175/wcas-d-19-0026.1.
Chen, Z. et al., 2020: Global Land Monsoon Precipitation Changes in CMIP6 Projections. Geophysical Research Letters, 47(14), e2019GL086902, doi: 10.1029/2019gl086902.
Cheng, J. et al., 2018: Heatwave and elderly mortality: An evaluation of death burden and health costs considering short-term mortality displacement. Environment International, 115, 334–342, doi: 10.1016/j.envint.2018.03.041.
Cheng, L. and A. AghaKouchak, 2015: Nonstationary Precipitation Intensity–Duration–Frequency Curves for Infrastructure Design in a Changing Climate. Scientific Reports, 4(1), 7093, doi: 10.1038/srep07093.
Cheong, W.K. et al., 2018: Observed and modelled temperature and precipitation extremes over Southeast Asia from 1972 to 2010. International Journal of Climatology, 38(7), 3013–3027, doi: 10.1002/joc.5479.
Chernokulsky, A. et al., 2019: Observed changes in convective and stratiform precipitation in Northern Eurasia over the last five decades. Environmental Research Letters, 14(4), 045001, doi: 10.1088/1748-9326/aafb82.
Cheung, W.W.L. and T.L. Frölicher, 2020: Marine heatwaves exacerbate climate change impacts for fisheries in the northeast Pacific. Scientific Reports, 10(1), 6678, doi: 10.1038/s41598-020-63650-z.
Chhetri, B.K. et al., 2019: Projected local rain events due to climate change and the impacts on waterborne diseases in Vancouver, British Columbia, Canada. Environmental Health, 18(1), 116, doi: 10.1186/s12940-019-0550-y.
Chiew, F.H.S. et al., 2017: Future runoff projections for Australia and science challenges in producing next generation projections. In: MODSIM2017, 22nd International Congress on Modelling and Simulation[Syme, G., D.H. MacDonald, B. Fulton, and J. Piantadosi (eds.)]. Modelling and Simulation Society of Australia and New Zealand, Hobart, TAS, Australia, 1745–1751 pp., www.mssanz.org.au/modsim2017/L16/chiew.pdf .
Chinowsky, P. and C. Arndt, 2012: Climate Change and Roads: A Dynamic Stressor-Response Model. Review of Development Economics, 16(3), 448–462, doi: 10.1111/j.1467-9361.2012.00673.x.
Chinowsky, P., J. Helman, S. Gulati, J. Neumann, and J. Martinich, 2019: Impacts of climate change on operation of the US rail network. Transport Policy, 75, 183–191, doi: 10.1016/j.tranpol.2017.05.007.
Cho, C., R. Li, S.Y. Wang, J.-H. Yoon, and R.R. Gillies, 2016: Anthropogenic footprint of climate change in the June 2013 northern India flood. Climate Dynamics, 46(3–4), 797–805, doi: 10.1007/s00382-015-2613-2.
Choi, W., C.-H. Ho, J. Kim, and J.C.L. Chan, 2019: Near-future tropical cyclone predictions in the western North Pacific: fewer tropical storms but more typhoons. Climate Dynamics, 53(3–4), 1341–1356, doi: 10.1007/s00382-019-04647-x.
Chou, S.C. et al., 2014: Assessment of Climate Change over South America under RCP 4.5 and 8.5 Downscaling Scenarios. American Journal of Climate Change, 3(5), 512–527, doi: 10.4236/ajcc.2014.35043.
Chow, W.T.L., S.N.A.B.A. Akbar, S.L. Heng, and M. Roth, 2016: Assessment of measured and perceived microclimates within a tropical urban forest. Urban Forestry & Urban Greening, 16, 62–75, doi: 10.1016/j.ufug.2016.01.010.
Christel, I. et al., 2018: Introducing design in the development of effective climate services. Climate Services, 9, 111–121, doi: 10.1016/j.cliser.2017.06.002.
Christensen, J.H. et al., 2013: Climate Phenomena and their Relevance for Future Regional Climate Change. In: Climate Change 2013: The Physical Science Basis. Contribution of Working Group I to the Fifth Assessment Report of the Intergovernmental Panel on Climate Change[Stocker, T.F., D. Qin, G.-K. Plattner, M. Tignor, S.K. Allen, J. Boschung, A. Nauels, Y. Xia, V. Bex, and P.M. Midgley (eds.)]. Cambridge University Press, Cambridge, United Kingdom and New York, NY, USA, pp. 1217–1308, doi: 10.1017/cbo9781107415324.028.
Christianson, A.C. and T.K. McGee, 2019: Wildfire evacuation experiences of band members of Whitefish Lake First Nation 459, Alberta, Canada. Natural Hazards, 98(1), 9–29, doi: 10.1007/s11069-018-3556-9.
Chun, J., C. Lim, D. Kim, and J. Kim, 2018: Assessing Impacts of Climate Change and Sea-Level Rise on Seawater Intrusion in a Coastal Aquifer. Water, 10(4), 357, doi: 10.3390/w10040357.
Ciabatta, L. et al., 2016: Assessing the impact of climate-change scenarios on landslide occurrence in Umbria Region, Italy. Journal of Hydrology, 541, 285–295, doi: 10.1016/j.jhydrol.2016.02.007.
Ciais, P. et al., 2005: Europe-wide reduction in primary productivity caused by the heat and drought in 2003. Nature, 437(7058), 529–533, doi: 10.1038/nature03972.
Cinco, T.A. et al., 2016: Observed trends and impacts of tropical cyclones in the Philippines. International Journal of Climatology, 36(14), 4638–4650, doi: 10.1002/joc.4659.
Clarke, H. et al., 2019: Climate change effects on the frequency, seasonality and interannual variability of suitable prescribed burning weather conditions in south-eastern Australia. Agricultural and Forest Meteorology, 271, 148–157, doi: 10.1016/j.agrformet.2019.03.005.
Clarke, L. et al., 2018: Sector Interactions, Multiple Stressors, and Complex Systems. In: Impacts, Risks, and Adaptation in the United States: Fourth National Climate Assessment, Volume II[Reidmiller, D.R., C.W. Avery, D.R. Easterling, K.E. Kunkel, K.L.M. Lewis, T.K. Maycock, and B.C. Stewart (eds.)]. U.S. Global Change Research Program, Washington, DC, USA, pp. 638–668, doi: 10.7930/nca4.2018.ch17.
Clilverd, H.M., Y.-P. Tsang, D.M. Infante, A.J. Lynch, and A.M. Strauch, 2019: Long-term streamflow trends in Hawai’i and implications for native stream fauna. Hydrological Processes, 33(5), 699–719, doi: 10.1002/hyp.13356.
Cloutier, C., J. Locat, M. Geertsema, M. Jakob, and M. Schnorbus, 2017: Potential impacts of climate change on landslides occurrence in Canada. In: Slope Safety Preparedness for Impact of Climate Change[Ho, K., S. Lacasse, and L. Picarelli (eds.)]. CRC Press, London, UK, pp. 34, doi: 10.1201/9781315387789.
Coe, J.A., 2016: Landslide Hazards and Climate Change: A Perspective from the United States. In: Slope Safety Preparedness for Impact of Climate Change[Ho, K., S. Lacasse, and L. Picarelli (eds.)]. CRC Press, London, UK, pp. 479–523, doi: 10.1201/9781315387789-16.
Coe, J.A., E.K. Bessette-Kirton, and M. Geertsema, 2018: Increasing rock-avalanche size and mobility in Glacier Bay National Park and Preserve, Alaska detected from 1984 to 2016 Landsat imagery. Landslides, 15(3), 393–407, doi: 10.1007/s10346-017-0879-7.
Coffel, E.D., T.R. Thompson, and R.M. Horton, 2017: The impacts of rising temperatures on aircraft takeoff performance. Climatic Change, 144(2), 381–388, doi: 10.1007/s10584-017-2018-9.
Coffel, E.D., R.M. Horton, and A. de Sherbinin, 2018: Temperature and humidity based projections of a rapid rise in global heat stress exposure during the 21st century. Environmental Research Letters, 13(1), 014001, doi: 10.1088/1748-9326/aaa00e.
Cohen, J. et al., 2020: Divergent consensuses on Arctic amplification influence on midlatitude severe winter weather. Nature Climate Change, 10(1), 20–29, doi: 10.1038/s41558-019-0662-y.
Collins, M. et al., 2019: Extremes, Abrupt Changes and Managing Risks. In: IPCC Special Report on the Ocean and Cryosphere in a Changing Climate[Pörtner, H.-O., D.C. Roberts, V. Masson-Delmotte, P. Zhai, M. Tignor, E. Poloczanska, K. Mintenbeck, A. Alegría, M. Nicolai, A. Okem, J. Petzold, B. Rama, and N.M. Weyer (eds.)]. In Press, pp. 3–63, www.ipcc.ch/srocc/chapter/chapter-6.
Colombani, N., A. Osti, G. Volta, and M. Mastrocicco, 2016: Impact of Climate Change on Salinization of Coastal Water Resources. Water Resources Management, 30(7), 2483–2496, doi: 10.1007/s11269-016-1292-z.
Colonia, D. et al., 2017: Compiling an Inventory of Glacier-Bed Overdeepenings and Potential New Lakes in De-Glaciating Areas of the Peruvian Andes: Approach, First Results, and Perspectives for Adaptation to Climate Change. Water, 9(5), 336, doi: 10.3390/w9050336.
Comte, L. and G. Grenouillet, 2013: Do stream fish track climate change? Assessing distribution shifts in recent decades. Ecography, 36(11), 1236–1246, doi: 10.1111/j.1600-0587.2013.00282.x.
Contador, T., J. Kennedy, J. Ojeda, P. Feinsinger, and R. Rozzi, 2014: Ciclos de vida de insectos dulceacuícolas y cambio climático global en la ecorregión subantártica de Magallanes: investigaciones ecológicas a largo plazo en el Parque Etnobotánico Omora, Reserva de Biosfera Cabo de Hornos (55°S). Bosque (Valdivia) , 35(3), 429–437, doi: 10.4067/s0717-92002014000300018.
Contosta, A.R., N.J. Casson, S.J. Nelson, and S. Garlick, 2020: Defining frigid winter illuminates its loss across seasonally snow-covered areas of eastern North America. Environmental Research Letters, 15(3), 034020, doi: 10.1088/1748-9326/ab54f3.
Cook, B.I. et al., 2019: Climate change amplification of natural drought variability: The historic mid-twentieth-century North American drought in a warmer world. Journal of Climate, 32(17), 5417–5436, doi: 10.1175/jcli-d-18-0832.1.
Cook, B.I. et al., 2020: Twenty-First Century Drought Projections in the CMIP6 Forcing Scenarios. Earth’s Future, 8(6), e2019EF001461, doi: 10.1029/2019ef001461.
Cook, L.M., S. McGinnis, and C. Samaras, 2020: The effect of modeling choices on updating intensity–duration–frequency curves and stormwater infrastructure designs for climate change. Climatic Change, 159(2), 289–308, doi: 10.1007/s10584-019-02649-6.
Cook, S.J., I. Kougkoulos, L.A. Edwards, J. Dortch, and D. Hoffmann, 2016: Glacier change and glacial lake outburst flood risk in the Bolivian Andes. The Cryosphere, 10(5), 2399–2413, doi: 10.5194/tc-10-2399-2016.
Cooper, E.J., 2014: Warmer Shorter Winters Disrupt Arctic Terrestrial Ecosystems. Annual Review of Ecology, Evolution, and Systematics, 45(1), 271–295, doi: 10.1146/annurev-ecolsys-120213-091620.
Coopersmith, E.J. et al., 2017: Relating coccidioidomycosis (valley fever) incidence to soil moisture conditions. GeoHealth, 1(1), 51–63, doi: 10.1002/2016gh000033.
Coppola, E., F. Raffaele, and F. Giorgi, 2018: Impact of climate change on snow melt driven runoff timing over the Alpine region. Climate Dynamics, 51(3), 1259–1273, doi: 10.1007/s00382-016-3331-0.
Coppola, E. et al., 2014a: Present and future climatologies in the phase I CREMA experiment. Climatic Change, 125(1), 23–38, doi: 10.1007/s10584-014-1137-9.
Coppola, E. et al., 2014b: Changing hydrological conditions in the Po basin under global warming. Science of The Total Environment, 493, 1183–1196, doi: 10.1016/j.scitotenv.2014.03.003.
Coppola, E. et al., 2021a: Assessment of the European Climate Projections as Simulated by the Large EURO-CORDEX Regional and Global Climate Model Ensemble. Journal of Geophysical Research: Atmospheres, 126(4), e2019JD032356, doi: 10.1029/2019jd032356.
Coppola, E. et al., 2021b: Climate hazard indices projections based on CORDEX-CORE, CMIP5 and CMIP6 ensemble. Climate Dynamics, 57(5–6), 1293–1383, doi: 10.1007/s00382-021-05640-z.
Cortekar, J., M. Themessl, and K. Lamich, 2020: Systematic analysis of EU-based climate service providers. Climate Services, 17, 100125, doi: 10.1016/j.cliser.2019.100125.
Costoya, X., M. de Castro, F. Santos, M.C. Sousa, and M. Gómez-Gesteira, 2019: Projections of wind energy resources in the Caribbean for the 21st century. Energy, 178, 356–367, doi: 10.1016/j.energy.2019.04/121.
Courty, L.G., R.L. Wilby, J.K. Hillier, and L.J. Slater, 2019: Intensity-duration-frequency curves at the global scale. Environmental Research Letters, 14(8), 084045, doi: 10.1088/1748-9326/ab370a.
Cradock-Henry, N.A., 2017: New Zealand kiwifruit growers’ vulnerability to climate and other stressors. Regional Environmental Change, 17(1), 245–259, doi: 10.1007/s10113-016-1000-9.
Craft, C. et al., 2009: Forecasting the effects of accelerated sea-level rise on tidal marsh ecosystem services. Frontiers in Ecology and the Environment, 7(2), 73–78, doi: 10.1890/070219.
Craig, M.T. et al., 2018: A review of the potential impacts of climate change on bulk power system planning and operations in the United States. Renewable and Sustainable Energy Reviews, 98, 255–267, doi: 10.1016/j.rser.2018.09.022.
Crimp, S.J. et al., 2016a: Recent seasonal and long-term changes in southern Australian frost occurrence. Climatic Change, 139(1), 115–128, doi: 10.1007/s10584-016-1763-5.
Crimp, S.J. et al., 2016b: Recent changes in southern Australian frost occurrence: implications for wheat production risk. Crop and Pasture Science, 67(8), 801, doi: 10.1071/cp16056.
Crooks, J.L. et al., 2016: The Association between Dust Storms and Daily Non-Accidental Mortality in the United States, 1993–2005. Environmental Health Perspectives, 124(11), 1735–1743, doi: 10.1289/ehp216.
Crozier, M.J., 2010: Deciphering the effect of climate change on landslide activity: A review. Geomorphology, 124(3–4), 260–267, doi: 10.1016/j.geomorph.2010.04.009.
CSIRO and BOM, 2015: Climate Change in Australia Information for Australia’s Natural Resource Management Regions. Commonwealth Scientific and Industrial Research Organisation (CSIRO) and Bureau of Meteorology (BOM), Australia, 216 pp., doi: 10.4225/08/58518c08c4ce8.
CSIRO and BOM, 2016: State of the Climate 2016. Commonwealth Scientific and Industrial Research Organisation (CSIRO) and Bureau of Meteorology (BOM), Australia, 22 pp., www.bom.gov.au/state-of-the-climate/State-of-the-Climate-2016.pdf .
CSIRO and BOM, 2018: State of the Climate 2018. Commonwealth Scientific and Industrial Research Organisation (CSIRO) and Bureau of Meteorology (BOM), Australia, 24 pp., www.bom.gov.au/state-of-the-climate/State-of-the-Climate-2018.pdf .
CSIRO and BOM, 2020: State of the Climate 2020. Commonwealth Scientific and Industrial Research Organisation (CSIRO) and Bureau of Meteorology (BOM), Australia, 23 pp., www.bom.gov.au/state-of-the-climate/documents/State-of-the-Climate-2020.pdf .
Cullen, N.J. et al., 2013: A century of ice retreat on Kilimanjaro: the mapping reloaded. The Cryosphere, 7(2), 419–431, doi: 10.5194/tc-7-419-2013.
Culwick, C. and Z. Patel, 2017: United and divided responses to complex urban issues: insights on the value of a transdisciplinary approach to flooding risk. Area, 49(1), 43–51, doi: 10.1111/area.12282.
Cunha, A.P.M.A. et al., 2019: Extreme Drought Events over Brazil from 2011 to 2019. Atmosphere, 10(11), 642, doi: 10.3390/atmos10110642.
Ćurić, M. and D. Janc, 2016: Hail climatology in Serbia. International Journal of Climatology, 36(9), 3270–3279, doi: 10.1002/joc.4554.
Cutter, S.L., 2018: Compound, Cascading, or Complex Disasters: What’s in a Name?Environment: Science and Policy for Sustainable Development, 60(6), 16–25, doi: 10.1080/00139157.2018.1517518.
Dahal, N., U. Shrestha, A. Tuitui, and H. Ojha, 2018: Temporal Changes in Precipitation and Temperature and their Implications on the Streamflow of Rosi River, Central Nepal. Climate, 7(1), 3, doi: 10.3390/cli7010003.
Dahl, K.A., M.F. Fitzpatrick, and E. Spanger-Siegfried, 2017a: Sea level rise drives increased tidal flooding frequency at tide gauges along the U.S. East and Gulf Coasts: Projections for 2030 and 2045. PLOS ONE, 12(2), e0170949, doi: 10.1371/journal.pone.0170949.
Dahl, K.A., E. Spanger-Siegfried, A. Caldas, and S. Udvardy, 2017b: Effective inundation of continental United States communities with 21st century sea level rise. Elementa: Science of the Anthropocene, 5, 37, doi: 10.1525/elementa.234.
Dahl, K.A., R. Licker, J.T. Abatzoglou, and J. Declet-Barreto, 2019: Increased frequency of and population exposure to extreme heat index days in the United States during the 21st century. Environmental Research Communications, 1(7), 075002, doi: 10.1088/2515-7620/ab27cf .
Damm, A., W. Greuell, O. Landgren, and F. Prettenthaler, 2017: Impacts of +2°C global warming on winter tourism demand in Europe. Climate Services, 7, 31–46, doi: 10.1016/j.cliser.2016.07.003.
Damm, A., J. Köberl, P. Stegmaier, E. Jiménez Alonso, and A. Harjanne, 2020: The market for climate services in the tourism sector – An analysis of Austrian stakeholders’ perceptions. Climate Services, 17, 100094, doi: 10.1016/j.cliser.2019.02.001.
Danco, J.F., A.M. DeAngelis, B.K. Raney, and A.J. Broccoli, 2016: Effects of a Warming Climate on Daily Snowfall Events in the Northern Hemisphere. Journal of Climate, 29(17), 6295–6318, doi: 10.1175/jcli-d-15-0687.1.
Daniel, J.S. et al., 2018: Climate change: potential impacts on frost–thaw conditions and seasonal load restriction timing for low-volume roadways. Road Materials and Pavement Design, 19(5), 1126–1146, doi: 10.1080/14680629.2017.1302355.
Daniels, E., S. Bharwani, Gerger Swartling, G. Vulturius, and K. Brandon, 2020: Refocusing the climate services lens: Introducing a framework for co-designing “transdisciplinary knowledge integration processes” to build climate resilience. Climate Services, 19, 100181, doi: 10.1016/j.cliser.2020.100181.
Dankers, R. et al., 2014: First look at changes in flood hazard in the Inter-Sectoral Impact Model Intercomparison Project ensemble. Proceedings of the National Academy of Sciences, 111(9), 3257–3261, doi: 10.1073/pnas.1302078110.
Darmaraki, S. et al., 2019: Future evolution of Marine Heatwaves in the Mediterranean Sea. Climate Dynamics, 53(3–4), 1371–1392, doi: 10.1007/s00382-019-04661-z.
Dash, S. et al., 2016: Effect of heat stress on reproductive performances of dairy cattle and buffaloes: A review. Veterinary World, 9(3), 235–244, doi: 10.14202/vetworld.2016.235-244.
Davi, N.K. et al., 2015: A long-term context (931–2005 C.E.) for rapid warming over Central Asia. Quaternary Science Reviews, 121, 89–97, doi: 10.1016/j.quascirev.2015.05.020.
Davy, R., N. Gnatiuk, L. Pettersson, and L. Bobylev, 2018: Climate change impacts on wind energy potential in the European domain with a focus on the Black Sea. Renewable and Sustainable Energy Reviews, 81, 1652–1659, doi: 10.1016/j.rser.2017.05.253.
Dawson, R.J. et al., 2009: Integrated analysis of risks of coastal flooding and cliff erosion under scenarios of long term change. Climatic Change, 95( 1–2), 249–288, doi: 10.1007/s10584-008-9532-8.
Day, J.J. and K.I. Hodges, 2018: Growing Land–Sea Temperature Contrast and the Intensification of Arctic Cyclones. Geophysical Research Letters, 45(8), 3673–3681, doi: 10.1029/2018gl077587.
De Boeck, H.J., E. Hiltbrunner, M. Verlinden, S. Bassin, and M. Zeiter, 2018: Legacy Effects of Climate Extremes in Alpine Grassland. Frontiers in Plant Science, 9, 1586, doi: 10.3389/fpls.2018.01586.
De Bruin, K. et al., 2020: Physical climate risks and the financial sector – Synthesis of investors’ climate information needs. In: Handbook of Climate Services: Climate Change Management[Leal Filho, W. and D. Jacob (eds.)]. Springer, Cham, Switzerland, pp. 135–156, doi: 10.1007/978-3-030-36875-3_8.
de Jong, P. et al., 2019: Estimating the impact of climate change on wind and solar energy in Brazil using a South American regional climate model. Renewable Energy, 141, 390–401, doi: 10.1016/j.renene.2019.03.086.
Debortoli, N.S. et al., 2015: Rainfall patterns in the Southern Amazon: a chronological perspective (1971–2010). Climatic Change, 132(2), 251–264, doi: 10.1007/s10584-015-1415-1.
DeGaetano, A.T., 2018: Regional Influences of Mean Temperature and Variance Changes on Freeze Risk in Apples. HortScience, 53(1), 90–96, doi: 10.21273/hortsci11546-16.
DeGaetano, A.T. and C.M. Castellano, 2017: Future projections of extreme precipitation intensity–duration–frequency curves for climate adaptation planning in New York State. Climate Services, 5, 23–35, doi: 10.1016/j.cliser.2017.03.003.
Degelia, S.K. et al., 2016: An overview of ice storms and their impact in the United States. International Journal of Climatology, 36(8), 2811–2822, doi: 10.1002/joc.4525.
Delworth, T.L. and F. Zeng, 2014: Regional rainfall decline in Australia attributed to anthropogenic greenhouse gases and ozone levels. Nature Geoscience, 7(8), 583–587, doi: 10.1038/ngeo2201.
Deng, K., C. Azorin-Molina, L. Minola, G. Zhang, and D. Chen, 2021: Global Near-Surface Wind Speed Changes over the Last Decades Revealed by Reanalyses and CMIP6 Model Simulations. Journal of Climate, 34(6), 2219–2234, doi: 10.1175/jcli-d-20-0310.1.
Dennekamp, M. and M.J. Abramson, 2011: The effects of bushfire smoke on respiratory health. Respirology, 16(2), 198–209, doi: 10.1111/j.1440-1843.2010.01868.x.
Dennis, E.S. and W.J. Peacock, 2009: Vernalization in cereals. Journal of Biology, 8(6), 57, doi: 10.1186/jbiol156.
Depietri, Y. and T. McPhearson, 2018: Changing urban risk: 140 years of climatic hazards in New York City. Climatic Change, 148(1–2), 95–108, doi: 10.1007/s10584-018-2194-2.
Dépoues, V., 2017: Organisational uptake of scientific information about climate change by infrastructure managers: the case of adaptation of the French railway company. Climatic Change, 143(3–4), 473–486, doi: 10.1007/s10584-017-2016-y.
Derksen, C. et al., 2018: Changes in Snow, Ice, and Permafrost Across Canada. In: Canada’s Changing Climate Report[Bush, E. and D.S. Lemmen (eds.)]. Government of Canada, Ottawa, ON, Canada, pp. 194–260, https://changingclimate.ca/site/assets/uploads/sites/2/2018/11/CCCR-Chapter5-ChangesInSnowIcePermafrostAcrossCanada.pdf .
Deryng, D., D. Conway, N. Ramankutty, J. Price, and R. Warren, 2014: Global crop yield response to extreme heat stress under multiple climate change futures. Environmental Research Letters, 9(3), 034011, doi: 10.1088/1748-9326/9/3/034011.
Deryng, D. et al., 2016: Regional disparities in the beneficial effects of rising CO2 concentrations on crop water productivity. Nature Climate Change, 6(8), 786–790, doi: 10.1038/nclimate2995.
Dessens, J., C. Berthet, and J.L. Sanchez, 2007: A point hailfall classification based on hailpad measurements: The ANELFA scale. Atmospheric Research, 83(2–4), 132–139, doi: 10.1016/j.atmosres.2006.02.029.
Deutsch, C.A. et al., 2018: Increase in crop losses to insect pests in a warming climate. Science, 361(6405), 916–919, doi: 10.1126/science.aat3466.
Devis, A., N.P.M. Van Lipzig, and M. Demuzere, 2018: Should future wind speed changes be taken into account in wind farm development?Environmental Research Letters, 13(6), 064012, doi: 10.1088/1748-9326/aabff7.
Dey, R., S.C. Lewis, and N.J. Abram, 2019: Investigating observed northwest Australian rainfall trends in Coupled Model Intercomparison Project phase 5 detection and attribution experiments. International Journal of Climatology, 39(1), 112–127, doi: 10.1002/joc.5788.
Di Sante, F., E. Coppola, and F. Giorgi, 2021: Projections of river floods in Europe using EURO-CORDEX, CMIP5 and CMIP6 simulations. International Journal of Climatology, 41(5), 3203–3221, doi: 10.1002/joc.7014.
Di Virgilio, G. et al., 2019: Climate Change Increases the Potential for Extreme Wildfires. Geophysical Research Letters, 46(14), 8517–8526, doi: 10.1029/2019gl083699.
Diaz, R.J. and R. Rosenberg, 2008: Spreading Dead Zones and Consequences for Marine Ecosystems. Science, 321(5891), 926–929, doi: 10.1126/science.1156401.
Dibike, Y., T. Prowse, B. Bonsal, L. Rham, and T. Saloranta, 2012: Simulation of North American lake-ice cover characteristics under contemporary and future climate conditions. International Journal of Climatology, 32(5), 695–709, doi: 10.1002/joc.2300.
Diedhiou, A. et al., 2018: Changes in climate extremes over West and Central Africa at 1.5 °C and 2 °C global warming. Environmental Research Letters, 13(6), 065020, doi: 10.1088/1748-9326/aac3e5.
Diffenbaugh, N.S., M. Scherer, and R.J. Trapp, 2013: Robust increases in severe thunderstorm environments in response to greenhouse forcing. Proceedings of the National Academy of Sciences, 110(41), 16361–16366, doi: 10.1073/pnas.1307758110.
Dikanski, H., A. Hagen-Zanker, B. Imam, and K. Avery, 2016: Climate change impacts on railway structures: bridge scour. Proceedings of the Institution of Civil Engineers – Engineering Sustainability, 170(5), 237–248, doi: 10.1680/jensu.15.00021.
Diro, G.T. et al., 2014: Tropical cyclones in a regional climate change projection with RegCM4 over the CORDEX Central America domain. Climatic Change, 125(1), 79–94, doi: 10.1007/s10584-014-1155-7.
Dittus, A., D. Karoly, S. Lewis, and L. Alexander, 2014: An investigation of some unexpected frost day increases in southern Australia. Australian Meteorological and Oceanographic Journal, 64(4), 261–271, doi: 10.22499/2.6404.002.
Dobney, K., C.J. Baker, L. Chapman, and A.D. Quinn, 2010: The future cost to the United Kingdom’s railway network of heat-related delays and buckles caused by the predicted increase in high summer temperatures owing to climate change. Proceedings of the Institution of Mechanical Engineers, Part F: Journal of Rail and Rapid Transit, 224(1), 25–34, doi: 10.1243/09544097jrrt292.
Dobricic, S., S. Russo, L. Pozzoli, J. Wilson, and E. Vignati, 2020: Increasing occurrence of heat waves in the terrestrial Arctic. Environmental Research Letters, 15(2), 024022, doi: 10.1088/1748-9326/ab6398.
Dobrowski, S.Z. and S.A. Parks, 2016: Climate change velocity underestimates climate change exposure in mountainous regions. Nature Communications, 7(1), 12349, doi: 10.1038/ncomms12349.
Dobrowski, S.Z. et al., 2013: The climate velocity of the contiguous United States during the 20th century. Global Change Biology, 19(1), 241–251, doi: 10.1111/gcb.12026.
DOE, 2015: Climate Change and the U.S. Energy Sector: Regional Vulnerabilities and Resilience Solutions. DOE/EPSA-0005, U.S. Department of Energy (DOE), 193 pp., www.infrastructureusa.org/climate-change-and-the-u-s-energy-sector-regional-vulnerabilities-and-resilience-solutions/.
Döll, P. and H.M. Schmied, 2012: How is the impact of climate change on river flow regimes related to the impact on mean annual runoff? A global-scale analysis. Environmental Research Letters, 7(1), 014037, doi: 10.1088/1748-9326/7/1/014037.
Domingos, F., F. Lúcio, and V. Grasso, 2016: The Global Framework for Climate Services (GFCS). Climate Services, 2–3, 52–53, doi: 10.1016/j.cliser.2016.09.001.
Domínguez-Castro, F., R. García-Herrera, and S.M. Vicente-Serrano, 2018: Wet and dry extremes in Quito (Ecuador) since the 17th century. International Journal of Climatology, 38(4), 2006–2014, doi: 10.1002/joc.5312.
Donat, M.G., L. Alexander, N. Herold, and A.J. Dittus, 2016: Temperature and precipitation extremes in century-long gridded observations, reanalyses, and atmospheric model simulations. Journal of Geophysical Research: Atmospheres, 121(19), 11174–11189, doi: 10.1002/2016jd025480.
Doney, S.C. et al., 2012: Climate Change Impacts on Marine Ecosystems. Annual Review of Marine Science, 4(1), 11–37, doi: 10.1146/annurev-marine-041911-111611.
Dong, S. et al., 2018: Observed changes in temperature extremes over Asia and their attribution. Climate Dynamics, 51(1–2), 339–353, doi: 10.1007/s00382-017-3927-z.
Dong, W. et al., 2018: Regional disparities in warm season rainfall changes over arid eastern–central Asia. Scientific Reports, 8(1), 13051, doi: 10.1038/s41598-018-31246-3.
Dosio, A., 2016: Projections of climate change indices of temperature and precipitation from an ensemble of bias-adjusted high-resolution EURO-CORDEX regional climate models. Journal of Geophysical Research: Atmospheres, 121(10), 5488–5511, doi: 10.1002/2015jd024411.
Dosio, A., 2017: Projection of temperature and heat waves for Africa with an ensemble of CORDEX Regional Climate Models. Climate Dynamics, 49(1–2), 493–519, doi: 10.1007/s00382-016-3355-5.
Dosio, A., L. Mentaschi, E.M. Fischer, and K. Wyser, 2018: Extreme heat waves under 1.5°C and 2°C global warming. Environmental Research Letters, 13(5), 054006, doi: 10.1088/1748-9326/aab827.
Dosio, A. et al., 2019: What can we know about future precipitation in Africa? Robustness, significance and added value of projections from a large ensemble of regional climate models. Climate Dynamics, 53(9), 5833–5858, doi: 10.1007/s00382-019-04900-3.
Dottori, F. et al., 2018: Increased human and economic losses from river flooding with anthropogenic warming. Nature Climate Change, 8(9), 781–786, doi: 10.1038/s41558-018-0257-z.
Dowdy, A.J., 2018: Climatological Variability of Fire Weather in Australia. Journal of Applied Meteorology and Climatology, 57(2), 221–234, doi: 10.1175/jamc-d-17-0167.1.
Dowdy, A.J. and A. Pepler, 2018: Pyroconvection Risk in Australia: Climatological Changes in Atmospheric Stability and Surface Fire Weather Conditions. Geophysical Research Letters, 45(4), 2005–2013, doi: 10.1002/2017gl076654.
Dowdy, A.J. et al., 2019a: Review of Australian east coast low pressure systems and associated extremes. Climate Dynamics, 53(7), 4887–4910, doi: 10.1007/s00382-019-04836-8.
Dowdy, A.J. et al., 2019b: Future changes in extreme weather and pyroconvection risk factors for Australian wildfires. Scientific Reports, 9(1), 10073, doi: 10.1038/s41598-019-46362-x.
Dreessen, J., J. Sullivan, and R. Delgado, 2016: Observations and impacts of transported Canadian wildfire smoke on ozone and aerosol air quality in the Maryland region on June 9–12, 2015. Journal of the Air & Waste Management Association, 66(9), 842–862, doi: 10.1080/10962247.2016.1161674.
Drenkhan, F., C. Huggel, L. Guardamino, and W. Haeberli, 2019: Managing risks and future options from new lakes in the deglaciating Andes of Peru: The example of the Vilcanota-Urubamba basin. Science of The Total Environment, 665, 465–483, doi: 10.1016/j.scitotenv.2019.02.070.
Drewes, J., S. Moreiras, and O. Korup, 2018: Permafrost activity and atmospheric warming in the Argentinian Andes. Geomorphology, 323, 13–24, doi: 10.1016/j.geomorph.2018.09.005.
Driouech, F. et al., 2021: Recent observed country-wide climate trends in Morocco. International Journal of Climatology, 41(S1), E855–E874, doi: 10.1002/joc.6734.
Du, J., J.S. Kimball, C. Duguay, Y. Kim, and J.D. Watts, 2017: Satellite microwave assessment of Northern Hemisphere lake ice phenology from 2002 to 2015. The Cryosphere, 11(1), 47–63, doi: 10.5194/tc-11-47-2017.
Dudley, R.W., G.A. Hodgkins, M.R. McHale, M.J. Kolian, and B. Renard, 2017: Trends in snowmelt-related streamflow timing in the conterminous United States. Journal of Hydrology, 547, 208–221, doi: 10.1016/j.jhydrol.2017.01.051.
Duffy, P.B., P. Brando, G.P. Asner, and C.B. Field, 2015: Projections of future meteorological drought and wet periods in the Amazon. Proceedings of the National Academy of Sciences, 112(43), 13172–13177, doi: 10.1073/pnas.1421010112.
Dunne, J.P., R.J. Stouffer, and J.G. John, 2013: Reductions in labour capacity from heat stress under climate warming. Nature Climate Change, 3(6), 563–566, doi: 10.1038/nclimate1827.
Dunning, C.M., E. Black, and R.P. Allan, 2018: Later Wet Seasons with More Intense Rainfall over Africa under Future Climate Change. Journal of Climate, 31(23), 9719–9738, doi: 10.1175/jcli-d-18-0102.1.
Dupuy, J.-L. et al., 2020: Climate change impact on future wildfire danger and activity in southern Europe: a review. Annals of Forest Science, 77(2), 35, doi: 10.1007/s13595-020-00933-5.
Durand, J.-L. et al., 2018: How accurately do maize crop models simulate the interactions of atmospheric CO2 concentration levels with limited water supply on water use and yield?European Journal of Agronomy, 100, 67–75, doi: 10.1016/j.eja.2017.01.002.
Durkalec, A., C. Furgal, M.W. Skinner, and T. Sheldon, 2015: Climate change influences on environment as a determinant of Indigenous health: Relationships to place, sea ice, and health in an Inuit community. Social Science & Medicine, 136–137, 17–26, doi: 10.1016/j.socscimed.2015.04.026.
Durocher, M., A.I. Requena, D.H. Burn, and J. Pellerin, 2019: Analysis of trends in annual streamflow to the Arctic Ocean. Hydrological Processes, 33(7), 1143–1151, doi: 10.1002/hyp.13392.
Dutkiewicz, S. et al., 2015: Impact of ocean acidification on the structure of future phytoplankton communities. Nature Climate Change, 5(11), 1002–1006, doi: 10.1038/nclimate2722.
Duvat, V.K.E. and V. Pillet, 2017: Shoreline changes in reef islands of the Central Pacific: Takapoto Atoll, Northern Tuamotu, French Polynesia. Geomorphology, 282, 96–118, doi: 10.1016/j.geomorph.2017.01.002.
Duvat, V.K.E., B. Salvat, and C. Salmon, 2017: Drivers of shoreline change in atoll reef islands of the Tuamotu Archipelago, French Polynesia. Global and Planetary Change, 158, 134–154, doi: 10.1016/j.gloplacha.2017.09.016.
Duvillard, P.A., L. Ravanel, M. Marcer, and P. Schoeneich, 2019: Recent evolution of damage to infrastructure on permafrost in the French Alps. Regional Environmental Change, 19(5), 1281–1293, doi: 10.1007/s10113-019-01465-z.
Easterling, D.R. et al., 2017: Precipitation change in the United States. In: Climate Science Special Report: Fourth National Climate Assessment, Volume I[Wuebbles, D.J., D.W. Fahey, K.A. Hibbard, D.J. Dokken, B.C. Stewart, and T.K. Maycock (eds.)]. U.S. Global Change Research Program, Washington, DC, USA, pp. 207–230, doi: 10.7930/j0h993cc.
EC, 2015: A European research and innovation Roadmap for Climate Services. KI0614177ENN, European Commission (EC) Directorate-General for Research and Innovation (DG RTD), Brussels, Belgium, 56 pp., doi: 10.2777/702151.
Economou, T., D.B. Stephenson, J.G. Pinto, L.C. Shaffrey, and G. Zappa, 2015: Serial clustering of extratropical cyclones in a multi-model ensemble of historical and future simulations. Quarterly Journal of the Royal Meteorological Society, 141(693), 3076–3087, doi: 10.1002/qj.2591.
EEA, 2018: National climate change vulnerability and risk assessments in Europe, 2018. EEA Report No 1/2018, European Environment Agency (EEA), Copenhagen, Denmark, 79 pp., doi: 10.2800/348489.
Eisen, L. and C.G. Moore, 2013: Aedes (Stegomyia) aegyptiin the Continental United States: A Vector at the Cool Margin of Its Geographic Range. Journal of Medical Entomology, 50(3), 467–478, doi: 10.1603/me12245.
Ekstrom, J.A. et al., 2015: Vulnerability and adaptation of US shellfisheries to ocean acidification. Nature Climate Change, 5(3), 207–214, doi: 10.1038/nclimate2508.
Ekström, M., E.D. Gutmann, R.L. Wilby, M.R. Tye, and D.G.C. Kirono, 2018: Robustness of hydroclimate metrics for climate change impact research. WIREs Water, 5(4), e1288, doi: 10.1002/wat2.1288.
Elagib, N.A., 2014: Development and application of a drought risk index for food crop yield in Eastern Sahel. Ecological Indicators, 43, 114–125, doi: 10.1016/j.ecolind.2014.02.033.
Elison Timm, O., T.W. Giambelluca, and H.F. Diaz, 2015: Statistical downscaling of rainfall changes in Hawai‘i based on the CMIP5 global model projections. Journal of Geophysical Research: Atmospheres, 120(1), 92–112, doi: 10.1002/2014jd022059.
Elith, J., M. Kearney, and S. Phillips, 2010: The art of modelling range-shifting species. Methods in Ecology and Evolution, 1(4), 330–342, doi: 10.1111/j.2041-210x.2010.00036.x.
Ellison, J.C., 2015: Vulnerability assessment of mangroves to climate change and sea-level rise impacts. Wetlands Ecology and Management, 23(2), 115–137, doi: 10.1007/s11273-014-9397-8.
Elsner, J.B., S.C. Elsner, and T.H. Jagger, 2015: The increasing efficiency of tornado days in the United States. Climate Dynamics, 45(3–4), 651–659, doi: 10.1007/s00382-014-2277-3.
Elsner, J.B., T. Fricker, and Z. Schroder, 2019: Increasingly Powerful Tornadoes in the United States. Geophysical Research Letters, 46(1), 392–398, doi: 10.1029/2018gl080819.
Emadodin, I., T. Reinsch, and F. Taube, 2019: Drought and Desertification in Iran. Hydrology, 6(3), 66, doi: 10.3390/hydrology6030066.
Emberson, L.D. et al., 2018: Ozone effects on crops and consideration in crop models. European Journal of Agronomy, 100, 19–34, doi: 10.1016/j.eja.2018.06.002.
Engelbrecht, F. et al., 2015: Projections of rapidly rising surface temperatures over Africa under low mitigation. Environmental Research Letters, 10(8), 085004, doi: 10.1088/1748-9326/10/8/085004.
England, M.H. et al., 2014: Recent intensification of wind-driven circulation in the Pacific and the ongoing warming hiatus. Nature Climate Change, 4(3), 222–227, doi: 10.1038/nclimate2106.
Engram, M., C.D. Arp, B.M. Jones, O.A. Ajadi, and F.J. Meyer, 2018: Analyzing floating and bedfast lake ice regimes across Arctic Alaska using 25 years of space-borne SAR imagery. Remote Sensing of Environment, 209, 660–676, doi: 10.1016/j.rse.2018.02.022.
Erban, L.E., S.M. Gorelick, and H.A. Zebker, 2014: Groundwater extraction, land subsidence, and sea-level rise in the Mekong Delta, Vietnam. Environmental Research Letters, 9(8), 84010, doi: 10.1088/1748-9326/9/8/084010.
Erlat, E. and M. Türkeş, 2016: Dates of frost onset, frost end and the frost-free season in Turkey: trends, variability and links to the North Atlantic and Arctic Oscillation indices, 1950–2013. Climate Research, 69(2), 155–176, doi: 10.3354/cr01397.
Espinet, X., A. Schweikert, N. van den Heever, and P. Chinowsky, 2016: Planning resilient roads for the future environment and climate change: Quantifying the vulnerability of the primary transport infrastructure system in Mexico. Transport Policy, 50, 78–86, doi: 10.1016/j.tranpol.2016.06.003.
Espinoza, J.C. et al., 2013: The Major Floods in the Amazonas River and Tributaries (Western Amazon Basin) during the 1970–2012 Period: A Focus on the 2012 Flood. Journal of Hydrometeorology, 14(3), 1000–1008, doi: 10.1175/jhm-d-12-0100.1.
Espinoza, J.C. et al., 2020: Hydroclimate of the Andes Part I: Main Climatic Features. Frontiers in Earth Science, 8, 64, doi: 10.3389/feart.2020.00064.
Evan, A.T., C. Flamant, M. Gaetani, and F. Guichard, 2016: The past, present and future of African dust. Nature, 531(7595), 493–495, doi: 10.1038/nature17149.
Eyring, V. et al., 2016: Overview of the Coupled Model Intercomparison Project Phase 6 (CMIP6) experimental design and organization. Geoscientific Model Development, 9(5), 1937–1958, doi: 10.5194/gmd-9-1937-2016.
Eyshi Rezaei, E., H. Webber, T. Gaiser, J. Naab, and F. Ewert, 2015: Heat stress in cereals: Mechanisms and modelling. European Journal of Agronomy, 64, 98–113, doi: 10.1016/j.eja.2014.10.003.
Fábrega, J. et al., 2013: Hydroclimate projections for Panama in the late 21st Century. Hydrological Research Letters, 7(2), 23–29, doi: 10.3178/hrl.7.23.
Faggian, P. and G. Decimi, 2019: An updated investigation about climate-change hazards that might impact electric infrastructures. In: 2019 AEIT International Annual Conference (AEIT). IEEE, pp. 1–5, doi: 10.23919/aeit.2019.8893297.
Fallah-Ghalhari, G., F. Shakeri, and A. Dadashi-Roudbari, 2019: Impacts of climate changes on the maximum and minimum temperature in Iran. Theoretical and Applied Climatology, 138(3–4), 1539–1562, doi: 10.1007/s00704-019-02906-9.
Falloon, P. et al., 2018: The land management tool: Developing a climate service in Southwest UK. Climate Services, 9, 86–100, doi: 10.1016/j.cliser.2017.08.002.
Fan, X.-T., Y. Li, A.-M. Lyu, and L.-S. Liu, 2020: Statistical and Comparative Analysis of Tropical Cyclone Activity over the Arabian Sea and Bay of Bengal (1977–2018). Journal of Tropical Meteorology, 26(3), 441–452, doi: 10.46267/j.1006-8775.2020.038.
Fann, N. et al., 2015: The geographic distribution and economic value of climate change-related ozone health impacts in the United States in 2030. Journal of the Air & Waste Management Association, 65(5), 570–580, doi: 10.1080/10962247.2014.996270.
Fann, N. et al., 2016: Ch. 3: Air Quality Impacts. In: The Impacts of Climate Change on Human Health in the United States: A Scientific Assessment. U.S. Global Change Research Program, Washington, DC, USA, pp. 69–98, doi: 10.7930/j0gq6vp6.
Fant, C., C. Adam Schlosser, and K. Strzepek, 2016: The impact of climate change on wind and solar resources in southern Africa. Applied Energy, 161, 556–564, doi: 10.1016/j.apenergy.2015.03.042.
Fargeon, H. et al., 2020: Projections of fire danger under climate change over France: where do the greatest uncertainties lie?Climatic Change, 160(3), 479–493, doi: 10.1007/s10584-019-02629-w.
Farquharson, L.M. et al., 2019: Climate Change Drives Widespread and Rapid Thermokarst Development in Very Cold Permafrost in the Canadian High Arctic. Geophysical Research Letters, 46(12), 6681–6689, doi: 10.1029/2019gl082187.
Fatemi, S.S., M. Rahimi, M. Tarkesh, and H. Ravanbakhsh, 2018: Predicting the impacts of climate change on the distribution of Juniperus excelsaM. Bieb. in the central and eastern Alborz Mountains, Iran. iForest – Biogeosciences and Forestry, 11(5), 643–650, doi: 10.3832/ifor2559-011.
Fedotova, E.V., 2019: Wind projections for the territory of Russia considering the development of wind power. IOP Conference Series: Earth and Environmental Science, 386, 12042, doi: 10.1088/1755-1315/386/1/012042.
Feeley, T.J. et al., 2008: Water: A critical resource in the thermoelectric power industry. Energy, 33(1), 1–11, doi: 10.1016/j.energy.2007.08.007.
Feely, R.A. et al., 2016: Chemical and biological impacts of ocean acidification along the west coast of North America. Estuarine, Coastal and Shelf Science, 183, 260–270, doi: 10.1016/j.ecss.2016.08.043.
Fei, S. et al., 2017: Divergence of species responses to climate change. Science Advances, 3(5), e1603055, doi: 10.1126/sciadv.1603055.
Feng, J., T. Wang, and C. Xie, 2006: Eco-Environmental Degradation in the Source Region of the Yellow River, Northeast Qinghai-Xizang Plateau. Environmental Monitoring and Assessment, 122(1–3), 125–143, doi: 10.1007/s10661-005-9169-2.
Feng, S. and Q. Fu, 2013: Expansion of global drylands under a warming climate. Atmospheric Chemistry and Physics, 13(19), 10081–10094, doi: 10.5194/acp-13-10081-2013.
Feng, S., M. Trnka, M. Hayes, and Y. Zhang, 2017: Why Do Different Drought Indices Show Distinct Future Drought Risk Outcomes in the U.S. Great Plains?Journal of Climate, 30(1), 265–278, doi: 10.1175/jcli-d-15-0590.1.
Feng, T., T. Su, R. Zhi, G. Tu, and F. Ji, 2019: Assessment of actual evapotranspiration variability over global land derived from seven reanalysis datasets. International Journal of Climatology, 39(6), 2919–2932, doi: 10.1002/joc.5992.
Ferguson, C.R., M. Pan, and T. Oki, 2018: The Effect of Global Warming on Future Water Availability: CMIP5 Synthesis. Water Resources Research, 54(10), 7791–7819, doi: 10.1029/2018wr022792.
Ferguson, G. and T. Gleeson, 2012: Vulnerability of coastal aquifers to groundwater use and climate change. Nature Climate Change, 2(5), 342–345, doi: 10.1038/nclimate1413.
Feser, F. et al., 2015: Storminess over the North Atlantic and northwestern Europe - A review. Quarterly Journal of the Royal Meteorological Society, 141(687), 350–382, doi: 10.1002/qj.2364.
Filizola, N. et al., 2014: Was the 2009 flood the most hazardous or the largest ever recorded in the Amazon?Geomorphology, 215, 99–105, doi: 10.1016/j.geomorph.2013.05.028.
Finger Higgens, R.A. et al., 2019: Changing Lake Dynamics Indicate a Drier Arctic in Western Greenland. Journal of Geophysical Research: Biogeosciences, 124(4), 870–883, doi: 10.1029/2018jg004879.
Fiore, A.M., V. Naik, and E.M. Leibensperger, 2015: Air quality and climate connections. Journal of the Air & Waste Management Association, 65(6), 645–685, doi: 10.1080/10962247.2015.1040526.
Fischer, E.M. and R. Knutti, 2016: Observed heavy precipitation increase confirms theory and early models. Nature Climate Change, 6(11), 986–991, doi: 10.1038/nclimate3110.
Fishman, R., 2016: More uneven distributions overturn benefits of higher precipitation for crop yields. Environmental Research Letters, 11(2), 024004, doi: 10.1088/1748-9326/11/2/024004.
Fiss, C.J., D.J. McNeil, F. Rodríguez, A.D. Rodewald, and J.L. Larkin, 2019: Hail-induced nest failure and adult mortality in a declining ground-nesting forest songbird. The Wilson Journal of Ornithology, 131(1), 165, doi: 10.1676/18-15.
Fitchett, J.M., 2018: Recent emergence of CAT5 tropical cyclones in the South Indian Ocean. South African Journal of Science, 114(11/12), 1–6, doi: 10.17159/sajs.2018/4426.
Flannigan, M. et al., 2013: Global wildland fire season severity in the 21st century. Forest Ecology and Management, 294, 54–61, doi: 10.1016/j.foreco.2012.10.022.
Fleisher, D.H. et al., 2017: A potato model intercomparison across varying climates and productivity levels. Global Change Biology, 23(3), 1258–1281, doi: 10.1111/gcb.13411.
Fluixá-Sanmartín, J., L. Altarejos-García, A. Morales-Torres, and I. Escuder-Bueno, 2018: Review article: Climate change impacts on dam safety. Natural Hazards and Earth System Sciences, 18(9), 2471–2488, doi: 10.5194/nhess-18-2471-2018.
Fonseca, M.G. et al., 2019: Effects of climate and land-use change scenarios on fire probability during the 21st century in the Brazilian Amazon. Global Change Biology, 25(9), 2931–2946, doi: 10.1111/gcb.14709.
Fontana, G., A. Toreti, A. Ceglar, and G. De Sanctis, 2015: Early heat waves over Italy and their impacts on durum wheat yields. Natural Hazards and Earth System Sciences, 15(7), 1631–1637, doi: 10.5194/nhess-15-1631-2015.
Fontrodona Bach, A., G. Schrier, L.A. Melsen, A.M.G. Klein Tank, and A.J. Teuling, 2018: Widespread and Accelerated Decrease of Observed Mean and Extreme Snow Depth Over Europe. Geophysical Research Letters, 45(22), 12312–12319, doi: 10.1029/2018gl079799.
Forbes, B.C. et al., 2016: Sea ice, rain-on-snow and tundra reindeer nomadism in Arctic Russia. Biology Letters, 12(11), 20160466, doi: 10.1098/rsbl.2016.0466.
Forbes, D.L. (ed.), 2011: State of the Arctic Coast 2010 – Scientific Review and Outlook. International Arctic Science Committee, Land-Ocean Interactions in the Coastal Zone, Arctic Monitoring and Assessment Programme, International Permafrost Association. Helmholtz-Zentrum, Geesthacht, Germany, 178 pp., www.arcticcoasts.org/.
Ford, M.R. and P.S. Kench, 2015: Multi-decadal shoreline changes in response to sea level rise in the Marshall Islands. Anthropocene, 11, 14–24, doi: 10.1016/j.ancene.2015.11.002.
Forkel, M. et al., 2019: Recent global and regional trends in burned area and their compensating environmental controls. Environmental Research Communications, 1(5), 051005, doi: 10.1088/2515-7620/ab25d2.
Forzieri, G., A. Cescatti, F.B. e Silva, and L. Feyen, 2017: Increasing risk over time of weather-related hazards to the European population: a data-driven prognostic study. The Lancet Planetary Health, 1(5), e200–e208, doi: 10.1016/s2542-5196(17)30082-7.
Forzieri, G. et al., 2014: Ensemble projections of future streamflow droughts in Europe. Hydrology and Earth System Sciences, 18(1), 85–108, doi: 10.5194/hess-18-85-2014.
Forzieri, G. et al., 2016: Multi-hazard assessment in Europe under climate change. Climatic Change, 137(1–2), 105–119, doi: 10.1007/s10584-016-1661-x.
Forzieri, G. et al., 2018: Escalating impacts of climate extremes on critical infrastructures in Europe. Global Environmental Change, 48, 97–107, doi: 10.1016/j.gloenvcha.2017.11.007.
Frazier, A.G. and T.W. Giambelluca, 2017: Spatial trend analysis of Hawaiian rainfall from 1920 to 2012. International Journal of Climatology, 37(5), 2522–2531, doi: 10.1002/joc.4862.
Frederikse, T. et al., 2020: The causes of sea-level rise since 1900. Nature, 584(7821), 393–397, doi: 10.1038/s41586-020-2591-3.
Freeland, H.J., 2013: Evidence of Change in the Winter Mixed Layer in the Northeast Pacific Ocean: A Problem Revisited. Atmosphere-Ocean, 51(1), 126–133, doi: 10.1080/07055900.2012.754330.
Frieler, K. et al., 2013: Limiting global warming to 2°C is unlikely to save most coral reefs. Nature Climate Change, 3(2), 165–170, doi: 10.1038/nclimate1674.
Fritz, M., J.E. Vonk, and H. Lantuit, 2017: Collapsing Arctic coastlines. Nature Climate Change, 7(1), 6–7, doi: 10.1038/nclimate3188.
Frölicher, T.L., 2019: Chapter 5 – Extreme climatic events in the ocean. In: Predicting Future Oceans[Cisneros-Montemayor, A.M., W.W.L. Cheung, and Y. Ota (eds.)]. Elsevier, pp. 53–60, doi: 10.1016/b978-0-12-817945-1.00005-8.
Frölicher, T.L. and C. Laufkötter, 2018: Emerging risks from marine heat waves. Nature Communications, 9(1), 650, doi: 10.1038/s41467-018-03163-6.
Frölicher, T.L., E.M. Fischer, and N. Gruber, 2018: Marine heatwaves under global warming. Nature, 560(7718), 360–364, doi: 10.1038/s41586-018-0383-9.
Frölicher, T.L. et al., 2020: Contrasting Upper and Deep Ocean Oxygen Response to Protracted Global Warming. Global Biogeochemical Cycles, 34(8), e2020GB006601, doi: 10.1029/2020gb006601.
Frolova, N.L. et al., 2017: Hydrological hazards in Russia: origin, classification, changes and risk assessment. Natural Hazards, 88(1), 103–131, doi: 10.1007/s11069-016-2632-2.
Froude, M.J. and D.N. Petley, 2018: Global fatal landslide occurrence from 2004 to 2016. Natural Hazards and Earth System Sciences, 18, 2161–2181, doi: 10.5194/nhess-18-2161-2018.
Fu, R. et al., 2013: Increased dry-season length over southern Amazonia in recent decades and its implication for future climate projection. Proceedings of the National Academy of Sciences, 110(45), 18110–18115, doi: 10.1073/pnas.1302584110.
Fuentes-Franco, R. et al., 2015: Inter-annual variability of precipitation over Southern Mexico and Central America and its relationship to sea surface temperature from a set of future projections from CMIP5 GCMs and RegCM4 CORDEX simulations. Climate Dynamics, 45(1–2), 425–440, doi: 10.1007/s00382-014-2258-6.
Fyfe, J.C. et al., 2017: Large near-term projected snowpack loss over the western United States. Nature Communications, 8, 14996, doi: 10.1038/ncomms14996.
Gabric, A.J. et al., 2016: Tasman Sea biological response to dust storm events during the austral spring of 2009. Marine and Freshwater Research, 67(8), 1090, doi: 10.1071/mf14321.
Gądek, B. et al., 2017: Snow avalanche activity in Żleb Żandarmerii in a time of climate change (Tatra Mts., Poland). CATENA, 158, 201–212, doi: 10.1016/j.catena.2017.07.005.
Gaffin, S.R. et al., 2012: Bright is the new black – multi-year performance of high-albedo roofs in an urban climate. Environmental Research Letters, 7(1), 014029, doi: 10.1088/1748-9326/7/1/014029.
Gaire, S., R. Castro Delgado, and P. Arcos González, 2015: Disaster risk profile and existing legal framework of Nepal: floods and landslides. Risk management and healthcare policy, 8, 139–149, doi: 10.2147/rmhp.s90238.
Galli, G., C. Solidoro, and T. Lovato, 2017: Marine Heat Waves Hazard 3D Maps and the Risk for Low Motility Organisms in a Warming Mediterranean Sea. Frontiers in Marine Science, 4, 136, doi: 10.3389/fmars.2017.00136.
Gallo, F. et al., 2019: High-resolution regional climate model projections of future tropical cyclone activity in the Philippines. International Journal of Climatology, 39(3), 1181–1194, doi: 10.1002/joc.5870.
Gan, R., Y. Luo, Q. Zuo, and L. Sun, 2015: Effects of projected climate change on the glacier and runoff generation in the Naryn River Basin, Central Asia. Journal of Hydrology, 523, 240–251, doi: 10.1016/j.jhydrol.2015.01.057.
Ganeshi, N.G., M. Mujumdar, R. Krishnan, and M. Goswami, 2020: Understanding the linkage between soil moisture variability and temperature extremes over the Indian region. Journal of Hydrology, 589, 125183, doi: 10.1016/j.jhydrol.2020.125183.
Ganguli, P. and B. Merz, 2019: Trends in Compound Flooding in Northwestern Europe During 1901–2014. Geophysical Research Letters, 46(19), 10810–10820, doi: 10.1029/2019gl084220.
Gao, C., K. Kuklane, P.O. Östergren, and T. Kjellstrom, 2018: Occupational heat stress assessment and protective strategies in the context of climate change. International Journal of Biometeorology, 62(3), 359–371, doi: 10.1007/s00484-017-1352-y.
Gao, X., C.A. Schlosser, and E.R. Morgan, 2018: Potential impacts of climate warming and increased summer heat stress on the electric grid: a case study for a large power transformer (LPT) in the Northeast United States. Climatic Change, 147(1–2), 107–118, doi: 10.1007/s10584-017-2114-x.
Gao, Y., L.R. Leung, J. Lu, and G. Masato, 2015: Persistent cold air outbreaks over North America in a warming climate. Environmental Research Letters, 10(4), 044001, doi: 10.1088/1748-9326/10/4/044001.
Garcia, R.A., M. Cabeza, C. Rahbek, and M.B. Araujo, 2014: Multiple Dimensions of Climate Change and Their Implications for Biodiversity. Science, 344(6183), 1247579, doi: 10.1126/science.1247579.
García-Cueto, O.R. et al., 2019: Trends of climate change indices in some Mexican cities from 1980 to 2010. Theoretical and Applied Climatology, 137(1), 775–790, doi: 10.1007/s00704-018-2620-4.
Gariano, S.L. and F. Guzzetti, 2016: Landslides in a changing climate. Earth-Science Reviews, 162, 227–252, doi: 10.1016/j.earscirev.2016.08.011.
Garreaud, R.D. et al., 2017: The 2010–2015 megadrought in central Chile: impacts on regional hydroclimate and vegetation. Hydrology and Earth System Sciences, 21(12), 6307–6327, doi: 10.5194/hess-21-6307-2017.
Garrett, K.A., S.P. Dendy, E.E. Frank, M.N. Rouse, and S.E. Travers, 2006: Climate Change Effects on Plant Disease: Genomes to Ecosystems. Annual Review of Phytopathology, 44(1), 489–509, doi: 10.1146/annurev.phyto.44.070505.143420.
Gattuso, J.-P. et al., 2015: Contrasting futures for ocean and society from different anthropogenic CO2 emissions scenarios. Science, 349(6243), aac4722, doi: 10.1126/science.aac4722.
Gebrechorkos, S.H., S. Hülsmann, and C. Bernhofer, 2019: Regional climate projections for impact assessment studies in East Africa. Environmental Research Letters, 14(4), 044031, doi: 10.1088/1748-9326/ab055a.
Geertsema, M., J.J. Clague, J.W. Schwab, and S.G. Evans, 2006: An overview of recent large catastrophic landslides in northern British Columbia, Canada. Engineering Geology, 83(1–3), 120–143, doi: 10.1016/j.enggeo.2005.06.028.
Gendron St-Marseille, A.-F., G. Bourgeois, J. Brodeur, and B. Mimee, 2019: Simulating the impacts of climate change on soybean cyst nematode and the distribution of soybean. Agricultural and Forest Meteorology, 264, 178–187, doi: 10.1016/j.agrformet.2018.10.008.
Georgeson, L., M. Maslin, and M. Poessinouw, 2017: Global disparity in the supply of commercial weather and climate information services. Science Advances, 3(5), e1602632, doi: 10.1126/sciadv.1602632.
Ghanbari, M., M. Arabi, J. Obeysekera, and W. Sweet, 2019: A Coherent Statistical Model for Coastal Flood Frequency Analysis Under Nonstationary Sea Level Conditions. Earth’s Future, 7(2), 162–177, doi: 10.1029/2018ef001089.
Giannaros, T.M., V. Kotroni, and K. Lagouvardos, 2021: Climatology and trend analysis (1987–2016) of fire weather in the Euro-Mediterranean. International Journal of Climatology, 41(S1), E491–E508, doi: 10.1002/joc.6701.
Gibbs, A.E. and B.M. Richmond, 2015: National Assessment of Shoreline Change – Historical Shoreline Change Along the North Coast of Alaska, U.S.-Canadian Border to Icy Cape. USGS Open-File Report 2015-1048, U.S. Geological Survey (USGS), Reston, VA, USA, 96 pp., doi: 10.3133/ofr20151048.
Gidhagen, L. et al., 2020: Towards climate services for European cities: Lessons learnt from the Copernicus project Urban SIS. Urban Climate, 31, 100549, doi: 10.1016/j.uclim.2019.100549.
Giersch, J.J., S. Hotaling, R.P. Kovach, L.A. Jones, and C.C. Muhlfeld, 2017: Climate-induced glacier and snow loss imperils alpine stream insects. Global Change Biology, 23(7), 2577–2589, doi: 10.1111/gcb.13565.
Gilly, W.F., J.M. Beman, S.Y. Litvin, and B.H. Robison, 2013: Oceanographic and Biological Effects of Shoaling of the Oxygen Minimum Zone. Annual Review of Marine Science, 5(1), 393–420, doi: 10.1146/annurev-marine-120710-100849.
Ginoux, P., J.M. Prospero, T.E. Gill, N.C. Hsu, and M. Zhao, 2012: Global-scale attribution of anthropogenic and natural dust sources and their emission rates based on MODIS Deep Blue aerosol products. Reviews of Geophysics, 50(3), RG3005, doi: 10.1029/2012rg000388.
Giorgi, F. and X. Bi, 2009: Time of emergence (TOE) of GHG-forced precipitation change hot-spots. Geophysical Research Letters, 36(6), L06709, doi: 10.1029/2009gl037593.
Giorgi, F., E. Coppola, and F. Raffaele, 2018: Threatening levels of cumulative stress due to hydroclimatic extremes in the 21st century. npj Climate and Atmospheric Science, 1(1), 18, doi: 10.1038/s41612-018-0028-6.
Giorgi, F. et al., 2014: Changes in extremes and hydroclimatic regimes in the CREMA ensemble projections. Climatic Change, 125(1), 39–51, doi: 10.1007/s10584-014-1117-0.
Girardin, M.P. and B.M. Wotton, 2009: Summer moisture and wildfire risks across Canada. Journal of Applied Meteorology and Climatology, 48(3), 517–533, doi: 10.1175/2008jamc1996.1.
Girardin, M.P. et al., 2013: Fire in managed forests of eastern Canada: Risks and options. Forest Ecology and Management, 294, 238–249, doi: 10.1016/j.foreco.2012.07.005.
Giuliani, G., S. Nativi, A. Obregon, M. Beniston, and A. Lehmann, 2017: Spatially enabling the Global Framework for Climate Services: Reviewing geospatial solutions to efficiently share and integrate climate data & information. Climate Services, 8, 44–58, doi: 10.1016/j.cliser.2017.08.003.
Giuntoli, I., J.-P. Vidal, C. Prudhomme, and D.M. Hannah, 2015: Future hydrological extremes: The uncertainty from multiple global climate and global hydrological models. Earth System Dynamics, 6(1), 267–285, doi: 10.5194/esd-6-267-2015.
Gizaw, M.S. and T.Y. Gan, 2017: Impact of climate change and El Niño episodes on droughts in sub-Saharan Africa. Climate Dynamics, 49(1–2), 665–682, doi: 10.1007/s00382-016-3366-2.
Glazer, R.H. et al., 2021: Projected changes to severe thunderstorm environments as a result of twenty-first century warming from RegCM CORDEX-CORE simulations. Climate Dynamics, 57(5–6), 1595–1613, doi: 10.1007/s00382-020-05439-4.
Glenn, D.M., S.-H. Kim, J. Ramirez-Villegas, and P. Läderach, 2014: Response of Perennial Horticultural Crops to Climate Change. In: Horticultural Reviews Volume 41[Janick, J. (ed.)]. John Wiley & Sons, Inc., Hoboken, NJ, USA, pp. 47–130, doi: 10.1002/9781118707418.ch02.
Gobler, C.J. and H. Baumann, 2016: Hypoxia and acidification in ocean ecosystems: coupled dynamics and effects on marine life. Biology Letters, 12(5), 20150976, doi: 10.1098/rsbl.2015.0976.
Gobler, C.J., E.L. DePasquale, A.W. Griffith, and H. Baumann, 2014: Hypoxia and Acidification Have Additive and Synergistic Negative Effects on the Growth, Survival, and Metamorphosis of Early Life Stage Bivalves. PLOS ONE, 9(1), e83648, doi: 10.1371/journal.pone.0083648.
Gobler, C.J. et al., 2017: Ocean warming since 1982 has expanded the niche of toxic algal blooms in the North Atlantic and North Pacific oceans. Proceedings of the National Academy of Sciences, 114(19), 4975–4980, doi: 10.1073/pnas.1619575114.
Godoi, V.A., K.R. Bryan, and R.M. Gorman, 2018: Storm wave clustering around New Zealand and its connection to climatic patterns. International Journal of Climatology, 38, e401–e417, doi: 10.1002/joc.5380.
Goldie, J., L. Alexander, S.C. Lewis, and S. Sherwood, 2017: Comparative evaluation of human heat stress indices on selected hospital admissions in Sydney, Australia. Australian and New Zealand Journal of Public Health, 41(4), 381–387, doi: 10.1111/1753-6405.12692.
Golding, N., C. Hewitt, and P. Zhang, 2017a: Effective engagement for climate services: Methods in practice in China. Climate Services, 8, 72–76, doi: 10.1016/j.cliser.2017.11.002.
Golding, N. et al., 2017b: Improving user engagement and uptake of climate services in China. Climate Services, 5, 39–45, doi: 10.1016/j.cliser.2017.03.004.
Golding, N. et al., 2019: Co-development of a seasonal rainfall forecast service: Supporting flood risk management for the Yangtze River basin. Climate Risk Management, 23, 43–49, doi: 10.1016/j.crm.2019.01.002.
Gonzalez, P., F. Wang, M. Notaro, D.J. Vimont, and J.W. Williams, 2018: Disproportionate magnitude of climate change in United States national parks. Environmental Research Letters, 13(10), 104001, doi: 10.1088/1748-9326/aade09.
González, M.E., S. Gómez-González, A. Lara, R. Garreaud, and I. Díaz-Hormazábal, 2018: The 2010–2015 Megadrought and its influence on the fire regime in central and south-central Chile. Ecosphere, 9(8), e02300, doi: 10.1002/ecs2.2300.
González-Alemán, J.J. et al., 2019: Potential Increase in Hazard From Mediterranean Hurricane Activity With Global Warming. Geophysical Research Letters, 46(3), 1754–1764, doi: 10.1029/2018gl081253.
Goodess, C.M. et al., 2019: Advancing climate services for the European renewable energy sector through capacity building and user engagement. Climate Services, 16, 100139, doi: 10.1016/j.cliser.2019.100139.
Gopalakrishnan, T., M. Hasan, A. Haque, S. Jayasinghe, and L. Kumar, 2019: Sustainability of Coastal Agriculture under Climate Change. Sustainability, 11(24), 7200, doi: 10.3390/su11247200.
Gorris, M.E., L.A. Cat, C.S. Zender, K.K. Treseder, and J.T. Randerson, 2018: Coccidioidomycosis Dynamics in Relation to Climate in the Southwestern United States. GeoHealth, 2(1), 6–24, doi: 10.1002/2017gh000095.
Gorter, W., J.H. van Angelen, J.T.M. Lenaerts, and M.R. van den Broeke, 2014: Present and future near-surface wind climate of Greenland from high resolution regional climate modelling. Climate Dynamics, 42(5–6), 1595–1611, doi: 10.1007/s00382-013-1861-2.
Gosling, S.N. and N.W. Arnell, 2016: A global assessment of the impact of climate change on water scarcity. Climatic Change, 134(3), 371–385, doi: 10.1007/s10584-013-0853-x.
Goudie, A.S., 2014: Desert dust and human health disorders. Environment International, 63, 101–113, doi: 10.1016/j.envint.2013.10.011.
Gould, W.A. et al., 2018: U.S. Caribbean. In: Impacts, Risks, and Adaptation in the United States: Fourth National Climate Assessment, Volume II[Reidmiller, D.R., C.W. Avery, D.R. Easterling, K.E. Kunkel, K.L.M. Lewis, T.K. Maycock, and B.C. Stewart (eds.)]. U.S. Global Change Research Program, Washington, DC, USA, pp. 809–871, doi: 10.7930/nca4.2018.ch20.
Gourdji, S.M., A.M. Sibley, and D.B. Lobell, 2013: Global crop exposure to critical high temperatures in the reproductive period: historical trends and future projections. Environmental Research Letters, 8(2), 024041, doi: 10.1088/1748-9326/8/2/024041.
Gowda, P.H. et al., 2018: Agriculture and Rural Communities. In: Impacts, Risks, and Adaptation in the United States: Fourth National Climate Assessment, Volume II[Reidmiller, D.R., C.W. Avery, D.R. Easterling, K.E. Kunkel, K.L.M. Lewis, T.K. Maycock, and B.C. Stewart (eds.)]. pp. 391–437, doi: 10.7930/nca4.2018.ch10.
Graff Zivin, J. and M. Neidell, 2014: Temperature and the Allocation of Time: Implications for Climate Change. Journal of Labor Economics, 32(1), 1–26, doi: 10.1086/671766.
Graham, N.A.J., S. Jennings, M.A. MacNeil, D. Mouillot, and S.K. Wilson, 2015: Predicting climate-driven regime shifts versus rebound potential in coral reefs. Nature, 518(7537), 94–97, doi: 10.1038/nature14140.
Graham, R.M. et al., 2017: Increasing frequency and duration of Arctic winter warming events. Geophysical Research Letters, 44(13), 6974–6983, doi: 10.1002/2017gl073395.
Grahn, T. and L. Nyberg, 2017: Assessment of pluvial flood exposure and vulnerability of residential areas. International Journal of Disaster Risk Reduction, 21, 367–375, doi: 10.1016/j.ijdrr.2017.01.016.
Gray, W., R. Ibbitt, R. Turner, M. Duncan, and M. Hollis, 2005: A Methodology to Assess the Impacts of Climate Change on Flood Risk in New Zealand. New Zealand Climate Change Office, Ministry for the Environment, New Zealand, 40 pp., www.mfe.govt.nz/sites/default/files/publications/climate/impact-climate-change-flood-risk-jul05/impact-climate-change-flood-risk-jul05.pdf .
Greenan, B.J.W. et al., 2018: Changes in Oceans Surrounding Canada. In: Canada’s Changing Climate Report[Lemmen and Bush (eds.)]. Government of Canada, Ottawa, ON, Canada, pp. 343–423, www.nrcan.gc.ca/sites/www.nrcan.gc.ca/files/energy/Climate-change/pdf/CCCR-Chapter7-ChangesInOceansSurroundingCanada.pdf .
Gregow, H. et al., 2016: Worldwide survey of awareness and needs concerning reanalyses and respondents views on climate services. Bulletin of the American Meteorological Society, 97(8), 1461–1474, doi: 10.1175/bams-d-14-00271.1.
Griffiths, J.R. et al., 2017: The importance of benthic–pelagic coupling for marine ecosystem functioning in a changing world. Global Change Biology, 23(6), 2179–2196, doi: 10.1111/gcb.13642.
Grineski, S.E. et al., 2015: Double exposure and the climate gap: changing demographics and extreme heat in Ciudad Juárez, Mexico. Local Environment, 20(2), 180–201, doi: 10.1080/13549839.2013.839644.
Groenemeijer, P. and T. Kühne, 2014: A Climatology of Tornadoes in Europe: Results from the European Severe Weather Database. Monthly Weather Review, 142(12), 4775–4790, doi: 10.1175/mwr-d-14-00107.1.
Groisman, P.Y. et al., 2016: Recent changes in the frequency of freezing precipitation in North America and Northern Eurasia. Environmental Research Letters, 11(4), 045007, doi: 10.1088/1748-9326/11/4/045007.
Grotjahn, R., 2021: Weather extremes that impact various agricultural commodities. In: Extreme Events and Climate Change: A Multidisciplinary Approach[Castillo, F., M. Wehner, and D. Stone (eds.)]. John Wiley & Sons, Inc. pp. 23–48.
Grotjahn, R. and J. Huynh, 2018: Contiguous US summer maximum temperature and heat stress trends in CRU and NOAA Climate Division data plus comparisons to reanalyses. Scientific Reports, 8(1), 11146, doi: 10.1038/s41598-018-29286-w.
Gu, X. et al., 2020: The changing nature and projection of floods across Australia. Journal of Hydrology, 584, 124703, doi: 10.1016/j.jhydrol.2020.124703.
Gualdi, S. et al., 2013: Future Climate Projections. In: Regional Assessment of Climate Change in the Mediterranean: Volume 1: Air, Sea and Precipitation and Water[Navarra, A. and L. Tubiana (eds.)]. Advances in Global Change Research vol. 50, Springer, Dordrecht, The Netherlands, pp. 53–118, doi: 10.1007/978-94-007-5781-3_3.
Guan, Q. et al., 2015: Climatological analysis of dust storms in the area surrounding the Tengger Desert during 1960–2007. Climate Dynamics, 45(3–4), 903–913, doi: 10.1007/s00382-014-2321-3.
Guan, Q. et al., 2017: Dust Storms in Northern China: Long-Term Spatiotemporal Characteristics and Climate Controls. Journal of Climate, 30(17), 6683–6700, doi: 10.1175/jcli-d-16-0795.1.
Gudmestad, O.T., 2018: The changing climate and the arctic coastal settlements. International Journal of Environmental Impacts: Management, Mitigation and Recovery , 1(4), 411–419, doi: 10.2495/ei-v1-n4-411-419.
Gudmundsson, L., S.I. Seneviratne, and X. Zhang, 2017: Anthropogenic climate change detected in European renewable freshwater resources. Nature Climate Change, 7(11), 813–816, doi: 10.1038/nclimate3416.
Guerreiro, S.B., V. Glenis, R.J. Dawson, and C. Kilsby, 2017: Pluvial Flooding in European Cities – A Continental Approach to Urban Flood Modelling. Water, 9(4), 296, doi: 10.3390/w9040296.
Guerreiro, S.B., R.J. Dawson, C. Kilsby, E. Lewis, and A. Ford, 2018: Future heat-waves, droughts and floods in 571 European cities. Environmental Research Letters, 13(3), 034009, doi: 10.1088/1748-9326/aaaad3.
Guo, D. and H. Wang, 2016: CMIP5 permafrost degradation projection: A comparison among different regions. Journal of Geophysical Research: Atmospheres, 121(9), 4499–4517, doi: 10.1002/2015jd024108.
Guo, H. et al., 2018: Spatial and temporal characteristics of droughts in Central Asia during 1966–2015. Science of the Total Environment, 624, 1523–1538, doi: 10.1016/j.scitotenv.2017.12.120.
Guo, J., G. Huang, X. Wang, Y. Li, and Q. Lin, 2018: Dynamically-downscaled projections of changes in temperature extremes over China. Climate Dynamics, 50(3–4), 1045–1066, doi: 10.1007/s00382-017-3660-7.
Guo, L. et al., 2020: Responses of Lake Ice Phenology to Climate Change at Tibetan Plateau. IEEE Journal of Selected Topics in Applied Earth Observations and Remote Sensing, 13, 3856–3861, doi: 10.1109/jstars.2020.3006270.
Guo, X., J. Huang, Y. Luo, Z. Zhao, and Y. Xu, 2017: Projection of heat waves over China for eight different global warming targets using 12 CMIP5 models. Theoretical and Applied Climatology, 128(3–4), 507–522, doi: 10.1007/s00704-015-1718-1.
Gupta, S., S. Kundu, and A. Mallik, 2012: Monitoring of Sag & Temperature in the Electrical Power Transmission lines. International Journal of Recent Technology and Engineering (IJRTE), 1(4), 43–45.
Gupta, V. and M.K. Jain, 2018: Investigation of multi-model spatiotemporal mesoscale drought projections over India under climate change scenario. Journal of Hydrology, 567, 489–509, doi: 10.1016/j.jhydrol.2018.10.012.
Gutiérrez, C. et al., 2020: Future evolution of surface solar radiation and photovoltaic potential in Europe: investigating the role of aerosols. Environmental Research Letters, 15(3), 34035, doi: 10.1088/1748-9326/ab6666.
Habeeb, D., J. Vargo, and B. Stone, 2015: Rising heat wave trends in large US cities. Natural Hazards, 76(3), 1651–1665, doi: 10.1007/s11069-014-1563-z.
Hackenbruch, J., T. Kunz-Plapp, S. Müller, and J. Schipper, 2017: Tailoring Climate Parameters to Information Needs for Local Adaptation to Climate Change. Climate, 5(2), 25, doi: 10.3390/cli5020025.
Hadji, R. et al., 2014: Climate change and its influence on shrinkage–swelling clays susceptibility in a semi-arid zone: a case study of Souk Ahras municipality, NE-Algeria. Desalination and Water Treatment, 52(10–12), 2057–2072, doi: 10.1080/19443994.2013.812989.
Haeberli, W., 2013: Mountain permafrost – research frontiers and a special long-term challenge. Cold Regions Science and Technology, 96, 71–76, doi: 10.1016/j.coldregions.2013.02.004.
Haeberli, W., Y. Schaub, and C. Huggel, 2017: Increasing risks related to landslides from degrading permafrost into new lakes in de-glaciating mountain ranges. Geomorphology, 293, 405–417, doi: 10.1016/j.geomorph.2016.02.009.
Haile, G.G. et al., 2020: Long-term spatiotemporal variation of drought patterns over the Greater Horn of Africa. Science of The Total Environment, 704, 135299, doi: 10.1016/j.scitotenv.2019.135299.
Haines, S., 2019: Managing expectations: articulating expertise in climate services for agriculture in Belize. Climatic Change, 157(1), 43–59, doi: 10.1007/s10584-018-2357-1.
Hajat, S., S. Vardoulakis, C. Heaviside, and B. Eggen, 2014: Climate change effects on human health: projections of temperature-related mortality for the UK during the 2020s, 2050s and 2080s. Journal of Epidemiology and Community Health, 68(7), 641–648, doi: 10.1136/jech-2013-202449.
Hall, J. et al., 2014: Understanding flood regime changes in Europe: A state-of-the-art assessment. Hydrology and Earth System Sciences, 18(7), 2735–2772, doi: 10.5194/hess-18-2735-2014.
Hall, T.M. and J.P. Kossin, 2019: Hurricane stalling along the North American coast and implications for rainfall. npj Climate and Atmospheric Science, 2(1), 17, doi: 10.1038/s41612-019-0074-8.
Hallegatte, S. and V. Przyluski, 2010: The economics of natural disasters: Concepts and methods. Policy Research Working Paper 5507, The World Bank, 29 pp., doi: 10.1596/1813-9450-5507.
Hallegatte, S., C. Green, R.J. Nicholls, and J. Corfee-Morlot, 2013: Future flood losses in major coastal cities. Nature Climate Change, 3(9), 802–806, doi: 10.1038/nclimate1979.
Hallegraeff, G. et al., 2014: Australian Dust Storm Associated with Extensive Aspergillus sydowiiFungal “Bloom” in Coastal Waters. Applied and Environmental Microbiology, 80(11), 3315–3320, doi: 10.1128/aem.04118-13.
Halpern, B.S. et al., 2015: Climate velocity and the future global redistribution of marine biodiversity. Nature Climate Change, 6(1), 83–88, doi: 10.1038/nclimate2769.
Hamann, A., D.R. Roberts, Q.E. Barber, C. Carroll, and S.E. Nielsen, 2015: Velocity of climate change algorithms for guiding conservation and management. Global Change Biology, 21(2), 997–1004, doi: 10.1111/gcb.12736.
Hamaoui-Laguel, L. et al., 2015: Effects of climate change and seed dispersal on airborne ragweed pollen loads in Europe. Nature Climate Change, 5(8), 766–771, doi: 10.1038/nclimate2652.
Hambly, D., J. Andrey, B. Mills, and C. Fletcher, 2013: Projected implications of climate change for road safety in Greater Vancouver, Canada. Climatic Change, 116(3–4), 613–629, doi: 10.1007/s10584-012-0499-0.
Hamilton, J.G. et al., 2005: Anthropogenic Changes in Tropospheric Composition Increase Susceptibility of Soybean to Insect Herbivory. Environmental Entomology, 34(2), 479–485, doi: 10.1603/0046-225x-34.2.479.
Hand, J.L. et al., 2016: Earlier onset of the spring fine dust season in the southwestern United States. Geophysical Research Letters, 43(8), 4001–4009, doi: 10.1002/2016gl068519.
Handwerger, A.L., M.-H. Huang, E.J. Fielding, A.M. Booth, and R. Bürgmann, 2019: A shift from drought to extreme rainfall drives a stable landslide to catastrophic failure. Scientific Reports, 9(1), 1569, doi: 10.1038/s41598-018-38300-0.
Hanes, C.C. et al., 2019: Fire-regime changes in Canada over the last half century. Canadian Journal of Forest Research, 49(3), 256–269, doi: 10.1139/cjfr-2018-0293.
Hanewinkel, M., D.A. Cullmann, M.-J. Schelhaas, G.-J. Nabuurs, and N.E. Zimmermann, 2013: Climate change may cause severe loss in the economic value of European forest land. Nature Climate Change, 3(3), 203–207, doi: 10.1038/nclimate1687.
Hansen, B.B. et al., 2014: Warmer and wetter winters: characteristics and implications of an extreme weather event in the High Arctic. Environmental Research Letters, 9(11), 114021, doi: 10.1088/1748-9326/9/11/114021.
Hansen, J. and M. Sato, 2016: Regional climate change and national responsibilities. Environmental Research Letters, 11(3), 034009, doi: 10.1088/1748-9326/11/3/034009.
Hansen, J.W. et al., 2019: Climate Services Can Support African Farmers’ Context-Specific Adaptation Needs at Scale. Frontiers in Sustainable Food Systems, 3, 21, doi: 10.3389/fsufs.2019.00021.
Hanzer, F., K. Förster, J. Nemec, and U. Strasser, 2018: Projected cryospheric and hydrological impacts of 21st century climate change in the Ötztal Alps (Austria) simulated using a physically based approach. Hydrology and Earth System Sciences, 22(2), 1593–1614, doi: 10.5194/hess-22-1593-2018.
Haque, U. et al., 2019: The human cost of global warming: Deadly landslides and their triggers (1995–2014). Science of The Total Environment, 682, 673–684, doi: 10.1016/j.scitotenv.2019.03.415.
Harley, M.D. et al., 2017: Extreme coastal erosion enhanced by anomalous extratropical storm wave direction. Scientific Reports, 7(1), 6033, doi: 10.1038/s41598-017-05792-1.
Harrington, L.J., D. Frame, A.D. King, and F.E.L. Otto, 2018: How Uneven Are Changes to Impact-Relevant Climate Hazards in a 1.5°C World and Beyond?Geophysical Research Letters, 45(13), 6672–6680, doi: 10.1029/2018gl078888.
Harrison, S. et al., 2018: Climate change and the global pattern of moraine-dammed glacial lake outburst floods. The Cryosphere, 12(4), 1195–1209, doi: 10.5194/tc-12-1195-2018.
Harvey, B.J., 2016: Human-caused climate change is now a key driver of forest fire activity in the western United States. Proceedings of the National Academy of Sciences, 113(42), 11649–11650, doi: 10.1073/pnas.1612926113.
Hassanzadeh, P. et al., 2020: Effects of climate change on the movement of future landfalling Texas tropical cyclones. Nature Communications, 11(1), 3319, doi: 10.1038/s41467-020-17130-7.
Hatfield, J.L. and J.H. Prueger, 2015: Temperature extremes: Effect on plant growth and development. Weather and Climate Extremes, 10, 4–10, doi: 10.1016/j.wace.2015.08.001.
Hatfield, J.L., C. Swanston, M. Janowiak, and R. Steele, 2015: USDA Midwest and Northern Forests Regional Climate Hub: Assessment of Climate Change Vulnerability and Adaptation and Mitigation Strategies [Anderson, T. (ed.)]. U.S. Department of Agriculture, 55 pp., www.climatehubs.oce.usda.gov/content/usda-midwest-and-northern-forests-regional-climate-hub-assessment-climate-change.
Hatfield, J.L. et al., 2011: Climate Impacts on Agriculture: Implications for Crop Production. Agronomy Journal, 103(2), 351, doi: 10.2134/agronj2010.0303.
Hatfield, J.L. et al., 2014: Ch. 6: Agriculture. In: Climate Change Impacts in the United States: The Third National Climate Assessment[Melillo, J.M., T.C. Richmond, and G.W. Yohe (eds.)]. U.S Global Change Research Program, pp. 150–174, doi: 10.7930/j02z13fr.
Hauer, M.E., J.M. Evans, and D.R. Mishra, 2016: Millions projected to be at risk from sea-level rise in the continental United States. Nature Climate Change, 6(7), 691–695, doi: 10.1038/nclimate2961.
Haumann, F.A., N. Gruber, M. Münnich, I. Frenger, and S. Kern, 2016: Sea-ice transport driving Southern Ocean salinity and its recent trends. Nature, 537(7618), 89–92, doi: 10.1038/nature19101.
Hawkins, E. and R. Sutton, 2012: Time of emergence of climate signals. Geophysical Research Letters, 39(1), L01702, doi: 10.1029/2011gl050087.
Hawkins, E. et al., 2020: Observed Emergence of the Climate Change Signal: From the Familiar to the Unknown. Geophysical Research Letters, 47(6), e2019GL086259, doi: 10.1029/2019gl086259.
Hayes, F., K. Sharps, H. Harmens, I. Roberts, and G. Mills, 2020: Tropospheric ozone pollution reduces the yield of African crops. Journal of Agronomy and Crop Science, 206(2), 214–228, doi: 10.1111/jac.12376.
Heaney, A.K., D. Carrión, K. Burkart, C. Lesk, and D. Jack, 2019: Climate Change and Physical Activity: Estimated Impacts of Ambient Temperatures on Bikeshare Usage in New York City. Environmental Health Perspectives, 127(3), 037002, doi: 10.1289/ehp4039.
Hellberg, R.S. and E. Chu, 2016: Effects of climate change on the persistence and dispersal of foodborne bacterial pathogens in the outdoor environment: A review. Critical Reviews in Microbiology, 42(4), 548–572, doi: 10.3109/1040841x.2014.972335.
Hemer, M.A., K.L. McInnes, and R. Ranasinghe, 2013: Projections of climate change-driven variations in the offshore wave climate off south eastern Australia. International Journal of Climatology, 33(7), 1615–1632, doi: 10.1002/joc.3537.
Henderson, G., 2016: Governing the Hazards of Climate: The Development of the National Climate Program Act, 1977–1981. Historical Studies in the Natural Sciences, 46(2), 207–242, doi: 10.1525/hsns.2016.46.2.207.
Hennessy, K. et al., 2007: Australia and New Zealand. In: Climate Change 2007: Impacts, Adaptation and Vulnerability. Contribution of Working Group II to the Fourth Assessment Report of the Intergovernmental Panel on Climate Change[Parry, M.L., O.F. Canziani, J.P. Palutikof, P.J. Linden, and C.E. Hanson (eds.)]. Cambridge University Press, Cambridge, United Kingdom and New York, NY, USA, pp. 507–540, www.ipcc.ch/report/ar4/wg2.
Henson, S.A. et al., 2017: Rapid emergence of climate change in environmental drivers of marine ecosystems. Nature Communications, 8(1), 14682, doi: 10.1038/ncomms14682.
Hermida, L. et al., 2015: Hailfall in southwest France: Relationship with precipitation, trends and wavelet analysis. Atmospheric Research, 156, 174–188, doi: 10.1016/j.atmosres.2015.01.005.
Herold, N., M. Ekström, J. Kala, J. Goldie, and J.P. Evans, 2018: Australian climate extremes in the 21st century according to a regional climate model ensemble: Implications for health and agriculture. Weather and Climate Extremes, 20, 54–68, doi: 10.1016/j.wace.2018.01.001.
Heron, S.F., J.A. Maynard, R. van Hooidonk, and C.M. Eakin, 2016: Warming Trends and Bleaching Stress of the World’s Coral Reefs 1985–2012. Scientific Reports, 6(1), 38402, doi: 10.1038/srep38402.
Herrera, D. and T. Ault, 2017: Insights from a New High-Resolution Drought (Atlas for the Caribbean Spanning 1950–2016. Journal of Climate, 30, 7801–7825, doi: 10.1175/jcli-d-16-0838.1.
Herrera-Pantoja, M. and K.M. Hiscock, 2015: Projected impacts of climate change on water availability indicators in a semi-arid region of central Mexico. Environmental Science & Policy, 54, 81–89, doi: 10.1016/j.envsci.2015.06.020.
Herring, S.C. et al., 2018: Explaining Extreme Events of 2016 from a Climate Perspective. Bulletin of the American Meteorological Society, 99(1), S1–S157, doi: 10.1175/bams-explainingextremeevents2016.1.
Hettiarachchi, S., C. Wasko, and A. Sharma, 2018: Increase in flood risk resulting from climate change in a developed urban watershed – the role of storm temporal patterns. Hydrology and Earth System Sciences, 22(3), 2041–2056, doi: 10.5194/hess-22-2041-2018.
Hewer, M.J. and W.A. Gough, 2019: Lake Ontario ice coverage: Past, present and future. Journal of Great Lakes Research, 45(6), 1080–1089, doi: 10.1016/j.jglr.2019.10.006.
Hewitson, B., K. Waagsaether, J. Wohland, K. Kloppers, and T. Kara, 2017: Climate information websites: an evolving landscape. WIREs Climate Change, 8(5), e470, doi: 10.1002/wcc.470.
Hewitt, C.D. and N. Golding, 2018: Development and Pull-through of Climate Science to Services in China. Advances in Atmospheric Sciences, 35(8), 905–908, doi: 10.1007/s00376-018-7255-y.
Hewitt, C.D. and J.A. Lowe, 2018: Toward a European Climate Prediction System. Bulletin of the American Meteorological Society, 99(10), 1997–2001, doi: 10.1175/bams-d-18-0022.1.
Hewitt, C.D., S. Mason, and D. Walland, 2012: The Global Framework for Climate Services. Nature Climate Change, 2(12), 831–832, doi: 10.1038/nclimate1745.
Hewitt, C.D., R.C. Stone, and A.B. Tait, 2017a: Improving the use of climate information in decision-making. Nature Climate Change, 7(9), 614–616, doi: 10.1038/nclimate3378.
Hewitt, C.D. et al., 2017b: Climate Observations, Climate Modeling, and Climate Services. Bulletin of the American Meteorological Society, 98(7), 1503–1506, doi: 10.1175/bams-d-17-0012.1.
Hewitt, C.D. et al., 2020a: Making Society Climate Resilient: International Progress under the Global Framework for Climate Services. Bulletin of the American Meteorological Society, 101(2), E237–E252, doi: 10.1175/bams-d-18-0211.1.
Hewitt, C.D. et al., 2020b: The Process and Benefits of Developing Prototype Climate Services – Examples in China. Journal of Meteorological Research, 34(5), 893–903, doi: 10.1007/s13351-020-0042-6.
Hewitt, C.D. et al., 2021: Recommendations for Future Research Priorities for Climate Modeling and Climate Services. Bulletin of the American Meteorological Society, 102(3), E578–E588, doi: 10.1175/bams-d-20-0103.1.
Hidalgo, H.G., E.J. Alfaro, and B. Quesada-Montano, 2017: Observed (1970–1999) climate variability in Central America using a high-resolution meteorological dataset with implication to climate change studies. Climatic Change, 141(1), 13–28, doi: 10.1007/s10584-016-1786-y.
Hill, R.A., C.P. Hawkins, and J. Jin, 2014: Predicting thermal vulnerability of stream and river ecosystems to climate change. Climatic Change, 125( 3–4), 399–412, doi: 10.1007/s10584-014-1174-4.
Hincapie, J.C.A. and J.D.P. Caicedo, 2013: El cambio climático y la distribución espacial de las formaciones vegetales en Colombia. Colombia forestal, 16(2), 171–185, doi: 10.14483/udistrital.jour.colomb.for.2013.2.a04.
Hinkel, J. et al., 2013: A global analysis of erosion of sandy beaches and sea-level rise: An application of DIVA. Global and Planetary Change, 111, 150–158, doi: 10.1016/j.gloplacha.2013.09.002.
Hinkel, J. et al., 2018: The ability of societies to adapt to twenty-first-century sea-level rise. Nature Climate Change, 8(7), 570–578, doi: 10.1038/s41558-018-0176-z.
Hirabayashi, Y. et al., 2013: Global flood risk under climate change. Nature Climate Change, 3(9), 816–821, doi: 10.1038/nclimate1911.
Hixson, S.M. and M.T. Arts, 2016: Climate warming is predicted to reduce omega-3, long-chain, polyunsaturated fatty acid production in phytoplankton. Global Change Biology, 22(8), 2744–2755, doi: 10.1111/gcb.13295.
Hjort, J. et al., 2018: Degrading permafrost puts Arctic infrastructure at risk by mid-century. Nature Communications, 9(1), 5147, doi: 10.1038/s41467-018-07557-4.
Ho, K., S. Lacasse, and L. Picarelli (eds.), 2017: Slope Safety Preparedness for Impact of Climate Change. CRC Press, London, UK, 590 pp., doi: 10.1201/9781315387789.
Hoa, E., 2018: From generating to using climate services – how the EU-MACS and MARCO projects help to unlock the market potential. Climate Services, 11, 86–88, doi: 10.1016/j.cliser.2018.08.001.
Hobday, A.J. et al., 2016: A hierarchical approach to defining marine heatwaves. Progress in Oceanography, 141, 227–238, doi: 10.1016/j.pocean.2015.12.014.
Hochman, A., T. Harpaz, H. Saaroni, and P. Alpert, 2018: The seasons’ length in 21st century CMIP5 projections over the eastern Mediterranean. International Journal of Climatology, 38(6), 2627–2637, doi: 10.1002/joc.5448.
Hock, R. et al., 2019: High Mountain Areas. In: IPCC Special Report on the Ocean and Cryosphere in a Changing Climate[Pörtner, H.-O., D.C. Roberts, V. Masson-Delmotte, P. Zhai, M. Tignor, E. Poloczanska, K. Mintenbeck, A. Alegría, M. Nicolai, A. Okem, J. Petzold, B. Rama, and N.M. Weyer (eds.)]. In Press, pp. 131–202, www.ipcc.ch/srocc/chapter/chapter-2.
Hodgkins, G.A., R.W. Dudley, S.A. Archfield, and B. Renard, 2019: Effects of climate, regulation, and urbanization on historical flood trends in the United States. Journal of Hydrology, 573, 697–709, doi: 10.1016/j.jhydrol.2019.03.102.
Hoegh-Guldberg, O. and J.F. Bruno, 2010: The Impact of Climate Change on the World’s Marine Ecosystems. Science, 328(5985), 1523–1528, doi: 10.1126/science.1189930.
Hoegh-Guldberg, O., E.S. Poloczanska, W. Skirving, and S. Dove, 2017: Coral Reef Ecosystems under Climate Change and Ocean Acidification. Frontiers in Marine Science, 4, 158, doi: 10.3389/fmars.2017.00158.
Hoegh-Guldberg, O. et al., 2018: Impacts of 1.5°C Global Warming on Natural and Human Systems. In: Global Warming of 1.5°C. An IPCC Special Report on the impacts of global warming of 1.5°C above pre-industrial levels and related global greenhouse gas emission pathways, in the context of strengthening the global response to the threat of climate change, sustainable development and efforts to eradicate poverty[Masson-Delmotte, V., P. Zhai, H.-O. Pörtner, D. Roberts, J. Skea, P.R. Shukla, A. Pirani, W. Moufouma-Okia, C. Péan, R. Pidcock, S. Connors, J.B.R. Matthews, Y. Chen, X. Zhou, M.I. Gomis, E. Lonnoy, T. Maycock, M. Tignor, and T. Waterfield (eds.)]. In Press, pp. 175–312, www.ipcc.ch/sr15/chapter/chapter-3.
Hoeke, R.K. et al., 2013: Widespread inundation of Pacific islands triggered by distant-source wind-waves. Global and Planetary Change, 108, 128–138, doi: 10.1016/j.gloplacha.2013.06.006.
Hof, A.R. and A. Svahlin, 2016: The potential effect of climate change on the geographical distribution of insect pest species in the Swedish boreal forest. Scandinavian Journal of Forest Research, 31(1), 29–39, doi: 10.1080/02827581.2015.1052751.
Holding, S. et al., 2016: Groundwater vulnerability on small islands. Nature Climate Change, 6(12), 1100–1103, doi: 10.1038/nclimate3128.
Holland, G. and C.L. Bruyère, 2014: Recent intense hurricane response to global climate change. Climate Dynamics, 42(3–4), 617–627, doi: 10.1007/s00382-013-1713-0.
Hong, J.-W., J. Hong, E.E. Kwon, and D.K. Yoon, 2019: Temporal dynamics of urban heat island correlated with the socio-economic development over the past half-century in Seoul, Korea. Environmental Pollution, 254, 112934, doi: 10.1016/j.envpol.2019.07.102.
Hope, P. et al., 2019: On Determining the Impact of Increasing Atmospheric CO2 on the Record Fire Weather in Eastern Australia in February 2017. Bulletin of the American Meteorological Society, 100(1), S111–S117, doi: 10.1175/bams-d-18-0135.1.
Horton, D.E., C.B. Skinner, D. Singh, and N.S. Diffenbaugh, 2014: Occurrence and persistence of future atmospheric stagnation events. Nature Climate Change, 4(8), 698–703, doi: 10.1038/nclimate2272.
Howarth, C. and J. Painter, 2016: Exploring the science–policy interface on climate change: The role of the IPCC in informing local decision-making in the UK. Palgrave Communications, 2(1), 16058, doi: 10.1057/palcomms.2016.58.
Howell, S.E.L., F. Laliberté, R. Kwok, C. Derksen, and J. King, 2016: Landfast ice thickness in the Canadian Arctic Archipelago from observations and models. The Cryosphere, 10(4), 1463–1475, doi: 10.5194/tc-10-1463-2016.
Hoyos, N., J. Escobar, J.C. Restrepo, A.M. Arango, and J.C. Ortiz, 2013: Impact of the 2010–2011 La Niña phenomenon in Colombia, South America: The human toll of an extreme weather event. Applied Geography, 39, 16–25, doi: 10.1016/j.apgeog.2012.11.018.
Hrbáček, F. et al., 2018: Active layer monitoring in Antarctica: an overview of results from 2006 to 2015. Polar Geography, 44(3), 217-231, doi: 10.1080/1088937x.2017.1420105.
Hu, F.S. et al., 2015: Arctic tundra fires: natural variability and responses to climate change. Frontiers in Ecology and the Environment, 13(7), 369–377, doi: 10.1890/150063.
Huang, A. et al., 2014: Changes of the Annual Precipitation over Central Asia in the Twenty-First Century Projected by Multimodels of CMIP5. Journal of Climate, 27(17), 6627–6646, doi: 10.1175/jcli-d-14-00070.1.
Huang, J., H. Yu, X. Guan, G. Wang, and R. Guo, 2016a: Accelerated dryland expansion under climate change. Nature Climate Change, 6(2), 166–171, doi: 10.1038/nclimate2837.
Huang, J. et al., 2016b: Global semi-arid climate change over last 60 years. Climate Dynamics, 46(3–4), 1131–1150, doi: 10.1007/s00382-015-2636-8.
Huang, J. et al., 2017: Dryland climate change: Recent progress and challenges. Reviews of Geophysics, 55(3), 719–778, doi: 10.1002/2016rg000550.
Hubbard, D.K., R.B. Burke, and I.P. Gill, 2008: Coral-reef geology: Puerto Rico and the US Virgin islands. In: Coral Reefs of the USA[Riegl, B.M. and R.E. Dodge (eds.)]. Springer, Dordrecht, The Netherlands, pp. 263–302, doi: 10.1007/978-1-4020-6847-8_7.
Hueging, H., R. Haas, K. Born, D. Jacob, and J.G. Pinto, 2013: Regional Changes in Wind Energy Potential over Europe Using Regional Climate Model Ensemble Projections. Journal of Applied Meteorology and Climatology, 52(4), 903–917, doi: 10.1175/jamc-d-12-086.1.
Hufkens, K. et al., 2012: Ecological impacts of a widespread frost event following early spring leaf-out. Global Change Biology, 18(7), 2365–2377, doi: 10.1111/j.1365-2486.2012.02712.x.
Hughes, T.P. et al., 2017a: Coral reefs in the Anthropocene. Nature, 546(7656), 82–90, doi: 10.1038/nature22901.
Hughes, T.P. et al., 2017b: Global warming and recurrent mass bleaching of corals. Nature, 543(7645), 373–377, doi: 10.1038/nature21707.
Hughes, T.P. et al., 2018a: Spatial and temporal patterns of mass bleaching of corals in the Anthropocene. Science, 359(6371), 80–83, doi: 10.1126/science.aan8048.
Hughes, T.P. et al., 2018b: Global warming transforms coral reef assemblages. Nature, 556(7702), 492–496, doi: 10.1038/s41586-018-0041-2.
Humphrey, V. et al., 2018: Sensitivity of atmospheric CO2 growth rate to observed changes in terrestrial water storage. Nature, 560(7720), 628–631, doi: 10.1038/s41586-018-0424-4.
Hurlbert, M. et al., 2019: Risk management and decision making in relation to sustainable development. In: Climate Change and Land: an IPCC special report on climate change, desertification, land degradation, sustainable land management, food security, and greenhouse gas fluxes in terrestrial ecosystems[P.R. Shukla, J. Skea, E.C. Buendia, V. Masson-Delmotte, H.-O. Pörtner, D.C. Roberts, P. Zhai, R. Slade, S. Connors, R. Diemen, M. Ferrat, E. Haughey, S. Luz, S. Neogi, M. Pathak, J. Petzold, J.P. Pereira, P. Vyas, E. Huntley, K. Kissick, M. Belkacemi, and J. Malley (eds.)]. In Press, pp. 673–800, www.ipcc.ch/srccl/chapter/chapter-7.
Huss, M. and R. Hock, 2018: Global-scale hydrological response to future glacier mass loss. Nature Climate Change, 8(2), 135–140, doi: 10.1038/s41558-017-0049-x.
ICOMOS, 2019: The Future of Our Pasts: Engaging cultural heritage in climate action. International Council on Monuments and Sites (ICOMOS) Climate Change and Heritage Working Group, Paris, France, 110 pp., https://adobeindd.com/view/publications/a9a551e3-3b23-4127-99fd-a7a80d91a29e/g18m/publication-web-resources/pdf/CCHWG_final_print.pdf .
Im, E.-S., J.S. Pal, and E.A.B. Eltahir, 2017: Deadly heat waves projected in the densely populated agricultural regions of South Asia. Science Advances, 3(8), e1603322, doi: 10.1126/sciadv.1603322.
Im, E.-S. et al., 2021: Emergence of robust anthropogenic increase of heat stress-related variables projected from CORDEX-CORE climate simulations. Climate Dynamics, 57(5–6), 1629–1644, doi: 10.1007/s00382-020-05398-w.
Imada, Y., M. Watanabe, H. Kawase, H. Shiogama, and M. Arai, 2019: The July 2018 High Temperature Event in Japan Could Not Have Happened without Human-Induced Global Warming. SOLA, 15A, 8–12, doi: 10.2151/sola.15a-002.
Imada, Y. et al., 2018: Climate Change Increased the Likelihood of the 2016 Heat Extremes in Asia. Bulletin of the American Meteorological Society, 99(1), S97–S101, doi: 10.1175/bams-d-17-0109.1.
Potts, S.G., V.L. Imperatriz-Fonseca, and H.T. Ngo (eds.), 2016: The assessment report of the Intergovernmental Science-Policy Platform on Biodiversity and Ecosystem Services on pollinators, pollination and food production. Secretariat of the Intergovernmental Science-Policy Platform on Biodiversity and Ecosystem Services, Bonn, Germany, 552 pp., doi: 10.5281/zenodo.3402856.
IPCC, 2012: Summary for Policymakers. In: Managing the Risks of Extreme Events and Disasters to Advance Climate Change Adaptation[Field, C.B., V. Barros, T.F. Stocker, D. Qin, D.J. Dokken, K.L. Ebi, M.D. Mastrandrea, K.J. Mach, G.-K. Plattner, S.K. Allen, M. Tignor, and P.M. Midgle (eds.)]. Cambridge University Press, Cambridge, United Kingdom and New York, NY, USA, pp. 3–22, doi: 10.1017/cbo9781139177245.003.
IPCC, 2013: Climate Change 2013: The Physical Science Basis. Contribution of Working Group I to the Fifth Assessment Report of the Intergovernmental Panel on Climate Change [Stocker, T.F., D. Qin, G.-K. Plattner, M. Tignor, S.K. Allen, J. Boschung, A. Nauels, Y. Xia, V. Bex, and P.M. Midgley (eds.)]. Cambridge University Press, Cambridge, United Kingdom and New York, NY, USA, 1535 pp., doi: 10.1017/cbo9781107415324.
IPCC, 2014a: Climate Change 2014: Impacts, Adaptation, and Vulnerability. Part A: Global and Sectoral Aspects. Contribution of Working Group II to the Fifth Assessment Report of the Intergovernmental Panel on Climate Change [Field, C.B., V.R. Barros, D.J. Dokken, K.J. Mach, M.D. Mastrandrea, T.E. Bilir, M. Chatterjee, K.L. Ebi, Y.O. Estrada, R.C. Genova, B. Girma, E.S. Kissel, A.N. Levy, S. MacCracken, P.R. Mastrandrea, and L.L. White (eds.)]. Cambridge University Press, Cambridge, UK and New York, NY, USA, 1132 pp., doi: 10.1017/cbo9781107415379.
IPCC, 2014b: Climate Change 2014: Impacts, Adaptation, and Vulnerability. Part B: Regional Aspects. Contribution of Working Group II to the Fifth Assessment Report of the Intergovernmental Panel on Climate Change [Barros, V.R., C.B. Field, D.J. Dokken, M.D. Mastrandrea, K.J. Mach, T.E. Bilir, M. Chatterjee, K.L. Ebi, Y.O. Estrada, R.C. Genova, B. Girma, E.S. Kissel, A.N. Levy, S. MacCracken, P.R. Mastrandrea, and L.L. White (eds.)]. Cambridge University Press, Cambridge, United Kingdom and New York, NY, USA, 688 pp., doi: 10.1017/cbo9781107415386.
IPCC, 2018: Global warming of 1.5°C. An IPCC Special Report on the impacts of global warming of 1.5°C above pre-industrial levels and related global greenhouse gas emission pathways, in the context of strengthening the global response to the threat of climate change, sustainable development and efforts to eradicate poverty [Masson-Delmotte, V., P. Zhai, H.-O. Pörtner, D. Roberts, J. Skea, P.R. Shukla, A. Pirani, W. Moufouma-Okia, C. Péan, R. Pidcock, S. Connors, J.B.R. Matthews, Y. Chen, X. Zhou, M.I. Gomis, E. Lonnoy, T. Maycock, M. Tignor, and T. Waterfield (eds.)]. In Press, 616 pp., www.ipcc.ch/sr15.
IPCC, 2019a: Climate Change and Land: an IPCC special report on climate change, desertification, land degradation, sustainable land management, food security, and greenhouse gas fluxes in terrestrial ecosystems [Shukla, P.R., J. Skea, E.C. Buendia, V. Masson-Delmotte, H.-O. Pörtner, D.C. Roberts, P. Zhai, R. Slade, S. Connors, R. Diemen, M. Ferrat, E. Haughey, S. Luz, S. Neogi, M. Pathak, J. Petzold, J.P. Pereira, P. Vyas, E. Huntley, K. Kissick, M. Belkacemi, and J. Malley (eds.)]. In Press, 896 pp., www.ipcc.ch/srccl.
IPCC, 2019b: IPCC Special Report on the Ocean and Cryosphere in a Changing Climate [Pörtner, H.-O., D.C. Roberts, V. Masson-Delmotte, P. Zhai, M. Tignor, E. Poloczanska, K. Mintenbeck, A. Alegría, M. Nicolai, A. Okem, J. Petzold, B. Rama, and N.M. Weyer (eds.)]. In Press, 755 pp., www.ipcc.ch/report/srocc.
IPCC, 2019c: Summary for Policymakers. In: Climate Change and Land: an IPCC special report on climate change, desertification, land degradation, sustainable land management, food security, and greenhouse gas fluxes in terrestrial ecosystems[Shukla, P.R., J. Skea, E.C. Buendia, V. Masson-Delmotte, H.-O. Pörtner, D.C. Roberts, P. Zhai, R. Slade, S. Connors, R. Diemen, M. Ferrat, E. Haughey, S. Luz, S. Neogi, M. Pathak, J. Petzold, J.P. Pereira, P. Vyas, E. Huntley, K. Kissick, M. Belkacemi, and J. Malley (eds.)]. In Press, pp. 3–36, www.ipcc.ch/srccl/chapter/summary-for-policymakers.
Irannezhad, M., A.K. Ronkanen, S. Kiani, D. Chen, and B. Kløve, 2017: Long-term variability and trends in annual snowfall/total precipitation ratio in Finland and the role of atmospheric circulation patterns. Cold Regions Science and Technology, 143, 23–31, doi: 10.1016/j.coldregions.2017.08.008.
Iribarren Anacona, P., A. Mackintosh, and K.P. Norton, 2015: Hazardous processes and events from glacier and permafrost areas: lessons from the Chilean and Argentinean Andes. Earth Surface Processes and Landforms, 40(1), 2–21, doi: 10.1002/esp.3524.
Islam, S., S.J. Déry, and A.T. Werner, 2017: Future Climate Change Impacts on Snow and Water Resources of the Fraser River Basin, British Columbia. Journal of Hydrometeorology, 18(2), 473–496, doi: 10.1175/jhm-d-16-0012.1.
Izaguirre, C., I.J. Losada, P. Camus, J.L. Vigh, and V. Stenek, 2021: Climate change risk to global port operations. Nature Climate Change, 11(1), 14–20, doi: 10.1038/s41558-020-00937-z.
Jack, C.D., R. Jones, L. Burgin, and J. Daron, 2020: Climate risk narratives: An iterative reflective process for co-producing and integrating climate knowledge. Climate Risk Management, 29, 100239, doi: 10.1016/j.crm.2020.100239.
Jacob, D., 2020: Future Trends in Climate Services. In: Handbook of Climate Services: Climate Change Management[Leal Filho, W. and D. Jacob (eds.)]. Springer, Cham, Switzerland, pp. 515–519, doi: 10.1007/978-3-030-36875-3_26.
Jacob, D. and S. Solman, 2017: IMPACT2C – An introduction. Climate Services, 7, 1–2, doi: 10.1016/j.cliser.2017.07.006.
Jacob, D. et al., 2014: EURO-CORDEX: new high-resolution climate change projections for European impact research. Regional Environmental Change, 14(2), 563–578, doi: 10.1007/s10113-013-0499-2.
Jacob, D. et al., 2018: Climate Impacts in Europe Under +1.5°C Global Warming. Earth’s Future, 6(2), 264–285, doi: 10.1002/2017ef000710.
Jacobs, J., S.K. Moore, K.E. Kunkel, and L. Sun, 2015: A framework for examining climate-driven changes to the seasonality and geographical range of coastal pathogens and harmful algae. Climate Risk Management, 8, 16–27, doi: 10.1016/j.crm.2015.03.002.
Jacobs, J.M. et al., 2018: Transportation. In: Impacts, Risks, and Adaptation in the United States: Fourth National Climate Assessment, Volume II[Reidmiller, D.R., C.W. Avery, D.R. Easterling, K.E. Kunkel, K.L.M. Lewis, T.K. Maycock, and B.C. Stewar (eds.)]. U.S. Global Change Research Program, Washington, DC, USA, pp. 479–511, doi: 10.7930/nca4.2018.ch12.
Jacobs, K.L. and R.B. Street, 2020: The next generation of climate services. Climate Services, 20, 100199, doi: 10.1016/j.cliser.2020.100199.
Jahn, A., 2018: Reduced probability of ice-free summers for 1.5°C compared to 2°C warming. Nature Climate Change, 8(5), 409–413, doi: 10.1038/s41558-018-0127-8.
Jain, P., X. Wang, and M.D. Flannigan, 2017: Trend analysis of fire season length and extreme fire weather in North America between 1979 and 2015. International Journal of Wildland Fire, 26(12), 1009, doi: 10.1071/wf17008.
Jain, P., M.R. Tye, D. Paimazumder, and M. Flannigan, 2020: Downscaling fire weather extremes from historical and projected climate models. Climatic Change, 163(1), 189–216, doi: 10.1007/s10584-020-02865-5.
Jakob, D. and D. Walland, 2016: Variability and long-term change in Australian temperature and precipitation extremes. Weather and Climate Extremes, 14, 36–55, doi: 10.1016/j.wace.2016.11.001.
Jancloes, M. et al., 2014: Climate services to improve public health. International Journal of Environmental Research and Public Health, 11(5), 4555–4559, doi: 10.3390/ijerph110504555.
Janoski, T.P., A.J. Broccoli, S.B. Kapnick, and N.C. Johnson, 2018: Effects of Climate Change on Wind-Driven Heavy-Snowfall Events over Eastern North America. Journal of Climate, 31(22), 9037–9054, doi: 10.1175/jcli-d-17-0756.1.
Javed, W., Y. Wubulikasimu, B. Figgis, and B. Guo, 2017: Characterization of dust accumulated on photovoltaic panels in Doha, Qatar. Solar Energy, 142, 123–135, doi: 10.1016/j.solener.2016.11.053.
Jenouvrier, S. et al., 2014: Projected continent-wide declines of the emperor penguin under climate change. Nature Climate Change, 4(8), 715–718, doi: 10.1038/nclimate2280.
Jeong, D. and L. Sushama, 2018a: Projected changes to extreme wind and snow environmental loads for buildings and infrastructure across Canada. Sustainable Cities and Society, 36, 225–236, doi: 10.1016/j.scs.2017.10.004.
Jeong, D. and L. Sushama, 2018b: Rain-on-snow events over North America based on two Canadian regional climate models. Climate Dynamics, 50( 1–2), 303–316, doi: 10.1007/s00382-017-3609-x.
Jerez, S. et al., 2015: The impact of climate change on photovoltaic power generation in Europe. Nature Communications, 6(1), 10014, doi: 10.1038/ncomms10014.
Jézéquel, A., P. Yiou, and J.-P. Vanderlinden, 2019: Comparing scientists and delegates perspectives on the use of extreme event attribution for loss and damage. Weather and Climate Extremes, 26, 100231, doi: 10.1016/j.wace.2019.100231.
Jézéquel, A. et al., 2020: Singular Extreme Events and Their Attribution to Climate Change: A Climate Service-Centered Analysis. Weather, Climate, and Society, 12(1), 89–101, doi: 10.1175/wcas-d-19-0048.1.
Ji, Z., G. Wang, M. Yu, and J.S. Pal, 2018: Potential climate effect of mineral aerosols over West Africa: Part II – contribution of dust and land cover to future climate change. Climate Dynamics, 50(7–8), 2335–2353, doi: 10.1007/s00382-015-2792-x.
Jiang, J., T. Zhou, X. Chen, and L. Zhang, 2020: Future changes in precipitation over Central Asia based on CMIP6 projections. Environmental Research Letters, 15(5), 54009, doi: 10.1088/1748-9326/ab7d03.
Jiang, L. et al., 2018: Increased temperature mitigates the effects of ocean acidification on the calcification of juvenile Pocillopora damicornis, but at a cost. Coral Reefs, 37(1), 71–79, doi: 10.1007/s00338-017-1634-1.
Jickells, T.D. et al., 2005: Global iron connections between desert dust, ocean biogeochemistry, and climate. Science, 308(5718), 67–71, doi: 10.1126/science.1105959.
Jin, L. et al., 2018: Modeling future flows of the Volta River system: Impacts of climate change and socio-economic changes. Science of The Total Environment, 637–638, 1069–1080, doi: 10.1016/j.scitotenv.2018.04.350.
Jin, Y. et al., 2015: Identification of two distinct fire regimes in Southern California: implications for economic impact and future change. Environmental Research Letters, 10(9), 094005, doi: 10.1088/1748-9326/10/9/094005.
Johnson, C.W., Y. Fu, and R. Bürgmann, 2017: Seasonal water storage, stress modulation, and California seismicity. Science, 356(6343), 1161–1164, doi: 10.1126/science.aak9547.
Jolly, W.M. et al., 2015: Climate-induced variations in global wildfire danger from 1979 to 2013. Nature Communications, 6(1), 7537, doi: 10.1038/ncomms8537.
Jones, B., C. Tebaldi, B.C. O’Neill, K. Oleson, and J. Gao, 2018: Avoiding population exposure to heat-related extremes: demographic change vs climate change. Climatic Change, 146(3–4), 423–437, doi: 10.1007/s10584-017-2133-7.
Jones, C. and L.M. Carvalho, 2013: Climate Change in the South American Monsoon System: Present Climate and CMIP5 Projections. Journal of Climate, 26(17), 6660–6678, doi: 10.1175/jcli-d-12-00412.1.
Jones, J. and M.T. Brett, 2014: Lake Nutrients, Eutrophication, and Climate Change. In: Global Environmental Change[Freedman, B. (ed.)]. Springer, Dordrecht, The Netherlands, pp. 273–279, doi: 10.1007/978-94-007-5784-4_109.
Jones, R.N. et al., 2014: Foundations for decision making. In: Climate Change 2014: Impacts, Adaptation, and Vulnerability. Part A: Global and Sectoral Aspects. Contribution of Working Group II to the Fifth Assessment Report of the Intergovernmental Panel on Climate Change[Field, C.B., V.R. Barros, D.J. Dokken, K.J. Mach, M.D. Mastrandrea, T.E. Bilir, M. Chatterjee, K.L. Ebi, Y.O. Estrada, R.C. Genova, B. Girma, E.S. Kissel, A.N. Levy, S. MacCracken, P.R. Mastrandrea, and L.L. White (eds.)]. Cambridge University Press, Cambridge, United Kingdom and New York, NY, USA, pp. 195–228, doi: 10.1017/cbo9781107415379.007.
Jongejan, R., R. Ranasinghe, D. Wainwright, D.P. Callaghan, and J. Reyns, 2016: Drawing the line on coastline recession risk. Ocean & Coastal Management, 122, 87–94, doi: 10.1016/j.ocecoaman.2016.01.006.
Jung, C. and D. Schindler, 2019: Changing wind speed distributions under future global climate. Energy Conversion and Management, 198, 111841, doi: 10.1016/j.enconman.2019.111841.
Jurchescu, M. et al., 2017: An approach to investigate the effects of climate change on landslide hazard at a national scale (Romania). In: Proceedings of the 33rd Romanian Geomorphology Symposium. Alexandru Ioan Cuza University of Iași Press, Iași, pp. 121–124, doi: 10.15551/prgs.2017.121.
Jyrkama, M.I. and J.F. Sykes, 2007: The impact of climate change on spatially varying groundwater recharge in the grand river watershed (Ontario). Journal of Hydrology, 338(3–4), 237–250, doi: 10.1016/j.jhydrol.2007.02.036.
Kalvelage, K., U. Passe, S. Rabideau, and E.S. Takle, 2014: Changing climate: The effects on energy demand and human comfort. Energy and Buildings, 76, 373–380, doi: 10.1016/j.enbuild.2014.03.009.
Kämäräinen, M. et al., 2018: Estimates of Present-Day and Future Climatologies of Freezing Rain in Europe Based on CORDEX Regional Climate Models. Journal of Geophysical Research: Atmospheres, 123(23), 13291–13304, doi: 10.1029/2018jd029131.
Kapitsa, V., M. Shahgedanova, H. Machguth, I. Severskiy, and A. Medeu, 2017: Assessment of evolution and risks of glacier lake outbursts in the Djungarskiy Alatau, Central Asia, using Landsat imagery and glacier bed topography modelling. Natural Hazards and Earth System Sciences, 17(10), 1837–1856, doi: 10.5194/nhess-17-1837-2017.
Karnauskas, K.B., J.P. Donnelly, and K.J. Anchukaitis, 2016: Future freshwater stress for island populations. Nature Climate Change, 6(7), 720–725, doi: 10.1038/nclimate2987.
Karnauskas, K.B., J.K. Lundquist, and L. Zhang, 2018a: Southward shift of the global wind energy resource under high carbon dioxide emissions. Nature Geoscience, 11(1), 38–43, doi: 10.1038/s41561-017-0029-9.
Karnauskas, K.B., C.-F. Schleussner, J.P. Donnelly, and K.J. Anchukaitis, 2018b: Freshwater stress on small island developing states: population projections and aridity changes at 1.5 and 2°C. Regional Environmental Change, 18, 2273–2282, doi: 10.1007/s10113-018-1331-9.
Karremann, M.K., J.G. Pinto, M. Reyers, and M. Klawa, 2014: Return periods of losses associated with European windstorm series in a changing climate. Environmental Research Letters, 9(12), 124016, doi: 10.1088/1748-9326/9/12/124016.
Karymbalis, E. et al., 2012: Assessment of the sensitivity of the southern coast of the Gulf of Corinth (Peloponnese, Greece) to sea-level rise. Open Geosciences, 4(4), 561–577, doi: 10.2478/s13533-012-0101-3.
Kattsov, V.M., I.M. Shkolnik, and S. Efimov, 2017: Climate change projections in Russian regions: The detailing in physical and probability spaces. Russian Meteorology and Hydrology, 42(7), 452–460, doi: 10.3103/s1068373917070044.
Kawase, H. et al., 2016: Enhancement of heavy daily snowfall in central Japan due to global warming as projected by large ensemble of regional climate simulations. Climatic Change, 139(2), 265–278, doi: 10.1007/s10584-016-1781-3.
Kawase, H. et al., 2020: Changes in extremely heavy and light snow-cover winters due to global warming over high mountainous areas in central Japan. Progress in Earth and Planetary Science, 7(1), 10, doi: 10.1186/s40645-020-0322-x.
Kazemzadeh, M. and A. Malekian, 2016: Spatial characteristics and temporal trends of meteorological and hydrological droughts in northwestern Iran. Natural Hazards, 80(1), 191–210, doi: 10.1007/s11069-015-1964-7.
Keele, S., 2019: Consultants and the business of climate services: implications of shifting from public to private science. Climatic Change, 157(1), 9–26, doi: 10.1007/s10584-019-02385-x.
Keener, V. et al., 2018: Hawai‘i and U.S.-Affiliated Pacific Islands. In: Impacts, Risks, and Adaptation in the United States: Fourth National Climate Assessment, Volume II[Reidmiller, D.R., C.W. Avery, D.R. Easterling, K.E. Kunkel, K.L.M. Lewis, T.K. Maycock, and B.C. Stewart (eds.)]. U.S. Global Change Research Program, Washington, DC, USA, pp. 1242–1308, doi: 10.7930/nca4.2018.ch27.
Kefi, M., B.K. Mishra, Y. Masago, and K. Fukushi, 2020: Analysis of flood damage and influencing factors in urban catchments: case studies in Manila, Philippines, and Jakarta, Indonesia. Natural Hazards, 104(3), 2461–2487, doi: 10.1007/s11069-020-04281-5.
Kelley, C.P., S. Mohtadi, M.A. Cane, R. Seager, and Y. Kushnir, 2015: Climate change in the Fertile Crescent and implications of the recent Syrian drought. Proceedings of the National Academy of Sciences, 112(11), 3241–3246, doi: 10.1073/pnas.1421533112.
Kent, S.T., L.A. McClure, B.F. Zaitchik, T.T. Smith, and J.M. Gohlke, 2014: Heat Waves and Health Outcomes in Alabama (USA): The Importance of Heat Wave Definition. Environmental Health Perspectives, 122(2), 151–158, doi: 10.1289/ehp.1307262.
Kermanshah, A., S. Derrible, and M. Berkelhammer, 2017: Using Climate Models to Estimate Urban Vulnerability to Flash Floods. Journal of Applied Meteorology and Climatology, 56(9), 2637–2650, doi: 10.1175/jamc-d-17-0083.1.
Kerr, G.H. and D.W. Waugh, 2018: Connections between summer air pollution and stagnation. Environmental Research Letters, 13(8), 84001, doi: 10.1088/1748-9326/aad2e2.
Kew, S.F. et al., 2019: The Exceptional Summer Heat Wave in Southern Europe 2017. Bulletin of the American Meteorological Society, 100(1), S49–S53, doi: 10.1175/bams-d-18-0109.1.
Kew, S.F. et al., 2021: Impact of precipitation and increasing temperatures on drought trends in eastern Africa. Earth System Dynamics, 12(1), 17–35, doi: 10.5194/esd-12-17-2021.
Key, N., S. Sneeringer, and D. Marquardt, 2014: Climate Change, Heat Stress, and U.S. Dairy Production. ERR-175, U.S. Department of Agriculture, Economic Research Service, 39 pp., doi: 10.2139/ssrn.2506668.
Khalyani, A.H. et al., 2016: Climate change implications for tropical islands: Interpolating and interpreting statistically downscaled GCM projections for management and planning. Journal of Applied Meteorology and Climatology, 55(2), 265–282, doi: 10.1175/jamc-d-15-0182.1.
Khan, N., S. Shahid, T. Ismail, and X.-J. Wang, 2019a: Spatial distribution of unidirectional trends in temperature and temperature extremes in Pakistan. Theoretical and Applied Climatology, 136(3–4), 899–913, doi: 10.1007/s00704-018-2520-7.
Khan, N., S. Shahid, T. Ismail, K. Ahmed, and N. Nawaz, 2019b: Trends in heat wave related indices in Pakistan. Stochastic Environmental Research and Risk Assessment, 33(1), 287–302, doi: 10.1007/s00477-018-1605-2.
Khan, N. et al., 2020: Selection of GCMs for the projection of spatial distribution of heat waves in Pakistan. Atmospheric Research, 233, 104688, doi: 10.1016/j.atmosres.2019.104688.
Khan, S. et al., 2018: Flows and sediment dynamics in the Ganga River under present and future climate scenarios. Hydrological Sciences Journal, 63(5), 763–782, doi: 10.1080/02626667.2018.1447113.
Khan, Y.A., H. Lateh, M.A. Baten, and A.A. Kamil, 2012: Critical antecedent rainfall conditions for shallow landslides in Chittagong City of Bangladesh. Environmental Earth Sciences, 67(1), 97–106, doi: 10.1007/s12665-011-1483-0.
Kharin, V. et al., 2018: Risks from Climate Extremes Change Differently from 1.5°C to 2.0°C Depending on Rarity. Earth’s Future, 6(5), 704–715, doi: 10.1002/2018ef000813.
Kharuk, V.I., A.S. Shushpanov, S.T. Im, and K.J. Ranson, 2016: Climate-induced landsliding within the larch dominant permafrost zone of central Siberia. Environmental Research Letters, 11(4), 45004, doi: 10.1088/1748-9326/11/4/045004.
Khlebnikova, E.I., Y.L. Rudakova, and I.M. Shkolnik, 2019a: Changes in Precipitation Regime over the Territory of Russia: Data of Regional Climate Modeling and Observations. Russian Meteorology and Hydrology, 44(7), 431–439, doi: 10.3103/s106837391907001x.
Khlebnikova, E.I., Y.L. Rudakova, I.A. Sall’, S. Efimov, and I.M. Shkolnik, 2019b: Changes in Indicators of Temperature Extremes in the 21st Century: Ensemble Projections for the Territory of Russia. Russian Meteorology and Hydrology, 44(3), 159–168, doi: 10.3103/s1068373919030014.
Kieu-Thi, X. et al., 2016: Rainfall and Tropical Cyclone Activity over Vietnam Simulated and Projected by the Non-Hydrostatic Regional Climate Model – NHRCM. Journal of the Meteorological Society of Japan. Series II, 94A, 135–150, doi: 10.2151/jmsj.2015-057.
Kilroy, G., 2015: A review of the biophysical impacts of climate change in three hotspot regions in Africa and Asia. Regional Environmental Change, 15(5), 771–782, doi: 10.1007/s10113-014-0709-6.
Kim, H.G. et al., 2015: Evaluating landslide hazards using RCP 4.5 and 8.5 scenarios. Environmental Earth Sciences, 73(3), 1385–1400, doi: 10.1007/s12665-014-3775-7.
Kim, J., H. Kang, C. Son, and Y. Moon, 2016: Spatial variations in typhoon activities and precipitation trends over the Korean Peninsula. Journal of Hydro-environment Research, 13, 144–151, doi: 10.1016/j.jher.2014.12.005.
Kimball, B.A., 2016: Crop responses to elevated CO2 and interactions with H2O, N, and temperature. Current Opinion in Plant Biology, 31, 36–43, doi: 10.1016/j.pbi.2016.03.006.
King, A.D. et al., 2015: The timing of anthropogenic emergence in simulated climate extremes. Environmental Research Letters, 10(9), 094015, doi: 10.1088/1748-9326/10/9/094015.
Kinney, P.L. et al., 2015a: New York City Panel on Climate Change 2015 Report. Chapter 5: Public Health Impacts and Resiliency. Annals of the New York Academy of Sciences, 1336(1), 67–88, doi: 10.1111/nyas.12588.
Kinney, P.L. et al., 2015b: Winter season mortality: Will climate warming bring benefits?Environmental Research Letters, 10(6), 064016, doi: 10.1088/1748-9326/10/6/064016.
Kirchmeier-Young, M.C., H. Wan, X. Zhang, and S.I. Seneviratne, 2019: Importance of Framing for Extreme Event Attribution: The Role of Spatial and Temporal Scales. Earth’s Future, 7(10), 1192–1204, doi: 10.1029/2019ef001253.
Kirezci, E. et al., 2020: Projections of global-scale extreme sea levels and resulting episodic coastal flooding over the 21st Century. Scientific Reports, 10(1), 11629, doi: 10.1038/s41598-020-67736-6.
Kirschbaum, D., T. Stanley, and Y. Zhou, 2015: Spatial and temporal analysis of a global landslide catalog. Geomorphology, 249, 4–15, doi: 10.1016/j.geomorph.2015.03.016.
Kirschbaum, D., S.B. Kapnick, T. Stanley, and S. Pascale, 2020: Changes in Extreme Precipitation and Landslides Over High Mountain Asia. Geophysical Research Letters, 47(4), e2019GL085347, doi: 10.1029/2019gl085347.
Kirwan, M.L. and J.P. Megonigal, 2013: Tidal wetland stability in the face of human impacts and sea-level rise. Nature, 504(7478), 53–60, doi: 10.1038/nature12856.
Kitoh, A., S. Kusunoki, and T. Nakaegawa, 2011: Climate change projections over South America in the late 21st century with the 20 and 60 km mesh Meteorological Research Institute atmospheric general circulation model (MRI-AGCM). Journal of Geophysical Research: Atmospheres, 116(D6), D06105, doi: 10.1029/2010jd014920.
Kjellstrom, T. et al., 2016: Heat, Human Performance, and Occupational Health: A Key Issue for the Assessment of Global Climate Change Impacts. Annual Review of Public Health, 37(1), 97–112, doi: 10.1146/annurev-publhealth-032315-021740.
Kjellström, E. et al., 2016: Production and use of regional climate model projections – A Swedish perspective on building climate services. Climate Services, 2–3, 15–29, doi: 10.1016/j.cliser.2016.06.004.
Kjellström, E. et al., 2018: European climate change at global mean temperature increases of 1.5 and 2°C above pre-industrial conditions as simulated by the EURO-CORDEX regional climate models. Earth System Dynamics, 9(2), 459–478, doi: 10.5194/esd-9-459-2018.
Klima, K. and M.G. Morgan, 2015: Ice storm frequencies in a warmer climate. Climatic Change, 133(2), 209–222, doi: 10.1007/s10584-015-1460-9.
Klos, P.Z., T.E. Link, and J.T. Abatzoglou, 2014: Extent of the rain–snow transition zone in the western U.S. under historic and projected climate. Geophysical Research Letters, 41(13), 4560–4568, doi: 10.1002/2014gl060500.
Kluver, D. and D. Leathers, 2015: Regionalization of snowfall frequency and trends over the contiguous United States. International Journal of Climatology, 35(14), 4348–4358, doi: 10.1002/joc.4292.
Knaggård, Å, D. Slunge, A. Ekbom, M. Göthberg, and U. Sahlin, 2019: Researchers’ approaches to stakeholders: Interaction or transfer of knowledge?Environmental Science & Policy, 97, 25–35, doi: 10.1016/j.envsci.2019.03.008.
Knoll, L.B. et al., 2019: Consequences of lake and river ice loss on cultural ecosystem services. Limnology and Oceanography Letters, 4(5), 119–131, doi: 10.1002/lol2.10116.
Knouft, J.H. and D.L. Ficklin, 2017: The Potential Impacts of Climate Change on Biodiversity in Flowing Freshwater Systems. Annual Review of Ecology, Evolution, and Systematics, 48(1), 111–133, doi: 10.1146/annurev-ecolsys-110316-022803.
Knutson, T.R. and J.J. Ploshay, 2016: Detection of anthropogenic influence on a summertime heat stress index. Climatic Change, 138(1–2), 25–39, doi: 10.1007/s10584-016-1708-z.
Knutson, T.R. and F. Zeng, 2018: Model assessment of observed precipitation trends over land regions: Detectable human influences and possible low bias in model trends. Journal of Climate, 31(12), 4617–4637, doi: 10.1175/jcli-d-17-0672.1.
Knutson, T.R. et al., 2015: Global projections of intense tropical cyclone activity for the late twenty-first century from dynamical downscaling of CMIP5/RCP4.5 scenarios. Journal of Climate, 28(18), 7203–7224, doi: 10.1175/jcli-d-15-0129.1.
Knutson, T.R. et al., 2019: Tropical Cyclones and Climate Change Assessment: Part I: Detection and Attribution. Bulletin of the American Meteorological Society, 100(10), 1987–2007, doi: 10.1175/bams-d-18-0189.1.
Knutson, T.R. et al., 2020: Tropical Cyclones and Climate Change Assessment: Part II: Projected Response to Anthropogenic Warming. Bulletin of the American Meteorological Society, 101(3), E303–E322, doi: 10.1175/bams-d-18-0194.1.
Knutti, R., 2019: Closing the Knowledge–Action Gap in Climate Change. One Earth, 1(1), 21–23, doi: 10.1016/j.oneear.2019.09.001.
Kokelj, S. et al., 2015: Increased precipitation drives mega slump development and destabilization of ice-rich permafrost terrain, northwestern Canada. Global and Planetary Change, 129, 56–68, doi: 10.1016/j.gloplacha.2015.02.008.
Koks, E.E. et al., 2019: A global multi-hazard risk analysis of road and railway infrastructure assets. Nature Communications, 10(1), 2677, doi: 10.1038/s41467-019-10442-3.
Kolberg, D., T. Persson, K. Mangerud, and H. Riley, 2019: Impact of projected climate change on workability, attainable yield, profitability and farm mechanization in Norwegian spring cereals. Soil and Tillage Research, 185, 122–138, doi: 10.1016/j.still.2018.09.002.
Kolstad, E.W. et al., 2019: Trials, Errors, and Improvements in Coproduction of Climate Services. Bulletin of the American Meteorological Society, 100(8), 1419–1428, doi: 10.1175/bams-d-18-0201.1.
Kopytko, N. and J. Perkins, 2011: Climate change, nuclear power, and the adaptation–mitigation dilemma. Energy Policy, 39(1), 318–333, doi: 10.1016/j.enpol.2010.09.046.
Kormos, P.R., C.H. Luce, S.J. Wenger, and W.R. Berghuijs, 2016: Trends and sensitivities of low streamflow extremes to discharge timing and magnitude in Pacific Northwest mountain streams. Water Resources Research, 52(7), 4990–5007, doi: 10.1002/2015wr018125.
Kornhuber, K. et al., 2020: Amplified Rossby waves enhance risk of concurrent heatwaves in major breadbasket regions. Nature Climate Change, 10(1), 48–53, doi: 10.1038/s41558-019-0637-z.
Korres, N.E. et al., 2016: Cultivars to face climate change effects on crops and weeds: a review. Agronomy for Sustainable Development, 36(1), 12, doi: 10.1007/s13593-016-0350-5.
Kossin, J.P., 2017: Hurricane intensification along United States coast suppressed during active hurricane periods. Nature, 541, 390–393, doi: 10.1038/nature20783.
Kossin, J.P., K.A. Emanuel, and S.J. Camargo, 2016: Past and Projected Changes in Western North Pacific Tropical Cyclone Exposure. Journal of Climate, 29(16), 5725–5739, doi: 10.1175/jcli-d-16-0076.1.
Kossin, J.P. et al., 2017: Extreme storms. In: Climate Science Special Report: Fourth National Climate Assessment, Volume I[Wuebbles, D.J., D.W. Fahey, K.A. Hibbard, D.J. Dokken, B.C. Stewart, and T.K. Maycock (eds.)]. U.S. Global Change Research Program, Washington, DC, USA, pp. 257–276, doi: 10.7930/j07s7kxx.
Kovács, A., A. Nemeth, J. Unger, and N. Kántor, 2017: Tourism climatic conditions of Hungary – Present situation and assessment of future changes. Idojaras, Quarterly Journal of the Hungarian Meteorological Service, 121(1), 79–99, www.met.hu/en/ismeret-tar/kiadvanyok/idojaras/index.php?id=548.
Kovats, R.S. et al., 2004: The effect of temperature on food poisoning: a time-series analysis of salmonellosis in ten European countries. Epidemiology and Infection, 132(3), 443–453, doi: 10.1017/s0950268804001992.
Kraaijenbrink, P.D.A., M.F.P. Bierkens, A.F. Lutz, and W.W. Immerzeel, 2017: Impact of a global temperature rise of 1.5 degrees Celsius on Asia’s glaciers. Nature, 549(7671), 257–260, doi: 10.1038/nature23878.
Krishnan, R. et al., 2019: Unravelling Climate Change in the Hindu Kush Himalaya: Rapid Warming in the Mountains and Increasing Extremes. In: The Hindu Kush Himalaya Assessment: Mountains, Climate Change, Sustainability and People[Wester, P., A. Mishra, A. Mukherji, and A.B. Shrestha (eds.)]. Springer, Cham, Switzerland, pp. 57–97, doi: 10.1007/978-3-319-92288-1_3.
Krist, F.J. et al., 2014: 2013–2027 National insect and disease forest risk assessment. FHTET-14-01, Forest Health Technology Enterprise Team (FHTET), United States Forest Service, Fort Collins, CO, USA, 209 pp., www.fs.fed.us/foresthealth/technology/pdfs/2012_RiskMap_Report_web.pdf .
Kroeker, K.J. et al., 2013: Impacts of ocean acidification on marine organisms: quantifying sensitivities and interaction with warming. Global Change Biology, 19(6), 1884–1896, doi: 10.1111/gcb.12179.
Krueger, T. et al., 2017: Common reef-building coral in the Northern Red Sea resistant to elevated temperature and acidification. Royal Society Open Science, 4(5), 170038, doi: 10.1098/rsos.170038.
Kruk, M.C. et al., 2017: Engaging with users of climate information and the coproduction of knowledge. Weather, Climate, and Society, 9(4), 839–849, doi: 10.1175/wcas-d-16-0127.1.
Krysanova, V. et al., 2017: Intercomparison of regional-scale hydrological models and climate change impacts projected for 12 large river basins worldwide – a synthesis. Environmental Research Letters, 12(10), 105002, doi: 10.1088/1748-9326/aa8359.
Kuleshov, Y. et al., 2010: Trends in tropical cyclones in the South Indian Ocean and the South Pacific Ocean. Journal of Geophysical Research: Atmospheres, 115(D1), D01101, doi: 10.1029/2009jd012372.
Kulp, S.A. and B.H. Strauss, 2019: New elevation data triple estimates of global vulnerability to sea-level rise and coastal flooding. Nature Communications, 10(1), 4844, doi: 10.1038/s41467-019-12808-z.
Kumar, D. and A.R. Ganguly, 2018: Intercomparison of model response and internal variability across climate model ensembles. Climate Dynamics, 51(1–2), 207–219, doi: 10.1007/s00382-017-3914-4.
Kumar, D., V. Mishra, and A.R. Ganguly, 2015: Evaluating wind extremes in CMIP5 climate models. Climate Dynamics, 45(1), 441–453, doi: 10.1007/s00382-014-2306-2.
Kumar, S., K. Chanda, and S. Pasupuleti, 2020: Spatiotemporal analysis of extreme indices derived from daily precipitation and temperature for climate change detection over India. Theoretical and Applied Climatology, 140(1), 343–357, doi: 10.1007/s00704-020-03088-5.
Kumar, S. et al., 2019: Characteristics of Observed Meteorological Drought and its Linkage with Low-Level Easterly Wind Over India. Pure and Applied Geophysics, 176(6), 2679–2696, doi: 10.1007/s00024-019-02118-2.
Kundzewicz, Z.W., I. Pin’skwar, and G.R. Brakenridge, 2018: Changes in river flood hazard in Europe: A review. Hydrology Research, 49(2), 294–302, doi: 10.2166/nh.2017.016.
Kundzewicz, Z.W. et al., 2014: Flood risk and climate change: global and regional perspectives. Hydrological Sciences Journal, 59(1), 1–28, doi: 10.1080/02626667.2013.857411.
Kundzewicz, Z.W. et al., 2019: Flood risk and its reduction in China. Advances in Water Resources, 130, 37–45, doi: 10.1016/j.advwatres.2019.05.020.
Kunkel, K.E. et al., 2016: Trends and Extremes in Northern Hemisphere Snow Characteristics. Current Climate Change Reports, 2(2), 65–73, doi: 10.1007/s40641-016-0036-8.
Kuriqi, A. et al., 2020: Seasonality shift and streamflow flow variability trends in central India. Acta Geophysica, 68(5), 1461–1475, doi: 10.1007/s11600-020-00475-4.
Kusunoki, S., 2018: Future changes in precipitation over East Asia projected by the global atmospheric model MRI-AGCM3.2. Climate Dynamics, 51, 4601–4617, doi: 10.1007/s00382-016-3499-3.
Kusunoki, S., T. Ose, and M. Hosaka, 2020: Emergence of unprecedented climate change in projected future precipitation. Scientific Reports, 10(1), 4802, doi: 10.1038/s41598-020-61792-8.
Kusunose, Y. and T.J. Lybbert, 2014: Coping with drought by adjusting land tenancy contracts: A model and evidence from rural Morocco. World Development, 61, 114–126, doi: 10.1016/j.worlddev.2014.04.006.
Kvande, T. and K.R. Lisø, 2009: Climate adapted design of masonry structures. Building and Environment, 44(12), 2442–2450, doi: 10.1016/j.buildenv.2009.04.007.
Kwiatkowski, L. et al., 2016: Nighttime dissolution in a temperate coastal ocean ecosystem increases under acidification. Scientific Reports, 6, 22984, doi: 10.1038/srep22984.
Kwiatkowski, L. et al., 2020: Twenty-first century ocean warming, acidification, deoxygenation, and upper-ocean nutrient and primary production decline from CMIP6 model projections. Biogeosciences, 17(13), 3439–3470, doi: 10.5194/bg-17-3439-2020.
Lai, L.-W., 2018: The relationship between extreme weather events and crop losses in central Taiwan. Theoretical and Applied Climatology, 134(1–2), 107–119, doi: 10.1007/s00704-017-2261-z.
Laidre, K.L. et al., 2015: Arctic marine mammal population status, sea ice habitat loss, and conservation recommendations for the 21st century. Conservation Biology, 29(3), 724–737, doi: 10.1111/cobi.12474.
Lake, I.R. et al., 2017: Climate Change and Future Pollen Allergy in Europe. Environmental Health Perspectives, 125(3), 385–391, doi: 10.1289/ehp173.
Laliberté, F., S.E.L. Howell, and P.J. Kushner, 2016: Regional variability of a projected sea ice-free Arctic during the summer months. Geophysical Research Letters, 43(1), 256–263, doi: 10.1002/2015gl066855.
Lallo, C.H.O. et al., 2018: Characterizing heat stress on livestock using the temperature humidity index (THI) – prospects for a warmer Caribbean. Regional Environmental Change, 18(8), 2329–2340, doi: 10.1007/s10113-018-1359-x.
Lambert, S.J. and B.K. Hansen, 2011: Simulated Changes in the Freezing Rain Climatology of North America under Global Warming Using a Coupled Climate Model. Atmosphere-Ocean, 49(3), 289–295, doi: 10.1080/07055900.2011.607492.
Lambrechts, L. et al., 2011: Impact of daily temperature fluctuations on dengue virus transmission byAedes aegypti. Proceedings of the National Academy of Sciences, 108(18), 7460–7465, doi: 10.1073/pnas.1101377108.
Landrum, L. and M.M. Holland, 2020: Extremes become routine in an emerging new Arctic. Nature Climate Change, 10(12), 1108–1115, doi: 10.1038/s41558-020-0892-z.
Lane, S.N., M. Bakker, C. Gabbud, N. Micheletti, and J.-N. Saugy, 2017: Sediment export, transient landscape response and catchment-scale connectivity following rapid climate warming and Alpine glacier recession. Geomorphology, 277, 210–227, doi: 10.1016/j.geomorph.2016.02.015.
Lange, S., 2019: Trend-preserving bias adjustment and statistical downscaling with ISIMIP3BASD (v1.0). Geoscientific Model Development, 12(7), 3055–3070, doi: 10.5194/gmd-12-3055-2019.
Laporta, G.Z. et al., 2015: Malaria vectors in South America: current and future scenarios. Parasites & Vectors, 8(1), 426, doi: 10.1186/s13071-015-1038-4.
Larosa, F. and J. Mysiak, 2019: Mapping the landscape of climate services. Environmental Research Letters, 14(9), 93006, doi: 10.1088/1748-9326/ab304d.
Laurent, A. et al., 2017: Eutrophication-induced acidification of coastal waters in the northern Gulf of Mexico: Insights into origin and processes from a coupled physical–biogeochemical model. Geophysical Research Letters, 44(2), 946–956, doi: 10.1002/2016gl071881.
Laurila, T.K., V.A. Sinclair, and H. Gregow, 2021: Climatology, variability, and trends in near-surface wind speeds over the North Atlantic and Europe during 1979–2018 based on ERA5. International Journal of Climatology, 41(4), 2253–2278, doi: 10.1002/joc.6957.
Lay, C.R. et al., 2018: Emergency Department Visits and Ambient Temperature: Evaluating the Connection and Projecting Future Outcomes. GeoHealth, 2(6), 182–194, doi: 10.1002/2018gh000129.
Lazar, B. and M. Williams, 2008: Climate change in western ski areas: Potential changes in the timing of wet avalanches and snow quality for the Aspen ski area in the years 2030 and 2100. Cold Regions Science and Technology, 51(2–3), 219–228, doi: 10.1016/j.coldregions.2007.03.015.
Le Cozannet, G., M. Garcin, M. Yates, D. Idier, and B. Meyssignac, 2014: Approaches to evaluate the recent impacts of sea-level rise on shoreline changes. Earth-Science Reviews, 138, 47–60, doi: 10.1016/j.earscirev.2014.08.005.
Le Cozannet, G. et al., 2017: Sea Level Change and Coastal Climate Services: The Way Forward. Journal of Marine Science and Engineering, 5(4), 49, doi: 10.3390/jmse5040049.
Le Cozannet, G. et al., 2019: Quantifying uncertainties of sandy shoreline change projections as sea level rises. Scientific Reports, 9(1), 42, doi: 10.1038/s41598-018-37017-4.
Le Nohaïc, M. et al., 2017: Marine heatwave causes unprecedented regional mass bleaching of thermally resistant corals in northwestern Australia. Scientific Reports, 7(1), 14999, doi: 10.1038/s41598-017-14794-y.
Leakey, A.D.B., K.A. Bishop, and E.A. Ainsworth, 2012: A multi-biome gap in understanding of crop and ecosystem responses to elevated CO2. Current Opinion in Plant Biology, 15(3), 228–236, doi: 10.1016/j.pbi.2012.01.009.
Lee, C.K.F., C. Duncan, H.J.F. Owen, and N. Pettorelli, 2018: A New Framework to Assess Relative Ecosystem Vulnerability to Climate Change. Conservation Letters, 11(2), e12372, doi: 10.1111/conl.12372.
Lee, H. and D.A. Sumner, 2015: Economics of downscaled climate-induced changes in cropland, with projections to 2050: evidence from Yolo County California. Climatic Change, 132(4), 723–737, doi: 10.1007/s10584-015-1436-9.
Lee, J.R. et al., 2017: Climate change drives expansion of Antarctic ice-free habitat. Nature, 547(7661), 49–54, doi: 10.1038/nature22996.
Lee, M.A., A.P. Davis, M.G.G. Chagunda, and P. Manning, 2017: Forage quality declines with rising temperatures, with implications for livestock production and methane emissions. Biogeosciences, 14(6), 1403–1417, doi: 10.5194/bg-14-1403-2017.
Lee, T.-C., T.R. Knutson, T. Nakaegawa, M. Ying, and E.J. Cha, 2020: Third assessment on impacts of climate change on tropical cyclones in the Typhoon Committee Region – Part I: Observed changes, detection and attribution. Tropical Cyclone Research and Review, 9(1), 1–22, doi: 10.1016/j.tcrr.2020.03.001.
Lehner, F., C. Deser, and L. Terray, 2017: Toward a New Estimate of “Time of Emergence” of Anthropogenic Warming: Insights from Dynamical Adjustment and a Large Initial-Condition Model Ensemble. Journal of Climate, 30(19), 7739–7756, doi: 10.1175/jcli-d-16-0792.1.
Lehner, F., C. Deser, and B.M. Sanderson, 2018: Future risk of record-breaking summer temperatures and its mitigation. Climatic Change, 146(3–4), 363–375, doi: 10.1007/s10584-016-1616-2.
Leite-Filho, A.T., V.Y. de Sousa Pontes, and M.H. Costa, 2019: Effects of Deforestation on the Onset of the Rainy Season and the Duration of Dry Spells in Southern Amazonia. Journal of Geophysical Research: Atmospheres, 124(10), 5268–5281, doi: 10.1029/2018jd029537.
Lelieveld, J., J.S. Evans, M. Fnais, D. Giannadaki, and A. Pozzer, 2015: The contribution of outdoor air pollution sources to premature mortality on a global scale. Nature, 525(7569), 367–371, doi: 10.1038/nature15371.
Lelieveld, J. et al., 2016: Strongly increasing heat extremes in the Middle East and North Africa (MENA) in the 21st century. Climatic Change, 137(1–2), 245–260, doi: 10.1007/s10584-016-1665-6.
Lemos, M.C., C.J. Kirchhoff, and V. Ramprasad, 2012: Narrowing the climate information usability gap. Nature Climate Change, 2(11), 789–794, doi: 10.1038/nclimate1614.
Leng, G. and J. Hall, 2019: Crop yield sensitivity of global major agricultural countries to droughts and the projected changes in the future. Science of the Total Environment, 654, 811–821, doi: 10.1016/j.scitotenv.2018.10.434.
Leng, G. et al., 2016: Emergence of new hydrologic regimes of surface water resources in the conterminous United States under future warming. Environmental Research Letters, 11(11), 114003, doi: 10.1088/1748-9326/11/11/114003.
Lenoir, J. and J.-C. Svenning, 2015: Climate-related range shifts – a global multidimensional synthesis and new research directions. Ecography, 38(1), 15–28, doi: 10.1111/ecog.00967.
Lesk, C., E. Coffel, and R. Horton, 2020: Net benefits to US soy and maize yields from intensifying hourly rainfall. Nature Climate Change, 10(9), 819–822, doi: 10.1038/s41558-020-0830-0.
Leta, O., A. El-Kadi, and H. Dulai, 2018: Impact of Climate Change on Daily Streamflow and Its Extreme Values in Pacific Island Watersheds. Sustainability, 10(6), 2057, doi: 10.3390/su10062057.
Levin, L.A., 2018: Manifestation, Drivers, and Emergence of Open Ocean Deoxygenation. Annual Review of Marine Science, 10(1), 229–260, doi: 10.1146/annurev-marine-121916-063359.
Lewis, S.C. et al., 2020: Deconstructing Factors Contributing to the 2018 Fire Weather in Queensland, Australia. Bulletin of the American Meteorological Society, 101(1), S115–S122, doi: 10.1175/bams-d-19-0144.1.
Lewkowicz, A.G. and R.G. Way, 2019: Extremes of summer climate trigger thousands of thermokarst landslides in a High Arctic environment. Nature Communications, 10(1), 1329, doi: 10.1038/s41467-019-09314-7.
Leys, J.F., S.K. Heidenreich, C.L. Strong, G.H. McTainsh, and S. Quigley, 2011: PM10 concentrations and mass transport during “Red Dawn” – Sydney 23 September 2009. Aeolian Research, 3(3), 327–342, doi: 10.1016/j.aeolia.2011.06.003.
Li, B., Y. Chen, and X. Shi, 2020: Does elevation dependent warming exist in high mountain Asia?Environmental Research Letters, 15(2), 024012, doi: 10.1088/1748-9326/ab6d7f .
Li, C. et al., 2018: Midlatitude atmospheric circulation responses under 1.5 and 2.0°C warming and implications for regional impacts. Earth System Dynamics, 9(2), 359–382, doi: 10.5194/esd-9-359-2018.
Li, C. et al., 2021: Changes in Annual Extremes of Daily Temperature and Precipitation in CMIP6 Models. Journal of Climate, 34(9), 3441–3460, doi: 10.1175/jcli-d-19-1013.1.
Li, C.-J., Y.-Q. Chai, L.-S. Yang, and H.-R. Li, 2016: Spatio-temporal distribution of flood disasters and analysis of influencing factors in Africa. Natural Hazards, 82(1), 721–731, doi: 10.1007/s11069-016-2181-8.
Li, D. et al., 2020: Historical Evaluation and Future Projections of 100-m Wind Energy Potentials Over CORDEX-East Asia. Journal of Geophysical Research: Atmospheres, 125(15), e2020JD032874, doi: 10.1029/2020jd032874.
Li, F., P.H.A.J.M. van Gelder, R. Ranasinghe, D.P. Callaghan, and R.B. Jongejan, 2014a: Probabilistic modelling of extreme storms along the Dutch coast. Coastal Engineering, 86, 1–13, doi: 10.1016/j.coastaleng.2013.12.009.
Li, F. et al., 2014b: Probabilistic estimation of coastal dune erosion and recession by statistical simulation of storm events. Applied Ocean Research, 47, 53–62, doi: 10.1016/j.apor.2014.01.002.
Li, G. et al., 2018: Indices of Canada’s future climate for general and agricultural adaptation applications. Climatic Change, 148(1–2), 249–263, doi: 10.1007/s10584-018-2199-x.
Li, H., H. Li, J. Wang, and X. Hao, 2020: Monitoring high-altitude river ice distribution at the basin scale in the northeastern Tibetan Plateau from a Landsat time-series spanning 1999–2018. Remote Sensing of Environment, 247, 111915, doi: 10.1016/j.rse.2020.111915.
Li, J., Y.D. Chen, T.Y. Gan, and N.C. Lau, 2018: Elevated increases in human-perceived temperature under climate warming. Nature Climate Change, 8(1), 43–47, doi: 10.1038/s41558-017-0036-2.
Li, L. et al., 2019: Future projections of extreme temperature events in different sub-regions of China. Atmospheric Research, 217, 150–164, doi: 10.1016/j.atmosres.2018.10.019.
Li, M., Q. Zhang, and F. Zhang, 2016: Hail Day Frequency Trends and Associated Atmospheric Circulation Patterns over China during 1960–2012. Journal of Climate, 29(19), 7027–7044, doi: 10.1175/jcli-d-15-0500.1.
Li, N., Y. Yamazaki, V. Roeber, K.F. Cheung, and G. Chock, 2018: Probabilistic mapping of storm-induced coastal inundation for climate change adaptation. Coastal Engineering, 133, 126–141, doi: 10.1016/j.coastaleng.2017.12.013.
Li, R.C.Y., W. Zhou, C.M. Shun, and T.C. Lee, 2017: Change in destructiveness of landfalling tropical cyclones over China in recent decades. Journal of Climate, 30(9), 3367–3379, doi: 10.1175/jcli-d-16-0258.1.
Li, T., R.M. Horton, and P.L. Kinney, 2013: Projections of seasonal patterns in temperature-related deaths for Manhattan, New York. Nature Climate Change, 3(8), 717–721, doi: 10.1038/nclimate1902.
Li, T. et al., 2015: Uncertainties in predicting rice yield by current crop models under a wide range of climatic conditions. Global Change Biology, 21(3), 1328–1341, doi: 10.1111/gcb.12758.
Li, W., Y. Chen, and W. Chen, 2021: The emergence of anthropogenic signal in mean and extreme precipitation trend over China by using two large ensembles. Environmental Research Letters, 16(1), 14052, doi: 10.1088/1748-9326/abd26d.
Li, W., Z. Jiang, X. Zhang, and L. Li, 2018: On the Emergence of Anthropogenic Signal in Extreme Precipitation Change Over China. Geophysical Research Letters, 45(17), 9179–9185, doi: 10.1029/2018gl079133.
Li, X., D. Jiang, and F. Liu, 2016: Dynamics of amino acid carbon and nitrogen and relationship with grain protein in wheat under elevated CO2 and soil warming. Environmental and Experimental Botany, 132, 121–129, doi: 10.1016/j.envexpbot.2016.08.013.
Li, Y., W. Yu, K. Wang, and X. Ma, 2019: Comparison of the aridity index and its drivers in eight climatic regions in China in recent years and in future projections. International Journal of Climatology, 39(14), 5256–5272, doi: 10.1002/joc.6137.
Li, Z. and H. Fang, 2016: Impacts of climate change on water erosion: A review. Earth-Science Reviews, 163, 94–117, doi: 10.1016/j.earscirev.2016.10.004.
Liang, Y., Y. Wang, Y. Zhao, Y. Lu, and X. Liu, 2019: Analysis and Projection of Flood Hazards over China. Water, 11(5), 1022, doi: 10.3390/w11051022.
Liao, Z., P. Zhai, Y. Chen, and H. Lu, 2018: Atmospheric circulation patterns associated with persistent wet-freezing events over southern China. International Journal of Climatology, 38(10), 3976–3990, doi: 10.1002/joc.5548.
Liao, Z., P. Zhai, Y. Chen, and H. Lu, 2020: Differing mechanisms for the 2008 and 2016 wintertime cold events in southern China. International Journal of Climatology, 40(11), 4944–4955, doi: 10.1002/joc.6498.
Lima, A., D.D. Lovin, P. Hickner, and D.W. Severson, 2016: Evidence for an Overwintering Population of Aedes aegypti in Capitol Hill Neighborhood, Washington, DC. American Journal of Tropical Medicine and Hygiene, 94(1), 231–235, doi: 10.4269/ajtmh.15-0351.
Lima, F.P. and D.S. Wethey, 2012: Three decades of high-resolution coastal sea surface temperatures reveal more than warming. Nature Communications, 3(1), 704, doi: 10.1038/ncomms1713.
Limsakul, A. and P. Singhruck, 2016: Long-term trends and variability of total and extreme precipitation in Thailand. Atmospheric Research, 169, 301–317, doi: 10.1016/j.atmosres.2015.10.015.
Lin, L. et al., 2018: Additional Intensification of Seasonal Heat and Flooding Extreme Over China in a 2°C Warmer World Compared to 1.5°C. Earth’s Future, 6(7), 968–978, doi: 10.1029/2018ef000862.
Lin, Y.-K., C.-K. Chang, M.-H. Li, Y.-C. Wu, and Y.-C. Wang, 2012: High-temperature indices associated with mortality and outpatient visits: Characterizing the association with elevated temperature. Science of The Total Environment, 427–428, 41–49, doi: 10.1016/j.scitotenv.2012.04.039.
Lindner, M. et al., 2014: Climate change and European forests: What do we know, what are the uncertainties, and what are the implications for forest management?Journal of Environmental Management, 146, 69–83, doi: 10.1016/j.jenvman.2014.07.030.
Linsbauer, A. et al., 2016: Modelling glacier-bed overdeepenings and possible future lakes for the glaciers in the Himalaya–Karakoram region. Annals of Glaciology, 57(71), 119–130, doi: 10.3189/2016aog71a627.
Lionello, P. and L. Scarascia, 2018: The relation between climate change in the Mediterranean region and global warming. Regional Environmental Change, 18(5), 1481–1493, doi: 10.1007/s10113-018-1290-1.
Lionello, P. and L. Scarascia, 2020: The relation of climate extremes with global warming in the Mediterranean region and its north versus south contrast. Regional Environmental Change, 20(1), 31, doi: 10.1007/s10113-020-01610-z.
Lionello, P., D. Conte, L. Marzo, and L. Scarascia, 2017: The contrasting effect of increasing mean sea level and decreasing storminess on the maximum water level during storms along the coast of the Mediterranean Sea in the mid 21st century. Global and Planetary Change, 151, 80–91, doi: 10.1016/j.gloplacha.2016.06.012.
Lionello, P. et al., 2016: Objective climatology of cyclones in the Mediterranean region: a consensus view among methods with different system identification and tracking criteria. Tellus A: Dynamic Meteorology and Oceanography, 68(1), 29391, doi: 10.3402/tellusa.v68.29391.
Littell, J.S., D.L. Peterson, K.L. Riley, Y. Liu, and C.H. Luce, 2016: A review of the relationships between drought and forest fire in the United States. Global Change Biology, 22(7), 2353–2369, doi: 10.1111/gcb.13275.
Liu, G. et al., 2014: Reef-Scale Thermal Stress Monitoring of Coral Ecosystems: New 5-km Global Products from NOAA Coral Reef Watch. Remote Sensing, 6(11), 11579–11606, doi: 10.3390/rs61111579.
Liu, J.C. et al., 2016: Future respiratory hospital admissions from wildfire smoke under climate change in the Western US. Environmental Research Letters, 11(12), 124018, doi: 10.1088/1748-9326/11/12/124018.
Liu, K.S. and J.C.L. Chan, 2019: Inter-decadal variability of the location of maximum intensity of category 4–5 typhoons and its implication on landfall intensity in East Asia. International Journal of Climatology, 39(4), 1839–1852, doi: 10.1002/joc.5919.
Liu, W. et al., 2018a: Global Freshwater Availability Below Normal Conditions and Population Impact Under 1.5 and 2°C Stabilization Scenarios. Geophysical Research Letters, 45(18), 9803–9813, doi: 10.1029/2018gl078789.
Liu, W. et al., 2018b: Global drought and severe drought-affected populations in 1.5 and 2°C warmer worlds. Earth System Dynamics, 9(1), 267–283, doi: 10.5194/esd-9-267-2018.
Liu, X. et al., 2013: Impact of chilling injury and global warming on rice yield in Heilongjiang Province. Journal of Geographical Sciences, 23(1), 85–97, doi: 10.1007/s11442-013-0995-9.
Livneh, B. and A.M. Badger, 2020: Drought less predictable under declining future snowpack. Nature Climate Change, 10(5), 452–458, doi: 10.1038/s41558-020-0754-8.
Lkhamjav, J., H.-G. Jin, H. Lee, and J.-J. Baik, 2017: A hail climatology in Mongolia. Asia-Pacific Journal of Atmospheric Sciences, 53(4), 501–509, doi: 10.1007/s13143-017-0052-1.
Llopart, M., E. Coppola, F. Giorgi, R.P. da Rocha, and S. Cuadra, 2014: Climate change impact on precipitation for the Amazon and La Plata basins. Climatic Change, 125(1), 111–125, doi: 10.1007/s10584-014-1140-1.
Lloyd, E.A. and N. Oreskes, 2018: Climate Change Attribution: When Is It Appropriate to Accept New Methods?Earth’s Future, 6(3), 311–325, doi: 10.1002/2017ef000665.
Loarie, S.R. et al., 2009: The velocity of climate change. Nature, 462(7276), 1052–1055, doi: 10.1038/nature08649.
Lobell, D.B. and C. Tebaldi, 2014: Getting caught with our plants down: the risks of a global crop yield slowdown from climate trends in the next two decades. Environmental Research Letters, 9(7), 074003, doi: 10.1088/1748-9326/9/7/074003.
Lobell, D.B., A. Sibley, and J.I. Ortiz-Monasterio, 2012: Extreme heat effects on wheat senescence in India. Nature Climate Change, 2(3), 186–189, doi: 10.1038/nclimate1356.
Lobell, D.B. et al., 2013: The critical role of extreme heat for maize production in the United States. Nature Climate Change, 3(5), 497–501, doi: 10.1038/nclimate1832.
Lobell, D.B. et al., 2015: The shifting influence of drought and heat stress for crops in northeast Australia. Global Change Biology, 21(11), 4115–4127, doi: 10.1111/gcb.13022.
Loladze, I., 2014: Hidden shift of the ionome of plants exposed to elevated CO2 depletes minerals at the base of human nutrition. eLife, 3, e02245, doi: 10.7554/elife.02245.
López Feldman, A.J. and D. Hernández Cortés, 2016: Cambio climático y agricultura: una revisión de la literatura con énfasis en América Latina. El Trimestre Económico, 83(332), 459, doi: 10.20430/ete.v83i332.231.
López-Franca, N., P.G. Zaninelli, A.F. Carril, C.G. Menéndez, and E. Sánchez, 2016: Changes in temperature extremes for 21st century scenarios over South America derived from a multi-model ensemble of regional climate models. Climate Research, 68(2–3), 151–167, doi: 10.3354/cr01393.
López-Moreno, J.I., S. Goyette, and M. Beniston, 2009: Impact of climate change on snowpack in the Pyrenees: Horizontal spatial variability and vertical gradients. Journal of Hydrology, 374(3–4), 384–396, doi: 10.1016/j.jhydrol.2009.06.049.
López-Moreno, J.I. et al., 2017: Different sensitivities of snowpacks to warming in Mediterranean climate mountain areas. Environmental Research Letters, 12(7), 74006, doi: 10.1088/1748-9326/aa70cb.
López-Moreno, J.I. et al., 2020: Long-term trends (1958–2017) in snow cover duration and depth in the Pyrenees. International Journal of Climatology, 40(14), 6122–6136, doi: 10.1002/joc.6571.
Losada Carreño, I. et al., 2020: Potential impacts of climate change on wind and solar electricity generation in Texas. Climatic Change, 163(2), 745–766, doi: 10.1007/s10584-020-02891-3.
Lourenço, T.C., R. Swart, H. Goosen, and R. Street, 2016: The rise of demand-driven climate services. Nature Climate Change, 6(1), 13–14, doi: 10.1038/nclimate2836.
Lovelock, C.E. et al., 2015: The vulnerability of Indo-Pacific mangrove forests to sea-level rise. Nature, 526(7574), 559–563, doi: 10.1038/nature15538.
Lowe, R. et al., 2017: Climate services for health: predicting the evolution of the 2016 dengue season in Machala, Ecuador. The Lancet Planetary Health, 1(4), e142–e151, doi: 10.1016/s2542-5196(17)30064-5.
Lu, C., Y. Sun, and X. Zhang, 2018: Multimodel detection and attribution of changes in warm and cold spell durations. Environmental Research Letters, 13(7), 74013, doi: 10.1088/1748-9326/aacb3e.
Lu, C., G. Huang, and X. Wang, 2019: Projected changes in temperature, precipitation, and their extremes over China through the RegCM. Climate Dynamics, 53(9), 5859–5880, doi: 10.1007/s00382-019-04899-7.
Lu, J., G.J. Carbone, and J.M. Grego, 2019: Uncertainty and hotspots in 21st century projections of agricultural drought from CMIP5 models. Scientific Reports, 9(1), 4922, doi: 10.1038/s41598-019-41196-z.
Lu, X., 2019: Building Resilient Infrastructure for the Future: Background paper for the G20 Climate Sustainability Working Group. ADB Sustainable Development Working Paper Series No.61, Asian Development Bank (ADB), Manila, Philippines, 38 pp., doi: 10.22617/wps190340-2.
Luedeling, E., 2012: Climate change impacts on winter chill for temperate fruit and nut production: A review. Scientia Horticulturae, 144, 218–229, doi: 10.1016/j.scienta.2012.07.011.
Lugon, R. and M. Stoffel, 2010: Rock-glacier dynamics and magnitude–frequency relations of debris flows in a high-elevation watershed: Ritigraben, Swiss Alps. Global and Planetary Change, 73(3–4), 202–210, doi: 10.1016/j.gloplacha.2010.06.004.
Luijendijk, A. et al., 2018: The State of the World’s Beaches. Scientific Reports, 8(1), 6641, doi: 10.1038/s41598-018-24630-6.
Luo, M. and N.-C. Lau, 2017: Heat Waves in Southern China: Synoptic Behavior, Long-Term Change, and Urbanization Effects. Journal of Climate, 30(2), 703–720, doi: 10.1175/jcli-d-16-0269.1.
Luo, M. et al., 2019: Spatiotemporal characteristics of future changes in precipitation and temperature in Central Asia. International Journal of Climatology, 39(3), 1571–1588, doi: 10.1002/joc.5901.
Lute, A.C., J.T. Abatzoglou, and K.C. Hegewisch, 2015: Projected changes in snowfall extremes and interannual variability of snowfall in the western United States. Water Resources Research, 51(2), 960–972, doi: 10.1002/2014wr016267.
Lutz, A.F., W.W. Immerzeel, A.B. Shrestha, and M.F.P. Bierkens, 2014: Consistent increase in High Asia’s runoff due to increasing glacier melt and precipitation. Nature Climate Change, 4(7), 587–592, doi: 10.1038/nclimate2237.
Lyu, K., X. Zhang, J.A. Church, A.B.A. Slangen, and J. Hu, 2014: Time of emergence for regional sea-level change. Nature Climate Change, 4(11), 1006–1010, doi: 10.1038/nclimate2397.
Mader, T.L., L.J. Johnson, and J.B. Gaughan, 2010: A comprehensive index for assessing environmental stress in animals. Journal of Animal Science, 88(6), 2153–2165, doi: 10.2527/jas.2009-2586.
Madsen, K.S., J.L. Høyer, Suursaar, J. She, and P. Knudsen, 2019: Sea Level Trends and Variability of the Baltic Sea From 2D Statistical Reconstruction and Altimetry. Frontiers in Earth Science, 7, 243, doi: 10.3389/feart.2019.00243.
Magnan, A.K. et al., 2019: Cross-Chapter Box 9: Integrative Cross-Chapter Box on Low-Lying Islands and Coasts. In: IPCC Special Report on the Ocean and Cryosphere in a Changing Climate[Pörtner, H.-O., D.C. Roberts, V. Masson-Delmotte, P. Zhai, M. Tignor, E. Poloczanska, K. Mintenbeck, A. Alegría, M. Nicolai, A. Okem, J. Petzold, B. Rama, and N.M. Weyer (eds.)]. In Press, pp. 657–674, www.ipcc.ch/srocc/chapter/cross-chapter-box-9-integrative-cross-chapter-box-on-low-lying-islands-and-coasts.
Magrin, G., 2015: Adaptación al cambio climático en América Latina y el Caribe. Comisión Económica para América Latina y el Caribe (CEPAL), 80 pp., www.cepal.org/es/publicaciones/39842-adaptacion-al-cambio-climatico-america-latina-caribe.
Mahoney, K., M.A. Alexander, G. Thompson, J.J. Barsugli, and J.D. Scott, 2012: Changes in hail and flood risk in high-resolution simulations over Colorado’s mountains. Nature Climate Change, 2(2), 125–131, doi: 10.1038/nclimate1344.
Mair, A., A.G. Johnson, K. Rotzoll, and D.S. Oki, 2019: Estimated groundwater recharge from a water-budget model incorporating selected climate projections, Island of Maui, Hawai’i. U.S. Geological Survey Scientific Investigations Report 2019-5064, U.S. Geological Survey (USGS), Reston, VA, 46 pp., doi: 10.3133/sir20195064.
Mäkinen, H. et al., 2018: Sensitivity of European wheat to extreme weather. Field Crops Research, 222, 209–217, doi: 10.1016/j.fcr.2017.11.008.
Malherbe, J., F.A. Engelbrecht, and W.A. Landman, 2013: Projected changes in tropical cyclone climatology and landfall in the Southwest Indian Ocean region under enhanced anthropogenic forcing. Climate Dynamics, 40(1 1–1 2), 2867–2886, doi: 10.1007/s00382-012-1635-2.
Malik, N., B. Bookhagen, and P.J. Mucha, 2016: Spatiotemporal patterns and trends of Indian monsoonal rainfall extremes. Geophysical Research Letters, 43(4), 1710–1717, doi: 10.1002/2016gl067841.
Mallakpour, I. and G. Villarini, 2015: The changing nature of flooding across the central United States. Nature Climate Change, 5(3), 250–254, doi: 10.1038/nclimate2516.
Mallya, G., V. Mishra, D. Niyogi, S. Tripathi, and R.S. Govindaraju, 2016: Trends and variability of droughts over the Indian monsoon region. Weather and Climate Extremes, 12, 43–68, doi: 10.1016/j.wace.2016.01.002.
Mandapaka, P. and E.Y.M. Lo, 2018: Assessment of future changes in Southeast Asian precipitation using the NASA Earth Exchange Global Daily Downscaled Projections data set. International Journal of Climatology, 38(14), 5231–5244, doi: 10.1002/joc.5724.
Mangini, W. et al., 2018: Detection of trends in magnitude and frequency of flood peaks across Europe. Hydrological Sciences Journal, 63(4), 493–512, doi: 10.1080/02626667.2018.1444766.
Mann, M.E., E.A. Lloyd, and N. Oreskes, 2017: Assessing climate change impacts on extreme weather events: the case for an alternative (Bayesian) approach. Climatic Change, 144(2), 131–142, doi: 10.1007/s10584-017-2048-3.
Manning, C. et al., 2019: Increased probability of compound long-duration dry and hot events in Europe during summer (1950–2013). Environmental Research Letters, 14(9), 094006, doi: 10.1088/1748-9326/ab23bf .
Manta, G., S. Mello, R. Trinchin, J. Badagian, and M. Barreiro, 2018: The 2017 Record Marine Heatwave in the Southwestern Atlantic Shelf. Geophysical Research Letters, 45(22), 12449–12456, doi: 10.1029/2018gl081070.
Maraun, D., 2013: When will trends in European mean and heavy daily precipitation emerge?Environmental Research Letters, 8(1), 014004, doi: 10.1088/1748-9326/8/1/014004.
Maraun, D. et al., 2015: VALUE: A framework to validate downscaling approaches for climate change studies. Earth’s Future, 3(1), 1–14, doi: 10.1002/2014ef000259.
Marcos, M. et al., 2019: Increased Extreme Coastal Water Levels Due to the Combined Action of Storm Surges and Wind Waves. Geophysical Research Letters, 46(8), 4356–4364, doi: 10.1029/2019gl082599.
Mardones, P. and R.D. Garreaud, 2020: Future Changes in the Free Tropospheric Freezing Level and Rain–Snow Limit: The Case of Central Chile. Atmosphere, 11(11), 1259, doi: 10.3390/atmos11111259.
Marelle, L., G. Myhre, Hodnebrog, J. Sillmann, and B.H. Samset, 2018: The Changing Seasonality of Extreme Daily Precipitation. Geophysical Research Letters, 45(20), 11352– 11360, doi: 10.1029/2018gl079567.
Marengo, J.A. and M. Bernasconi, 2015: Regional differences in aridity/drought conditions over Northeast Brazil: present state and future projections. Climatic Change, 129(1–2), 103–115, doi: 10.1007/s10584-014-1310-1.
Marengo, J.A. and J.C. Espinoza, 2016: Extreme seasonal droughts and floods in Amazonia: causes, trends and impacts. International Journal of Climatology, 36(3), 1033–1050, doi: 10.1002/joc.4420.
Marengo, J.A., L.M. Alves, and R.R. Torres, 2016: Regional climate change scenarios in the Brazilian Pantanal watershed. Climate Research, 68(2–3), 201–213, doi: 10.3354/cr01324.
Marengo, J.A. et al., 2013: Recent Extremes of Drought and Flooding in Amazonia: Vulnerabilities and Human Adaptation. American Journal of Climate Change, 2(2), 87–96, doi: 10.4236/ajcc.2013.22009.
Marengo, J.A. et al., 2018: Changes in Climate and Land Use Over the Amazon Region: Current and Future Variability and Trends. Frontiers in Earth Science, 6, 228, doi: 10.3389/feart.2018.00228.
Mariotti, L., I. Diallo, E. Coppola, and F. Giorgi, 2014: Seasonal and intraseasonal changes of African monsoon climates in 21st century CORDEX projections. Climatic Change, 125(1), 53–65, doi: 10.1007/s10584-014-1097-0.
Mariotti, L., E. Coppola, M.B. Sylla, F. Giorgi, and C. Piani, 2011: Regional climate model simulation of projected 21st century climate change over an all-Africa domain: Comparison analysis of nested and driving model results. Journal of Geophysical Research: Atmospheres, 116(D15), D15111, doi: 10.1029/2010jd015068.
Marjanac, S. and L. Patton, 2018: Extreme weather event attribution science and climate change litigation: an essential step in the causal chain?Journal of Energy & Natural Resources Law, 36(3), 265–298, doi: 10.1080/02646811.2018.1451020.
Markon, C. et al., 2018: Alaska. In: Impacts, Risks, and Adaptation in the United States: Fourth National Climate Assessment, Volume II[Reidmiller, D.R., C.W. Avery, D.R. Easterling, K.E. Kunkel, K.L.M. Lewis, T.K. Maycock, and B.C. Stewart (eds.)]. U.S. Global Change Research Program, Washington, DC, USA, pp. 1185–1241, doi: 10.7930/nca4.2018.ch26.
Marotzke, J. et al., 2017: Climate research must sharpen its view. Nature Climate Change, 7(2), 89–91, doi: 10.1038/nclimate3206.
Marra, J.J. and M.C. Kruk, 2017: State of Environmental Conditions in Hawaii and the U.S. Affiliated Pacific Islands under a Changing Climate: 2017. National Oceanic and Atmospheric Administration (NOAA) National Centers for Environmental Information (NCEI), 93 pp., https://coralreefwatch.noaa.gov/satellite/publications/state_of_the_environment_2017_hawaii-usapi_noaa-nesdis-ncei_oct2017.pdf .
Marsooli, R., N. Lin, K. Emanuel, and K. Feng, 2019: Climate change exacerbates hurricane flood hazards along US Atlantic and Gulf Coasts in spatially varying patterns. Nature Communications, 10(1), 3785, doi: 10.1038/s41467-019-11755-z.
Martin, D.A., 2016: At the nexus of fire, water and society. Philosophical Transactions of the Royal Society B: Biological Sciences, 371(1696), 20150172, doi: 10.1098/rstb.2015.0172.
Martinelli, A., D.-D. Kolokotsa, and F. Fiorito, 2020: Urban heat island in Mediterranean coastal cities: The case of Bari (Italy). Climate, 8(6), 79, doi: 10.3390/cli8060079.
Martinez, J.A. and F. Dominguez, 2014: Sources of Atmospheric Moisture for the La Plata River Basin. Journal of Climate, 27(17), 6737–6753, doi: 10.1175/jcli-d-14-00022.1.
Martínez-Alvarado, O. et al., 2018: Increased wind risk from sting-jet windstorms with climate change. Environmental Research Letters, 13(4), 044002, doi: 10.1088/1748-9326/aaae3a.
Martínez-Austria, P.F., E.R. Bandala, and C. Patiño-Gómez, 2016: Temperature and heat wave trends in northwest Mexico. Physics and Chemistry of the Earth, Parts A/B/C, 91, 20–26, doi: 10.1016/j.pce.2015.07.005.
Martius, O., S. Pfahl, and C. Chevalier, 2016: A global quantification of compound precipitation and wind extremes. Geophysical Research Letters, 43(14), 7709–7717, doi: 10.1002/2016gl070017.
Marty, C., A.-M. Tilg, and T. Jonas, 2017a: Recent Evidence of Large-Scale Receding Snow Water Equivalents in the European Alps. Journal of Hydrometeorology, 18(4), 1021–1031, doi: 10.1175/jhm-d-16-0188.1.
Marty, C., S. Schlögl, M. Bavay, and M. Lehning, 2017b: How much can we save? Impact of different emission scenarios on future snow cover in the Alps. The Cryosphere, 11(1), 517–529, doi: 10.5194/tc-11-517-2017.
Marx, S.K. et al., 2014: Unprecedented wind erosion and perturbation of surface geochemistry marks the Anthropocene in Australia. Journal of Geophysical Research: Earth Surface, 119(1), 45–61, doi: 10.1002/2013jf002948.
Marzeion, B. et al., 2020: Partitioning the Uncertainty of Ensemble Projections of Global Glacier Mass Change. Earth’s Future, 8(7), e2019EF001470, doi: 10.1029/2019ef001470.
Masiokas, M.H. et al., 2020: A Review of the Current State and Recent Changes of the Andean Cryosphere. Frontiers in Earth Science, 8, 99, doi: 10.3389/feart.2020.00099.
Mason, L.A. et al., 2016: Fine-scale spatial variation in ice cover and surface temperature trends across the surface of the Laurentian Great Lakes. Climatic Change, 138(1–2), 71–83, doi: 10.1007/s10584-016-1721-2.
Massom, R.A. and S.E. Stammerjohn, 2010: Antarctic sea ice change and variability – Physical and ecological implications. Polar Science, 4(2), 149–186, doi: 10.1016/j.polar.2010.05.001.
Mathis, J.T., J.N. Cross, W. Evans, and S.C. Doney, 2015a: Ocean Acidification in the Surface Waters of the Pacific–Arctic Boundary Regions. Oceanography, 25(2), 122–135, doi: 10.5670/oceanog.2015.36.
Mathis, J.T. et al., 2015b: Ocean acidification risk assessment for Alaska’s fishery sector. Progress in Oceanography, 136, 71–91, doi: 10.1016/j.pocean.2014.07.001.
Matin, S. and M. Behera, 2017: Alarming rise in aridity in the Ganga river basin, India, in past 3.5 decades. Current science, 112(2), 229–230, https://wwwops. currentscience.ac.in/Volumes/112/02/0229.pdf .
Matsumoto, K., K.S. Tokos, and J. Rippke, 2019: Climate projection of lake superior under a future warming scenario. Journal of Limnology, 78(3), 296–309, doi: 10.4081/jlimnol.2019.1902.
Matthes, H., A. Rinke, and K. Dethloff, 2015: Recent changes in Arctic temperature extremes: warm and cold spells during winter and summer. Environmental Research Letters, 10(11), 114020, doi: 10.1088/1748-9326/10/11/114020.
Matthews, L. et al., 2021: Developing climate services for Caribbean tourism: a comparative analysis of climate push and pull influences using climate indices. Current Issues in Tourism, 24(11), 1576–1594, doi: 10.1080/13683500.2020.1816928.
Matthews, T.K.R., R.L. Wilby, and C. Murphy, 2017: Communicating the deadly consequences of global warming for human heat stress. Proceedings of the National Academy of Sciences, 114(15), 3861–3866, doi: 10.1073/pnas.1617526114.
Mauree, D. et al., 2019: A review of assessment methods for the urban environment and its energy sustainability to guarantee climate adaptation of future cities. Renewable and Sustainable Energy Reviews, 112, 733–746, doi: 10.1016/j.rser.2019.06.005.
Mavromatidi, A., E. Briche, and C. Claeys, 2018: Mapping and analyzing socio-environmental vulnerability to coastal hazards induced by climate change: An application to coastal Mediterranean cities in France. Cities, 72, 189–200, doi: 10.1016/j.cities.2017.08.007.
Maxwell, K.B. et al., 2018: Built Environment, Urban Systems, and Cities. In: Impacts, Risks, and Adaptation in the United States: Fourth National Climate Assessment, Volume II[Reidmiller, D.R., C.W. Avery, D.R. Easterling, K.E. Kunkel, K.L.M. Lewis, T.K. Maycock, and B.C. Stewart (eds.)]. U.S. Global Change Research Program, Washington, DC, USA, pp. 438–478, doi: 10.7930/nca4.2018.ch11.
Mazdiyasni, O. et al., 2017: Increasing probability of mortality during Indian heat waves. Science Advances, 3(6), e1700066, doi: 10.1126/sciadv.1700066.
Mbow, C. et al., 2019: Food Security. In: Climate Change and Land: an IPCC special report on climate change, desertification, land degradation, sustainable land management, food security, and greenhouse gas fluxes in terrestrial ecosystems[Shukla, P.R., J. Skea, E.C. Buendia, V. Masson-Delmotte, H.-O. Pörtner, D.C. Roberts, P. Zhai, R. Slade, S. Connors, R. Diemen, M. Ferrat, E. Haughey, S. Luz, S. Neogi, M. Pathak, J. Petzold, J.P. Pereira, P. Vyas, E. Huntley, K. Kissick, M. Belkacemi, and J. Malley (eds.)]. In Press, pp. 437–550, www.ipcc.ch/srccl/chapter/chapter-5.
McAneney, J., R. van den Honert, and S. Yeo, 2017: Stationarity of major flood frequencies and heights on the Ba River, Fiji, over a 122-year record. International Journal of Climatology, 37, 171–178, doi: 10.1002/joc.4989.
McCrary, R.R. and L.O. Mearns, 2019: Quantifying and Diagnosing Sources of Uncertainty in Midcentury Changes in North American Snowpack from NARCCAP. Journal of Hydrometeorology, 20(11), 2229–2252, doi: 10.1175/jhm-d-18-0248.1.
McGree, S. et al., 2019: Recent Changes in Mean and Extreme Temperature and Precipitation in the Western Pacific Islands. Journal of Climate, 32(16), 4919–4941, doi: 10.1175/jcli-d-18-0748.1.
McGregor, G.R. and J.K. Vanos, 2018: Heat: a primer for public health researchers. Public Health, 161, 138–146, doi: 10.1016/j.puhe.2017.11.005.
McInnes, K.L. et al., 2016: Natural hazards in Australia: sea level and coastal extremes. Climatic Change, 139(1), 69–83, doi: 10.1007/s10584-016-1647-8.
McKenzie, D. et al., 2014: Smoke consequences of new wildfire regimes driven by climate change. Earth’s Future, 2(2), 35–59, doi: 10.1002/2013ef000180.
Mclay, J.G., E.A. Hendricks, and J.R. Moskaitis, 2019: High-resolution seeded simulations of western North Pacific Ocean tropical cyclones in two future extreme climates. Journal of Climate, 32(2), 309–334, doi: 10.1175/jcli-d-18-0353.1.
McLean, N.M., T.S. Stephenson, M.A. Taylor, and J.D. Campbell, 2015: Characterization of Future Caribbean Rainfall and Temperature Extremes across Rainfall Zones. Advances in Meteorology, 2015, 425987, doi: 10.1155/2015/425987.
McLean, R. and P. Kench, 2015: Destruction or persistence of coral atoll islands in the face of 20th and 21st century sea-level rise?WIREs Climate Change, 6(5), 445–463, doi: 10.1002/wcc.350.
McMillan, H., B. Jackson, and S. Poyck, 2010: Flood Risk Under Climate Change: A framework for assessing the impacts of climate change on river flow and floods, using dynamically-downscaled climate scenarios. A case study for the Uawa (East Cape) and Waihou (Northland) catchments. National Institute of Water and Atmospheric Research (NIWA), Christchurch, New Zealand, 63 pp., https://niwa.co.nz/sites/niwa.co.nz/files/import/attachments/chc2010_033_Flood_Risk_CC.pdf .
McMillan, H. et al., 2012: The Urban Impacts Toolbox. Weather and Climate, 32(2), 21, doi: 10.2307/26169731.
McVicar, T.R. et al., 2012: Global review and synthesis of trends in observed terrestrial near-surface wind speeds: Implications for evaporation. Journal of Hydrology, 416–417, 182–205, doi: 10.1016/j.jhydrol.2011.10.024.
MedECC, 2020: Climate and Environmental Change in the Mediterranean Basin – Current Situation and Risks for the Future. First Mediterranean Assessment Report[Cramer, W., J. Guiot, and K. Marini (eds.)]. Union for the Mediterranean, Plan Bleu, UNEP/MAP, Marseille, France, 600 pp., w ww.medecc. org/first-mediterranean-assessment-report-mar1/
Mediero, L., D. Santillán, L. Garrote, and A. Granados, 2014: Detection and attribution of trends in magnitude, frequency and timing of floods in Spain. Journal of Hydrology, 517, 1072–1088, doi: 10.1016/j.jhydrol.2014.06.040.
Mediero, L. et al., 2015: Identification of coherent flood regions across Europe by using the longest streamflow records. Journal of Hydrology, 528, 341–360, doi: 10.1016/j.jhydrol.2015.06.016.
Medlock, J.M. et al., 2013: Driving forces for changes in geographical distribution ofIxodes ricinusticks in Europe. Parasites & Vectors, 6(1), 1, doi: 10.1186/1756-3305-6-1.
Mei, W. and S.P. Xie, 2016: Intensification of landfalling typhoons over the northwest Pacific since the late 1970s. Nature Geoscience, 9(10), 753–757, doi: 10.1038/ngeo2792.
Meixner, T. et al., 2016: Implications of projected climate change for groundwater recharge in the western United States. Journal of Hydrology, 534, 124–138, doi: 10.1016/j.jhydrol.2015.12.027.
Mekis, É, L.A. Vincent, M.W. Shephard, and X. Zhang, 2015: Observed Trends in Severe Weather Conditions Based on Humidex, Wind Chill, and Heavy Rainfall Events in Canada for 1953–2012. Atmosphere-Ocean, 53(4), 383–397, doi: 10.1080/07055900.2015.1086970.
Melchiorre, C. and P. Frattini, 2012: Modelling probability of rainfall-induced shallow landslides in a changing climate, Otta, Central Norway. Climatic Change, 113(2), 413–436, doi: 10.1007/s10584-011-0325-0.
Melet, A., B. Meyssignac, R. Almar, and G. Le Cozannet, 2018: Under-estimated wave contribution to coastal sea-level rise. Nature Climate Change, 8(3), 234–239, doi: 10.1038/s41558-018-0088-y.
Melvin, A.M. et al., 2017: Climate change damages to Alaska public infrastructure and the economics of proactive adaptation. Proceedings of the National Academy of Sciences, 114(2), E122–E131, doi: 10.1073/pnas.1611056113.
Mentaschi, L., M.I. Vousdoukas, E. Voukouvalas, A. Dosio, and L. Feyen, 2017: Global changes of extreme coastal wave energy fluxes triggered by intensified teleconnection patterns. Geophysical Research Letters, 44(5), 2416–2426, doi: 10.1002/2016gl072488.
Mentaschi, L., M.I. Vousdoukas, J.-F. Pekel, E. Voukouvalas, and L. Feyen, 2018: Global long-term observations of coastal erosion and accretion. Scientific Reports, 8(1), 12876, doi: 10.1038/s41598-018-30904-w.
Meredith, M. et al., 2019: Polar Regions. In: IPCC Special Report on the Ocean and Cryosphere in a Changing Climate[Pörtner, H.-O., D.C. Roberts, V. Masson-Delmotte, P. Zhai, M. Tignor, E. Poloczanska, K. Mintenbeck, A. Alegría, M. Nicolai, A. Okem, J. Petzold, B. Rama, and N.M. Weyer (eds.)]. In Press, pp. 203–320, www.ipcc.ch/srocc/chapter/chapter-3-2.
Mernild, S.H., E. Hanna, J.C. Yde, J. Cappelen, and J.K. Malmros, 2014: Coastal Greenland air temperature extremes and trends 1890–2010: annual and monthly analysis. International Journal of Climatology, 34(5), 1472–1487, doi: 10.1002/joc.3777.
Mernild, S.H., G.E. Liston, C.A. Hiemstra, J.C. Yde, and G. Casassa, 2018: Annual River Runoff Variations and Trends for the Andes Cordillera. Journal of Hydrometeorology, 19(7), 1167–1189, doi: 10.1175/jhm-d-17-0094.1.
Mernild, S.H. et al., 2017: The Andes Cordillera. Part I: snow distribution, properties, and trends (1979–2014). International Journal of Climatology, 37(4), 1680–1698, doi: 10.1002/joc.4804.
Merrifield, M.A., J.M. Becker, M. Ford, and Y. Yao, 2014: Observations and estimates of wave-driven water level extremes at the Marshall Islands. Geophysical Research Letters, 41(20), 7245–7253, doi: 10.1002/2014gl061005.
Messina, J.P. et al., 2019: The current and future global distribution and population at risk of dengue. Nature Microbiology, 4(9), 1508–1515, doi: 10.1038/s41564-019-0476-8.
MfE, 2018: Climate Change Projections for New Zealand: Atmosphere Projections Based on Simulations from the IPCC Fifth Assessment, 2nd Edition. Ministry for the Environment (MfE), Wellington, New Zealand, 131 pp., www.mfe.govt.nz/publications/climate-change/climate-change-projections-new-zealand.
MfE and Stats NZ, 2017: Our atmosphere and climate 2017. New Zealand’s Environmental Reporting Series, Ministry for the Environment (MfE) and Stats NZ, New Zealand, 58 pp., www.mfe.govt.nz/publications/environmental-reporting/our-atmosphere-and-climate-2017.
MfE and Stats NZ, 2020: Our atmosphere and climate 2020. New Zealand’s Environmental Reporting Series, Ministry for the Environment (MfE) and Stats NZ, New Zealand, 79 pp., www.mfe.govt.nz/publications/environmental-reporting/our-atmosphere-and-climate-2020.
Micu, D.M., A. Dumitrescu, S. Cheval, I.-A. Nita, and M.-V. Birsan, 2021: Temperature changes and elevation-warming relationships in the Carpathian Mountains. International Journal of Climatology, 41(3), 2154–2172, doi: 10.1002/joc.6952.
Middleton, N., P. Tozer, and B. Tozer, 2019: Sand and dust storms: underrated natural hazards. Disasters, 43(2), 390–409, doi: 10.1111/disa.12320.
Millar, C.I. and N.L. Stephenson, 2015: Temperate forest health in an era of emerging megadisturbance. Science, 349(6250), 823–826, doi: 10.1126/science.aaa9933.
Mills, L.S. et al., 2013: Camouflage mismatch in seasonal coat color due to decreased snow duration. Proceedings of the National Academy of Sciences, 110(18), 7360–7365, doi: 10.1073/pnas.1222724110.
Mills, M. et al., 2016: Perceived and projected flood risk and adaptation in coastal Southeast Queensland, Australia. Climatic Change, 136(3–4), 523–537, doi: 10.1007/s10584-016-1644-y.
Milner, A.M. et al., 2017: Glacier shrinkage driving global changes in downstream systems. Proceedings of the National Academy of Sciences, 114(37), 9770–9778, doi: 10.1073/pnas.1619807114.
Minderhoud, P.S.J., H. Middelkoop, G. Erkens, and E. Stouthamer, 2020: Groundwater extraction may drown mega-delta: projections of extraction-induced subsidence and elevation of the Mekong delta for the 21st century. Environmental Research Communications, 2(1), 011005, doi: 10.1088/2515-7620/ab5e21.
Minderhoud, P.S.J., L. Coumou, G. Erkens, H. Middelkoop, and E. Stouthamer, 2019: Mekong delta much lower than previously assumed in sea-level rise impact assessments. Nature Communications, 10(1), 3847, doi: 10.1038/s41467-019-11602-1.
Minderhoud, P.S.J. et al., 2017: Impacts of 25 years of groundwater extraction on subsidence in the Mekong delta, Vietnam. Environmental Research Letters, 12(6), 64006, doi: 10.1088/1748-9326/aa7146.
Mirzabaev, A. et al., 2019: Desertification. In: Climate Change and Land: an IPCC special report on climate change, desertification, land degradation, sustainable land management, food security, and greenhouse gas fluxes in terrestrial ecosystems[Shukla, P.R., J. Skea, E.C. Buendia, V. Masson-Delmotte, H.-O. Pörtner, D.C. Roberts, P. Zhai, R. Slade, S. Connors, R. Diemen, M. Ferrat, E. Haughey, S. Luz, S. Neogi, M. Pathak, J. Petzold, J.P. Pereira, P. Vyas, E. Huntley, K. Kissick, M. Belkacemi, and J. Malley (eds.)]. In press, pp. 249–343, www.ipcc.ch/srccl/chapter/chapter-3.
Mishra, V., 2020: Long-term (1870–2018) drought reconstruction in context of surface water security in India. Journal of Hydrology, 580, 124228, doi: 10.1016/j.jhydrol.2019.124228.
Mishra, V., S. Mukherjee, R. Kumar, and D.A. Stone, 2017: Heat wave exposure in India in current, 1.5°C, and 2.0°C worlds. Environmental Research Letters, 12(12), 124012, doi: 10.1088/1748-9326/aa9388.
Mitchell, D. et al., 2017: Half a degree additional warming, prognosis and projected impacts (HAPPI): background and experimental design. Geoscientific Model Development, 10(2), 571–583, doi: 10.5194/gmd-10-571-2017.
Mock, C.J. and K.W. Birkeland, 2000: Snow Avalanche Climatology of the Western United States Mountain Ranges. Bulletin of the American Meteorological Society, 81(10), 2367–2392, doi: 10.1175/1520-0477(2000)081<2367:sacotw>2.3.co;2.
Mock, C.J., K.C. Carter, and K.W. Birkeland, 2017: Some Perspectives on Avalanche Climatology. Annals of the American Association of Geographers, 107(2), 299–308, doi: 10.1080/24694452.2016.1203285.
MOE, MEXT, MAFF, MLIT, and JMA, 2018: Climate Change in Japan and Its Impacts. Ministry of the Environment (MOE), Ministry of Education, Culture, Sports, Science and Technology (MEXT), Ministry of Agriculture, Forestry and Fisheries (MAFF), Ministry of Land, Infrastructure, Transport and Tourism (MLIT) and Japan Meteorological Agenc, Japan, 8 pp., w ww.env. go.jp/earth/tekiou/pamph2018_full_Eng.pdf .
Moemken, J., M. Reyers, H. Feldmann, and J.G. Pinto, 2018: Future Changes of Wind Speed and Wind Energy Potentials in EURO-CORDEX Ensemble Simulations. Journal of Geophysical Research: Atmospheres, 123(12), 6373–6389, doi: 10.1029/2018jd028473.
Mohammed, K. et al., 2018: Future Floods in Bangladesh under 1.5°C, 2°C, and 4°C Global Warming Scenarios. Journal of Hydrologic Engineering, 23(12), 04018050, doi: 10.1061/(asce)he.1943-5584.0001705.
Mohammed, R. and M. Scholz, 2018: Critical review of salinity intrusion in rivers and estuaries. Journal of Water and Climate Change, 9(1), 1–16, doi: 10.2166/wcc.2017.334.
Mohr, S., M. Kunz, and B. Geyer, 2015a: Hail potential in Europe based on a regional climate model hindcast. Geophysical Research Letters, 42(24), 10904–10912, doi: 10.1002/2015gl067118.
Mohr, S., M. Kunz, and K. Keuler, 2015b: Development and application of a logistic model to estimate the past and future hail potential in Germany. Journal of Geophysical Research: Atmospheres, 120(9), 3939–3956, doi: 10.1002/2014jd022959.
Mölter, T., D. Schindler, A. Albrecht, and U. Kohnle, 2016: Review on the Projections of Future Storminess over the North Atlantic European Region. Atmosphere, 7(4), 60, doi: 10.3390/atmos7040060.
Monaco, C.J. and C.D. McQuaid, 2019: Climate warming reduces the reproductive advantage of a globally invasive intertidal mussel. Biological Invasions, 21(7), 2503–2516, doi: 10.1007/s10530-019-01990-2.
Monaghan, A.J. et al., 2018: The potential impacts of 21st century climatic and population changes on human exposure to the virus vector mosquito Aedes aegypti. Climatic Change, 146(3–4), 487–500, doi: 10.1007/s10584-016-1679-0.
Mondoro, A., D.M. Frangopol, and L. Liu, 2018: Bridge Adaptation and Management under Climate Change Uncertainties: A Review. Natural Hazards Review, 19(1), 04017023, doi: 10.1061/(asce)nh.1527-6996.0000270.
Monioudi, I.N. et al., 2017: Assessment of island beach erosion due to sea level rise: the case of the Aegean archipelago (Eastern Mediterranean). Natural Hazards and Earth System Sciences, 17(3), 449–466, doi: 10.5194/nhess-17-449-2017.
Monsieurs, E., O. Dewitte, and A. Demoulin, 2019: A susceptibility-based rainfall threshold approach for landslide occurrence. Natural Hazards and Earth System Sciences, 19(4), 775–789, doi: 10.5194/nhess-19-775-2019.
Montroull, N.B., R.I. Saurral, and I.A. Camilloni, 2018: Hydrological impacts in La Plata basin under 1.5, 2 and 3°C global warming above the pre-industrial level. International Journal of Climatology, 38(8), 3355–3368, doi: 10.1002/joc.5505.
Moore, J.K. et al., 2018: Sustained climate warming drives declining marine biological productivity. Science, 359(6380), 1139–1143, doi: 10.1126/science.aao6379.
Mora, C. et al., 2017: Global risk of deadly heat. Nature Climate Change, 7(7), 501–506, doi: 10.1038/nclimate3322.
Mora, C. et al., 2018: Broad threat to humanity from cumulative climate hazards intensified by greenhouse gas emissions. Nature Climate Change, 8(12), 1062–1071, doi: 10.1038/s41558-018-0315-6.
Mordecai, E.A. et al., 2013: Optimal temperature for malaria transmission is dramatically lower than previously predicted. Ecology Letters, 16(1), 22–30, doi: 10.1111/ele.12015.
Mordecai, E.A. et al., 2017: Detecting the impact of temperature on transmission of Zika, dengue, and chikungunya using mechanistic models. PLOS Neglected Tropical Diseases, 11(4), e0005568, doi: 10.1371/journal.pntd.0005568.
Mori, M., Y. Kosaka, M. Watanabe, H. Nakamura, and M. Kimoto, 2019: A reconciled estimate of the influence of Arctic sea-ice loss on recent Eurasian cooling. Nature Climate Change, 9(2), 123–129, doi: 10.1038/s41558-018-0379-3.
Morin, S. et al., 2018: The mountain component of the Copernicus Climate Change Services – Sectoral Information Service “European Tourism”: towards pan-European analysis and projections of natural and managed snow conditions. In: Proceedings, International Snow Science Workshop, Innsbruck, Austria, 2018. pp. 542–547, https://arc.lib.montana.edu/snow-science/item.php?id=2593.
Moritz, M.A. et al., 2012: Climate change and disruptions to global fire activity. Ecosphere, 3(6), 1–22, doi: 10.1890/es11-00345.1.
Mortlock, T., I. Goodwin, J. McAneney, and K. Roche, 2017: The June 2016 Australian East Coast Low: Importance of Wave Direction for Coastal Erosion Assessment. Water, 9(2), 121, doi: 10.3390/w9020121.
Moss, B. et al., 2011: Allied attack: climate change and eutrophication. Inland Waters, 1(2), 101–105, doi: 10.5268/iw-1.2.359.
Moss, R.H. et al., 2010: The next generation of scenarios for climate change research and assessment. Nature, 463(7282), 747–756, doi: 10.1038/nature08823.
Mote, P.W., A.F. Hamlet, M.P. Clark, and D.P. Lettenmaier, 2005: Declining Mountain Snowpack in Western North America. Bulletin of the American Meteorological Society, 86(1), 39–50, doi: 10.1175/bams-86-1-39.
Mote, P.W., S. Li, D.P. Lettenmaier, M. Xiao, and R. Engel, 2018: Dramatic declines in snowpack in the western US. npj Climate and Atmospheric Science, 1(1), 2, doi: 10.1038/s41612-018-0012-1.
Mu, J.E., B.M. Sleeter, J.T. Abatzoglou, and J.M. Antle, 2017: Climate impacts on agricultural land use in the USA: the role of socio-economic scenarios. Climatic Change, 144(2), 329–345, doi: 10.1007/s10584-017-2033-x.
Mudersbach, C., J. Bender, and F. Netzel, 2017: An analysis of changes in flood quantiles at the gauge Neu Darchau (Elbe River) from 1875 to 2013. Stochastic Environmental Research and Risk Assessment, 31(1), 145–157, doi: 10.1007/s00477-015-1173-7.
Mudryk, L.R. et al., 2018: Canadian snow and sea ice: historical trends and projections. The Cryosphere, 12(4), 1157–1176, doi: 10.5194/tc-12-1157-2018.
Mueller, B. et al., 2015: Lengthening of the growing season in wheat and maize producing regions. Weather and Climate Extremes, 9, 47–56, doi: 10.1016/j.wace.2015.04.001.
Mueller, N.D. et al., 2017: Global Relationships between Cropland Intensification and Summer Temperature Extremes over the Last 50 Years. Journal of Climate, 30(18), 7505–7528, doi: 10.1175/jcli-d-17-0096.1.
Mukherjee, S. and V. Mishra, 2018: A sixfold rise in concurrent day and night-time heatwaves in India under 2°C warming. Scientific reports, 8(1), 16922, doi: 10.1038/s41598-018-35348-w.
Mukherjee, S., A. Mishra, and K.E. Trenberth, 2018: Climate Change and Drought: a Perspective on Drought Indices. Current Climate Change Reports, 4(2), 145–163, doi: 10.1007/s40641-018-0098-x.
Mullan, D. et al., 2017: Climate change and the long-term viability of the World’s busiest heavy haul ice road. Theoretical and Applied Climatology, 129(3–4), 1089–1108, doi: 10.1007/s00704-016-1830-x.
Müller, C., J. Elliott, and A. Levermann, 2014: Fertilizing hidden hunger. Nature Climate Change, 4(7), 540–541, doi: 10.1038/nclimate2290.
Murage, P., S. Hajat, and R.S. Kovats, 2017: Effect of night-time temperatures on cause and age-specific mortality in London. Environmental Epidemiology, 1(2), e005, doi: 10.1097/ee9.0000000000000005.
Murakami, H., P.C. Hsu, O. Arakawa, and T. Li, 2014: Influence of model biases on projected future changes in tropical cyclone frequency of occurrence. Journal of Climate, 27(5), 2159–2181, doi: 10.1175/jcli-d-13-00436.1.
Murari, K.K., S. Ghosh, A. Patwardhan, E. Daly, and K. Salvi, 2015: Intensification of future severe heat waves in India and their effect on heat stress and mortality. Regional Environmental Change, 15(4), 569–579, doi: 10.1007/s10113-014-0660-6.
Musselman, K.N., M.P. Clark, C. Liu, K. Ikeda, and R. Rasmussen, 2017: Slower snowmelt in a warmer world. Nature Climate Change, 7(3), 214–219, doi: 10.1038/nclimate3225.
Muthige, M.S. et al., 2018: Projected changes in tropical cyclones over the South West Indian Ocean under different extents of global warming. Environmental Research Letters, 13(6), 065019, doi: 10.1088/1748-9326/aabc60.
Myers, S.S. et al., 2014: Increasing CO2 threatens human nutrition. Nature, 510(7503), 139–142, doi: 10.1038/nature13179.
Myers, S.S. et al., 2017: Climate Change and Global Food Systems: Potential Impacts on Food Security and Undernutrition. Annual Review of Public Health, 38(1), 259–277, doi: 10.1146/annurev-publhealth-031816-044356.
Myers-Smith, I.H. et al., 2015: Climate sensitivity of shrub growth across the tundra biome. Nature Climate Change, 5(9), 887–891, doi: 10.1038/nclimate2697.
Nabavi, S.O., L. Haimberger, and C. Samimi, 2016: Climatology of dust distribution over West Asia from homogenized remote sensing data. Aeolian Research, 21, 93–107, doi: 10.1016/j.aeolia.2016.04.002.
Nabeel, A. and H. Athar, 2020: Stochastic projection of precipitation and wet and dry spells over Pakistan using IPCC AR5 based AOGCMs. Atmospheric Research, 234, 104742, doi: 10.1016/j.atmosres.2019.104742.
Nagelkerken, I. and S.D. Connell, 2015: Global alteration of ocean ecosystem functioning due to increasing human CO2 emissions. Proceedings of the National Academy of Sciences, 112(43), 13272–13277, doi: 10.1073/pnas.1510856112.
Nagelkerken, I. and P.L. Munday, 2016: Animal behaviour shapes the ecological effects of ocean acidification and warming: Moving from individual to community-level responses. Global Change Biology, 22(3), 974–989, doi: 10.1111/gcb.13167.
Nakaegawa, T. and W. Vergara, 2010: First Projection of Climatological Mean River Discharges in the Magdalena River Basin, Colombia, in a Changing Climate during the 21st Century. Hydrological Research Letters, 4, 50–54, doi: 10.3178/hrl.4.50.
Nakaegawa, T., A. Kitoh, S. Kusunoki, H. Murakami, and O. Arakawa, 2014: Hydroclimate changes over Central America and the Caribbean in a global warming climate projected with 20-km and 60-km mesh MRI atmospheric general circulation models. Papers in Meteorology and Geophysics, 65, 15–33, doi: 10.2467/mripapers.65.15.
Nangombe, S. et al., 2018: Record-breaking climate extremes in Africa under stabilized 1.5°C and 2°C global warming scenarios. Nature Climate Change, 8(5), 375–380, doi: 10.1038/s41558-018-0145-6.
Narama, C. et al., 2018: Large drainages from short-lived glacial lakes in the Teskey Range, Tien Shan Mountains, Central Asia. Natural Hazards and Earth System Sciences, 18(4), 983–995, doi: 10.5194/nhess-18-983-2018.Narayanan, S., P.V. Prasad, A.K. Fritz, D.L. Boyle, and B.S. Gill, 2015: Impact of High Night-Time and High Daytime Temperature Stress on Winter Wheat. Journal of Agronomy and Crop Science, 201(3), 206–218, doi: 10.1111/jac.12101.
NASEM, 2012: Airport Climate Adaptation and Resilience. National Academies of Sciences, Engineering, and Medicine (NASEM). The National Academies Press, Washington, DC, USA, 87 pp., doi: 10.17226/22773.
Nasim, W. et al., 2018: Future risk assessment by estimating historical heat wave trends with projected heat accumulation using SimCLIM climate model in Pakistan. Atmospheric Research, 205, 118–133, doi: 10.1016/j.atmosres.2018.01.009.
Naumann, G. et al., 2018: Global Changes in Drought Conditions Under Different Levels of Warming. Geophysical Research Letters, 45(7), 3285–3296, doi: 10.1002/2017gl076521.
Neff, J.C. et al., 2008: Increasing eolian dust deposition in the western United States linked to human activity. Nature Geoscience, 1(3), 189–195, doi: 10.1038/ngeo133.
Nehren, U., A. Kirchner, W. Lange, M. Follador, and D. Anhuf, 2019: Natural Hazards and Climate Change Impacts in the State of Rio de Janeiro: A Landscape Historical Analysis. Strategies and Tools for a Sustainable Rural Rio de Janeiro, 313–330, doi: 10.1007/978-3-319-89644-1_20.
Neri, A., G. Villarini, and F. Napolitano, 2020: Statistically-based projected changes in the frequency of flood events across the U.S. Midwest. Journal of Hydrology, 584, 124314, doi: 10.1016/j.jhydrol.2019.124314.
Neri, A., G. Villarini, L.J. Slater, and F. Napolitano, 2019: On the statistical attribution of the frequency of flood events across the U.S. Midwest. Advances in Water Resources, 127, 225–236, doi: 10.1016/j.advwatres.2019.03.019.
Neumann, B., A.T. Vafeidis, J. Zimmermann, and R.J. Nicholls, 2015: Future Coastal Population Growth and Exposure to Sea-Level Rise and Coastal Flooding – A Global Assessment. PLOS ONE, 10(3), e0118571, doi: 10.1371/journal.pone.0118571.
Neumann, J.E. et al., 2015: Climate change risks to US infrastructure: impacts on roads, bridges, coastal development, and urban drainage. Climatic Change, 131(1), 97–109, doi: 10.1007/s10584-013-1037-4.
Newth, D. and D. Gunasekera, 2018: Projected Changes in Wet-Bulb Globe Temperature under Alternative Climate Scenarios. Atmosphere, 9(5), 187, doi: 10.3390/atmos9050187.
Nguyen, T.-H., S.-K. Min, S. Paik, and D. Lee, 2018: Time of emergence in regional precipitation changes: an updated assessment using the CMIP5 multi-model ensemble. Climate Dynamics, 51(9), 3179–3193, doi: 10.1007/s00382-018-4073-y.
Ni, X. et al., 2017: Decreased hail size in China since 1980. Scientific Reports, 7(1), 10913, doi: 10.1038/s41598-017-11395-7.
Nicholls, R.J., 2015: Chapter 9 – Adapting to Sea Level Rise. In: Coastal and Marine Hazards, Risks, and Disasters[Shroder, J.F., J.T. Ellis, and D.J. Sherman (eds.)]. Elsevier, Boston, MA, USA, pp. 243–270, doi: 10.1016/b978-0-12-396483-0.00009-1.
Nienhuis, J.H. et al., 2020: Global-scale human impact on delta morphology has led to net land area gain. Nature, 577(7791), 514–518, doi: 10.1038/s41586-019-1905-9.
Nik, V.M., A.T.D. Perera, and D. Chen, 2020: Towards climate resilient urban energy systems: a review. National Science Review, 8(3), nwaa134, doi: 10.1093/nsr/nwaa134.
Nikulin, G. et al., 2018: The effects of 1.5 and 2 degrees of global warming on Africa in the CORDEX ensemble. Environmental Research Letters, 13(6), 065003, doi: 10.1088/1748-9326/aab1b1.
Ning, L. and R.S. Bradley, 2015: Snow occurrence changes over the central and eastern United States under future warming scenarios. Scientific reports, 5, 17073, doi: 10.1038/srep17073.
Nissan, H. et al., 2019: On the use and misuse of climate change projections in international development. WIREs Climate Change, 10(3), e579, doi: 10.1002/wcc.579.
Nissen, K.M., G.C. Leckebusch, J.G. Pinto, and U. Ulbrich, 2014: Mediterranean cyclones and windstorms in a changing climate. Regional Environmental Change, 14(5), 1873–1890, doi: 10.1007/s10113-012-0400-8.
Nka, B.N., L. Oudin, H. Karambiri, J.E. Paturel, and P. Ribstein, 2015: Trends in floods in West Africa: Analysis based on 11 catchments in the region. Hydrology and Earth System Sciences, 19(11), 4707–4719, doi: 10.5194/hess-19-4707-2015.
Noetzli, J. et al., 2019: Permafrost thermal state [in “State of the Climate in 2018”]. Bulletin of the American Meteorological Society, 100(9), S21–22, doi: 10.1175/2019bamsstateoftheclimate.1.
Norby, R.J., J.M. Warren, C.M. Iversen, B.E. Medlyn, and R.E. McMurtrie, 2010: CO2 enhancement of forest productivity constrained by limited nitrogen availability. Proceedings of the National Academy of Sciences, 107(45), 19368–19373, doi: 10.1073/pnas.1006463107.
Notaro, M., Y. Yu, and O. Kalashnikova, 2015: Regime shift in Arabian dust activity, triggered by persistent Fertile Crescent drought. Journal of Geophysical Research: Atmospheres, 120(19), 10229–10249, doi: 10.1002/2015jd023855.
Notz, D. and SIMIP Community, 2020: Arctic Sea Ice in CMIP6. Geophysical Research Letters, 47(10), e2019GL086749, doi: 10.1029/2019gl086749.
Nourani, E., N.M. Yamaguchi, and H. Higuchi, 2017: Climate change alters the optimal wind-dependent flight routes of an avian migrant. Proceedings of the Royal Society B: Biological Sciences, 284(1854), 20170149, doi: 10.1098/rspb.2017.0149.
Nowreen, S., S.B. Murshed, A.K.M.S. Islam, B. Bhaskaran, and M.A. Hasan, 2015: Changes of rainfall extremes around the haor basin areas of Bangladesh using multi-member ensemble RCM. Theoretical and Applied Climatology, 119(1–2), 363–377, doi: 10.1007/s00704-014-1101-7.
Núñez, E., M. Vásquez, B. Beltrán-Luque, and D. Padgett, 2016: Virus Zika en Centroamérica y sus complicaciones (Zika virus in Central America and its complications). Acta Médica Peruana, 33(1), 42–49, www.scielo.org.pe/scielo.php?script=sci_arttext&pid=S1728-59172016000100008.
Nurse, L.A. et al., 2014: Small Islands. In: Climate Change 2014: Impacts, Adaptation, and Vulnerability. Part B: Regional Aspects. Contribution of working Group II to the Fifth Assessment Report of the Intergovernmental Panel on Climate Change[Barros, V.R., C.B. Field, D.J. Dokken, M.D. Mastrandrea, K.J. Mach, T.E. Bilir, M. Chatterjee, K.L. Ebi, Y.O. Estrada, R.C. Genova, B. Girma, E.S. Kissel, A.N. Levy, S. MacCracken, P.R. Mastrandrea, and L.L. White (eds.)]. Cambridge University Press, Cambridge, United Kingdom and New York, NY, USA, pp. 1613–1654, doi: 10.1017/cbo9781107415386.009.
Nyangiwe, N., M. Yawa, and V. Muchenje, 2018: Driving forces for changes in geographic range of cattle ticks (Acari: Ixodidae) in Africa: A review. South African Journal of Animal Science, 48(5), 829, doi: 10.4314/sajas.v48i5.4.
O’Gorman, P.A., 2014: Contrasting responses of mean and extreme snowfall to climate change. Nature, 512(7515), 416–418, doi: 10.1038/nature13625.
O’Grady, J.G. et al., 2019: Extreme Water Levels for Australian Beaches Using Empirical Equations for Shoreline Wave Setup. Journal of Geophysical Research: Oceans, 124(8), 5468–5484, doi: 10.1029/2018jc014871.
O’Loingsigh, T. et al., 2014: The Dust Storm Index (DSI): A method for monitoring broadscale wind erosion using meteorological records. Aeolian Research, 12, 29–40, doi: 10.1016/j.aeolia.2013.10.004.
O’Neill, B.C. et al., 2017: IPCC reasons for concern regarding climate change risks. Nature Climate Change, 7(1), 28–37, doi: 10.1038/nclimate3179.
O’Neill, B.C. et al., 2018: The Benefits of Reduced Anthropogenic Climate changE (BRACE): a synthesis. Climatic Change, 146(3–4), 287–301, doi: 10.1007/s10584-017-2009-x.
O’Reilly, C.M. et al., 2015: Rapid and highly variable warming of lake surface waters around the globe. Geophysical Research Letters, 42(24), 10773–10781, doi: 10.1002/2015gl066235.
Ogden, N.H., 2017: Climate change and vector-borne diseases of public health significance. FEMS Microbiology Letters, 364(19), fnx186, doi: 10.1093/femsle/fnx186.
Oguntunde, P.G., G. Lischeid, and B.J. Abiodun, 2018: Impacts of climate variability and change on drought characteristics in the Niger River Basin, West Africa. Stochastic Environmental Research and Risk Assessment, 32(4), 1017–1034, doi: 10.1007/s00477-017-1484-y.
Oguntunde, P.G., B.J. Abiodun, G. Lischeid, and A.A. Abatan, 2020: Droughts projection over the Niger and Volta River basins of West Africa at specific global warming levels. International Journal of Climatology, 40(13), 5688–5699, doi: 10.1002/joc.6544.
Ohba, M., 2019: The Impact of Global Warming on Wind Energy Resources and Ramp Events in Japan. Atmosphere, 10(5), 265, doi: 10.3390/atmos10050265.
Ohba, M. and S. Sugimoto, 2020: Impacts of climate change on heavy wet snowfall in Japan. Climate Dynamics, 54(5), 3151–3164, doi: 10.1007/s00382-020-05163-z.
Olazabal, M., A. Chiabai, S. Foudi, and M.B. Neumann, 2018: Emergence of new knowledge for climate change adaptation. Environmental Science & Policy, 83, 46–53, doi: 10.1016/j.envsci.2018.01.017.
Oleson, K.W., G.B. Anderson, B. Jones, S.A. McGinnis, and B. Sanderson, 2018: Avoided climate impacts of urban and rural heat and cold waves over the U.S. using large climate model ensembles for RCP8.5 and RCP4.5. Climatic Change, 146(3–4), 377–392, doi: 10.1007/s10584-015-1504-1.
Oliver, E.C.J. et al., 2018: Longer and more frequent marine heatwaves over the past century. Nature Communications, 9(1), 1324, doi: 10.1038/s41467-018-03732-9.
Olson, D.M. and E. Dinerstein, 2002: The Global 200: Priority Ecoregions for Global Conservation. Annals of the Missouri Botanical Garden, 89(2), 199–224, doi: 10.2307/3298564.
Olsson, L. et al., 2019: Land Degradation. In: Climate Change and Land: an IPCC special report on climate change, desertification, land degradation, sustainable land management, food security, and greenhouse gas fluxes in terrestrial ecosystems[Shukla, P.R., J. Skea, E.C. Buendia, V. Masson-Delmotte, H.-O. Pörtner, D.C. Roberts, P. Zhai, R. Slade, S. Connors, R. Diemen, M. Ferrat, E. Haughey, S. Luz, S. Neogi, M. Pathak, J. Petzold, J.P. Pereira, P. Vyas, E. Huntley, K. Kissick, M. Belkacemi, and J. Malley (eds.)]. In Press, pp. 345–436, www.ipcc.ch/srccl/chapter/chapter-4.
Oppenheimer, M. et al., 2019: Sea Level Rise and Implications for Low Lying Islands, Coasts and Communities. In: IPCC Special Report on the Ocean and Cryosphere in a Changing Climate[Pörtner, H.-O., D.C. Roberts, V. Masson-Delmotte, P. Zhai, M. Tignor, E. Poloczanska, K. Mintenbeck, A. Alegría, M. Nicolai, A. Okem, J. Petzold, B. Rama, and N.M. Weyer (eds.)]. In Press, pp. 321–446, www.ipcc.ch/srocc/chapter/chapter-4-sea-level-rise-and-implications-for-low-lying-islands-coasts-and-communities.
Orlov, A., J. Sillmann, A. Aaheim, K. Aunan, and K. de Bruin, 2019: Economic Losses of Heat-Induced Reductions in Outdoor Worker Productivity: a Case Study of Europe. Economics of Disasters and Climate Change, 3(3), 191–211, doi: 10.1007/s41885-019-00044-0.
Orr, S.A., M. Young, D. Stelfox, J. Curran, and H. Viles, 2018: Wind-driven rain and future risk to built heritage in the United Kingdom: Novel metrics for characterising rain spells. Science of the Total Environment, 640–641, 1098–1111, doi: 10.1016/j.scitotenv.2018.05.354.
Orru, H., K.L. Ebi, and B. Forsberg, 2017: The Interplay of Climate Change and Air Pollution on Health. Current environmental health reports, 4(4), 504–513, doi: 10.1007/s40572-017-0168-6.
Osland, M.J., N. Enwright, R.H. Day, and T.W. Doyle, 2013: Winter climate change and coastal wetland foundation species: salt marshes vs. mangrove forests in the southeastern United States. Global Change Biology, 19(5), 1482–1494, doi: 10.1111/gcb.12126.
Osuch, M., D. Lawrence, H.K. Meresa, J.J. Napiorkowski, and R.J. Romanowicz, 2017: Projected changes in flood indices in selected catchments in Poland in the 21st century. Stochastic Environmental Research and Risk Assessment, 31(9), 2435–2457, doi: 10.1007/s00477-016-1296-5.
Otkin, J.A. et al., 2018: Flash Droughts: A Review and Assessment of the Challenges Imposed by Rapid-Onset Droughts in the United States. Bulletin of the American Meteorological Society, 99(5), 911–919, doi: 10.1175/bams-d-17-0149.1.
Otto, F.E.L. et al., 2018: Anthropogenic influence on the drivers of the Western Cape drought 2015–2017. Environmental Research Letters, 13(12), 124010, doi: 10.1088/1748-9326/aae9f9.
Ouédraogo, M. et al., 2018: Farmers’ Willingness to Pay for Climate Information Services: Evidence from Cowpea and Sesame Producers in Northern Burkina Faso. Sustainability, 10(3), 611, doi: 10.3390/su10030611.
Outten, S.D. and I. Esau, 2013: Extreme winds over Europe in the ENSEMBLES regional climate models. Atmospheric Chemistry and Physics, 13(10), 5163–5172, doi: 10.5194/acp-13-5163-2013.
Oziel, L. et al., 2017: Role for Atlantic inflows and sea ice loss on shifting phytoplankton blooms in the Barents Sea. Journal of Geophysical Research: Oceans, 122(6), 5121–5139, doi: 10.1002/2016jc012582.
Ozturk, T., M.T. Turp, M. Türkeş, and M.L. Kurnaz, 2017: Projected changes in temperature and precipitation climatology of Central Asia CORDEX Region by using RegCM4.3.5. Atmospheric Research, 183, 296–307, doi: 10.1016/j.atmosres.2016.09.008.
Pabón-Caicedo, J.D. et al., 2020: Observed and Projected Hydroclimate Changes in the Andes. Frontiers in Earth Science, 8, 61, doi: 10.3389/feart.2020.00061.
Pal, J.S. and E.A.B. Eltahir, 2016: Future temperature in southwest Asia projected to exceed a threshold for human adaptability. Nature Climate Change, 6(2), 197–200, doi: 10.1038/nclimate2833.
Palazzi, E., L. Mortarini, S. Terzago, and J. von Hardenberg, 2019: Elevation-dependent warming in global climate model simulations at high spatial resolution. Climate Dynamics, 52(5–6), 2685–2702, doi: 10.1007/s00382-018-4287-z.
Palko, K.G., 2017: Synthesis. In: Climate risks and adaptation practices for the Canadian transportation sector 2016[Palko, K. and D.S. Lemmen (eds.)]. Government of Canada, Ottawa, ON, Canada, pp. 12–25, www.nrcan.gc.ca/climate-change/impacts-adaptations/climate-risks-adaptation-practices-canadian-transportation-sector-2016/19623.
Pall, P., L.M. Tallaksen, and F. Stordal, 2019: A climatology of rain-on-snow events for Norway. Journal of Climate, 32(20), 6995–7016, doi: 10.1175/jcli-d-18-0529.1.
Panthou, G., A. Mailhot, E. Laurence, and G. Talbot, 2014: Relationship between Surface Temperature and Extreme Rainfalls: A Multi-Time-Scale and Event-Based Analysis. Journal of Hydrometeorology, 15(5), 1999–2011, doi: 10.1175/jhm-d-14-0020.1.
Parasiewicz, P. et al., 2019: The role of floods and droughts on riverine ecosystems under a changing climate. Fisheries Management and Ecology, 26(6), 461–473, doi: 10.1111/fme.12388.
Paritsis, J. and T.T. Veblen, 2011: Dendroecological analysis of defoliator outbreaks onNothofagus pumilioand their relation to climate variability in the Patagonian Andes. Global Change Biology, 17(1), 239–253, doi: 10.1111/j.1365-2486.2010.02255.x.
Park Williams, A. et al., 2013: Temperature as a potent driver of regional forest drought stress and tree mortality. Nature Climate Change, 3(3), 292–297, doi: 10.1038/nclimate1693.
Parker, C.L., C.L. Bruyère, P.A. Mooney, and A.H. Lynch, 2018: The response of land-falling tropical cyclone characteristics to projected climate change in northeast Australia. Climate Dynamics, 51(9–10), 3467–3485, doi: 10.1007/s00382-018-4091-9.
Parker, L.E. and J.T. Abatzoglou, 2016: Projected changes in cold hardiness zones and suitable overwinter ranges of perennial crops over the United States. Environmental Research Letters, 11(3), 034001, doi: 10.1088/1748-9326/11/3/034001.
Parker, L.E. and J.T. Abatzoglou, 2019: Warming Winters Reduce Chill Accumulation for Peach Production in the Southeastern United States. Climate, 7(8), 94, doi: 10.3390/cli7080094.
Parker, W.S. and G. Lusk, 2019: Incorporating User Values into Climate Services. Bulletin of the American Meteorological Society, 100(9), 1643–1650, doi: 10.1175/bams-d-17-0325.1.
Parkinson, C.L., 2014: Spatially mapped reductions in the length of the Arctic sea ice season. Geophysical Research Letters, 41(12), 4316–4322, doi: 10.1002/2014gl060434.
Parris, A., S.L. Close, R. Meyer, K. Dow, and G. Garfin, 2016: Evolving the practice of Regional Integrated Sciences and Assessments. In: Climate in Context: Science and Society Partnering for Adaptation[Parris, A.S., G.M. Garfin, K. Dow, R. Meyer, and S.L. Close (eds.)]. Wiley Online Books, John Wiley & Sons, Ltd, Chichester, UK, pp. 255–262, doi: 10.1002/9781118474785.ch12.
Partain, J.L. et al., 2016: An Assessment of the Role of Anthropogenic Climate Change in the Alaska Fire Season of 2015. Bulletin of the American Meteorological Society, 97(12), S14–S18, doi: 10.1175/bams-d-16-0149.1.
Patt, A., S. Pfenninger, and J. Lilliestam, 2013: Vulnerability of solar energy infrastructure and output to climate change. Climatic Change, 121(1), 93–102, doi: 10.1007/s10584-013-0887-0.
Patton, A.I., S.L. Rathburn, and D.M. Capps, 2019: Landslide response to climate change in permafrost regions. Geomorphology, 340, 116–128, doi: 10.1016/j.geomorph.2019.04.029.
Paull, S.H. et al., 2017: Drought and immunity determine the intensity of West Nile virus epidemics and climate change impacts. Proceedings of the Royal Society B: Biological Sciences, 284(1848), 20162078, doi: 10.1098/rspb.2016.2078.
Pearce, T., J. Ford, A.C. Willox, and B. Smit, 2015: Inuit Traditional Ecological Knowledge (TEK), Subsistence Hunting and Adaptation to Climate Change in the Canadian Arctic. Arctic, 68(2), 233–245, www.jstor.org/stable/43871322.
Pearce-Higgins, J.W., S.M. Eglington, B. Martay, and D.E. Chamberlain, 2015: Drivers of climate change impacts on bird communities. Journal of Animal Ecology, 84(4), 943–954, doi: 10.1111/1365-2656.12364.
Pederson, G.T. et al., 2011: The Unusual Nature of Recent Snowpack Declines in the North American Cordillera. Science, 333(6040), 332–335, doi: 10.1126/science.1201570.
Pederson, N. et al., 2013: Three centuries of shifting hydroclimatic regimes across the Mongolian Breadbasket. Agricultural and Forest Meteorology, 178–179, 10–20, doi: 10.1016/j.agrformet.2012.07.003.
Pedro-Monzonís, M., A. Solera, J. Ferrer, T. Estrela, and J. Paredes-Arquiola, 2015: A review of water scarcity and drought indexes in water resources planning and management. Journal of Hydrology, 527, 482–493, doi: 10.1016/j.jhydrol.2015.05.003.
Peel, J.L., R. Haeuber, V. Garcia, A.G. Russell, and L. Neas, 2013: Impact of nitrogen and climate change interactions on ambient air pollution and human health. Biogeochemistry, 114(1–3), 121–134, doi: 10.1007/s10533-012-9782-4.
Peeters, B. et al., 2019: Spatiotemporal patterns of rain-on-snow and basal ice in high Arctic Svalbard: detection of a climate-cryosphere regime shift. Environmental Research Letters, 14(1), 015002, doi: 10.1088/1748-9326/aaefb3.
Peña-Angulo, D. et al., 2020: ECTACI: European Climatology and Trend (Atlas of Climate Indices (1979–2017). Journal of Geophysical Research: Atmospheres, 125(16), e2020JD032798, doi: 10.1029/2020jd032798.
Peña-Gallardo, M. et al., 2019: Response of crop yield to different time-scales of drought in the United States: Spatio-temporal patterns and climatic and environmental drivers. Agricultural and Forest Meteorology, 264, 40–55, doi: 10.1016/j.agrformet.2018.09.019.
Pendakur, K., 2016: Northern Territories. In: Climate risks and adaptation practices for the Canadian transportation sector 2016[Palko, K. and D.S. Lemmen (eds.)]. Government of Canada, Ottawa, ON, Canada, pp. 27–64, www.nrcan.gc.ca/sites/www.nrcan.gc.ca/files/earthsciences/pdf/assess/2016/Chapter-3e.pdf .
Pender, D., D.P. Callaghan, and H. Karunarathna, 2015: An evaluation of methods available for quantifying extreme beach erosion. Journal of Ocean Engineering and Marine Energy, 1(1), 31–43, doi: 10.1007/s40722-014-0003-1.
Peng, S. et al., 2013: Asymmetric effects of daytime and night-time warming on Northern Hemisphere vegetation. Nature, 501(7465), 88–92, doi: 10.1038/nature12434.
Peng, X. et al., 2018: Spatiotemporal changes in active layer thickness under contemporary and projected climate in the Northern Hemisphere. Journal of Climate, 31(1), 251–266, doi: 10.1175/jcli-d-16-0721.1.
Pepin, N. et al., 2019: An Examination of Temperature Trends at High Elevations Across the Tibetan Plateau: The Use of MODIS LST to Understand Patterns of Elevation-Dependent Warming. Journal of Geophysical Research: Atmospheres, 124(11), 5738–5756, doi: 10.1029/2018jd029798.
Pepler, A.S., B. Trewin, and C. Ganter, 2015: The influences of climate drivers on the Australian snow season. Australian Meteorological and Oceanographic Journal, 65(2), doi: 10.22499/2.6502.002.
Peres, D.J. and A. Cancelliere, 2018: Modeling impacts of climate change on return period of landslide triggering. Journal of Hydrology, 567, 420–434, doi: 10.1016/j.jhydrol.2018.10.036.
Perkins-Kirkpatrick, S.E. and P.B. Gibson, 2017: Changes in regional heatwave characteristics as a function of increasing global temperature. Scientific Reports, 7(1), 12256, doi: 10.1038/s41598-017-12520-2.
Perrels, A., T. Frei, F. Espejo, L. Jamin, and A. Thomalla, 2013: Socio-economic benefits of weather and climate services in Europe. Advances in Science and Research, 10(1), 65–70, doi: 10.5194/asr-10-65-2013.
Perry, C.T. et al., 2018: Loss of coral reef growth capacity to track future increases in sea level. Nature, 558(7710), 396–400, doi: 10.1038/s41586-018-0194-z.
Pershing, A., K. Mills, A. Dayton, B. Franklin, and B. Kennedy, 2018: Evidence for Adaptation from the 2016 Marine Heatwave in the Northwest Atlantic Ocean. Oceanography, 31(2), 152–161, doi: 10.5670/oceanog.2018.213.
Pes, M.P. et al., 2017: Climate trends on the extreme winds in Brazil. Renewable Energy, 109, 110–120, doi: 10.1016/j.renene.2016.12.101.
Peterson, T.C. et al., 2013: Monitoring and Understanding Changes in Heat Waves, Cold Waves, Floods, and Droughts in the United States: State of Knowledge. Bulletin of the American Meteorological Society, 94(6), 821–834, doi: 10.1175/bams-d-12-00066.1.
Petitti, D.B., D.M. Hondula, S. Yang, S.L. Harlan, and G. Chowell, 2016: Multiple Trigger Points for Quantifying Heat-Health Impacts: New Evidence from a Hot Climate. Environmental Health Perspectives, 124(2), 176–183, doi: 10.1289/ehp.1409119.
Pezij, M., D.C.M. Augustijn, D.M.D. Hendriks, and S.J.M.H. Hulscher, 2019: The role of evidence-based information in regional operational water management in the Netherlands. Environmental Science & Policy, 93, 75–82, doi: 10.1016/j.envsci.2018.12.025.
Philip, S. et al., 2020: A protocol for probabilistic extreme event attribution analyses. Advances in Statistical Climatology, Meteorology and Oceanography, 6(2), 177–203, doi: 10.5194/ascmo-6-177-2020.
Pierce, D.W. and D.R. Cayan, 2013: The Uneven Response of Different Snow Measures to Human-Induced Climate Warming. Journal of Climate, 26(12), 4148–4167, doi: 10.1175/jcli-d-12-00534.1.
Pinnegar, J.K., G.H. Engelhard, N.J. Norris, D. Theophille, and R.D. Sebastien, 2019: Assessing vulnerability and adaptive capacity of the fisheries sector in Dominica: long-term climate change and catastrophic hurricanes. ICES Journal of Marine Science, 76(5), 1353–1367, doi: 10.1093/icesjms/fsz052.
Pizzolato, L., S.E.L. Howell, J. Dawson, F. Laliberté, and L. Copland, 2016: The influence of declining sea ice on shipping activity in the Canadian Arctic. Geophysical Research Letters, 43(23), 12146–12154, doi: 10.1002/2016gl071489.
Pohl, E., C. Grenier, M. Vrac, and M. Kageyama, 2020: Emerging climate signals in the Lena River catchment: a non-parametric statistical approach. Hydrology and Earth System Sciences, 24(5), 2817–2839, doi: 10.5194/hess-24-2817-2020.
Poloczanska, E.S., O. Hoegh-Guldberg, W. Cheung, H.-O. Pörtner, and M.T. Burrows, 2013a: Cross-chapter box on observed Global Responses of Marine Biogeography, Abundance, and Phenology to Climate Change. In: Climate Change 2014: Impacts, Adaptation, and Vulnerability. Part A: Global and Sectoral Aspects. Contribution of Working Group II to the Fifth Assessment Report of the Intergovernmental Panel on Climate Change[Field, C.B., V.R. Barros, D.J. Dokken, K.J. Mach, M.D. Mastrandrea, T.E. Bilir, M. Chatterjee, K.L. Ebi, Y.O. Estrada, R.C. Genova, B. Girma, E.S. Kissel, A.N. Levy, S. MacCracken, P.R. Mastrandrea, and L.L. White (eds.)]. Cambridge University Press, Cambridge, United Kingdom and New York, NY, USA, pp. 123–127, doi: 10.1017/cbo9781107415379.005.
Poloczanska, E.S. et al., 2013b: Global imprint of climate change on marine life. Nature Climate Change, 3(10), 919–925, doi: 10.1038/nclimate1958.
Poloczanska, E.S. et al., 2016: Responses of Marine Organisms to Climate Change across Oceans. Frontiers in Marine Science, 3, 62, doi: 10.3389/fmars.2016.00062.
Pope, S., L. Copland, and B. Alt, 2017: Recent Changes in Sea Ice Plugs Along the Northern Canadian Arctic Archipelago. In: Arctic Ice Shelves and Ice Islands[Copland, L. and D. Mueller (eds.)]. Springer, Dordrecht, The Netherlands, pp. 317–342, doi: 10.1007/978-94-024-1101-0_12.
Porter, J.J. and S. Dessai, 2017: Mini-me: Why do climate scientists’ misunderstand users and their needs?Environmental Science & Policy, 77, 9–14, doi: 10.1016/j.envsci.2017.07.004.
Pörtner, H.-O. et al., 2014: Ocean systems. In: Climate Change 2014: Impacts, Adaptation, and Vulnerability. Part A: Global and Sectoral Aspects. Contribution of Working Group II to the Fifth Assessment Report of the Intergovernmental Panel on Climate Change[Field, C.B., V.R. Barros, D.J. Dokken, K.J. Mach, M.D. Mastrandrea, T.E. Bilir, M. Chatterjee, K.L. Ebi, Y.O. Estrada, R.C. Genova, B. Girma, E.S. Kissel, A.N. Levy, S. MacCracken, P.R. Mastrandrea, and L.L. White (eds.)]. Cambridge University Press, Cambridge, United Kingdom and New York, NY, USA, pp. 411–484, doi: 10.1017/cbo9781107415379.011.
Poschlod, B., J. Zscheischler, J. Sillmann, R.R. Wood, and R. Ludwig, 2020: Climate change effects on hydrometeorological compound events over southern Norway. Weather and Climate Extremes, 28, 100253, doi: 10.1016/j.wace.2020.100253.
Pour, S.H., A.K.A. Wahab, and S. Shahid, 2020: Spatiotemporal changes in aridity and the shift of drylands in Iran. Atmospheric Research, 233, 104704, doi: 10.1016/j.atmosres.2019.104704.
Pragna, P. et al., 2016: Heat Stress and Dairy Cow: Impact on Both Milk Yield and Composition. International Journal of Dairy Science, 12(1), 1–11, doi: 10.3923/ijds.2017.1.11.
Preethi, B., R. Ramya, S.K. Patwardhan, M. Mujumdar, and R.H. Kripalani, 2019: Variability of Indian summer monsoon droughts in CMIP5 climate models. Climate Dynamics, 53(3–4), 1937–1962, doi: 10.1007/s00382-019-04752-x.
Pregnolato, M., A. Ford, V. Glenis, S. Wilkinson, and R. Dawson, 2017: Impact of Climate Change on Disruption to Urban Transport Networks from Pluvial Flooding. Journal of Infrastructure Systems, 23(4), 04017015, doi: 10.1061/(asce)is.1943-555x.0000372.
Prein, A.F. and G.J. Holland, 2018: Global estimates of damaging hail hazard. Weather and Climate Extremes, 22, 10–23, doi: 10.1016/j.wace.2018.10.004.
Prein, A.F. et al., 2016: Precipitation in the EURO-CORDEX 0.11° and 0.44° simulations: high resolution, high benefits?Climate Dynamics, 46(1–2), 383–412, doi: 10.1007/s00382-015-2589-y.
Prein, A.F. et al., 2017a: Increased rainfall volume from future convective storms in the US. Nature Climate Change, 7(12), 880–884, doi: 10.1038/s41558-017-0007-7.
Prein, A.F. et al., 2017b: The future intensification of hourly precipitation extremes. Nature Climate Change, 7(1), 48–52, doi: 10.1038/nclimate3168.
Prestemon, J.P. et al., 2016: Projecting wildfire area burned in the south-eastern United States, 2011–60. International Journal of Wildland Fire, 25(7), 715–729, doi: 10.1071/wf15124.
Prinz, R., A. Heller, M. Ladner, L. Nicholson, and G. Kaser, 2018: Mapping the Loss of Mt. Kenya’s Glaciers: An Example of the Challenges of Satellite Monitoring of Very Small Glaciers. Geosciences, 8(5), 174, doi: 10.3390/geosciences8050174.
Pritchard, H.D., 2019: Asia’s shrinking glaciers protect large populations from drought stress. Nature, 569(7758), 649–654, doi: 10.1038/s41586-019-1240-1.
Proctor, J., S. Hsiang, J. Burney, M. Burke, and W. Schlenker, 2018: Estimating global agricultural effects of geoengineering using volcanic eruptions. Nature, 560(7719), 480–483, doi: 10.1038/s41586-018-0417-3.
Prokopy, L.S. et al., 2017: Useful to Usable: Developing usable climate science for agriculture. Climate Risk Management, 15, 1–7, doi: 10.1016/j.crm.2016.10.004.
Prudhomme, C. et al., 2014: Hydrological droughts in the 21st century, hotspots and uncertainties from a global multimodel ensemble experiment. Proceedings of the National Academy of Sciences, 111(9), 3262–3267, doi: 10.1073/pnas.1222473110.
Pu, B. and P. Ginoux, 2017: Projection of American dustiness in the late 21st century due to climate change. Scientific Reports, 7(1), 5553, doi: 10.1038/s41598-017-05431-9.
Pu, B. and P. Ginoux, 2018: Climatic factors contributing to long-term variations in surface fine dust concentration in the United States. Atmospheric Chemistry and Physics, 18(6), 4201–4215, doi: 10.5194/acp-18-4201-2018.
Púčik, T. et al., 2017: Future Changes in European Severe Convection Environments in a Regional Climate Model Ensemble. Journal of Climate, 30(17), 6771–6794, doi: 10.1175/jcli-d-16-0777.1.
Qiu, X., X. Yang, Y. Fang, Y. Xu, and F. Zhu, 2018: Impacts of snow disaster on rural livelihoods in southern Tibet-Qinghai Plateau. International Journal of Disaster Risk Reduction, 31, 143–152, doi: 10.1016/j.ijdrr.2018.05.007.
Qu, Y., S. Jevrejeva, L.P. Jackson, and J.C. Moore, 2019: Coastal Sea level rise around the China Seas. Global and Planetary Change, 172, 454–463, doi: 10.1016/j.gloplacha.2018.11.005.
Querol, X. et al., 2019: Monitoring the impact of desert dust outbreaks for air quality for health studies. Environment International, 130, 104867, doi: 10.1016/j.envint.2019.05.061.
Qutbudin, I. et al., 2019: Seasonal Drought Pattern Changes Due to Climate Variability: Case Study in Afghanistan. Water, 11(5), 1096, doi: 10.3390/w11051096.
Ragno, E. et al., 2018: Quantifying Changes in Future Intensity–Duration–Frequency Curves Using Multimodel Ensemble Simulations. Water Resources Research, 54(3), 1751–1764, doi: 10.1002/2017wr021975.
Rahimi, J., A. Malekian, and A. Khalili, 2019: Climate change impacts in Iran: assessing our current knowledge. Theoretical and Applied Climatology, 135(1), 545–564, doi: 10.1007/s00704-018-2395-7.
Rahimi, M., N. Mohammadian, A.R. Vanashi, and K. Whan, 2018: Trends in Indices of Extreme Temperature and Precipitation in Iran over the Period 1960-2014. Open Journal of Ecology, 8(7), 396–415, doi: 10.4236/oje.2018.87024.
Rai, P.K., G.P. Singh, and S.K. Dash, 2020: Projected changes in extreme precipitation events over various subdivisions of India using RegCM4. Climate Dynamics, 54(1), 247–272, doi: 10.1007/s00382-019-04997-6.
Räisänen, J. and J. Eklund, 2012: 21st Century changes in snow climate in Northern Europe: a high-resolution view from ENSEMBLES regional climate models. Climate Dynamics, 38(11–12), 2575–2591, doi: 10.1007/s00382-011-1076-3.
Rajczak, J. and C. Schär, 2017: Projections of Future Precipitation Extremes Over Europe: A Multimodel Assessment of Climate Simulations. Journal of Geophysical Research: Atmospheres, 122(20), 10773–10800, doi: 10.1002/2017jd027176.
Ramarao, M.V.S. et al., 2019: On observed aridity changes over the semiarid regions of India in a warming climate. Theoretical and Applied Climatology, 136(1), 693–702, doi: 10.1007/s00704-018-2513-6.
Ramesh, K., A. Matloob, F. Aslam, S.K. Florentine, and B.S. Chauhan, 2017: Weeds in a Changing Climate: Vulnerabilities, Consequences, and Implications for Future Weed Management. Frontiers in Plant Science, 8, 95, doi: 10.3389/fpls.2017.00095.
Ramirez-Beltran, N.D. et al., 2017: Analysis of the Heat Index in the Mesoamerica and Caribbean Region. Journal of Applied Meteorology and Climatology, 56, 2905–2925, doi: 10.1175/jamc-d-16-0167.1.
Ranasinghe, R., 2016: Assessing climate change impacts on open sandy coasts: A review. Earth-Science Reviews, 160, 320–332, doi: 10.1016/j.earscirev.2016.07.011.
Ranasinghe, R. and D. Callaghan, 2017: Assessing Storm Erosion Hazards. In: Coastal Storms: Processes and Impacts[Ciavola, P. and G. Coco (eds.)]. John Wiley & Sons, Ltd, Chichester, UK, pp. 241–256, doi: 10.1002/9781118937099.ch12.
Ranasinghe, R., C.S. Wu, J. Conallin, T.M. Duong, and E.J. Anthony, 2019: Disentangling the relative impacts of climate change and human activities on fluvial sediment supply to the coast by the world’s large rivers: Pearl River Basin, China. Scientific Reports, 9(1), 9236, doi: 10.1038/s41598-019-45442-2.
Rangecroft, S., A.J. Suggitt, K. Anderson, and S. Harrison, 2016: Future climate warming and changes to mountain permafrost in the Bolivian Andes. Climatic Change, 137(1–2), 231–243, doi: 10.1007/s10584-016-1655-8.
Rasoulkhani, K., A. Mostafavi, M.P. Reyes, and M. Batouli, 2020: Resilience planning in hazards–humans–infrastructure nexus: A multi-agent simulation for exploratory assessment of coastal water supply infrastructure adaptation to sea-level rise. Environmental Modelling and Software, 125, 104636, doi: 10.1016/j.envsoft.2020.104636.
Ratliff, K.M., A.E. Braswell, and M. Marani, 2015: Spatial response of coastal marshes to increased atmospheric CO2. Proceedings of the National Academy of Sciences, 112(51), 15580–15584, doi: 10.1073/pnas.1516286112.
Ratnayake, H.U., M.R. Kearney, P. Govekar, D. Karoly, and J.A. Welbergen, 2019: Forecasting wildlife die-offs from extreme heat events. Animal Conservation, 22(4), 386–395, doi: 10.1111/acv.12476.
Raymond, C. et al., 2020: Understanding and managing connected extreme events. Nature Climate Change, 10(7), 611–621, doi: 10.1038/s41558-020-0790-4.
Reboita, M.S., R.P. da Rocha, C.G. Dias, and R.Y. Ynoue, 2014: Climate Projections for South America: RegCM3 Driven by HadCM3 and ECHAM5. Advances in Meteorology, 2014, 1–17, doi: 10.1155/2014/376738.
Reboita, M.S., R.P. da Rocha, M.R. de Souza, and M. Llopart, 2018: Extratropical cyclones over the southwestern South Atlantic Ocean: HadGEM2-ES and RegCM4 projections. International Journal of Climatology, 38(6), 2866–2879, doi: 10.1002/joc.5468.
Reboita, M.S. et al., 2021: Future changes in the wintertime cyclonic activity over the CORDEX-CORE southern hemisphere domains in a multi-model approach. Climate Dynamics, 57(5–6), 1533–1549, doi: 10.1007/s00382-020-05317-z.
Refatti, J.P. et al., 2019: High [CO2] and Temperature Increase Resistance to Cyhalofop-Butyl in Multiple-Resistant Echinochloa colona. Frontiers in Plant Science, 10, 529, doi: 10.3389/fpls.2019.00529.
Reid, C.E. and J.L. Gamble, 2009: Aeroallergens, allergic disease, and climate change: Impacts and adaptation. EcoHealth, 6(3), 458–470, doi: 10.1007/s10393-009-0261-x.
Reinecke, S., 2015: Knowledge brokerage designs and practices in four european climate services: A role model for biodiversity policies?Environmental Science & Policy, 54, 513–521, doi: 10.1016/j.envsci.2015.08.007.
Reisinger, A. et al., 2014: Australasia. In: Climate Change 2014: Impacts, Adaptation, and Vulnerability. Part B: Regional Aspects. Contribution of Working Group II to the Fifth Assessment Report of the Intergovernmental Panel on Climate Change[Barros, V.R., C.B. Field, D.J. Dokken, M.D. Mastrandrea, K.J. Mach, T.E. Bilir, M. Chatterjee, K.L. Ebi, Y.O. Estrada, R.C. Genova, B. Girma, E.S. Kissel, A.N. Levy, S. MacCracken, P.R. Mastrandrea, and L.L.White (eds.)]. Cambridge University Press, Cambridge, United Kingdom and New York, NY, USA, pp. 1371–1438, doi: 10.1017/cbo9781107415386.005.
Reisinger, A. et al., 2020: The Concept of Risk in the IPCC Sixth Assessment Report: A Summary of Cross-Working Group Discussions. Intergovernmental Panel on Climate Change, Geneva, Switzerland, 15 pp., www.ipcc.ch/event/guidance-note-concept-of-risk-in-the-6ar-cross-wg-discussions.
Ren, W. et al., 2011: Impacts of tropospheric ozone and climate change on net primary productivity and net carbon exchange of China’s forest ecosystems. Global Ecology and Biogeography, 20(3), 391–406, doi: 10.1111/j.1466-8238.2010.00606.x.
Ren, X., H. He, L. Zhang, and G. Yu, 2018: Global radiation, photosynthetically active radiation, and the diffuse component dataset of China, 1981–2010. Earth System Science Data, 10(3), 1217–1226, doi: 10.5194/essd-10-1217-2018.
Revi, A. et al., 2014: Urban areas. In: Climate Change 2014: Impacts, Adaptation, and Vulnerability. Part A: Global and Sectoral Aspects. Contribution of Working Group II to the Fifth Assessment Report of the Intergovernmental Panel on Climate Change[Field, C.B., V.R. Barros, D.J. Dokken, K.J. Mach, M.D. Mastrandrea, T.E. Bilir, M. Chatterjee, K.L. Ebi, Y.O. Estrada, R.C. Genova, B. Girma, E.S. Kissel, A.N. Levy, S. MacCracken, P.R. Mastrandrea, and L.L. White (eds.)]. Cambridge University Press, Cambridge, United Kingdom and New York, NY, USA, pp. 535–612, doi: 10.1017/cbo9781107415379.013.
Reyer, C.P.O. et al., 2017a: Climate change impacts in Latin America and the Caribbean and their implications for development. Regional Environmental Change, 17(6), 1601–1621, doi: 10.1007/s10113-015-0854-6.
Reyer, C.P.O. et al., 2017b: Climate change impacts in Central Asia and their implications for development. Regional Environmental Change, 17(6), 1639–1650, doi: 10.1007/s10113-015-0893-z.
Rhoades, A.M., P.A. Ullrich, and C.M. Zarzycki, 2018: Projecting 21st century snowpack trends in western USA mountains using variable-resolution CESM. Climate Dynamics, 50(1–2), 261–288, doi: 10.1007/s00382-017-3606-0.
Ridley, D.A., C.L. Heald, and J.M. Prospero, 2014: What controls the recent changes in African mineral dust aerosol across the Atlantic?Atmospheric Chemistry and Physics, 14(11), 5735–5747, doi: 10.5194/acp-14-5735-2014.
Riebesell, U. et al., 2018: Toxic algal bloom induced by ocean acidification disrupts the pelagic food web. Nature Climate Change, 8(12), 1082–1086, doi: 10.1038/s41558-018-0344-1.
Risser, M.D. and M.F. Wehner, 2017: Attributable Human-Induced Changes in the Likelihood and Magnitude of the Observed Extreme Precipitation during Hurricane Harvey. Geophysical Research Letters, 44(24), 12457–12464, doi: 10.1002/2017gl075888.
Ritphring, S., C. Somphong, K. Udo, and S. Kazama, 2018: Projections of Future Beach Loss due to Sea Level Rise for Sandy Beaches along Thailand’s Coastlines. Journal of Coastal Research, 85, 541–545, doi: 10.2112/si85-109.1.
Rivera, J. and O. Penalba, 2014: Trends and Spatial Patterns of Drought Affected Area in Southern South America. Climate, 2(4), 264–278, doi: 10.3390/cli2040264.
Rivera, J., O. Penalba, R. Villalba, and D. Araneo, 2017: Spatio-Temporal Patterns of the 2010–2015 Extreme Hydrological Drought across the Central Andes, Argentina. Water, 9(9), 652, doi: 10.3390/w9090652.
Roberts, M.J. et al., 2015: Tropical Cyclones in the UPSCALE Ensemble of High-Resolution Global Climate Models. Journal of Climate, 28(2), 574–596, doi: 10.1175/jcli-d-14-00131.1.
Roberts, M.J. et al., 2020: Projected Future Changes in Tropical Cyclones Using the CMIP6 HighResMIP Multimodel Ensemble. Geophysical Research Letters, 47(14), e2020GL088662, doi: 10.1029/2020gl088662.
Robinson, J.D., F. Vahedifard, and A. AghaKouchak, 2017: Rainfall-triggered slope instabilities under a changing climate: comparative study using historical and projected precipitation extremes. Canadian Geotechnical Journal, 54(1), 117–127, doi: 10.1139/cgj-2015-0602.
Robinson, S.A. et al., 2020: The 2019/2020 summer of Antarctic heatwaves. Global Change Biology, 26(6), 3178–3180, doi: 10.1111/gcb.15083.
Rohat, G. et al., 2019: Influence of changes in socioeconomic and climatic conditions on future heat-related health challenges in Europe. Global and Planetary Change, 172, 45–59, doi: 10.1016/j.gloplacha.2018.09.013.
Rohini, P., M. Rajeevan, and A.K. Srivastava, 2016: On the Variability and Increasing Trends of Heat Waves over India. Scientific Reports, 6(1), 26153, doi: 10.1038/srep26153.
Rojas, M., F. Lambert, J. Ramirez-Villegas, and A.J. Challinor, 2019: Emergence of robust precipitation changes across crop production areas in the 21st century. Proceedings of the National Academy of Sciences, 116(14), 6673–6678, doi: 10.1073/pnas.1811463116.
Rojas, O., M. Mardones, J.L. Arumí, and M. Aguayo, 2014: Una revisión de inundaciones fluviales en Chile, período 1574–2012: causas, recurrencia y efectos geográficos. Revista de geografía Norte Grande, 177–192, doi: 10.4067/s0718-34022014000100012.
Rojas, O., M. Mardones, C. Rojas, C. Martínez, and L. Flores, 2017: Urban Growth and Flood Disasters in the Coastal River Basin of South-Central Chile (1943–2011). Sustainability, 9(2), 195, doi: 10.3390/su9020195.
Rojas, R., L. Feyen, and P. Watkiss, 2013: Climate change and river floods in the European Union: Socio-economic consequences and the costs and benefits of adaptation. Global Environmental Change, 23(6), 1737–1751, doi: 10.1016/j.gloenvcha.2013.08.006.
Rojas, R., L. Feyen, A. Bianchi, and A. Dosio, 2012: Assessment of future flood hazard in Europe using a large ensemble of bias-corrected regional climate simulations. Journal of Geophysical Research: Atmospheres, 117, D17109, doi: 10.1029/2012jd017461.
Rojas-Downing, M.M., A.P. Nejadhashemi, T. Harrigan, and S.A. Woznicki, 2017: Climate change and livestock: Impacts, adaptation, and mitigation. Climate Risk Management, 16, 145–163, doi: 10.1016/j.crm.2017.02.001.
Rokaya, P., S. Budhathoki, and K.-E. Lindenschmidt, 2018: Trends in the Timing and Magnitude of Ice-Jam Floods in Canada. Scientific Reports, 8(1), 5834, doi: 10.1038/s41598-018-24057-z.
Romanovsky, V. et al., 2018: Terrestrial Permafrost [in “State of the Climate in 2017”]. Bulletin of the American Meteorological Society, 99(8), S161–S165, doi: 10.1175/2018bamsstateoftheclimate.1.
Romanovsky, V.E. et al., 2020: Terrestrial permafrost [in “State of the Climate in 2019”]. Bulletin of the American Meteorological Society, 101(8), S265–S271, doi: 10.1175/bams-d-20-0086.1.
Romera, R. et al., 2017: Climate change projections of medicanes with a large multi-model ensemble of regional climate models. Global and Planetary Change, 151, 134–143, doi: 10.1016/j.gloplacha.2016.10.008.
Romero, R. and K. Emanuel, 2017: Climate Change and Hurricane-Like Extratropical Cyclones: Projections for North Atlantic Polar Lows and Medicanes Based on CMIP5 Models. Journal of Climate, 30(1), 279–299, doi: 10.1175/jcli-d-16-0255.1.
Romero-Lankao, P. et al., 2014: North America. In: Climate Change 2014: Impacts, Adaptation, and Vulnerability. Part B: Regional Aspects. Contribution of Working Group II to the Fifth Assessment Report of the Intergovernmental Panel on Climate Change[Barros, V.R., C.B. Field, D.J. Dokken, M.D. Mastrandrea, K.J. Mach, T.E. Bilir, M. Chatterjee, K.L. Ebi, Y.O. Estrada, R.C. Genova, B. Girma, E.S. Kissel, A.N. Levy, S. MacCracken, P.R. Mastrandrea, and L.L.White (eds.)]. Cambridge University Press, Cambridge, United Kingdom and New York, NY, USA, pp. 1439–1498, doi: 10.1017/cbo9781107415386.006.
Romps, D.M., J.T. Seeley, D. Vollaro, and J. Molinari, 2014: Projected increase in lightning strikes in the United States due to global warming. Science, 346(6211), 851–854, doi: 10.1126/science.1259100.
Rose, S.K., O.B. Andersen, M. Passaro, C.A. Ludwigsen, and C. Schwatke, 2019: Arctic Ocean Sea Level Record from the Complete Radar Altimetry Era: 1991–2018. Remote Sensing, 11(14), 1672, doi: 10.3390/rs11141672.
Rosenzweig, B.R. et al., 2018: Pluvial flood risk and opportunities for resilience. WIREs Water, 5(6), e1302, doi: 10.1002/wat2.1302.
Rosenzweig, C. and W. Solecki, 2014: Hurricane Sandy and adaptation pathways in New York: Lessons from a first-responder city. Global Environmental Change, 28, 395–408, doi: 10.1016/j.gloenvcha.2014.05.003.
Rosenzweig, C., F.N. Tubiello, R. Goldberg, E. Mills, and J. Bloomfield, 2002: Increased crop damage in the US from excess precipitation under climate change. Global Environmental Change, 12(3), 197–202, doi: 10.1016/s0959-3780(02)00008-0.
Rosenzweig, C. et al., 2014: Assessing agricultural risks of climate change in the 21st century in a global gridded crop model intercomparison. Proceedings of the National Academy of Sciences, 111(9), 3268–3273, doi: 10.1073/pnas.1222463110.
Rosenzweig, C. et al., 2015: ARC3.2 Summary for City Leaders. Urban Climate Change Research Network. Columbia University, New York, NY, USA, 25 pp., www.uccrn-europe.org/second-uccrn-assessment-report-climate-change-and-cities-arc32-summary-city-leaders.
Rössler, O. et al., 2019: Challenges to link climate change data provision and user needs: Perspective from the COST-action VALUE. International Journal of Climatology, 39(9), 3704–3716, doi: 10.1002/joc.5060.
Rottler, E., C. Kormann, T. Francke, and A. Bronstert, 2019: Elevation-dependent warming in the Swiss Alps 1981–2017: Features, forcings and feedbacks. International Journal of Climatology, 39(5), 2556–2568, doi: 10.1002/joc.5970.
Rotzoll, K. and C.H. Fletcher, 2013: Assessment of groundwater inundation as a consequence of sea-level rise. Nature Climate Change, 3(5), 477–481, doi: 10.1038/nclimate1725.
Roudier, P., A. Ducharne, and L. Feyen, 2014: Climate change impacts on runoff in West Africa: a review. Hydrology and Earth System Sciences, 18(7), 2789–2801, doi: 10.5194/hess-18-2789-2014.
Roudier, P. et al., 2016: Projections of future floods and hydrological droughts in Europe under a +2°C global warming. Climatic Change, 135(2), 341–355, doi: 10.1007/s10584-015-1570-4.
Rounce, D.R., R. Hock, and D.E. Shean, 2020: Glacier Mass Change in High Mountain Asia Through 2100 Using the Open-Source Python Glacier Evolution Model (PyGEM). Frontiers in Earth Science, 7, 331, doi: 10.3389/feart.2019.00331.
Roxy, M.K. et al., 2015: Drying of Indian subcontinent by rapid Indian ocean warming and a weakening land–sea thermal gradient. Nature Communications, 6(1), 7423, doi: 10.1038/ncomms8423.
Rozance, M.A. et al., 2020: Building capacity for societally engaged climate science by transforming science training. Environmental Research Letters, 15(12), 125008, doi: 10.1088/1748-9326/abc27a.
Ruane, A.C. et al., 2013: Multi-factor impact analysis of agricultural production in Bangladesh with climate change. Global Environmental Change, 23(1), 338–350, doi: 10.1016/j.gloenvcha.2012.09.001.
Ruane, A.C. et al., 2016: The Vulnerability, Impacts, Adaptation and Climate Services Advisory Board (VIACS AB v1.0) contribution to CMIP6. Geoscientific Model Development, 9(9), 3493–3515, doi: 10.5194/gmd-9-3493-2016.
Ruane, A.C. et al., 2021: Strong regional influence of climatic forcing datasets on global crop model ensembles. Agricultural and Forest Meteorology, 300, 108313, doi: 10.1016/j.agrformet.2020.108313.
Ruffault, J. et al., 2020: Increased likelihood of heat-induced large wildfires in the Mediterranean Basin. Scientific Reports, 10(1), 13790, doi: 10.1038/s41598-020-70069-z.
Ruosteenoja, K., T. Vihma, and A. Venäläinen, 2019a: Projected Changes in European and North Atlantic Seasonal Wind Climate Derived from CMIP5 Simulations. Journal of Climate, 32(19), 6467–6490, doi: 10.1175/jcli-d-19-0023.1.
Ruosteenoja, K., J. Räisänen, A. Venäläinen, and M. Kämäräinen, 2016: Projections for the duration and degree days of the thermal growing season in Europe derived from CMIP5 model output. International Journal of Climatology, 36(8), 3039–3055, doi: 10.1002/joc.4535.
Ruosteenoja, K., T. Markkanen, A. Venäläinen, P. Räisänen, and H. Peltola, 2018: Seasonal soil moisture and drought occurrence in Europe in CMIP5 projections for the 21st century. Climate Dynamics, 50(3–4), 1177–1192, doi: 10.1007/s00382-017-3671-4.
Ruosteenoja, K., P. Räisänen, S. Devraj, S.S. Garud, and A. Lindfors, 2019b: Future changes in incident surface solar radiation and contributing factors in India in CMIP5 climate model simulations. Journal of Applied Meteorology and Climatology, 58(1), 19–35, doi: 10.1175/jamc-d-18-0013.1.
Russo, S., J. Sillmann, and E.M. Fischer, 2015: Top ten European heatwaves since 1950 and their occurrence in the coming decades. Environmental Research Letters, 10(12), 124003, doi: 10.1088/1748-9326/10/12/124003.
Russo, S., A.F. Marchese, J. Sillmann, and G. Immé, 2016: When will unusual heat waves become normal in a warming Africa?Environmental Research Letters, 11(5), 054016, doi: 10.1088/1748-9326/11/5/054016.
Russo, S. et al., 2014: Magnitude of extreme heat waves in present climate and their projection in a warming world. Journal of Geophysical Research: Atmospheres, 119(22), 12500–12512, doi: 10.1002/2014jd022098.
Russo, S. et al., 2019: Half a degree and rapid socioeconomic development matter for heatwave risk. Nature Communications, 10(1), 136, doi: 10.1038/s41467-018-08070-4.
Ruti, P.M. et al., 2016: Med-CORDEX Initiative for Mediterranean Climate Studies. Bulletin of the American Meteorological Society, 97(7), 1187–1208, doi: 10.1175/bams-d-14-00176.1.
Rutty, M. et al., 2017: Using ski industry response to climatic variability to assess climate change risk: An analogue study in Eastern Canada. Tourism Management, 58, 196–204, doi: 10.1016/j.tourman.2016.10.020.
Ryu, Y., C. Jiang, H. Kobayashi, and M. Detto, 2018: MODIS-derived global land products of shortwave radiation and diffuse and total photosynthetically active radiation at 5 km resolution from 2000. Remote Sensing of Environment, 204, 812–825, doi: 10.1016/j.rse.2017.09.021.
Saeed, F., M. Almazroui, N. Islam, and M.S. Khan, 2017: Intensification of future heat waves in Pakistan: a study using CORDEX regional climate models ensemble. Natural Hazards, 87(3), 1635–1647, doi: 10.1007/s11069-017-2837-z.
Saeed, F. et al., 2018: Robust changes in tropical rainy season length at 1.5°C and 2°C. Environmental Research Letters, 13(6), 64024, doi: 10.1088/1748-9326/aab797.
Saintilan, N., N.C. Wilson, K. Rogers, A. Rajkaran, and K.W. Krauss, 2014: Mangrove expansion and salt marsh decline at mangrove poleward limits. Global Change Biology, 20(1), 147–157, doi: 10.1111/gcb.12341.
Salinger, M.J., B.B. Fitzharris, and T. Chinn, 2019: Atmospheric circulation and ice volume changes for the small and medium glaciers of New Zealand’s Southern Alps mountain range 1977–2018. International Journal of Climatology, 39(11), 4274–4287, doi: 10.1002/joc.6072.
Salvati, A., H. Coch Roura, and C. Cecere, 2017: Assessing the urban heat island and its energy impact on residential buildings in Mediterranean climate: Barcelona case study. Energy and Buildings, 146, 38–54, doi: 10.1016/j.enbuild.2017.04.025.
Sanchez, J.L. et al., 2017: Are meteorological conditions favoring hail precipitation change in Southern Europe? Analysis of the period 1948–2015. Atmospheric Research, 198, 1–10, doi: 10.1016/j.atmosres.2017.08.003.
Sánchez, E. et al., 2015: Regional climate modelling in CLARIS-LPB: a concerted approach towards twentyfirst century projections of regional temperature and precipitation over South America. Climate Dynamics, 45(7–8), 2193–2212, doi: 10.1007/s00382-014-2466-0.
Sanderson, M., K. Arbuthnott, S. Kovats, S. Hajat, and P. Falloon, 2017: The use of climate information to estimate future mortality from high ambient temperature: A systematic literature review. PLOS ONE, 12(7), e0180369, doi: 10.1371/journal.pone.0180369.
Santamouris, M. et al., 2017: Urban heat island and overheating characteristics in Sydney, Australia. An analysis of multiyear measurements. Sustainability, 9(5), 712, doi: 10.3390/su9050712.
Sapkota, A. et al., 2019: Associations between alteration in plant phenology and hay fever prevalence among US adults: Implication for changing climate. PLOS ONE, 14(3), e0212010, doi: 10.1371/journal.pone.0212010.
Sathaye, J.A. et al., 2013: Estimating impacts of warming temperatures on California’s electricity system. Global Environmental Change, 23(2), 499–511, doi: 10.1016/j.gloenvcha.2012.12.005.
Sawadogo, W., B.J. Abiodun, and E.C. Okogbue, 2020: Impacts of global warming on photovoltaic power generation over West Africa. Renewable Energy, 151, 263–277, doi: 10.1016/j.renene.2019.11.032.
Sawadogo, W. et al., 2021: Current and future potential of solar and wind energy over Africa using the RegCM4 CORDEX-CORE ensemble. Climate Dynamics, 57(5–6), 1647–1672, doi: 10.1007/s00382-020-05377-1.
Sawyer, A.H., C.H. David, and J.S. Famiglietti, 2016: Continental patterns of submarine groundwater discharge reveal coastal vulnerabilities. Science, 353(6300), 705–707, doi: 10.1126/science.aag1058.
Schaeffer, R. et al., 2012: Energy sector vulnerability to climate change: A review. Energy, 38(1), 1–12, doi: 10.1016/j.energy.2011.11.056.
Schaefli, B., P. Manso, M. Fischer, M. Huss, and D. Farinotti, 2019: The role of glacier retreat for Swiss hydropower production. Renewable Energy, 132, 615–627, doi: 10.1016/j.renene.2018.07.104.
Schauberger, B. et al., 2017: Consistent negative response of US crops to high temperatures in observations and crop models. Nature Communications, 8, 13931, doi: 10.1038/ncomms13931.
Scheurer, K., C. Alewell, D. Bänninger, and P. Burkhardt-Holm, 2009: Climate and land-use changes affecting river sediment and brown trout in alpine countries – a review. Environmental Science and Pollution Research, 16(2), 232–242, doi: 10.1007/s11356-008-0075-3.
Schewe, J. et al., 2014: Multimodel assessment of water scarcity under climate change. Proceedings of the National Academy of Sciences, 111(9), 3245–3250, doi: 10.1073/pnas.1222460110.
Schipper, J.W., J. Hackenbruch, H.S. Lentink, and K. Sedlmeier, 2019: Integrating Adaptation Expertise into Regional Climate Data Analyses through Tailored Climate Parameters. Meteorologische Zeitschrift, 28(1), 41–57, doi: 10.1127/metz/2019/0878.
Schlaepfer, D.R. et al., 2017: Climate change reduces extent of temperate drylands and intensifies drought in deep soils. Nature Communications, 8(1), 14196, doi: 10.1038/ncomms14196.
Schlenker, W. and M.J. Roberts, 2009: Nonlinear temperature effects indicate severe damages to U.S. crop yields under climate change. Proceedings of the National Academy of Sciences, 106(37), 15594–15598, doi: 10.1073/pnas.0906865106.
Schleussner, C.-F. et al., 2016: Differential climate impacts for policy-relevant limits to global warming: the case of 1.5°C and 2°C. Earth System Dynamics, 7(2), 327–351, doi: 10.5194/esd-7-327-2016.
Schlögl, M. and C. Matulla, 2018: Potential future exposure of European land transport infrastructure to rainfall-induced landslides throughout the 21st century. Natural Hazards and Earth System Sciences, 18(4), 1121–1132, doi: 10.5194/nhess-18-1121-2018.
Schmidt, C.W., 2016: Pollen Overload: Seasonal Allergies in a Changing Climate. Environmental Health Perspectives, 124(4), A71–A75, doi: 10.1289/ehp.124-a70.
Schmidtko, S., L. Stramma, and M. Visbeck, 2017: Decline in global oceanic oxygen content during the past five decades. Nature, 542(7641), 335–339, doi: 10.1038/nature21399.
Schmucki, E., C. Marty, C. Fierz, and M. Lehning, 2015: Simulations of 21st century snow response to climate change in Switzerland from a set of RCMs. International Journal of Climatology, 35(11), 3262–3273, doi: 10.1002/joc.4205.
Schnell, J.L. et al., 2016: Effect of climate change on surface ozone over North America, Europe, and East Asia. Geophysical Research Letters, 43(7), 3509–3518, doi: 10.1002/2016gl068060.
Schnell, J.L. et al., 2018: Exploring the relationship between surface PM2.5 and meteorology in Northern India. Atmospheric Chemistry and Physics, 18(14), 10157–10175, doi: 10.5194/acp-18-10157-2018.
Schoepf, V. et al., 2015: Annual coral bleaching and the long-term recovery capacity of coral. Proceedings of the Royal Society B: Biological Sciences, 282(1819), 20151887, doi: 10.1098/rspb.2015.1887.
Schuster, P.F. et al., 2018: Permafrost Stores a Globally Significant Amount of Mercury. Geophysical Research Letters, 45(3), 1463–1471, doi: 10.1002/2017gl075571.
Schwingshackl, C., J. Sillmann, A.M. Vicedo-Cabrera, M. Sandstad, and K. Aunan, 2021: Heat Stress Indicators in CMIP6: Estimating Future Trends and Exceedances of Impact-Relevant Thresholds. Earth’s Future, 9, e2020EF001885, doi: 10.1029/2020ef001885.
Sciance, M.B. and S.L. Nooner, 2018: Decadal flood trends in Bangladesh from extensive hydrographic data. Natural Hazards, 90(1), 115–135, doi: 10.1007/s11069-017-3036-7.
Scott, D., R. Steiger, H. Dannevig, and C. Aall, 2020: Climate change and the future of the Norwegian alpine ski industry. Current Issues in Tourism, 23(19), 2396–2409, doi: 10.1080/13683500.2019.1608919.
Scott, D. et al., 2018: The Story of Water in Windhoek: A Narrative Approach to Interpreting a Transdisciplinary Process. Water, 10(10), 1366, doi: 10.3390/w10101366.
Seager, R. et al., 2018: Whither the 100th Meridian? The Once and Future Physical and Human Geography of America’s Arid–Humid Divide. Part II: The Meridian Moves East. Earth Interactions, 22(5), 1–24, doi: 10.1175/ei-d-17-0012.1.
Sedlmeier, K., S. Mieruch, G. Schädler, and C. Kottmeier, 2016: Compound extremes in a changing climate – a Markov chain approach. Nonlinear Processes in Geophysics, 23(6), 375–390, doi: 10.5194/npg-23-375-2016.
Seeley, J.T. and D.M. Romps, 2015: The effect of global warming on severe thunderstorms in the United States. Journal of Climate, 28(6), 2443–2458, doi: 10.1175/jcli-d-14-00382.1.
Segura, C., G. Sun, S. McNulty, and Y. Zhang, 2014: Potential impacts of climate change on soil erosion vulnerability across the conterminous United States. Journal of Soil and Water Conservation, 69(2), 171–181, doi: 10.2489/jswc.69.2.171.
Seidl, R. et al., 2017: Forest disturbances under climate change. Nature Climate Change, 7(6), 395–402, doi: 10.1038/nclimate3303.
Sein, K.K., A. Chidthaisong, and K.L. Oo, 2018: Observed Trends and Changes in Temperature and Precipitation Extreme Indices over Myanmar. Atmosphere, 9(12), 477, doi: 10.3390/atmos9120477.
Selyuzhenok, V., T. Krumpen, A. Mahoney, M. Janout, and R. Gerdes, 2015: Seasonal and interannual variability of fast ice extent in the southeastern Laptev Sea between 1999 and 2013. Journal of Geophysical Research: Oceans, 120(12), 7791–7806, doi: 10.1002/2015jc011135.
Sen Roy, S., 2019: Spatial patterns of trends in seasonal extreme temperatures in India during 1980–2010. Weather and Climate Extremes, 24, 100203, doi: 10.1016/j.wace.2019.100203.
Sena, E.T., M.A.F.S. Dias, L.M. Carvalho, and P.L.S. Dias, 2018: Reduced Wet-Season Length Detected by Satellite Retrievals of Cloudiness over Brazilian Amazonia: A New Methodology. Journal of Climate, 31(24), 9941–9964, doi: 10.1175/jcli-d-17-0702.1.
Sena, J.A., L.A. Beser de Deus, M.A. Freitas, and L. Costa, 2012: Extreme Events of Droughts and Floods in Amazonia: 2005 and 2009. Water Resources Management, 26(6), 1665–1676, doi: 10.1007/s11269-012-9978-3.
Senatore, A., S. Hejabi, G. Mendicino, J. Bazrafshan, and P. Irannejad, 2019: Climate conditions and drought assessment with the Palmer Drought Severity Index in Iran: evaluation of CORDEX South Asia climate projections (2070–2099). Climate Dynamics, 52(1–2), 865–891, doi: 10.1007/s00382-018-4171-x.
Seneviratne, S.I. and M. Hauser, 2020: Regional Climate Sensitivity of Climate Extremes in CMIP6 Versus CMIP5 Multimodel Ensembles. Earth’s Future, 8(9), e2019EF001474, doi: 10.1029/2019ef001474.
Sepúlveda, S.A. and D.N. Petley, 2015: Regional trends and controlling factors of fatal landslides in Latin America and the Caribbean. Natural Hazards and Earth System Sciences, 15(8), 1821–1833, doi: 10.5194/nhess-15-1821-2015.
Seth, A. et al., 2013: CMIP5 Projected Changes in the Annual Cycle of Precipitation in Monsoon Regions. Journal of Climate, 26(19), 7328–7351, doi: 10.1175/jcli-d-12-00726.1.
Sharma, S. et al., 2019: Widespread loss of lake ice around the Northern Hemisphere in a warming world. Nature Climate Change, 9(3), 227–231, doi: 10.1038/s41558-018-0393-5.
Shatwell, T., W. Thiery, and G. Kirillin, 2019: Future projections of temperature and mixing regime of European temperate lakes. Hydrology and Earth System Sciences, 23(3), 1533–1551, doi: 10.5194/hess-23-1533-2019.
Sheikh, M.M. et al., 2015: Trends in extreme daily rainfall and temperature indices over South Asia. International Journal of Climatology, 35(7), 1625–1637, doi: 10.1002/joc.4081.
Shepherd, T.G., 2016: A Common Framework for Approaches to Extreme Event Attribution. Current Climate Change Reports, 2(1), 28–38, doi: 10.1007/s40641-016-0033-y.
Sherwood, S. and Q. Fu, 2014: A Drier Future?Science, 343(6172), 737–739, doi: 10.1126/science.1247620.
Shi, C., Z.-H. Jiang, W.-L. Chen, and L. Li, 2018: Changes in temperature extremes over China under 1.5°C and 2°C global warming targets. Advances in Climate Change Research, 9(2), 120–129, doi: 10.1016/j.accre.2017.11.003.
Shiklomanov, N.I., D.A. Streletskiy, T.B. Swales, and V.A. Kokorev, 2017: Climate Change and Stability of Urban Infrastructure in Russian Permafrost Regions: Prognostic Assessment based on GCM Climate Projections. Geographical Review, 107(1), 125–142, doi: 10.1111/gere.12214.
Shin, J., R. Olson, and S.-I. An, 2018: Projected Heat Wave Characteristics over the Korean Peninsula During the Twenty-First Century. Asia-Pacific Journal of Atmospheric Sciences, 54(1), 53–61, doi: 10.1007/s13143-017-0059-7.
Shiogama, H. et al., 2020: Selecting Future Climate Projections of Surface Solar Radiation in Japan. SOLA, 16, 75–79, doi: 10.2151/sola.2020-013.
Shkolnik, I., T. Pavlova, S. Efimov, and S. Zhuravlev, 2018: Future changes in peak river flows across northern Eurasia as inferred from an ensemble of regional climate projections under the IPCC RCP8.5 scenario. Climate Dynamics, 50(1–2), 215–230, doi: 10.1007/s00382-017-3600-6.
Shope, J.B., C.D. Storlazzi, L.H. Erikson, and C.A. Hegermiller, 2016: Changes to extreme wave climates of islands within the Western Tropical Pacific throughout the 21st century under RCP 4.5 and RCP 8.5, with implications for island vulnerability and sustainability. Global and Planetary Change, 141, 25–38, doi: 10.1016/j.gloplacha.2016.03.009.
Shrestha, B.B. et al., 2019: Assessing flood disaster impacts in agriculture under climate change in the river basins of Southeast Asia. Natural Hazards, 97(1), 157–192, doi: 10.1007/s11069-019-03632-1.
Shu, Q., F. Qiao, Z. Song, J. Zhao, and X. Li, 2018: Projected Freshening of the Arctic Ocean in the 21st Century. Journal of Geophysical Research: Oceans, 123(12), 9232–9244, doi: 10.1029/2018jc014036.
Siebert, S., H. Webber, G. Zhao, and F. Ewert, 2017: Heat stress is overestimated in climate impact studies for irrigated agriculture. Environmental Research Letters, 12(5), 054023, doi: 10.1088/1748-9326/aa702f .
Sierra, J.P., M. Casas-Prat, and E. Campins, 2017: Impact of climate change on wave energy resource: The case of Menorca (Spain). Renewable Energy, 101, 275–285, doi: 10.1016/j.renene.2016.08.060.
Sigmond, M., J.C. Fyfe, and N.C. Swart, 2018: Ice-free Arctic projections under the Paris Agreement. Nature Climate Change, 8(5), 404–408, doi: 10.1038/s41558-018-0124-y.
Sillmann, J. et al., 2014: Evaluating model-simulated variability in temperature extremes using modified percentile indices. International Journal of Climatology, 34(11), 3304–3311, doi: 10.1002/joc.3899.
Sillmann, J. et al., 2017: Understanding, modeling and predicting weather and climate extremes: Challenges and opportunities. Weather and Climate Extremes, 18, 65–74, doi: 10.1016/j.wace.2017.10.003.
Silvy, Y., E. Guilyardi, J.-B. Sallée, and P.J. Durack, 2020: Human-induced changes to the global ocean water masses and their time of emergence. Nature Climate Change, 10(11), 1030–1036, doi: 10.1038/s41558-020-0878-x.
Singh, C. et al., 2018: The utility of weather and climate information for adaptation decision-making: current uses and future prospects in Africa and India. Climate and Development, 10(5), 389–405, doi: 10.1080/17565529.2017.1318744.
Singh, O. and M. Kumar, 2013: Flood events, fatalities and damages in India from 1978 to 2006. Natural Hazards, 69(3), 1815–1834, doi: 10.1007/s11069-013-0781-0.
Sinickas, A., B. Jamieson, and M.A. Maes, 2016: Snow avalanches in western Canada: investigating change in occurrence rates and implications for risk assessment and mitigation. Structure and Infrastructure Engineering, 12(4), 490–498, doi: 10.1080/15732479.2015.1020495.
Sippel, S., P. Walton, and F.E.L. Otto, 2015: Stakeholder Perspectives on the Attribution of Extreme Weather Events: An Explorative Enquiry. Weather, Climate, and Society, 7(3), 224–237, doi: 10.1175/wcas-d-14-00045.1.
Sittaro, F., A. Paquette, C. Messier, and C.A. Nock, 2017: Tree range expansion in eastern North America fails to keep pace with climate warming at northern range limits. Global Change Biology, 23(8), 3292–3301, doi: 10.1111/gcb.13622.
Sivakumar, M.V.K. and F. Lucio, 2018: Climate Services for Sustainable Development. In: Bridging Science and Policy Implication for Managing Climate Extremes[Jung, H.-S. and B. Wang (eds.)]. World Scientific, pp. 81–100, doi: 10.1142/9789813235663_0006.
Skelton, M., J.J. Porter, S. Dessai, D.N. Bresch, and R. Knutti, 2017: The social and scientific values that shape national climate scenarios: a comparison of the Netherlands, Switzerland and the UK. Regional Environmental Change, 17(8), 2325–2338, doi: 10.1007/s10113-017-1155-z.
Skliris, N., R. Marsh, J. Mecking, and J.D. Zika, 2020: Changing water cycle and freshwater transports in the Atlantic Ocean in observations and CMIP5 models. Climate Dynamics, 54, 4971–4989, doi: 10.1007/s00382-020-05261-y.
Slater, A.G. and D.M. Lawrence, 2013: Diagnosing Present and Future Permafrost from Climate Models. Journal of Climate, 26(15), 5608–5623, doi: 10.1175/jcli-d-12-00341.1.
Smale, D.A. et al., 2019: Marine heatwaves threaten global biodiversity and the provision of ecosystem services. Nature Climate Change, 9(4), 306–312, doi: 10.1038/s41558-019-0412-1.
Smith, A.T. and J.D. Nagy, 2015: Population resilience in an American pika(Ochotona princeps) metapopulation. Journal of Mammalogy, 96(2), 394–404, doi: 10.1093/jmammal/gyv040.
Smith, B.A. and A. Fazil, 2019: How will climate change impact microbial foodborne disease in Canada?Canada Communicable Disease Report, 45(4), 108–113, doi: 10.14745/ccdr.v45i04a05.
Smith, J. et al., 2001: Vulnerability to Climate Change and Reasons for Concern: A Synthesis Contents. In: Climate Change 2001: Impacts, Adaptation, and Vulnerability. Contribution of Working Group II to the Third Assessment Report of the Intergovernmental Panel on Climate Change[McCarthy, J.J., O.F. Canziani, N.A. Leary, D.J. Dokken, and K.S. White (eds.)]. Cambridge University Press, Cambridge, United Kingdom and New York, NY, USA, pp. 915–969, www.ipcc.ch/report/ar3/wg2.
Smith, K.R. et al., 2016: The last Summer Olympics? Climate change, health, and work outdoors. The Lancet, 388(10045), 642–644, doi: 10.1016/s0140-6736(16)31335-6.
Smith, M.R. and S.S. Myers, 2018: Impact of anthropogenic CO2 emissions on global human nutrition. Nature Climate Change, 8(9), 834–839, doi: 10.1038/s41558-018-0253-3.
Smith, M.T., M. Reid, S. Kovalchik, T.O. Woods, and R. Duffield, 2018: Heat stress incident prevalence and tennis matchplay performance at the Australian Open. Journal of Science and Medicine in Sport, 21(5), 467–472, doi: 10.1016/j.jsams.2017.08.019.
Smith, M.W. et al., 2020: Incorporating hydrology into climate suitability models changes projections of malaria transmission in Africa. Nature Communications, 11(1), 4353, doi: 10.1038/s41467-020-18239-5.
Smits, A., A.M.G. Klein Tank, and G.P. Können, 2005: Trends in storminess over the Netherlands, 1962–2002. International Journal of Climatology, 25(10), 1331–1344, doi: 10.1002/joc.1195.
Soares, P.M.M., M.C. Brito, and J.A.M. Careto, 2019: Persistence of the high solar potential in Africa in a changing climate. Environmental Research Letters, 14(12), 124036, doi: 10.1088/1748-9326/ab51a1.
Solaun, K. and E. Cerdá, 2019: Climate change impacts on renewable energy generation. A review of quantitative projections. Renewable and Sustainable Energy Reviews, 116, 109415, doi: 10.1016/j.rser.2019.109415.
Solman, S.A., 2013: Regional Climate Modeling over South America: A Review. Advances in Meteorology, 2013, 504357, doi: 10.1155/2013/504357.
Somot, S. et al., 2018: Editorial for the Med-CORDEX special issue. Climate Dynamics, 51(3), 771–777, doi: 10.1007/s00382-018-4325-x.
Son, R. et al., 2020: Climate diagnostics of the extreme floods in Peru during early 2017. Climate Dynamics, 54(1–2), 935–945, doi: 10.1007/s00382-019-05038-y.
Song, M. and J. Liu, 2017: The role of diminishing Arctic sea ice in increased winter snowfall over northern high-latitude continents in a warming environment. Acta Oceanologica Sinica, 36(8), 34–41, doi: 10.1007/s13131-017-1021-3.
Soret, A. et al., 2019: Sub-seasonal to seasonal climate predictions for wind energy forecasting. Journal of Physics: Conference Series, 1222, 12009, doi: 10.1088/1742-6596/1222/1/012009.
Sorg, A., M. Huss, M. Rohrer, and M. Stoffel, 2014: The days of plenty might soon be over in glacierized Central Asian catchments. Environmental Research Letters, 9(10), 104018, doi: 10.1088/1748-9326/9/10/104018.
Spandre, P. et al., 2019: Winter tourism under climate change in the Pyrenees and the French Alps: relevance of snowmaking as a technical adaptation. The Cryosphere, 13(4), 1325–1347, doi: 10.5194/tc-13-1325-2019.
Spickett, J.T., H.L. Brown, and K. Rumchev, 2011: Climate Change and Air Quality: The Potential Impact on Health. Asia Pacific Journal of Public Health, 23(2_suppl), 37S–45S, doi: 10.1177/1010539511398114.
Spinoni, J., J. Vogt, and P. Barbosa, 2015: European degree–day climatologies and trends for the period 1951-2011. International Journal of Climatology, 35(1), 25–36, doi: 10.1002/joc.3959.
Spinoni, J., G. Naumann, H. Carrao, P. Barbosa, and J. Vogt, 2014: World drought frequency, duration, and severity for 1951–2010. International Journal of Climatology, 34(8), 2792–2804, doi: 10.1002/joc.3875.
Spinoni, J., J. Vogt, G. Naumann, P. Barbosa, and A. Dosio, 2018a: Will drought events become more frequent and severe in Europe?International Journal of Climatology, 38(4), 1718–1736, doi: 10.1002/joc.5291.
Spinoni, J. et al., 2018b: Changes of heating and cooling degree-days in Europe from 1981 to 2100. International Journal of Climatology, 38(S1), e191–e208, doi: 10.1002/joc.5362.
Spinoni, J. et al., 2019: A new global database of meteorological drought events from 1951 to 2016. Journal of Hydrology: Regional Studies, 22, 100593, doi: 10.1016/j.ejrh.2019.100593.
Spinoni, J. et al., 2020: Future Global Meteorological Drought Hot Spots: A Study Based on CORDEX Data. Journal of Climate, 33(9), 3635–3661, doi: 10.1175/jcli-d-19-0084.1.
Staiger, H., G. Laschewski, and A. Matzarakis, 2019: Selection of Appropriate Thermal Indices for Applications in Human Biometeorological Studies. Atmosphere, 10(1), 18, doi: 10.3390/atmos10010018.
Stathers, T., R. Lamboll, and B.M. Mvumi, 2013: Postharvest agriculture in changing climates: its importance to African smallholder farmers. Food Security, 5(3), 361–392, doi: 10.1007/s12571-013-0262-z.
Steiger, R. and D. Scott, 2020: Ski tourism in a warmer world: Increased adaptation and regional economic impacts in Austria. Tourism Management, 77, 104032, doi: 10.1016/j.tourman.2019.104032.
Steiger, R., D. Scott, B. Abegg, M. Pons, and C. Aall, 2019: A critical review of climate change risk for ski tourism. Current Issues in Tourism, 22(11), 1343–1379, doi: 10.1080/13683500.2017.1410110.
Steinberg, N. et al., 2018: Preparing Public Health Officials for Climate Change: A Decision Support Tool. A report for California’s Fourth Climate Change Assessment. CCCA4-CNRA-2018-012, California Natural Resources Agency, CA, USA, 74 pp., https://climateassessment.ca.gov/techreports/public-health.html.
Stennett-Brown, R.K., J.J.P. Jones, T.S. Stephenson, and M.A. Taylor, 2017: Future Caribbean temperature and rainfall extremes from statistical downscaling. International Journal of Climatology, 37(14), 4828–4845, doi: 10.1002/joc.5126.
Steynor, A., J. Lee, and A. Davison, 2020: Transdisciplinary co-production of climate services: a focus on process. Social Dynamics, 46(3), 414–433, doi: 10. 1080/02533952.2020.1853961.
Stinson, K.A., J.M. Albertine, L.M.S. Hancock, T.G. Seidler, and C.A. Rogers, 2016: Northern ragweed ecotypes flower earlier and longer in response to elevated CO2: what are you sneezing at?Oecologia, 182(2), 587–594, doi: 10.1007/s00442-016-3670-x.
Stoffel, M. and C. Huggel, 2012: Effects of climate change on mass movements in mountain environments. Progress in Physical Geography: Earth and Environment, 36(3), 421–439, doi: 10.1177/0309133312441010.
Stoffel, M. and C. Corona, 2018: Future winters glimpsed in the Alps. Nature Geoscience, 11(7), 458–460, doi: 10.1038/s41561-018-0177-6.
Stoffel, M., M. Bollschweiler, and M. Beniston, 2011: Rainfall characteristics for periglacial debris flows in the Swiss Alps: past incidences – potential future evolutions. Climatic Change, 105(1–2), 263–280, doi: 10.1007/s10584-011-0036-6.
Stoffel, M., T. Mendlik, M. Schneuwly-Bollschweiler, and A. Gobiet, 2014: Possible impacts of climate change on debris-flow activity in the Swiss Alps. Climatic Change, 122(1–2), 141–155, doi: 10.1007/s10584-013-0993-z.
Stojanovic, M. et al., 2020: Trends and Extremes of Drought Episodes in Vietnam Sub-Regions during 1980–2017 at Different Timescales. Water, 12(3), 813, doi: 10.3390/w12030813.
Stone, R.C. and H. Meinke, 2005: Operational seasonal forecasting of crop performance. Philosophical Transactions of the Royal Society B: Biological Sciences, 360(1463), 2109–2124, doi: 10.1098/rstb.2005.1753.
Storkey, J., P. Stratonovitch, D.S. Chapman, F. Vidotto, and M.A. Semenov, 2014: A Process-Based Approach to Predicting the Effect of Climate Change on the Distribution of an Invasive Allergenic Plant in Europe. PLOS ONE, 9(2), e88156, doi: 10.1371/journal.pone.0088156.
Storlazzi, C.D., E.P.L. Elias, and P. Berkowitz, 2015: Many Atolls May be Uninhabitable Within Decades Due to Climate Change. Scientific Reports, 5(1), 14546, doi: 10.1038/srep14546.
Storlazzi, C.D. et al., 2018: Most atolls will be uninhabitable by the mid-21st century because of sea-level rise exacerbating wave-driven flooding. Science Advances, 4(4), eaap9741, doi: 10.1126/sciadv.aap9741.
Stott, P.A. et al., 2016: Attribution of extreme weather and climate-related events. WIREs Climate Change, 7(1), 23–41, doi: 10.1002/wcc.380.
Stramma, L. et al., 2012: Expansion of oxygen minimum zones may reduce available habitat for tropical pelagic fishes. Nature Climate Change, 2(1), 33–37, doi: 10.1038/nclimate1304.
Street, R.B., 2016: Towards a leading role on climate services in Europe: A research and innovation roadmap. Climate Services, 1, 2–5, doi: 10.1016/j.cliser.2015.12.001.
Street, R.B. et al., 2019: How could climate services support disaster risk reduction in the 21st century. International Journal of Disaster Risk Reduction, 34, 28–33, doi: 10.1016/j.ijdrr.2018.12.001.
Streletskiy, D.A., L.J. Suter, N.I. Shiklomanov, B.N. Porfiriev, and D.O. Eliseev, 2019: Assessment of climate change impacts on buildings, structures and infrastructure in the Russian regions on permafrost. Environmental Research Letters, 14(2), 025003, doi: 10.1088/1748-9326/aaf5e6.
Stroeve, J.C. and D. Notz, 2018: Changing state of Arctic sea ice across all seasons. Environmental Research Letters, 13(10), 103001, doi: 10.1088/1748-9326/aade56.
Stroeve, J.C., T. Markus, L. Boisvert, J. Miller, and A. Barrett, 2014: Changes in Arctic melt season and implications for sea ice loss. Geophysical Research Letters, 41(4), 1216–1225, doi: 10.1002/2013gl058951.
Stuivenvolt-Allen, J. and S.S.-Y. Wang, 2019: Data Mining Climate Variability as an Indicator of U.S. Natural Gas. Frontiers in Big Data, 2, 20, doi: 10.3389/fdata.2019.00020.
Sturm, M., M.A. Goldstein, H. Huntington, and T.A. Douglas, 2017: Using an option pricing approach to evaluate strategic decisions in a rapidly changing climate: Black–Scholes and climate change. Climatic Change, 140(3–4), 437–449, doi: 10.1007/s10584-016-1860-5.
Su, Q. and B. Dong, 2019: Projected near-term changes in three types of heat waves over China under RCP4.5. Climate Dynamics, 53(7), 3751–3769, doi: 10.1007/s00382-019-04743-y.
Sui, C., Z. Zhang, L. Yu, Y. Li, and M. Song, 2017: Investigation of Arctic air temperature extremes at north of 60°N in winter. Acta Oceanologica Sinica, 36(11), 51–60, doi: 10.1007/s13131-017-1137-5.
Sui, Y., X. Lang, and D. Jiang, 2014: Time of emergence of climate signals over China under the RCP4.5 scenario. Climatic Change, 125(2), 265–276, doi: 10.1007/s10584-014-1151-y.
Sui, Y., X. Lang, and D. Jiang, 2018: Projected signals in climate extremes over China associated with a 2°C global warming under two RCP scenarios. International Journal of Climatology, 38(S1), e678–e697, doi: 10.1002/joc.5399.
Sully, S., D.E. Burkepile, M.K. Donovan, G. Hodgson, and R. van Woesik, 2019: A global analysis of coral bleaching over the past two decades. Nature Communications, 10(1), 1264, doi: 10.1038/s41467-019-09238-2.
Sultan, B. et al., 2020: Current needs for climate services in West Africa: Results from two stakeholder surveys. Climate Services, 18, 100166, doi: 10.1016/j.cliser.2020.100166.
Sun, C. and X. Zhou, 2020: Characterizing Hydrological Drought and Water Scarcity Changes in the Future: A Case Study in the Jinghe River Basin of China. Water, 12(6), 1605, doi: 10.3390/w12061605.
Sun, J., D. Wang, X. Hu, Z. Ling, and L. Wang, 2019: Ongoing Poleward Migration of Tropical Cyclone Occurrence Over the Western North Pacific Ocean. Geophysical Research Letters, 46(15), 9110–9117, doi: 10.1029/2019gl084260.
Sun, Q. et al., 2019: Global heat stress on health, wildfires, and agricultural crops under different levels of climate warming. Environment International, 128, 125–136, doi: 10.1016/j.envint.2019.04.025.
Sun, Y., T. Zhang, Y. Liu, W. Zhao, and X. Huang, 2020: Assessing Snow Phenology over the Large Part of Eurasia Using Satellite Observations from 2000 to 2016. Remote Sensing, 12(12), 2060, doi: 10.3390/rs12122060.
Sun, Y. et al., 2019: Contribution of Global warming and Urbanization to Changes in Temperature Extremes in Eastern China. Geophysical Research Letters, 46(20), 11426–11434, doi: 10.1029/2019gl084281.
Supari, F. Tangang, L. Juneng, and E. Aldrian, 2017: Observed changes in extreme temperature and precipitation over Indonesia. International Journal of Climatology, 37(4), 1979–1997, doi: 10.1002/joc.4829.
Supari et al., 2020: Multi-model projections of precipitation extremes in Southeast Asia based on CORDEX-Southeast Asia simulations. Environmental Research, 184, 109350, doi: 10.1016/j.envres.2020.109350.
Surdu, C.M., C.R. Duguay, and D. Fernández Prieto, 2016: Evidence of recent changes in the ice regime of lakes in the Canadian High Arctic from spaceborne satellite observations. The Cryosphere, 10(3), 941–960, doi: 10.5194/tc-10-941-2016.
Sutton, A.O., D. Strickland, and D.R. Norris, 2016: Food storage in a changing world: implications of climate change for food-caching species. Climate Change Responses, 3(1), 12, doi: 10.1186/s40665-016-0025-0.
Svoboda, M.D. and B.A. Fuchs, 2017: Handbook of drought indicators and indices. In: Drought and Water Crises: Integrating Science, Management, and Policy (Second Edition) (2nd edition)[Wilhite, D.A. and R.S. Pulwarty (eds.)]. CRC Press, Boca Raton, FL, USA, pp. 155–208, doi: 10.1201/b22009.
Swain, S. and K. Hayhoe, 2015: CMIP5 projected changes in spring and summer drought and wet conditions over North America. Climate Dynamics, 44( 9–10), 2737–2750, doi: 10.1007/s00382-014-2255-9.
Swann, A.L.S., F.M. Hoffman, C.D. Koven, and J.T. Randerson, 2016: Plant responses to increasing CO2 reduce estimates of climate impacts on drought severity. Proceedings of the National Academy of Sciences, 113(36), 10019–10024, doi: 10.1073/pnas.1604581113.
Sweerts, B. et al., 2019: Estimation of losses in solar energy production from air pollution in China since 1960 using surface radiation data. Nature Energy, 4(8), 657–663, doi: 10.1038/s41560-019-0412-4.
Sweet, W.V. and J. Park, 2014: From the extreme to the mean: Acceleration and tipping points of coastal inundation from sea level rise. Earth’s Future, 2(12), 579–600, doi: 10.1002/2014ef000272.
Sweet, W.V., G. Dusek, J. Obeysekera, and J.J. Marra, 2018: Patterns and projections of high tide flooding along the U.S. coastline using a common impact threshold. NOAA Technical Report NOS CO-OPS 086, National Oceanic and Atmospheric Administration (NOAA), National Ocean Service (NOS) Center for Operational Oceanographic Products and Services (COOPS), Silver Spring, MD, USA, 56 pp., doi: 10.7289/v5/tr-nos-coops-086.
Sweet, W.V., R. Horton, R.E. Kopp, A.N. LeGrande, and A. Romanou, 2017: Sea Level Rise. In: Climate Science Special Report: Fourth National Climate Assessment, Volume I[Wuebbles, D.J., D.W. Fahey, K.A. Hibbard, D.J. Dokken, B.C. Stewart, and T.K. Maycock (eds.)]. U.S. Global Change Research Program, Washington, DC, USA, pp. 333–363, doi: 10.7930/j0vm49f2.
Syed, M. and M. Al Amin, 2016: Geospatial Modeling for Investigating Spatial Pattern and Change Trend of Temperature and Rainfall. Climate, 4(2), 21, doi: 10.3390/cli4020021.
Sylla, M.B., N. Elguindi, F. Giorgi, and D. Wisser, 2016a: Projected robust shift of climate zones over West Africa in response to anthropogenic climate change for the late 21st century. Climatic Change, 134(1–2), 241–253, doi: 10.1007/s10584-015-1522-z.
Sylla, M.B., P.M. Nikiema, P. Gibba, I. Kebe, and N.A.B. Klutse, 2016b: Climate Change over West Africa: Recent Trends and Future Projections. In: Adaptation to Climate Change and Variability in Rural West Africa[Yaro, J.A. and J. Hesselberg (eds.)]. Springer, Cham, Switzerland, pp. 25–40, doi: 10.1007/978-3-319-31499-0_3.
Sylla, M.B., A. Faye, F. Giorgi, A. Diedhiou, and H. Kunstmann, 2018a: Projected Heat Stress Under 1.5°C and 2°C Global Warming Scenarios Creates Unprecedented Discomfort for Humans in West Africa. Earth’s Future, 6(7), 1029–1044, doi: 10.1029/2018ef000873.
Sylla, M.B., J.S. Pal, A. Faye, K. Dimobe, and H. Kunstmann, 2018b: Climate change to severely impact West African basin scale irrigation in 2°C and 1.5°C global warming scenarios. Scientific Reports, 8, 14395, doi: 10.1038/s41598-018-32736-0.
Syvitski, J.P.M. and J.D. Milliman, 2007: Geology, Geography, and Humans Battle for Dominance over the Delivery of Fluvial Sediment to the Coastal Ocean. The Journal of Geology, 115(1), 1–19, doi: 10.1086/509246.
Takagi, H. and M. Esteban, 2016: Statistics of tropical cyclone landfalls in the Philippines: unusual characteristics of 2013 Typhoon Haiyan. Natural Hazards, 80(1), 211–222, doi: 10.1007/s11069-015-1965-6.
Takagi, H., N. Thao, and L. Anh, 2016: Sea-Level Rise and Land Subsidence: Impacts on Flood Projections for the Mekong Delta’s Largest City. Sustainability, 8(9), 959, doi: 10.3390/su8090959.
Takahashi, C. and M. Watanabe, 2016: Pacific trade winds accelerated by aerosol forcing over the past two decades. Nature Climate Change, 6(8), 768–772, doi: 10.1038/nclimate2996.
Tall, A., J.Y. Coulibaly, and M. Diop, 2018: Do climate services make a difference? A review of evaluation methodologies and practices to assess the value of climate information services for farmers: Implications for Africa. Climate Services, 11, 1–12, doi: 10.1016/j.cliser.2018.06.001.
Tall, A. et al., 2014: Scaling up climate services for farmers: Mission Possible. Learning from good practice in Africa and South Asia. CCAFS Report No. 13, CGIAR Research Program on Climate Change, Agriculture and Food Security (CCAFS), Copenhagen, Denmark, 44 pp., https://hdl.handle.net/10568/42445.
Tam, B.Y. et al., 2019: CMIP5 drought projections in Canada based on the Standardized Precipitation Evapotranspiration Index. Canadian Water Resources Journal, 44(1), 90–107, doi: 10.1080/07011784.2018.1537812.
Tamerius, J.D., X. Zhou, R. Mantilla, and T. Greenfield-Huitt, 2016: Precipitation Effects on Motor Vehicle Crashes Vary by Space, Time, and Environmental Conditions. Weather, Climate, and Society, 8(4), 399–407, doi: 10.1175/wcas-d-16-0009.1.
Tang, B.H., V.A. Gensini, and C.R. Homeyer, 2019: Trends in United States large hail environments and observations. npj Climate and Atmospheric Science, 2(1), 45, doi: 10.1038/s41612-019-0103-7.
Tang, C. et al., 2019: Numerical simulation of surface solar radiation over Southern Africa. Part 2: projections of regional and global climate models. Climate Dynamics, 53(3–4), 2197–2227, doi: 10.1007/s00382-019-04817-x.
Tart, S., M. Groth, and P. Seipold, 2020: Market demand for climate services: An assessment of users’ needs. Climate Services, 17, 100109, doi: 10.1016/j.cliser.2019.100109.
Taufik, M. et al., 2017: Amplification of wildfire area burnt by hydrological drought in the humid tropics. Nature Climate Change, 7(6), 428–431, doi: 10.1038/nclimate3280.
Taylor, A., D. Scott, A. Steynor, and A. Mcclure, 2017: Transdisciplinary, co-production and co-exploration: integrating knowledge across science, policy and practice in FRACTAL. Future Resilience for African CiTies and Lands (FRACTAL), 22 pp., www.fractal.org.za/wp-content/uploads/2017/03/Co-co-trans_March-2017.pdf .
Taylor, C.M. et al., 2017: Frequency of extreme Sahelian storms tripled since 1982 in satellite observations. Nature, 544(7651), 475–478, doi: 10.1038/nature22069.
Taylor, K.E., R.J. Stouffer, and G.A. Meehl, 2012: An Overview of CMIP5 and the Experiment Design. Bulletin of the American Meteorological Society, 93(4), 485–498, doi: 10.1175/bams-d-11-00094.1.
Taylor, M.A. et al., 2018: Future Caribbean Climates in a World of Rising Temperatures: The 1.5 vs 2.0 Dilemma. Journal of Climate, 31(7), 2907–2926, doi: 10.1175/jcli-d-17-0074.1.
Taylor, R.G. et al., 2006: Recent glacial recession in the Rwenzori Mountains of East Africa due to rising air temperature. Geophysical Research Letters, 33(10), L10402, doi: 10.1029/2006gl025962.
Tebaldi, C. and M.F. Wehner, 2018: Benefits of mitigation for future heat extremes under RCP4.5 compared to RCP8.5. Climatic Change, 146(3–4), 349–361, doi: 10.1007/s10584-016-1605-5.
Teichmann, C. et al., 2013: How Does a Regional Climate Model Modify the Projected Climate Change Signal of the Driving GCM: A Study over Different CORDEX Regions Using REMO. Atmosphere, 4(2), 214–236, doi: 10.3390/atmos4020214.
Teichmann, C. et al., 2021: Assessing mean climate change signals in the global CORDEX-CORE ensemble. Climate Dynamics, 57(5–6), 1269–1292, doi: 10.1007/s00382-020-05494-x.
Teixeira, E.I., G. Fischer, H. van Velthuizen, C. Walter, and F. Ewert, 2013: Global hot-spots of heat stress on agricultural crops due to climate change. Agricultural and Forest Meteorology, 170, 206–215, doi: 10.1016/j.agrformet.2011.09.002.
Tesfaye, K. et al., 2017: Climate change impacts and potential benefits of heat-tolerant maize in South Asia. Theoretical and Applied Climatology, 130(3–4), 959–970, doi: 10.1007/s00704-016-1931-6.
Teskey, R. et al., 2015: Responses of tree species to heat waves and extreme heat events. Plant, Cell & Environment, 38(9), 1699–1712, doi: 10.1111/pce.12417.
Thakuri, S. et al., 2019: Elevation-dependent warming of maximum air temperature in Nepal during 1976–2015. Atmospheric Research, 228, 261–269, doi: 10.1016/j.atmosres.2019.06.006.
Thepaut, J.-N., D. Dee, R. Engelen, and B. Pinty, 2018: The Copernicus Programme and its Climate Change Service. In: IGARSS 2018 – 2018 IEEE International Geoscience and Remote Sensing Symposium, 1591–1593, doi: 10.1109/igarss.2018.8518067.
Thiery, W. et al., 2020: Warming of hot extremes alleviated by expanding irrigation. Nature communications, 11(1), 290, doi: 10.1038/s41467-019-14075-4.
Thirumalai, K., P.N. DiNezio, Y. Okumura, and C. Deser, 2017: Extreme temperatures in Southeast Asia caused by El Niño and worsened by global warming. Nature Communications, 8(1), 15531, doi: 10.1038/ncomms15531.
Thober, S. et al., 2018: Multi-model ensemble projections of European river floods and high flows at 1.5, 2, and 3 degrees global warming. Environmental Research Letters, 13(1), 014003, doi: 10.1088/1748-9326/aa9e35.
Thomas, C.D. et al., 2004: Extinction risk from climate change. Nature, 427(6970), 145–148, doi: 10.1038/nature02121.
Thomsen, M.S. et al., 2019: Local Extinction of Bull Kelp (Durvillaea spp. ) Due to a Marine Heatwave. Frontiers in Marine Science, 6, 84, doi: 10.3389/fmars.2019.00084.
Thorne, J.H. et al., 2017: The impact of climate change uncertainty on California’s vegetation and adaptation management. Ecosphere, 8(12), e02021, doi: 10.1002/ecs2.2021.
Tian, H. et al., 2016: Climate extremes and ozone pollution: a growing threat to China’s food security. Ecosystem Health and Sustainability, 2(1), e01203, doi: 10.1002/ehs2.1203.
Tian, Q., G. Huang, K. Hu, and D. Niyogi, 2019: Observed and global climate model based changes in wind power potential over the Northern Hemisphere during 1979–2016. Energy, 167, 1224–1235, doi: 10.1016/j.energy.2018.11.027.
Ting, M., J.P. Kossin, S.J. Camargo, and C. Li, 2019: Past and Future Hurricane Intensity Change along the U.S. East Coast. Scientific Reports, 9(1), 7795, doi: 10.1038/s41598-019-44252-w.
Tippett, M.K., C. Lepore, and J.E. Cohen, 2016: More tornadoes in the most extreme U.S. tornado outbreaks. Science, 354(6318), 1419–1423, doi: 10.1126/science.aah7393.
Tippett, M.K., J.T. Allen, V.A. Gensini, and H.E. Brooks, 2015: Climate and Hazardous Convective Weather. Current Climate Change Reports, 1(2), 60–73, doi: 10.1007/s40641-015-0006-6.
Tobin, I. et al., 2015: Assessing climate change impacts on European wind energy from ENSEMBLES high-resolution climate projections. Climatic Change, 128(1–2), 99–112, doi: 10.1007/s10584-014-1291-0.
Tobin, I. et al., 2016: Climate change impacts on the power generation potential of a European mid-century wind farms scenario. Environmental Research Letters, 11(3), 034013, doi: 10.1088/1748-9326/11/3/034013.
Tobin, I. et al., 2018: Vulnerabilities and resilience of European power generation to 1.5°C, 2°C and 3°C warming. Environmental Research Letters, 13(4), 044024, doi: 10.1088/1748-9326/aab211.
Todzo, S., A. Bichet, and A. Diedhiou, 2020: Intensification of the hydrological cycle expected in West Africa over the 21st century. Earth System Dynamics, 11(1), 319–328, doi: 10.5194/esd-11-319-2020.
Toimil, A., I.J. Losada, P. Camus, and P. Díaz-Simal, 2017: Managing coastal erosion under climate change at the regional scale. Coastal Engineering, 128, 106–122, doi: 10.1016/j.coastaleng.2017.08.004.
Tomasek, B.J., M.M. Williams, and A.S. Davis, 2017: Changes in field workability and drought risk from projected climate change drive spatially variable risks in Illinois cropping systems. PLOS ONE, 12(2), e0172301, doi: 10.1371/journal.pone.0172301.
Tong, D.Q., J.X.L. Wang, T.E. Gill, H. Lei, and B. Wang, 2017: Intensified dust storm activity and Valley fever infection in the southwestern United States. Geophysical Research Letters, 44(9), 4304–4312, doi: 10.1002/2017gl073524.
Torregrosa, A., T.A. O’Brien, and I.C. Faloona, 2014: Coastal Fog, Climate Change, and the Environment. Eos, Transactions American Geophysical Union, 95(50), 473–474, doi: 10.1002/2014eo500001.
Tous, M., G. Zappa, R. Romero, L. Shaffrey, and P.L. Vidale, 2016: Projected changes in medicanes in the HadGEM3 N512 high-resolution global climate model. Climate Dynamics, 47(5–6), 1913–1924, doi: 10.1007/s00382-015-2941-2.
Townhill, B.L. et al., 2018: Harmful algal blooms and climate change: exploring future distribution changes. ICES Journal of Marine Science, 75(6), 1882–1893, doi: 10.1093/icesjms/fsy113.
Tramblay, Y., G. Villarini, and W. Zhang, 2020: Observed changes in flood hazard in Africa. Environmental Research Letters, 15(10), 1040b5, doi: 10.1088/1748-9326/abb90b.
Tramblay, Y., L. Mimeau, L. Neppel, F. Vinet, and E. Sauquet, 2019: Detection and attribution of flood trends in Mediterranean basins. Hydrology and Earth System Sciences, 23(11), 4419–4431, doi: 10.5194/hess-23-4419-2019.
Trapp, R.J., K.A. Hoogewind, and S. Lasher-Trapp, 2019: Future Changes in Hail Occurrence in the United States Determined through Convection-Permitting Dynamical Downscaling. Journal of Climate, 32(17), 5493–5509, doi: 10.1175/jcli-d-18-0740.1.
Trauernicht, C., 2019: Vegetation–Rainfall interactions reveal how climate variability and climate change alter spatial patterns of wildland fire probability on Big Island, Hawaii. Science of the Total Environment, 650, 459–469, doi: 10.1016/j.scitotenv.2018.08.347.
Trauernicht, C. et al., 2015: The Contemporary Scale and Context of Wildfire in Hawai‘i. Pacific Science, 69(4), 427–444, doi: 10.2984/69.4.1.
Trewin, B. et al., 2020: An updated long-term homogenized daily temperature data set for Australia. Geoscience Data Journal, 7(2), 149–169, doi: 10.1002/gdj3.95.
Triet, N.V.K. et al., 2020: Future projections of flood dynamics in the Vietnamese Mekong Delta. Science of The Total Environment, 742, 140596, doi: 10.1016/j.scitotenv.2020.140596.
Tripathi, A., D.K. Tripathi, D.K. Chauhan, N. Kumar, and G.S. Singh, 2016: Paradigms of climate change impacts on some major food sources of the world: A review on current knowledge and future prospects. Agriculture, Ecosystems & Environment, 216, 356–373, doi: 10.1016/j.agee.2015.09.034.
Trnka, M. et al., 2014: Adverse weather conditions for European wheat production will become more frequent with climate change. Nature Climate Change, 4(7), 637–643, doi: 10.1038/nclimate2242.
Trnka, M. et al., 2019: Mitigation efforts will not fully alleviate the increase in water scarcity occurrence probability in wheat-producing areas. Science Advances, 5(9), eaau2406, doi: 10.1126/sciadv.aau2406.
Troccoli, A., 2018a: Achieving Valuable Weather and Climate Services. In: Weather & Climate Services for the Energy Industry[Troccoli, A. (ed.)]. Palgrave Macmillan, Cham, Switzerland, pp. 13–25, doi: 10.1007/978-3-319-68418-5_2.
Troccoli, A. (ed.), 2018b: Weather & Climate Services for the Energy Industry. Palgrave Macmillan, Cham, Switzerland, 197 pp., doi: 10.1007/978-3-319-68418-5.
Troccoli, A. et al., 2012: Long-term wind speed trends over Australia. Journal of Climate, 25(1), 170–183, doi: 10.1175/2011jcli4198.1.
Troccoli, A. et al., 2018: Creating a proof-of-concept climate service to assess future renewable energy mixes in Europe: An overview of the C3S ECEM project. Advances in Science and Research, 15, 191–205, doi: 10.5194/asr-15-191-2018.
Trtanj, J. et al., 2016: Ch. 6: Climate Impacts on Water-Related Illness. In: The Impacts of Climate Change on Human Health in the United States: A Scientific Assessment. U.S. Global Change Research Program, Washington, DC, USA, pp. 157–188, doi: 10.7930/j03f4mh4.
Turco, M. et al., 2018: Exacerbated fires in Mediterranean Europe due to anthropogenic warming projected with non-stationary climate–fire models. Nature Communications, 9(1), 3821, doi: 10.1038/s41467-018-06358-z.
Udo, K. and Y. Takeda, 2017: Projections of Future Beach Loss in Japan Due to Sea-Level Rise and Uncertainties in Projected Beach Loss. Coastal Engineering Journal, 59(2), 1740006–1740016, doi: 10.1142/s057856341740006x.
Underwood, B.S., Z. Guido, P. Gudipudi, and Y. Feinberg, 2017: Increased costs to US pavement infrastructure from future temperature rise. Nature Climate Change, 7(10), 704–707, doi: 10.1038/nclimate3390.
Undorf, S., M.A. Bollasina, B.B.B. Booth, and G.C. Hegerl, 2018: Contrasting the Effects of the 1850–1975 Increase in Sulphate Aerosols from North America and Europe on the Atlantic in the CESM. Geophysical Research Letters, 45(21), 11930–11940, doi: 10.1029/2018gl079970.
UNESCAP, 2018: Sand and Dust Storms in Asia and the Pacific: Opportunities for Regional Cooperation and Action. ST/ESCAP/2837, United Nations Economic and Social Commission for Asia and the Pacific (UNESCAP), Bangkok, Thailand, 112 pp., www.unescap.org/sites/default/files/UNESCAP SDS Report_1.pdf .
UNISDR, 2015: Making Development Sustainable: The Future of Disaster Risk Management. Global Assessment Report on Disaster Risk Reduction. United Nations Office for Disaster Risk Reduction (UNISDR), Geneva, Switzerland, 316 pp., www.undrr.org/publication/global-assessment-report-disaster-risk-reduction-2015.
Unterberger, C. et al., 2018: Spring frost risk for regional apple production under a warmer climate. PLOS ONE, 13(7), e0200201, doi: 10.1371/journal.pone.0200201.
Upperman, C.R. et al., 2017: Exposure to Extreme Heat Events Is Associated with Increased Hay Fever Prevalence among Nationally Representative Sample of US Adults: 1997–2013. The Journal of Allergy and Clinical Immunology: In Practice, 5(2), 435–441.e2, doi: 10.1016/j.jaip.2016.09.016.
Urban, M.C., 2015: Accelerating extinction risk from climate change. Science, 348(6234), 571–573, doi: 10.1126/science.aaa4984.
Urbieta, I.R., M. Franquesa, O. Viedma, and J.M. Moreno, 2019: Fire activity and burned forest lands decreased during the last three decades in Spain. Annals of Forest Science, 76(3), 90, doi: 10.1007/s13595-019-0874-3.
Uribe Botero, E., 2015: El cambio climático y sus efectos en la biodiversidad en América Latina. Comisión Económica para América Latina y el Caribe (CEPAL), 84 pp., www.cepal.org/es/publicaciones/39855-cambio-climatico-sus-efectos-la-biodiversidad-america-latina.
Urrutia-Jalabert, R., M.E. González, González-Reyes, A. Lara, and R. Garreaud, 2018: Climate variability and forest fires in central and south-central Chile. Ecosphere, 9(4), doi: 10.1002/ecs2.2171.
US EPA, 2016: Climate change indicators in the United States 2016. 4th Edition. EPA 430-R-16-004, United States Environmental Protection Agency (US EPA), 92 pp., www.epa.gov/sites/production/files/2016-08/documents/climate_indicators_2016.pdf .
Wuebbles, D.J., D.W. Fahey, K.A. Hibbard, D.J. Dokken, B.C. Stewart, and T.K. Maycock (eds.), 2017: Climate Science Special Report: Fourth National Climate Assessment, Volume I. U.S. Global Change Research Program, Washington, DC, USA, 470 pp., doi: 10.7930/j0j964j6.
Reidmiller, D.R., C.W. Avery, D.R. Easterling, K.E. Kunkel, K.L.M. Lewis, T.K. Maycock, and B.C. Stewart (eds.), 2018: Impacts, Risks, and Adaptation in the United States: Fourth National Climate Assessment, Volume II. US. Global Change Research Program, Washington, DC, USA, 1515 pp., doi: 10.7930/nca4.2018.
Vaidya, R.A. et al., 2019: Disaster Risk Reduction and Building Resilience in the Hindu Kush Himalaya. In: The Hindu Kush Himalaya Assessment: Mountains, Climate Change, Sustainability and People[Wester, P., A. Mishra, A. Mukherji, and A.B. Shrestha (eds.)]. Springer, Cham, pp. 389–419, doi: 10.1007/978-3-319-92288-1_11.
Val Martin, M. et al., 2015: How emissions, climate, and land use change will impact mid-century air quality over the United States: a focus on effects at national parks. Atmospheric Chemistry and Physics, 15(5), 2805–2823, doi: 10.5194/acp-15-2805-2015.
Valerio, M., M. Tomecek, S. Lovelli, and L. Ziska, 2013: Assessing the impact of increasing carbon dioxide and temperature on crop–weed interactions for tomato and a C3and C4 weed species. European Journal of Agronomy, 50, 60–65, doi: 10.1016/j.eja.2013.05.006.
Valiela, I., 2006: Global Coastal Change. Wiley-Blackwell, Malden, MA, USA, 376 pp.
Valsson, T. and G.F. Ulfarsson, 2011: Future changes in activity structures of the globe under a receding Arctic ice scenario. Futures, 43(4), 450–459, doi: 10.1016/j.futures.2010.12.002.
Van Beusekom, A.E. et al., 2018: Fire weather and likelihood: characterizing climate space for fire occurrence and extent in Puerto Rico. Climatic Change, 146(1–2), 117–131, doi: 10.1007/s10584-017-2045-6.
van den Hurk, B.J.J.M. et al., 2016: Improving predictions and management of hydrological extremes through climate services. Climate Services, 1, 6–11, doi: 10.1016/j.cliser.2016.01.001.
van den Hurk, B.J.J.M. et al., 2018: The match between climate services demands and Earth System Models supplies. Climate Services, 12, 59–63, doi: 10.1016/j.cliser.2018.11.002.
van Huysen, T., J. Hansen, and A. Tall, 2018: Scaling up climate services for smallholder farmers: Learning from practice. Climate Risk Management, 22, 1–3, doi: 10.1016/j.crm.2018.10.002.
van Oldenborgh, G.J. et al., 2018: Extreme heat in India and anthropogenic climate change. Natural Hazards and Earth System Sciences, 18(1), 365–381, doi: 10.5194/nhess-18-365-2018.
van Oldenborgh, G.J. et al., 2019: Cold waves are getting milder in the northern midlatitudes. Environmental Research Letters, 14(11), 114004, doi: 10.1088/1748-9326/ab4867.
van Oldenborgh, G.J. et al., 2021: Attribution of the Australian bushfire risk to anthropogenic climate change. Natural Hazards and Earth System Sciences, 21(3), 941–960, doi: 10.5194/nhess-21-941-2021.
van Vliet, M.T.H., D. Wiberg, S. Leduc, and K. Riahi, 2016: Power-generation system vulnerability and adaptation to changes in climate and water resources. Nature Climate Change, 6(4), 375–380, doi: 10.1038/nclimate2903.
van Vliet, M.T.H. et al., 2013: Global river discharge and water temperature under climate change. Global Environmental Change, 23(2), 450–464, doi: 10.1016/j.gloenvcha.2012.11.002.
Vanderlinden, J.-P. et al., 2017: Coastal Flooding, Uncertainty and Climate Change: Science as a Solution to (mis) Perceptions? A Qualitative Enquiry in Three Coastal European Settings. Journal of Coastal Research, 77, 127–133, doi: 10.2112/si77-013.1.
Vano, J.A. et al., 2018: DOs and DON’Ts for using climate change information for water resource planning and management: guidelines for study design. Climate Services, 12, 1–13, doi: 10.1016/j.cliser.2018.07.002.
Vanos, J.K., J.W. Baldwin, O. Jay, and K.L. Ebi, 2020: Simplicity lacks robustness when projecting heat-health outcomes in a changing climate. Nature Communications, 11(1), 6079, doi: 10.1038/s41467-020-19994-1.
Vaquer-Sunyer, R. and C.M. Duarte, 2008: Thresholds of hypoxia for marine biodiversity. Proceedings of the National Academy of Sciences, 105(40), 15452–15457, doi: 10.1073/pnas.0803833105.
Varanasi, A., P.V.V. Prasad, and M. Jugulam, 2016: Impact of Climate Change Factors on Weeds and Herbicide Efficacy. Advances in Agronomy, 135, 107–146, doi: 10.1016/bs.agron.2015.09.002.
Vaughan, C., S. Dessai, and C. Hewitt, 2018: Surveying Climate Services: What Can We Learn from a Bird’s-Eye View?Weather, Climate, and Society, 10(2), 373–395, doi: 10.1175/wcas-d-17-0030.1.
Vaughan, C., J. Hansen, P. Roudier, P. Watkiss, and E. Carr, 2019: Evaluating agricultural weather and climate services in Africa: Evidence, methods, and a learning agenda. WIREs Climate Change, 10(4), e586, doi: 10.1002/wcc.586.
Vautard, R., J. Cattiaux, P. Yiou, J.-N. Thépaut, and P. Ciais, 2010: Northern Hemisphere atmospheric stilling partly attributed to an increase in surface roughness. Nature Geoscience, 3(11), 756–761, doi: 10.1038/ngeo979.
Vautard, R. et al., 2018: Attribution of Wintertime Anticyclonic Stagnation Contributing to Air Pollution in Western Europe. Bulletin of the American Meteorological Society, 99(1), S70–S75, doi: 10.1175/bams-d-17-0113.1.
Vautard, R. et al., 2019: Human influence on European winter wind storms such as those of January 2018. Earth System Dynamics, 10(2), 271–286, doi: 10.5194/esd-10-271-2019.
Vautard, R. et al., 2020: Evaluation of the large EURO-CORDEX regional climate model ensemble. Journal of Geophysical Research: Atmospheres, 125, e2019JD032344, doi: 10.1029/2019jd032344.
Venäläinen, A. et al., 2014: Temporal variations and change in forest fire danger in Europe for 1960–2012. Natural Hazards and Earth System Sciences, 14(6), 1477–1490, doi: 10.5194/nhess-14-1477-2014.
Vera, C.S. and L. Díaz, 2015: Anthropogenic influence on summer precipitation trends over South America in CMIP5 models. International Journal of Climatology, 35(10), 3172–3177, doi: 10.1002/joc.4153.
Veraverbeke, S. et al., 2017: Lightning as a major driver of recent large fire years in North American boreal forests. Nature Climate Change, 7(7), 529–534, doi: 10.1038/nclimate3329.
Verfaillie, D. et al., 2018: Multi-component ensembles of future meteorological and natural snow conditions for 1500 m altitude in the Chartreuse mountain range, Northern French Alps. Cryosphere, 12(4), 1249–1271, doi: 10.5194/tc-12-1249-2018.
Vezzulli, L., E. Pezzati, I. Brettar, M. Höfle, and C. Pruzzo, 2015: Effects of Global Warming on VibrioEcology. Microbiology Spectrum, 3(3), doi: 10.1128/microbiolspec.ve-0004-2014.
Vicente-Serrano, S.M. et al., 2017: Extreme hydrological events and the influence of reservoirs in a highly regulated river basin of northeastern Spain. Journal of Hydrology: Regional Studies, 12, 13–32, doi: 10.1016/j.ejrh.2017.01.004.
Vichot-Llano, A., D. Martinez-Castro, A. Bezanilla-Morlot, A. Centella-Artola, and F. Giorgi, 2021: Projected changes in precipitation and temperature regimes and extremes over the Caribbean and Central America using a multiparameter ensemble of RegCM4. International Journal of Climatology, 41(2), 1328–1350, doi: 10.1002/joc.6811.
Vidal, J.-P., B. Hingray, C. Magand, E. Sauquet, and A. Ducharne, 2016: Hierarchy of climate and hydrological uncertainties in transient low-flow projections. Hydrology and Earth System Sciences, 20(9), 3651–3672, doi: 10.5194/hess-20-3651-2016.
Vikhamar-Schuler, D. et al., 2016: Changes in Winter Warming Events in the Nordic Arctic Region. Journal of Climate, 29(17), 6223–6244, doi: 10.1175/jcli-d-15-0763.1.
Villafuerte, M.Q. et al., 2014: Long-term trends and variability of rainfall extremes in the Philippines. Atmospheric Research, 137, 1–13, doi: 10.1016/j.atmosres.2013.09.021.
Villarini, G. and L.J. Slater, 2018: Examination of Changes in Annual Maximum Gauge Height in the Continental United States Using Quantile Regression. Journal of Hydrologic Engineering, 23(3), 06017010, doi: 10.1061/(asce)he.1943-5584.0001620.
Villarini, G. and W. Zhang, 2020: Projected changes in flooding: a continental U.S. perspective. Annals of the New York Academy of Sciences, 1472(1), 95–103, doi: 10.1111/nyas.14359.
Vincent, K., M. Daly, C. Scannell, and B. Leathes, 2018a: What can climate services learn from theory and practice of co-production?Climate Services, 12, 48–58, doi: 10.1016/j.cliser.2018.11.001.
Vincent, K., A. Steynor, K. Waagsaether, and T. Cull, 2018b: Communities of practice: One size does not fit all. Climate Services, 11, 72–77, doi: 10.1016/j.cliser.2018.05.004.
Vincent, L.A., X. Zhang, Mekis, H. Wan, and E.J. Bush, 2018: Changes in Canada’s Climate: Trends in Indices Based on Daily Temperature and Precipitation Data. Atmosphere-Ocean, 56(5), 332–349, doi: 10.1080/07055900.2018.1514579.
Visscher, K. et al., 2020: Matching supply and demand: A typology of climate services. Climate Services, 17, 100136, doi: 10.1016/j.cliser.2019.100136.
Viste, E. and A. Sorteberg, 2015: Snowfall in the Himalayas: an uncertain future from a little-known past. The Cryosphere, 9(3), 1147–1167, doi: 10.5194/tc-9-1147-2015.
Vitousek, S. et al., 2017: Doubling of coastal flooding frequency within decades due to sea-level rise. Scientific Reports, 7(1), 1399, doi: 10.1038/s41598-017-01362-7.
Vogel, E. et al., 2019: The effects of climate extremes on global agricultural yields. Environmental Research Letters, 14(5), 054010, doi: 10.1088/1748-9326/ab154b.
Vogel, M.M., M. Hauser, and S.I. Seneviratne, 2020: Projected changes in hot, dry and wet extreme events’ clusters in CMIP6 multi-model ensemble. Environmental Research Letters, 15(9), 94021, doi: 10.1088/1748-9326/ab90a7.
Vose, R.S. et al., 2014: Monitoring and Understanding Changes in Extremes: Extratropical Storms, Winds, and Waves. Bulletin of the American Meteorological Society, 95(3), 377–386, doi: 10.1175/bams-d-12-00162.1.
Vousdoukas, M.I., L. Mentaschi, E. Voukouvalas, M. Verlaan, and L. Feyen, 2017: Extreme sea levels on the rise along Europe’s coasts. Earth’s Future, 5(3), 304–323, doi: 10.1002/2016ef000505.
Vousdoukas, M.I. et al., 2018: Global probabilistic projections of extreme sea levels show intensification of coastal flood hazard. Nature Communications, 9(1), 2360, doi: 10.1038/s41467-018-04692-w.
Vousdoukas, M.I. et al., 2020a: Economic motivation for raising coastal flood defenses in Europe. Nature Communications, 11(1), 1–11, doi: 10.1038/s41467-020-15665-3.
Vousdoukas, M.I. et al., 2020b: Sandy coastlines under threat of erosion. Nature Climate Change, 10(3), 260–263, doi: 10.1038/s41558-020-0697-0.
Vu, D.T., T. Yamada, and H. Ishidaira, 2018: Assessing the impact of sea level rise due to climate change on seawater intrusion in Mekong Delta, Vietnam. Water Science and Technology, 77(6), 1632–1639, doi: 10.2166/wst.2018.038.
Wadsworth, R., A. Jalloh, and A. Lebbie, 2019: Changes in Rainfall in Sierra Leone: 1981–2018. Climate, 7(12), 144, doi: 10.3390/cli7120144.
Waha, K. et al., 2020: Multiple cropping systems of the world and the potential for increasing cropping intensity. Global Environmental Change, 64, 102131, doi: 10.1016/j.gloenvcha.2020.102131.
Wahl, T., S. Jain, J. Bender, S.D. Meyers, and M.E. Luther, 2015: Increasing risk of compound flooding from storm surge and rainfall for major US cities. Nature Climate Change, 5(12), 1093–1097, doi: 10.1038/nclimate2736.
Wainwright, D.J. et al., 2014: An argument for probabilistic coastal hazard assessment: Retrospective examination of practice in New South Wales, Australia. Ocean & Coastal Management, 95, 147–155, doi: 10.1016/j.ocecoaman.2014.04.009.
Walsh, K.J.E., F. Giorgi, and E. Coppola, 2014: Mediterranean warm-core cyclones in a warmer world. Climate Dynamics, 42(3–4), 1053–1066, doi: 10.1007/s00382-013-1723-y.
Walsh, K.J.E. et al., 2016a: Tropical cyclones and climate change. WIREs Climate Change, 7(1), 65–89, doi: 10.1002/wcc.371.
Walsh, K.J.E. et al., 2016b: Natural hazards in Australia: storms, wind and hail. Climatic Change, 139(1), 55–67, doi: 10.1007/s10584-016-1737-7.
Walvoord, M.A. and B.L. Kurylyk, 2016: Hydrologic Impacts of Thawing Permafrost – A Review. Vadose Zone Journal, 15(6), 1–20, doi: 10.2136/vzj2016.01.0010.
Wan, Z., H. Shi, X. Liu, and H. Liu, 2020: Analysis on the Ice Regime Change Characteristics in the Inner Mongolia Reach of the Yellow River from 1950 to 2010. Journal of Coastal Research, 115(sp1), 405–408, doi: 10.2112/jcr-si115-115.1.
Wanders, N. and Y. Wada, 2015: Human and climate impacts on the 21st century hydrological drought. Journal of Hydrology, 526, 208–220, doi: 10.1016/j.jhydrol.2014.10.047.
Wang, B., D.L. Liu, S. Asseng, I. Macadam, and Q. Yu, 2017: Modelling wheat yield change under CO2 increase, heat and water stress in relation to plant available water capacity in eastern Australia. European Journal of Agronomy, 90, 152–161, doi: 10.1016/j.eja.2017.08.005.
Wang, C., J. Liang, and K.I. Hodges, 2017: Projections of tropical cyclones affecting Vietnam under climate change: downscaled HadGEM2-ES using PRECIS 2.1. Quarterly Journal of the Royal Meteorological Society, 143(705), 1844–1859, doi: 10.1002/qj.3046.
Wang, C.-H., X. Wang, and Y.B. Khoo, 2013: Extreme wind gust hazard in Australia and its sensitivity to climate change. Natural Hazards, 67(2), 549–567, doi: 10.1007/s11069-013-0582-5.
Wang, D., T.C. Gouhier, B.A. Menge, and A.R. Ganguly, 2015: Intensification and spatial homogenization of coastal upwelling under climate change. Nature, 518(7539), 390–394, doi: 10.1038/nature14235.
Wang, G., S.B. Power, and S. Mcgree, 2016: Unambiguous warming in the western tropical Pacific primarily caused by anthropogenic forcing. International Journal of Climatology, 36(2), 933–944, doi: 10.1002/joc.4395.
Wang, H., T. Gao, and L. Xie, 2019: Extreme precipitation events during 1960–2011 for the Northwest China: space-time changes and possible causes. Theoretical and Applied Climatology, 137(1), 977–995, doi: 10.1007/s00704-018-2645-8.
Wang, J., M. Kuffer, R. Sliuzas, and D. Kohli, 2019: The exposure of slums to high temperature: Morphology-based local scale thermal patterns. Science of The Total Environment, 650, 1805–1817, doi: 10.1016/j.scitotenv.2018.09.324.
Wang, J., S. Yi, M. Li, L. Wang, and C. Song, 2018: Effects of sea level rise, land subsidence, bathymetric change and typhoon tracks on storm flooding in the coastal areas of Shanghai. Science of The Total Environment, 621, 228–234, doi: 10.1016/j.scitotenv.2017.11.224.
Wang, L. et al., 2017: Changes in start, end, and length of frost-free season across Northeast China. International Journal of Climatology, 37, 271–283, doi: 10.1002/joc.5002.
Wang, S. and R. Toumi, 2016: On the relationship between hurricane cost and the integrated wind profile. Environmental Research Letters, 11(11), 114005, doi: 10.1088/1748-9326/11/11/114005.
Wang, S. and L.-Y. Zhou, 2019: Integrated impacts of climate change on glacier tourism. Advances in Climate Change Research, 10(2), 71–79, doi: 10.1016/j.accre.2019.06.006.
Wang, S., L. Zhou, and Y. Wei, 2019: Integrated risk assessment of snow disaster over the Qinghai-Tibet Plateau. Geomatics, Natural Hazards and Risk, 10(1), 740–757, doi: 10.1080/19475705.2018.1543211.
Wang, S., Y. Che, and M. Xinggang, 2020: Integrated risk assessment of glacier lake outburst flood (GLOF) disaster over the Qinghai–Tibetan Plateau (QTP). Landslides, 17(12), 2849–2863, doi: 10.1007/s10346-020-01443-1.
Wang, S.S.-Y. et al., 2019: Consecutive extreme flooding and heat wave in Japan: Are they becoming a norm?Atmospheric Science Letters, 20(10), e933, doi: 10.1002/asl.933.
Wang, W., Y. Zhu, R. Xu, and J. Liu, 2015: Drought severity change in China during 1961–2012 indicated by SPI and SPEI. Natural Hazards, 75(3), 2437–2451, doi: 10.1007/s11069-014-1436-5.
Wang, X., C. Wu, H. Wang, A. Gonsamo, and Z. Liu, 2017a: No evidence of widespread decline of snow cover on the Tibetan Plateau over 2000–2015. Scientific Reports, 7(1), 14645, doi: 10.1038/s41598-017-15208-9.
Wang, X. et al., 2017b: Projected changes in daily fire spread across Canada over the next century. Environmental Research Letters, 12(2), 025005, doi: 10.1088/1748-9326/aa5835.
Wang, X.L., B. Trewin, Y. Feng, and D. Jones, 2013: Historical changes in Australian temperature extremes as inferred from extreme value distribution analysis. Geophysical Research Letters, 40(3), 573–578, doi: 10.1002/grl.50132.
Wang, Y., L. Song, C. Hewitt, N. Golding, and Z. Huang, 2020: Improving China’s Resilience to Climate-Related Risks: The China Framework for Climate Services. Weather, Climate, and Society, 12(4), 729–744, doi: 10.1175/wcas-d-19-0121.1.
Wang, Y. et al., 2018: Temporal and spatial variation relationship and influence factors on surface urban heat island and ozone pollution in the Yangtze River Delta, China. Science of The Total Environment, 631–632, 921–933, doi: 10.1016/j.scitotenv.2018.03.050.
Ward, D.M., 2013: The effect of weather on grid systems and the reliability of electricity supply. Climatic Change, 121(1), 103–113, doi: 10.1007/s10584-013-0916-z.
Ward, R.D., D.A. Friess, R.H. Day, and R.A. Mackenzie, 2016: Impacts of climate change on mangrove ecosystems: a region by region overview. Ecosystem Health and Sustainability, 2(4), e01211, doi: 10.1002/ehs2.1211.
Ward Jones, M.K., W.H. Pollard, and B.M. Jones, 2019: Rapid initialization of retrogressive thaw slumps in the Canadian high Arctic and their response to climate and terrain factors. Environmental Research Letters, 14(5), 055006, doi: 10.1088/1748-9326/ab12fd.
Warszawski, L. et al., 2014: The Inter-Sectoral Impact Model Intercomparison Project (ISI–MIP): Project framework. Proceedings of the National Academy of Sciences, 111(9), 3228–3232, doi: 10.1073/pnas.1312330110.
Wasko, C. and R. Nathan, 2019: Influence of changes in rainfall and soil moisture on trends in flooding. Journal of Hydrology, 575, 432–441, doi: 10.1016/j.jhydrol.2019.05.054.
Watson, S.-A., J.B. Fields, and P.L. Munday, 2017: Ocean acidification alters predator behaviour and reduces predation rate. Biology Letters, 13(2), 20160797, doi: 10.1098/rsbl.2016.0797.
Watt, M.S. et al., 2019: Assessment of multiple climate change effects on plantation forests in New Zealand. Forestry: An International Journal of Forest Research, 92(1), 1–15, doi: 10.1093/forestry/cpy024.
Watts, N. et al., 2018: The 2018 report of the Lancet Countdown on health and climate change: shaping the health of nations for centuries to come. The Lancet, 392(10163), 2479–2514, doi: 10.1016/s0140-6736(18)32594-7.
Weatherdon, L., A.K. Magnan, A.D. Rogers, U.R. Sumaila, and W.W.L. Cheung, 2016: Observed and Projected Impacts of Climate Change on Marine Fisheries, Aquaculture, Coastal Tourism, and Human Health: An Update. Frontiers in Marine Science, 3, 48, doi: 10.3389/fmars.2016.00048.
Webb, A.P. and P.S. Kench, 2010: The dynamic response of reef islands to sea-level rise: Evidence from multi-decadal analysis of island change in the Central Pacific. Global and Planetary Change, 72(3), 234–246, doi: 10.1016/j.gloplacha.2010.05.003.
Webb, J.D.C., D.M. Elsom, and G.T. Meaden, 2009: Severe hailstorms in Britain and Ireland, a climatological survey and hazard assessment. Atmospheric Research, 93(1–3), 587–606, doi: 10.1016/j.atmosres.2008.10.034.
Webb, N.P. and C. Pierre, 2018: Quantifying Anthropogenic Dust Emissions. Earth’s Future, 6(2), 286–295, doi: 10.1002/2017ef000766.
Webb, N.P. et al., 2020: Indicators and benchmarks for wind erosion monitoring, assessment and management. Ecological Indicators, 110, 105881, doi: 10.1016/j.ecolind.2019.105881.
Webber, H. et al., 2017: Canopy temperature for simulation of heat stress in irrigated wheat in a semi-arid environment: A multi-model comparison. Field Crops Research, 202, 21–35, doi: 10.1016/j.fcr.2015.10.009.
Webber, S. and S.D. Donner, 2017: Climate service warnings: cautions about commercializing climate science for adaptation in the developing world. WIREs Climate Change, 8(1), e424, doi: 10.1002/wcc.424.
Weber, J., F. Gotzens, and D. Witthaut, 2018: Impact of strong climate change on the statistics of wind power generation in Europe. Energy Procedia, 153, 22–28, doi: 10.1016/j.egypro.2018.10.004.
Wegmann, M., Y. Orsolini, and O. Zolina, 2018: Warm Arctic-cold Siberia: comparing the recent and the early 20th-century Arctic warmings. Environmental Research Letters, 13(2), 25009, doi: 10.1088/1748-9326/aaa0b7.
Wehner, M.F., J.R. Arnold, T. Knutson, K.E. Kunkel, and A.N. LeGrande, 2017: Droughts, Floods, and Wildfires. In: Climate Science Special Report: Fourth National Climate Assessment, Volume I[Wuebbles, D.J., D.W. Fahey, K.A. Hibbard, D.J. Dokken, B.C. Stewart, and T.K. Maycock (eds.)]. U.S. Global Change Research Program, Washington, DC, USA, pp. 231–256, doi: 10.7930/j0cj8bnn.
Wehof, J., J.K. Miller, and J. Engle, 2014: Application of the storm erosion index (SEI) to three unique storms. Coastal Engineering Proceedings, 1(34), 39, doi: 10.9753/icce.v34.management.39.
Weichselgartner, J. and B. Arheimer, 2019: Evolving Climate Services into Knowledge–Action Systems. Weather, Climate, and Society, 11(2), 385–399, doi: 10.1175/wcas-d-18-0087.1.
Weiss, L.C. et al., 2018: Rising pCO2 in Freshwater Ecosystems Has the Potential to Negatively Affect Predator-Induced Defenses in Daphnia. Current Biology, 28(2), 327–332.e3, doi: 10.1016/j.cub.2017.12.022.
Weisse, R. et al., 2015: Climate services for marine applications in Europe. Earth Perspectives, 2(1), 3, doi: 10.1186/s40322-015-0029-0.
Wernberg, T. et al., 2013: An extreme climatic event alters marine ecosystem structure in a global biodiversity hotspot. Nature Climate Change, 3(1), 78–82, doi: 10.1038/nclimate1627.
Wernberg, T. et al., 2016: Climate-driven regime shift of a temperate marine ecosystem. Science, 353(6295), 169–172, doi: 10.1126/science.aad8745.
Wester, P., A. Mishra, A. Mukherji, and A. Shrestha, 2019: The Hindu Kush Himalaya Assessment: Mountains, Climate Change, Sustainability and People. Springer, Cham, Switzerland, 627 pp., doi: 10.1007/978-3-319-92288-1.
Westerling, A.L., 2016: Increasing western US forest wildfire activity: sensitivity to changes in the timing of spring. Philosophical Transactions of the Royal Society B: Biological Sciences, 371(1696), 20150178, doi: 10.1098/rstb.2015.0178.
Whitehead, P.G., R.L. Wilby, R.W. Battarbee, M. Kernan, and A.J. Wade, 2009: A review of the potential impacts of climate change on surface water quality. Hydrological Sciences Journal, 54(1), 101–123, doi: 10.1623/hysj.54.1.101.
WHO, 2014: Quantitative risk assessment of the effects of climate change on selected causes of death, 2030s and 2050s [Hales, S., S. Kovats, S. Lloyd, and D. Campbell-Lendrum (eds.)]. World Health Organization (WHO), Geneva, Switzerland, pp. 115, https://apps.who.int/iris/handle/10665/134014.
Wickström, S., M.O. Jonassen, T. Vihma, and P. Uotila, 2020: Trends in cyclones in the high-latitude North Atlantic during 1979–2016. Quarterly Journal of the Royal Meteorological Society, 146(727), 762–779, doi: 10.1002/qj.3707.
Wijffels, S.E. et al., 2018: A fine spatial-scale sea surface temperature atlas of the Australian regional seas (SSTAARS): Seasonal variability and trends around Australasia and New Zealand revisited. Journal of Marine Systems, 187, 156–196, doi: 10.1016/j.jmarsys.2018.07.005.
Wilcox, A.C. et al., 2016: An integrated analysis of the March 2015 Atacama floods. Geophysical Research Letters, 43(15), 8035–8043, doi: 10.1002/2016gl069751.
Wilcox, C. et al., 2018: Trends in hydrological extremes in the Senegal and Niger Rivers. Journal of Hydrology, 566, 531–545, doi: 10.1016/j.jhydrol.2018.07.063.
Wild, M., D. Folini, and F. Henschel, 2017: Impact of climate change on future concentrated solar power (CSP) production. In: AIP Conference Proceedings. AIP Publishing, pp. 100007, doi: 10.1063/1.4975562.
Wild, M., D. Folini, F. Henschel, N. Fischer, and B. Müller, 2015: Projections of long-term changes in solar radiation based on CMIP5 climate models and their influence on energy yields of photovoltaic systems. Solar Energy, 116, 12–24, doi: 10.1016/j.solener.2015.03.039.
Wilkinson, M.D. et al., 2016: The FAIR Guiding Principles for scientific data management and stewardship. Scientific Data, 3(1), 160018, doi: 10.1038/sdata.2016.18.
Wille, J.D. et al., 2019: West Antarctic surface melt triggered by atmospheric rivers. Nature Geoscience, 12(11), 911–916, doi: 10.1038/s41561-019-0460-1.
Williamson, S.N. et al., 2020: Evidence for Elevation-Dependent Warming in the St. Elias Mountains, Yukon, Canada. Journal of Climate, 33(8), 3253–3269, doi: 10.1175/jcli-d-19-0405.1.
Willibald, F., S. Kotlarski, A. Grêt-Regamey, and R. Ludwig, 2020: Anthropogenic climate change versus internal climate variability: impacts on snow cover in the Swiss Alps. The Cryosphere, 14(9), 2909–2924, doi: 10.5194/tc-14-2909-2020.
Wilson, R. et al., 2018: Glacial lakes of the Central and Patagonian Andes. Global and Planetary Change, 162, 275–291, doi: 10.1016/j.gloplacha.2018.01.004.
Winsemius, H.C. et al., 2016: Global drivers of future river flood risk. Nature Climate Change, 6(4), 381–385, doi: 10.1038/nclimate2893.
WMO, 2015: Valuing Weather and Climate: Economic Assessment of Meteorological and Hydrological Services. WMO-No. 1153, World Meteorological Organization (WMO), Geneva, Switzerland, 286 pp., https://library.wmo.int/index.php?lvl=notice_display&id=17225#.YEzt651KhaQ.
WMO, 2018: Climate Change: Science and solutions. WMO Bulletin, 67(2), 76, https://library.wmo.int/?lvl=notice_display&id=20691#.YEzuVp1KhaQ.
Wobus, C. et al., 2017a: Climate change impacts on flood risk and asset damages within mapped 100-year floodplains of the contiguous United States. Natural Hazards and Earth System Sciences, 17(12), 2199–2211, doi: 10.5194/nhess-17-2199-2017.
Wobus, C. et al., 2017b: Projected climate change impacts on skiing and snowmobiling: A case study of the United States. Global Environmental Change, 45, 1–14, doi: 10.1016/j.gloenvcha.2017.04.006.
Wolfe, D.W. et al., 2008: Projected change in climate thresholds in the Northeastern U.S.: implications for crops, pests, livestock, and farmers. Mitigation and Adaptation Strategies for Global Change, 13(5–6), 555–575, doi: 10.1007/s11027-007-9125-2.
Wolfe, D.W. et al., 2018: Unique challenges and opportunities for northeastern US crop production in a changing climate. Climatic Change, 146(1–2), 231–245, doi: 10.1007/s10584-017-2109-7.
Wolski, P., 2018: How severe is Cape Town’s “Day Zero” drought?Significance, 15(2), 24–27, doi: 10.1111/j.1740-9713.2018.01127.x.
Woolway, R.I. et al., 2020: Global lake responses to climate change. Nature Reviews Earth & Environment, 1(8), 388–403, doi: 10.1038/s43017-020-0067-5.
Woolway, R.I. et al., 2021: Lake heatwaves under climate change. Nature, 589(7842), 402–407, doi: 10.1038/s41586-020-03119-1.
Wu, B. and J.A. Francis, 2019: Summer Arctic Cold Anomaly Dynamically Linked to East Asian Heat Waves. Journal of Climate, 32(4), 1137–1150, doi: 10.1175/jcli-d-18-0370.1.
Wu, C. et al., 2018: Can Climate Models Reproduce the Decadal Change of Dust Aerosol in East Asia. Geophysical Research Letters, 45(18), 9953–9962, doi: 10.1029/2018gl079376.
Wu, J., Y. Shi, and Y. Xu, 2020: Evaluation and Projection of Surface Wind Speed Over China Based on CMIP6 GCMs. Journal of Geophysical Research: Atmospheres, 125(22), e2020JD033611, doi: 10.1029/2020jd033611.
Wu, J., J. Zha, D. Zhao, and Q. Yang, 2018: Changes in terrestrial near-surface wind speed and their possible causes: an overview. Climate Dynamics, 51(5–6), 2039–2078, doi: 10.1007/s00382-017-3997-y.
Wu, M. et al., 2020: Spatiotemporal variability of standardized precipitation evapotranspiration index in mainland China over 1961–2016. International Journal of Climatology, 40(11), 4781–4799, doi: 10.1002/joc.6489.
Wu, S., Y. Wu, and J. Wen, 2019: Future changes in precipitation characteristics in China. International Journal of Climatology, 39(8), 3558–3573, doi: 10.1002/joc.6038.
Wu, X., Y. Lu, S. Zhou, L. Chen, and B. Xu, 2016: Impact of climate change on human infectious diseases: Empirical evidence and human adaptation. Environment International, 86, 14–23, doi: 10.1016/j.envint.2015.09.007.
Wuebbles, D. et al., 2014: CMIP5 Climate Model Analyses: Climate Extremes in the United States. Bulletin of the American Meteorological Society, 95(4), 571–583, doi: 10.1175/bams-d-12-00172.1.
Wypych, A., Z. Ustrnul, A. Sulikowska, F.-M. Chmielewski, and B. Bochenek, 2017: Spatial and temporal variability of the frost-free season in Central Europe and its circulation background. International Journal of Climatology, 37(8), 3340–3352, doi: 10.1002/joc.4920.
Xia, J., K. Tu, Z. Yan, and Y. Qi, 2016: The super-heat wave in eastern China during July–August 2013: a perspective of climate change. International Journal of Climatology, 36(3), 1291–1298, doi: 10.1002/joc.4424.
Xie, Y., K.F. Ahmed, J.M. Allen, A.M. Wilson, and J.A. Silander, 2015: Green-up of deciduous forest communities of northeastern North America in response to climate variation and climate change. Landscape Ecology, 30(1), 109–123, doi: 10.1007/s10980-014-0099-7.
Xu, Y. et al., 2017: Asian climate change under 1.5–4°C warming targets. Advances in Climate Change Research, 8(2), 99–107, doi: 10.1016/j.accre.2017.05.004.
Yalew, S.G. et al., 2020: Impacts of climate change on energy systems in global and regional scenarios. Nature Energy, 5(10), 794–802, doi: 10.1038/s41560-020-0664-z.
Yamaguchi, M., J.C.L. Chan, I.-J. Moon, K. Yoshida, and R. Mizuta, 2020: Global warming changes tropical cyclone translation speed. Nature Communications, 11(1), 47, doi: 10.1038/s41467-019-13902-y.
Yamamoto, A. et al., 2015: Global deep ocean oxygenation by enhanced ventilation in the Southern Ocean under long-term global warming. Global Biogeochemical Cycles, 29(10), 1801–1815, doi: 10.1002/2015gb005181.
Yang, Q., K. Song, Z. Wen, X. Hao, and C. Fang, 2019: Recent trends of ice phenology for eight large lakes using MODIS products in Northeast China. International Journal of Remote Sensing, 40(14), 5388–5410, doi: 10.1080/01431161.2019.1579939.
Yang, X., T.M. Pavelsky, and G.H. Allen, 2020a: The past and future of global river ice. Nature, 577(7788), 69–73, doi: 10.1038/s41586-019-1848-1.
Yang, X. et al., 2020b: Contrasting Influences of Human Activities on Hydrological Drought Regimes Over China Based on High-Resolution Simulations. Water Resources Research, 56(6), e2019WR025843, doi: 10.1029/2019wr025843.
Yao, N. et al., 2020: Projections of drought characteristics in China based on a standardized precipitation and evapotranspiration index and multiple GCMs. Science of The Total Environment, 704, 135245, doi: 10.1016/j.scitotenv.2019.135245.
Yao, X. et al., 2016: Spatial-temporal variations of lake ice phenology in the Hoh Xil region from 2000 to 2011. Journal of Geographical Sciences, 26(1), 70–82, doi: 10.1007/s11442-016-1255-6.
Yasuhara, K. et al., 2012: Effects of climate change on geo-disasters in coastal zones and their adaptation. Geotextiles and Geomembranes, 30, 24–34, doi: 10.1016/j.geotexmem.2011.01.005.
Ye, H. et al., 2015: Increasing atmospheric water vapor and higher daily precipitation intensity over northern Eurasia. Geophysical Research Letters, 42(21), 9404–9410, doi: 10.1002/2015gl066104.
Yeo, S.-R., W.M. Kim, and K.-Y. Kim, 2017: Eurasian snow cover variability in relation to warming trend and Arctic Oscillation. Climate Dynamics, 48(1), 499–511, doi: 10.1007/s00382-016-3089-4.
Yin, H., Y. Sun, and M.G. Donat, 2019: Changes in temperature extremes on the Tibetan Plateau and their attribution. Environmental Research Letters, 14(12), 124015, doi: 10.1088/1748-9326/ab503c.
Yin, J.H., 2005: A consistent poleward shift of the storm tracks in simulations of 21st century climate. Geophysical Research Letters, 32, L18701, doi: 10.1029/2005gl023684.
Yokohata, T. et al., 2019: Visualizing the Interconnections Among Climate Risks. Earth’s Future, 7(2), 85–100, doi: 10.1029/2018ef000945.
Yoon, J.H., S.Y.S. Wang, M.H. Lo, and W.Y. Wu, 2018: Concurrent increases in wet and dry extremes projected in Texas and combined effects on groundwater. Environmental Research Letters, 13(5), 054002, doi: 10.1088/1748-9326/aab96b.
Yoshida, K., M. Sugi, R. Mizuta, H. Murakami, and M. Ishii, 2017: Future Changes in Tropical Cyclone Activity in High-Resolution Large-Ensemble Simulations. Geophysical Research Letters, 44(19), 9910–9917, doi: 10.1002/2017gl075058.
You, Q. et al., 2017: A comparison of heat wave climatologies and trends in China based on multiple definitions. Climate Dynamics, 48(11–12), 3975–3989, doi: 10.1007/s00382-016-3315-0.
You, Q. et al., 2020: Elevation dependent warming over the Tibetan Plateau: Patterns, mechanisms and perspectives. Earth-Science Reviews, 210, 103349, doi: 10.1016/j.earscirev.2020.103349.
Young, A.M., P.E. Higuera, P.A. Duffy, and F.S. Hu, 2017: Climatic thresholds shape northern high-latitude fire regimes and imply vulnerability to future climate change. Ecography, 40(5), 606–617, doi: 10.1111/ecog.02205.
Yu, D., Y. Liu, P. Shi, and J. Wu, 2019: Projecting impacts of climate change on global terrestrial ecoregions. Ecological Indicators, 103, 114–123, doi: 10.1016/j.ecolind.2019.04.006.
Yu, R. and P. Zhai, 2020: More frequent and widespread persistent compound drought and heat event observed in China. Scientific Reports, 10(1), 14576, doi: 10.1038/s41598-020-71312-3.
Yu, Y., H. Stern, C. Fowler, F. Fetterer, and J. Maslanik, 2014: Interannual Variability of Arctic Landfast Ice between 1976 and 2007. Journal of Climate, 27(1), 227–243, doi: 10.1175/jcli-d-13-00178.1.
Yu, Y. et al., 2015: Climatic controls on the interannual to decadal variability in Saudi Arabian dust activity: Toward the development of a seasonal dust prediction model. Journal of Geophysical Research: Atmospheres, 120(5), 1739–1758, doi: 10.1002/2014jd022611.
Yuan, F. et al., 2016: Possible Future Climate Change Impacts on the Hydrological Drought Events in the Weihe River Basin, China. Advances in Meteorology, 2016, 2905198, doi: 10.1155/2016/2905198.
Yuan, X., L. Wang, and E.F. Wood, 2018: Anthropogenic Intensification of Southern African Flash Droughts as Exemplified by the 2015/16 Season. Bulletin of the American Meteorological Society, 99(1), S86–S90, doi: 10.1175/bams-d-17-0077.1.
Yue, X., L.J. Mickley, J.A. Logan, and J.O. Kaplan, 2013: Ensemble projections of wildfire activity and carbonaceous aerosol concentrations over the western United States in the mid-21st century. Atmospheric Environment, 77, 767–780, doi: 10.1016/j.atmosenv.2013.06.003.
Zahn, M., M. Akperov, A. Rinke, F. Feser, and I.I. Mokhov, 2018: Trends of Cyclone Characteristics in the Arctic and Their Patterns From Different Reanalysis Data. Journal of Geophysical Research: Atmospheres, 123(5), 2737–2751, doi: 10.1002/2017jd027439.
Zaninelli, P.G., C.G. Menéndez, M. Falco, N. López-Franca, and A.F. Carril, 2019: Future hydroclimatological changes in South America based on an ensemble of regional climate models. Climate Dynamics, 52(1–2), 819–830, doi: 10.1007/s00382-018-4225-0.
Zappa, G., L.C. Shaffrey, K.I. Hodges, P.G. Sansom, and D.B. Stephenson, 2013: A Multimodel Assessment of Future Projections of North Atlantic and European Extratropical Cyclones in the CMIP5 Climate Models. Journal of Climate, 26(16), 5846–5862, doi: 10.1175/jcli-d-12-00573.1.
Zarei, A.R., M.M. Moghimi, and M.R. Mahmoudi, 2016: Parametric and Non-Parametric Trend of Drought in Arid and Semi-Arid Regions Using RDI Index. Water Resources Management, 30(14), 5479–5500, doi: 10.1007/s11269-016-1501-9.
Zargar, A., R. Sadiq, B. Naser, and F.I. Khan, 2011: A review of drought indices. Environmental Reviews, 19, 333–349, doi: 10.1139/a11-013.
Zarzycki, C.M., 2016: Tropical Cyclone Intensity Errors Associated with Lack of Two-Way Ocean Coupling in High-Resolution Global Simulations. Journal of Climate, 29(23), 8589–8610, doi: 10.1175/jcli-d-16-0273.1.
Žebre, M. et al., 2021: 200 years of equilibrium-line altitude variability across the European Alps (1901–2100). Climate Dynamics, 56(3–4), 1183–1201, doi: 10.1007/s00382-020-05525-7.
Zekollari, H., M. Huss, and D. Farinotti, 2019: Modelling the future evolution of glaciers in the European Alps under the EURO-CORDEX RCM ensemble. The Cryosphere, 13(4), 1125–1146, doi: 10.5194/tc-13-1125-2019.
Zeleke, T.T., F. Giorgi, G.T. Diro, and B.F. Zaitchik, 2017: Trend and periodicity of drought over Ethiopia. International Journal of Climatology, 37(13), 4733–4748, doi: 10.1002/joc.5122.
Zeng, Z. et al., 2019: A reversal in global terrestrial stilling and its implications for wind energy production. Nature Climate Change, 9(12), 979–985, doi: 10.1038/s41558-019-0622-6.
Zha, J., J. Wu, D. Zhao, and Q. Yang, 2017: Changes of the probabilities in different ranges of near-surface wind speed in China during the period for 1970–2011. Journal of Wind Engineering & Industrial Aerodynamics, 169, 156–167, doi: 10.1016/j.jweia.2017.07.019.
Zha, J., J. Wu, D. Zhao, and J. Tang, 2019: A possible recovery of the near-surface wind speed in Eastern China during winter after 2000 and the potential causes. Theoretical and Applied Climatology, 136(1), 119–134, doi: 10.1007/s00704-018-2471-z.
Zha, J., J. Wu, D. Zhao, and W. Fan, 2020: Future projections of the near-surface wind speed over eastern China based on CMIP5 datasets. Climate Dynamics, 54(3), 2361–2385, doi: 10.1007/s00382-020-05118-4.
Zhai, J. et al., 2017: Intensity–area–duration analysis of droughts in China 1960–2013. Climate Dynamics, 48(1), 151–168, doi: 10.1007/s00382-016-3066-y.
Zhang, C., Y. Wang, K. Hamilton, and A. Lauer, 2016: Dynamical downscaling of the climate for the Hawaiian islands. Part II: Projection for the late twenty-first century. Journal of Climate, 29(23), 8333–8354, doi: 10.1175/jcli-d-16-0038.1.
Zhang, F. et al., 2018: Projection of global wind and solar resources over land in the 21st century. Global Energy Interconnection, 1(4), 443–451, doi: 10.14171/j.2096-5117.gei.2018.04.004.
Zhang, G. et al., 2018: Exacerbated grassland degradation and desertification in Central Asia during 2000–2014. Ecological Applications, 28(2), 442–456, doi: 10.1002/eap.1660.
Zhang, J. and X. Gao, 2016: Nutrient distribution and structure affect the acidification of eutrophic ocean margins: A case study in southwestern coast of the Laizhou Bay, China. Marine Pollution Bulletin, 111(1–2), 295–304, doi: 10.1016/j.marpolbul.2016.06.095.
Zhang, J. and Y. Shen, 2019: Spatio-temporal variations in extreme drought in China during 1961–2015. Journal of Geographical Sciences, 29(1), 67–83, doi: 10.1007/s11442-019-1584-3.
Zhang, J., G. Cowie, and S.W.A. Naqvi, 2013: Hypoxia in the changing marine environment. Environmental Research Letters, 8(1), 015025, doi: 10.1088/1748-9326/8/1/015025.
Zhang, K. et al., 2012: Comparing exposure metrics for classifying ‘dangerous heat’ in heat wave and health warning systems. Environment International, 46, 23–29, doi: 10.1016/j.envint.2012.05.001.
Zhang, M., Y. Chen, Y. Shen, and B. Li, 2019: Tracking climate change in Central Asia through temperature and precipitation extremes. Journal of Geographical Sciences, 29(1), 3–28, doi: 10.1007/s11442-019-1581-6.
Zhang, Q., X. Ni, and F. Zhang, 2017: Decreasing trend in severe weather occurrence over China during the past 50 years. Scientific Reports, 7(1), 42310, doi: 10.1038/srep42310.
Zhang, R., S. Zhang, J. Luo, Y. Han, and J. Zhang, 2019: Analysis of near-surface wind speed change in China during 1958–2015. Theoretical and Applied Climatology, 137(3), 2785–2801, doi: 10.1007/s00704-019-02769-0.
Zhang, X. et al., 2016: A Systematic Review of Global Desert Dust and Associated Human Health Effects. Atmosphere, 7(12), 158, doi: 10.3390/atmos7120158.
Zhang, X. et al., 2019: Changes in Temperature and Precipitation Across Canada. In: Canada’s Changing Climate Report[Bush, E. and D.S. Lemmen (eds.)]. Government of Canada, Ottawa, ON, Canada, pp. 112–193, https://changingclimate.ca/CCCR2019/chapter/4-0/.
Zhang, Z., K. Wang, D. Chen, J. Li, and R. Dickinson, 2019: Increase in Surface Friction Dominates the Observed Surface Wind Speed Decline during 1973–2014 in the Northern Hemisphere Lands. Journal of Climate, 32(21), 7421–7435, doi: 10.1175/jcli-d-18-0691.1.
Zhao, C., F. Brissette, J. Chen, and J.L. Martel, 2020: Frequency change of future extreme summer meteorological and hydrological droughts over North America. Journal of Hydrology, 584, 124316, doi: 10.1016/j.jhydrol.2019.124316.
Zhao, C. et al., 2017: Temperature increase reduces global yields of major crops in four independent estimates. Proceedings of the National Academy of Sciences, 114(35), 9326–9331, doi: 10.1073/pnas.1701762114.
Zhao, H.-Y. et al., 2021: Temporal and Spatial Characteristics of Drought in China under Climate Change. Chinese Journal of Agrometeorology, 42(1), 69–79, doi: 10.3969/j.issn.1000-6362.2021.01.007.
Zhao, L. et al., 2018: Interactions between urban heat islands and heat waves. Environmental Research Letters, 13(3), 34003, doi: 10.1088/1748-9326/aa9f73.
Zhao, L. et al., 2020: Changing climate and the permafrost environment on the Qinghai–Tibet (Xizang) plateau. Permafrost and Periglacial Processes, 31(3), 396–405, doi: 10.1002/ppp.2056.
Zhao, T. and A. Dai, 2017: Uncertainties in historical changes and future projections of drought. Part II: model-simulated historical and future drought changes. Climatic Change, 144(3), 535–548, doi: 10.1007/s10584-016-1742-x.
Zhao, X., D.L. Smith, and A.J. Tatem, 2016: Exploring the spatiotemporal drivers of malaria elimination in Europe. Malaria Journal, 15(1), 122, doi: 10.1186/s12936-016-1175-z.
Zhao, Y., A. Ducharne, B. Sultan, P. Braconnot, and R. Vautard, 2015: Estimating heat stress from climate-based indicators: present-day biases and future spreads in the CMIP5 global climate model ensemble. Environmental Research Letters, 10(8), 084013, doi: 10.1088/1748-9326/10/8/084013.
Zhao, Y. et al., 2016: Potential escalation of heat-related working costs with climate and socioeconomic changes in China. Proceedings of the National Academy of Sciences, 113(17), 4640–4645, doi: 10.1073/pnas.1521828113.
Zheng, F., M. Leonard, and S. Westra, 2017: Application of the design variable method to estimate coastal flood risk. Journal of Flood Risk Management, 10(4), 522–534, doi: 10.1111/jfr3.12180.
Zheng, Y. et al., 2016: A 20-year simulated climatology of global dust aerosol deposition. Science of the Total Environment, 557–558, 861–868, doi: 10.1016/j.scitotenv.2016.03.086.
Zhong, X., T. Zhang, S. Kang, and J. Wang, 2021: Spatiotemporal variability of snow cover timing and duration over the Eurasian continent during 1966–2012. Science of The Total Environment, 750, 141670, doi: 10.1016/j.scitotenv.2020.141670.
Zhou, B., Z. Wang, Y. Shi, Y. Xu, and Z. Han, 2018: Historical and Future Changes of Snowfall Events in China under a Warming Background. Journal of Climate, 31(15), 5873–5889, doi: 10.1175/jcli-d-17-0428.1.
Zhou, C., K. Wang, D. Qi, and J. Tan, 2019: Attribution of a Record-Breaking Heatwave Event in Summer 2017 over the Yangtze River Delta [in “Explaining Extremes of 2017 from a Climate Perspective”]. Bulletin of the American Meteorological Society, 100(1), S97–S103, doi: 10.1175/bams-d-18-0134.1.
Zhou, C., A. Dai, J. Wang, and D. Chen, 2021: Quantifying Human-Induced Dynamic and Thermodynamic Contributions to Severe Cold Outbreaks Like November 2019 in the Eastern United States [in “Explaining Extremes of 2019 from a Climate Perspective”]. Bulletin of the American Meteorological Society, 102(1), S17–S23, doi: 10.1175/bams-d-20-0171.1.
Zhou, T., L. Ren, H. Liu, and J. Lu, 2018: Impact of 1.5°C and 2.0°C global warming on aircraft takeoff performance in China. Science Bulletin, 63(11), 700–707, doi: 10.1016/j.scib.2018.03.018.
Zhu, C. et al., 2018: Carbon dioxide (CO2) levels this century will alter the protein, micronutrients, and vitamin content of rice grains with potential health consequences for the poorest rice-dependent countries. Science Advances, 4(5), eaaq1012, doi: 10.1126/sciadv.aaq1012.
Zhu, J., S. Wang, and G. Huang, 2019: Assessing Climate Change Impacts on Human-Perceived Temperature Extremes and Underlying Uncertainties. Journal of Geophysical Research: Atmospheres, 124(7), 3800–3821, doi: 10.1029/2018jd029444.
Zhu, X. et al., 2019: Projected temperature and precipitation changes on the Tibetan Plateau: results from dynamical downscaling and CCSM4. Theoretical and Applied Climatology, 138(1), 861–875, doi: 10.1007/s00704-019-02841-9.
Zhu, X. et al., 2020: Dynamical downscaling simulation and projection for mean and extreme temperature and precipitation over central Asia. Climate Dynamics, 54(7–8), 3279–3306, doi: 10.1007/s00382-020-05170-0.
Zhu, Z. et al., 2016: Greening of the Earth and its drivers. Nature Climate Change, 6(8), 791–795, doi: 10.1038/nclimate3004.
Zhuan, M.-J. et al., 2018: Timing of human-induced climate change emergence from internal climate variability for hydrological impact studies. Hydrology Research, 49(2), 421–437, doi: 10.2166/nh.2018.059.
Zimmerman, R. and C. Faris, 2010: Chapter 4: Infrastructure impacts and adaptation challenges [in ´Climate Change Adaptation in New York City: Building a Risk Management Response. New York City Panel on Climate Change 2010 Report´]. Annals of the New York Academy of Sciences, 1196(1), 63–86, doi: 10.1111/j.1749-6632.2009.05318.x.
Zinnert, J.C. et al., 2019: Connectivity in coastal systems: Barrier island vegetation influences upland migration in a changing climate. Global Change Biology, 25(7), 2419–2430, doi: 10.1111/gcb.14635.
Ziska, L.H., R.C. Sicher, K. George, and J.E. Mohan, 2007: Rising Atmospheric Carbon Dioxide and Potential Impacts on the Growth and Toxicity of Poison Ivy (Toxicodendron radicans). Weed Science, 55(4), 288–292, doi: 10.1614/ws-06-190.
Ziska, L.H. et al., 2019: Temperature-related changes in airborne allergenic pollen abundance and seasonality across the northern hemisphere: a retrospective data analysis. The Lancet Planetary Health, 3(3), e124–e131, doi: 10.1016/s2542-5196(19)30015-4.
Zkhiri, W., Y. Tramblay, L. Hanich, L. Jarlan, and D. Ruelland, 2019: Spatiotemporal characterization of current and future droughts in the High (Atlas basins (Morocco). Theoretical and Applied Climatology, 135(1–2), 593–605, doi: 10.1007/s00704-018-2388-6.
Zolfaghari, H., J. Masoompour, M. Yeganefar, and M. Akbary, 2016: Studying spatial and temporal changes of aridity in Iran. Arabian Journal of Geosciences, 9(5), 375, doi: 10.1007/s12517-016-2379-9.
Zong, X., X. Tian, and Y. Yin, 2020: Impacts of Climate Change on Wildfires in Central Asia. Forests, 11(8), 802, doi: 10.3390/f11080802.
Zscheischler, J. et al., 2018: Future climate risk from compound events. Nature Climate Change, 8(6), 469–477, doi: 10.1038/s41558-018-0156-3.
Zubkova, M., L. Boschetti, J.T. Abatzoglou, and L. Giglio, 2019: Changes in Fire Activity in Africa from 2002 to 2016 and Their Potential Drivers. Geophysical Research Letters, 46(13), 7643–7653, doi: 10.1029/2019gl083469.
Zulkafli, Z. et al., 2016: Projected increases in the annual flood pulse of the Western Amazon. Environmental Research Letters, 11(1), 14013, doi: 10.1088/1748-9326/11/1/014013.
None/low confidence
High
Low/moderate
Impacts and risk relevance
Climatic Impact-driver | ||||||||||||||||||||||||||||||||||
Heat and Cold | Wet and Dry | Wind | Snow and Ice | Coastal | Open Ocean | Other | ||||||||||||||||||||||||||||
Mean air temperature | Extreme heat | Cold spell | Frost | Mean precipitation | River flood | Heavy precipitation and pluvial flood | Landslide | Aridity | Hydrological drought | Agricultural and ecological drought | Fire weather | Mean wind speed | Severe wind storm | Tropical cyclone | Sand and dust storm | Snow, glacier and ice sheet | Permafrost | Lake, river and sea ice | Heavy snowfall and ice storm | Hail | Snow avalanche | Relative sea level | Coastal flood | Coastal erosion | Mean ocean temperature | Marine heatwave | Ocean acidity | Ocean salinity | Dissolved oxygen | Air pollution weather | Atmospheric CO2at surface | Radiation at surface | ||
Sector | Asset | |||||||||||||||||||||||||||||||||
Food, Fibre and Other Ecosystem Products (WGII Chapter 5) | Crop systems | |||||||||||||||||||||||||||||||||
Livestock and pasture systems | ||||||||||||||||||||||||||||||||||
Forestry systems | ||||||||||||||||||||||||||||||||||
Fisheries and aquaculture systems | ||||||||||||||||||||||||||||||||||
Cities, Settlements and Key Infrastructure (WGII Chapter 6) | Cities | |||||||||||||||||||||||||||||||||
Land and water transportation | ||||||||||||||||||||||||||||||||||
Energy infrastructure | ||||||||||||||||||||||||||||||||||
Built environment | ||||||||||||||||||||||||||||||||||
Health, Well-being and Communities (WGII Chapter 7) | Labour productivity | |||||||||||||||||||||||||||||||||
Morbidity | ||||||||||||||||||||||||||||||||||
Mortality | ||||||||||||||||||||||||||||||||||
Recreation and tourisma | ||||||||||||||||||||||||||||||||||
Poverty, Livelihoods and Sustainable Development (WGII Chapter 8) | Housing stockb | |||||||||||||||||||||||||||||||||
Farmlandb | ||||||||||||||||||||||||||||||||||
Livestock mortalityb | ||||||||||||||||||||||||||||||||||
Indigenous traditions | ||||||||||||||||||||||||||||||||||
a The Recreation and tourism asset category includes outdoor exercise and the tourism industry (including ecosystem services) assessed in many WGII chapters.
bThis asset category is distinguished by the threat of a full loss of key investments and living environments rather than a recoverable damage or loss of productivity or profit.
None/low confidence
High
Low/moderate
Impacts and risk relevance

High confidence of increase
Medium confidence of increase
Low confidence in direction of change
Not broadly relevant
Medium confidence of decrease
High confidence of decrease

High confidence of increase
Medium confidence of increase
Low confidence in direction of change
Not broadly relevant
Medium confidence of decrease
High confidence of decrease

High confidence of increase
Medium confidence of increase
Low confidence in direction of change
Not broadly relevant
Medium confidence of decrease
High confidence of decrease
Figure 12.8: (a) Mean change in 1-in-100-year river discharge per unit catchment area (Q100, m3s–1km–2) from CORDEX-South and Central America models for 2041–2060 relative to 1995–2014 for RCP8.5. (b) Shoreline position change along sandy coasts by the year 2100 relative to 2010 for RCP8.5 (metres; negative values indicate shoreline retreat) from the CMIP5-based dataset presented by Vousdoukas et al. (2020b). (c) Bar plots for Q100 (m3s–1km–2) averaged over land areas for the AR6 WGI Reference Regions (defined in Chapter 1). The left-hand column within each panel (associated with the left-hand y-axis) shows the ‘recent past’ (1995–2014) Q100 absolute values in grey shades. The other columns (associated with the right-hand y-axis) show the Q100 changes relative to the recent past values for two time periods (‘mid’ 2041–2060 and ‘long’ 2081–2100) and for three global warming levels (defined relative to the pre-industrial period 1850–1900): 1.5°C (purple), 2°C (yellow) and 4°C (brown). The bars show the median (dots) and the 10–90th percentile range of model ensemble values across each model ensemble. CMIP6 is shown by the darkest colours, CMIP5 by medium, and CORDEX by light. SSP5-8.5/RCP8.5 is shown in red and SSP1-2.6/RCP2.6 in blue. (d) Bar plots for shoreline position change show CMIP5-based projections of shoreline position change along sandy coasts for 2050 and 2100 relative to 2010 for RCP8.5 (red) and RCP4.5 (blue) from Vousdoukas et al. (2020b). Dots indicate regional mean change estimates and bars show the 5–95th percentile range of associated uncertainty. Note that these shoreline position change projections assume that there are no additional sediment sinks/sources or any physical barriers to shoreline retreat. See Technical (Annex VI for details of indices. Further details on data sources and processing are available in the chapter data table (Table 12.SM.1).

High confidence of increase
Medium confidence of increase
Low confidence in direction of change
Not broadly relevant
Medium confidence of decrease
High confidence of decrease

High confidence of increase
Medium confidence of increase
Low confidence in direction of change
Not broadly relevant
Medium confidence of decrease
High confidence of decrease

High confidence of increase
Medium confidence of increase
Low confidence in direction of change
Not broadly relevant
Medium confidence of decrease
High confidence of decrease
High confidence of increase
Medium confidence of increase
Low confidence in direction of change
Not broadly relevant
Medium confidence of decrease
High confidence of decrease
High confidence of decrease
Medium confidence of decrease
Low confidence in direction of change
Medium confidence of increase
High confidence of increase
Not broadly relevant


High confidence of increase
Medium confidence of increase
Low confidence in direction of change
Not broadly relevant
Medium confidence of decrease
High confidence of decrease
High confidence of decrease
Medium confidence of decrease
Low confidence in direction of change
Medium confidence of increase
High confidence of increase
High negative impact
Medium negative impact
Medium positive impact
High positive impact
No significant change


