Technical Summary


This Technical Summary should be cited as:
M. Pathak, R. Slade, P.R. Shukla, J. Skea, R. Pichs-Madruga, D. Ürge-Vorsatz,2022: Technical Summary. In: Climate Change 2022: Mitigation of Climate Change. Contribution of Working Group III to the Sixth Assessment Report of the Intergovernmental Panel on Climate Change[P.R. Shukla, J. Skea, R. Slade, A. Al Khourdajie, R. van Diemen, D. McCollum, M. Pathak, S. Some, P. Vyas, R. Fradera, M. Belkacemi, A. Hasija, G. Lisboa, S. Luz, J. Malley, (eds.)]. Cambridge University Press, Cambridge, UK and New York, NY, USA. doi: 10.1017/9781009157926.002.
TS.1 Introduction
The Working Group III (WGIII) contribution to the IPCC’s Sixth Assessment Report (AR6) assesses the current state of knowledge on the scientific, technological, environmental, economic and social aspects of climate change mitigation. It builds on previous IPCC reports, including the WGIII contribution to the IPCC’s Fifth Assessment Report (AR5) and the three Special Reports of the Sixth Assessment cycle on: Global Warming of 1.5°C (SR1.5); Climate Change and Land (SRCCL); and the Ocean and Cryosphere in a Changing Climate (SROCC). 1
The report assesses new literature, methodological and recent developments, and changes in approaches towards climate change mitigation since the IPCC AR5 report was published in 2014.
The global science and policy landscape on climate change mitigation has evolved since AR5. The development of the literature reflects, among other factors, the UN Framework Convention on Climate Change (UNFCCC), the outcomes of its Kyoto Protocol and the goals of the Paris Agreement {13, 14, 15}, and the UN 2030 Agenda for Sustainable Development {1, 4, 17}. Literature further highlights the growing role of non-state and sub-national actors in the global effort to address climate change, including cities, businesses, citizens, transnational initiatives and public-private entities {5, 8, 13}. It draws attention to the decreasing cost of some low-emission technologies {2, 6, 12} and the evolving role of international cooperation {14}, finance {15} and innovation {16}. Emerging literature examines the global spread of climate policies, strengthened mitigation actions in developing countries, sustained reductions in greenhouse gas (GHG) emissions in some developed countries and the continuing challenges for mitigation. {2, 13}
There are ever closer linkages between climate change mitigation, development pathways and the pursuit of Sustainable Development Goals (SDGs). Development pathways largely drive GHG emissions and hence shape the mitigation challenge and the portfolio of available responses {4}. The co-benefits and risks of mitigation responses also differ according to stages of development and national capabilities {1, 2, 3, 4, 13}. Climate change mitigation framed in the context of sustainable development, equity, and poverty eradication, and rooted in the development aspirations of the society within which they take place, will be more acceptable, durable and effective. {1, 4, 17}
This report includes new assessment approaches that go beyond those evaluated in the previous IPCC WGIII reports. In addition to sectoral and systems chapters {6, 7, 8, 9, 10, 11}, this report includes, for the first time, chapters dedicated to cross-sectoral perspectives {12}, demand, services and social aspects of mitigation (Box TS.11) {5}, and innovation, technology development and transfer {16}. The assessment of future pathways combines a forward-looking assessment of near- to medium-term perspectives up to 2050, including ways of shifting development pathways towards sustainability {4}, with an assessment of long-term outcome-oriented pathways up to 2100 {3}. Collaboration between the IPCC Working Groups is reflected in Cross-Working Group boxes which address topics such as the economic benefits from avoided impacts along mitigation pathways {Cross-Working Group Box 1 in Chapter 3}, climate change and urban areas {Cross-Working Group Box 2 in Chapter 8}, mitigation and adaptation through the bioeconomy {Cross-Working Group Box 3 in Chapter 12} and Solar Radiation Modification (SRM) {Cross-Working Group Box 4 in Chapter 14}. This assessment also gives greater attention than AR5 to social, economic and environmental dimensions of mitigation actions, and institutional, legal and financial aspects. {5, 13, 14, 15}
The report draws from literature on broad and diverse analytic frameworks across multiple disciplines. These include, inter alia: economic and environmental efficiency {1}; ethics and equity {4, 5, 17}; innovation and the dynamics of socio-technical transitions {16}; and socio-political-institutional frameworks {1, 5, 13, 14, 17}. These help to identify synergies and trade-offs with Sustainable Development Goals (SDGs), challenges and windows of opportunity for action including co-benefits, and equitable transitions at local, national and global scales. {1, 5, 13, 14, 16}
This Technical Summary (TS) of the WGIII contribution to the IPCC’s Sixth Assessment Report (AR6) broadly follows the report chapter order and is structured as follows.
TS Section 2 (TS.2) sets out how the global context for mitigation has changed and summarises signs of progress and continuing challenges.
TS Section 3 (TS.3) evaluates emission trends and drivers including recent sectoral, financial, technological and policy developments.
TS Section 4 (TS.4) identifies mitigation and development pathways in the near and mid-term to 2050, and in the longer term to 2100. This section includes an assessment of how mitigation pathways deploying different portfolios of mitigation responses are consistent with limiting global warming to different levels.
TS Section 5 (TS.5) summarises recent advances in knowledge across sectors and systems including energy, urban and other settlements, transport, buildings, industry, and agriculture, forestry and other land-use (AFOLU).
TS Section 6 (TS.6) examines how enabling conditions including behaviour and lifestyle, policy, governance and institutional capacity, international cooperation, finance, and innovation and technology can accelerate mitigation in the context of sustainable development.
TS Section 7 (TS.7) evaluates how mitigation can be achieved in the context of sustainable development, while maximising co-benefits and minimising risks.
Throughout this Technical Summary the validity of findings, confidence in findings, and cross-references to Technical Summary sections, figures and tables are shown in ( ) brackets. 2 References to the underlying report are shown in { } brackets.
TS.2 The Changed Global Context, Signs of Progress and Continuing Challenges
Since the IPCC’s Fifth Assessment Report (AR5), important changes that have emerged include the specific objectives established in the Paris Agreement of 2015 (for temperature, adaptation and finance), rising climate impacts, and higher levels of societal awareness and support for climate action (high confidence). Meeting the long-term temperature goal in the Paris Agreement, however, implies a rapid inflection in GHG emission trends and accelerating decline towards ‘net zero’. This is implausible without urgent and ambitious action at all scales. {1.2, 1.3, 1.5, 1.6, Chapters 3 and 4}
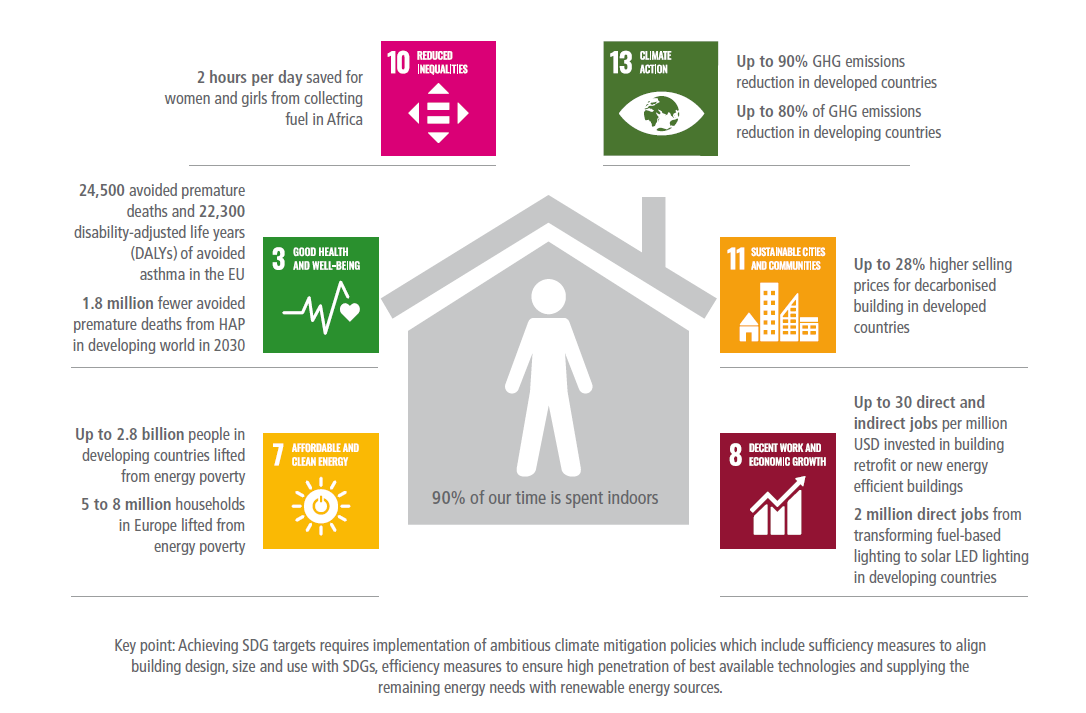
Effective and equitable climate policies are largely compatible with the broader goal of sustainable development and efforts to eradicate poverty as enshrined in the UN 2030 Agenda for Sustainable Development and its 17 Sustainable Development Goals (SDGs), notwithstanding trade-offs in some cases (high confidence). Taking urgent action to combat climate change and its impacts is one of the 17 SDGs (SDG 13). However, climate change mitigation also has synergies and/or trade-offs with many other SDGs. There has been a strong relationship between development and GHG emissions, as historically both per-capita and absolute emissions have risen with industrialisation. However, recent evidence shows countries can grow their economies while reducing emissions. Countries have different priorities in achieving the SDGs and reducing emissions as informed by their respective national conditions and capabilities. Given the differences in GHG emissions contributions, degree of vulnerability and impacts, as well as capacities within and between nations, equity and justice are important considerations for effective climate policy and for securing national and international support for deep decarbonisation. Achieving sustainable development and eradicating poverty would involve effective and equitable climate policies at all levels from local to global scale. Failure to address questions of equity and justice over time can undermine social cohesion and stability. International cooperation can enhance efforts to achieve ambitious global climate mitigation in the context of sustainable development. Pathways that illustrate movement towards fulfilling the SDGs are shown in Figure TS.1. {1.4, 1.6, Chapters 2, 3, 4, 5, 6, 7, 8, 9, 10, 11, 13 and 17}
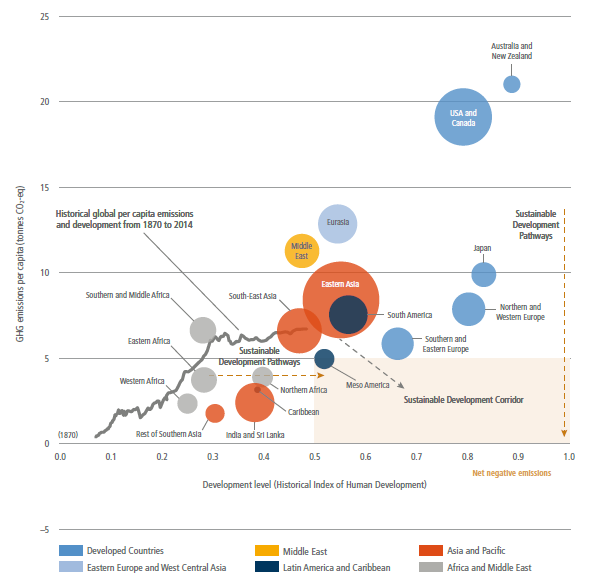
Figure TS.1 | Sustainable development pathways towards fulfilling the Sustainable Development Goals. The graph shows global average per-capita GHG emissions (vertical axis) and relative ‘Historic Index of Human Development’ (HIHD) levels (horizonal) have increased globally since the industrial revolution (grey line). The bubbles on the graph show regional per-capita GHG emissions and human development levels in the year 2015, illustrating large disparities. Pathways towards fulfilling the Paris Agreement (and SDG 13) involve global average per-capita GHG emissions below about 5 tCO2-eq by 2030. Likewise, to fulfil SDGs 3, 4 and 8, HIHD levels (see footnote 7 in Chapter 1) need to be at least 0.5 or greater. This suggests a ‘sustainable development zone’ for year 2030 (in pale brown); the in-figure text also suggests a ‘sustainable development corridor’, where countries limit per-capita GHG emissions while improving levels of human development over time. The emphasis of pathways into the sustainable development zone differ (dashed brown arrows), but in each case transformations are needed in how human development is attained while limiting GHG emissions.
The transition to a low-carbon economy depends on a wide range of closely intertwined drivers and constraints, including policies and technologies where notable advances over the past decade have opened up new and large-scale opportunities for deep decarbonisation, and for alternative development pathways which could deliver multiple social and developmental goals (high confidence). Drivers for, and constraints on, low-carbon societal transitions comprise economic and technological factors (the means by which services such as food, heating and shelter are provided and for whom, the emissions intensity of traded products, finance and investment), socio-political issues (political economy, equity and fairness, social innovation and behaviour change), and institutional factors (legal framework and institutions, and the quality of international cooperation). In addition to being deeply intertwined, all the factors matter to varying degrees, depending on the prevailing social, economic, cultural and political context. They often both drive and inhibit transitions at the same time, within and across different scales. The development and deployment of innovative technologies and systems at scale are important for achieving deep decarbonisation, and in recent years, the cost of several low-carbon technologies has declined sharply as deployment has risen rapidly. (Figure TS.7) {1.3, 1.4, Chapters 2, 4, 5, 13,14}
Accelerating mitigation to prevent dangerous anthropogenic interference with the climate system will require the integration of broadened assessment frameworks and tools that combine multiple perspectives, applied in a context of multi-level governance (high confidence). Analysing a challenge on the scale of fully decarbonising our economies entails integration of multiple analytic frameworks. Approaches to risk assessment and resilience, established across IPCC Working Groups, are complemented by frameworks for probing the challenges in implementing mitigation. Aggregate frameworks include cost-effectiveness analysis towards given objectives, and cost-benefit analysis, both of which have been developing to take fuller account of advances in understanding risks and innovation, the dynamics of sectors and systems and of climate impacts, and welfare economic theory including growing consensus on long-term discounting. Ethical frameworks consider the fairness of processes and outcomes which can help ameliorate distributional impacts across income groups, countries and generations. Transition and transformation frameworks explain and evaluate the dynamics of transitions to low-carbon systems arising from interactions amongst levels. Psychological, behavioural and political frameworks outline the constraints (and opportunities) arising from human psychology and the power of incumbent interests. A comprehensive understanding of climate mitigation must combine these multiple frameworks. Together with established risk frameworks, these collectively help to explain potential synergies and trade-offs in mitigation, implying a need for a wide portfolio of policies attuned to different actors and levels of decision-making, and underpin ‘just transition’ strategies in diverse contexts. {1.2.2, 1.7, 1.8, Figure 1.7}
The speed, direction, and depth of any transition will be determined by choices in the environmental, technological, economic, socio-cultural and institutional realms (high confidence). Transitions in specific systems can be gradual or can be rapid and disruptive. The pace of a transition can be impeded by ‘lock-in’ generated by existing physical capital, institutions, and social norms. The interaction between politics, economics and power relationships is central to explaining why broad commitments do not always translate to urgent action. At the same time, attention to, and support for, climate policies and low-carbon societal transitions has generally increased, as the impacts have become more salient. Both public and private financing and financial structures strongly affect the scale and balance of high- and low-carbon investments. Societal and behavioural norms, regulations and institutions are essential conditions to accelerate low-carbon transitions in multiple sectors, whilst addressing distributional concerns endemic to any major transition. The COVID-19 pandemic has also had far-reaching impacts on the global economic and social system, and recovery will present both challenges and opportunities for climate mitigation. (Box TS.1) {1.3, Box 1.1, 1.4, 1.8, Chapters 2, 3, 4, 5, 15, 17}
Achieving the global transition to a low-carbon, climate-resilient and sustainable world requires purposeful and increasingly coordinated planning and decisions at many scales of governance including local, sub-national, national and global levels (high confidence). Accelerating mitigation globally would imply strengthening policies adopted to date, expanding the effort across options, sectors, and countries, and broadening responses to include more diverse actors and societal processes at multiple – including international – levels. The effective governance of climate change entails strong action across multiple jurisdictions and decision-making levels, including regular evaluation and learning. Choices that cause climate change as well as the processes for making and implementing relevant decisions involve a range of non-nation state actors such as cities, businesses, and civil society organisations. At global, national and sub-national levels, climate change actions are interwoven with, and embedded in, the context of much broader social, economic and political goals. Therefore, the governance required to address climate change has to navigate power, political, economic, and social dynamics at all levels of decision-making. Effective climate-governing institutions, and openness to experimentation on a variety of institutional arrangements, policies and programmes can play a vital role in engaging stakeholders and building momentum for effective climate action. {1.4, 1.9, Chapters 8, 13, 15, 17}
Table TS.1 | Signs of progress and continuing challenges.
Signs of progress | Continuing challenges |
Emissions trends | |
The rate of global GHG emissions growth has slowed in recent years, from 2.1% yr –1 between 2000 and 2009, to 1.3% yr –1 in between 2010 and 2019. (TS.3) {2.2} | GHG emissions have continued to grow at high absolute rates. Emissions increased by 8.9 GtCO2-eq from 2000 to 2009 and by 6.5 GtCO2-eq from 2010 to 2019, reaching 59 GtCO2-eq in 2019. (TS.3) {2.2} |
A growing number of countries have reduced both territorial carbon dioxide (CO2) and GHG emissions and consumption-based CO2 emissionsin absolute terms for at least 10 years. These include mainly European countries, some of which have reduced production-based GHG emissions by a third or more since peaking. Some countries have achieved several years of rapid sustained CO2 reduction rates of 4% yr –1. (TS.3) {2.2} | The combined emissions reductions achieved by some countries have been outweighed by rapid emissions growth elsewhere, particularly among developing countries that have grown from a much lower base of per-capita emissions. Uncertainties in emissions levels and changes over time prevents a precise assessment of reductions in some cases. The per-capita emissions of developed countries remain high, particularly in Australia, Canada, and the United States of America. {2.2} |
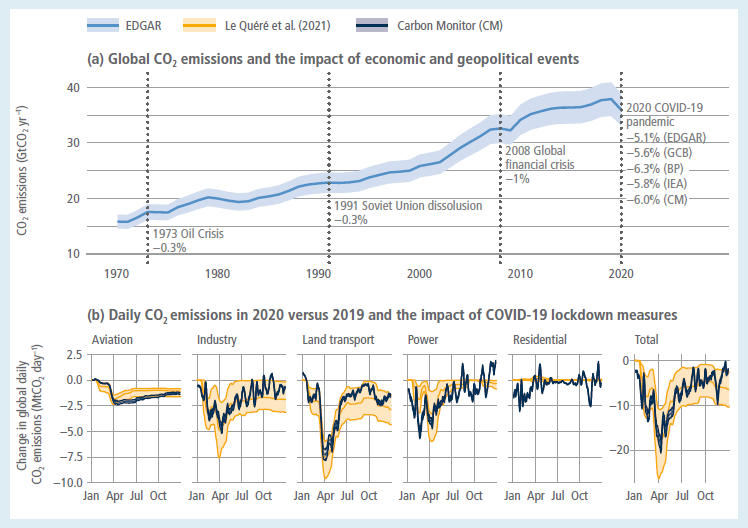
Lockdown policies in response to COVID-19 led to an estimated global drop of 5.8% in CO2 emissions in 2020 relative to 2019. Energy demand reduction occurred across sectors, except in residential buildings due to teleworking and homeschooling. The transport sector was particularly impacted and international aviation emissions declined by 45%. (Box TS.1) {2.2} | Atmospheric CO2concentrations continued to rise in 2020 and emissions have already rebounded as lockdown policies are eased. Economic recovery packages currently include support for fossil fuel industries. (Boxes TS.1 and TS.8) |
Sectors | |
Multiple low-carbon electricity generation and storage technologies have made rapid progress: costs have reduced, deployment has scaled up, and performance has improved. These include solar photovoltaics (PV), onshore and offshore wind, and batteries. In many contexts solar PV and onshore wind power are now competitive with fossil-based generation. (TS.3) {2.5, 6.3} | Although deployment is increasing rapidly, low-carbon electricity generation deployment levels and rates are currently insufficient to meet stringent climate goals. The combined market share of solar PV and wind generation technologies are still below 10%. Global low-carbon electricity generation will have to reach 100% by 2050, which is challenged by the continuous global increase in electricity demand. The contribution of biomass has absolute limits. (TS.5) {2.5} |
The rate of emissions growth from coal slowed since 2010 as coal power plants were retired in the US and Europe, fewer new plants were added in China, and a large number of planned global plants were scrapped or converted to co-firing with biomass. (TS.3) {2.7, 6.3} | Global coal emissions may not have peaked yet, and a few countries and international development banks continue to fund and develop new coal capacity, especially abroad. The lifetime emissions of current fossil-based energy infrastructures may already exceed the remaining carbon budget for keeping warming below 1.5°C. (TS.3) {2.2, 2.7, 6.7} |
Deforestation has declined since 2010 and net forest cover increased. Government initiatives and international moratoria were successful in reducing deforestation in the Amazon between 2004 and 2015, while regrowth and regeneration occurred in Europe, Eurasia and North America. (TS.5.6.1) {7.3.1} | The long-term maintenance of low deforestation rates is challenging. Deforestation in the Amazon has risen again over the past four years. Other parts of the world also face steady, or rapidly increasing, deforestation. {7.3.1} |
Electrification of public transport services is demonstrated as a feasible, scalable and affordable mitigation option to decarbonise mass transportation. Electric vehicles (e-vehicles) are the fastest growing segment of the automobile industry, having achieved double-digit market share by 2020 in many countries. When charged with low-carbon electricity, these vehicles can significantly reduce emissions. {10.4} | Transport emissions have remained roughly constant, growing at an average of 2% yr–1between 2010 and 2019 due to the persistence of high travel demand, heavier vehicles, low efficiencies, and car-centric development. The full decarbonisation of e-vehicles requires that they are charged with zero-carbon electricity, and that car production, shipping, aviation and supply chains are decarbonised. (TS.3) {2.4} |
There has been a significant global transition from coal and biomass use in buildings towards modern energy carriers andefficient conversiontechnologies. This led to efficiency improvements and some emissions reductions in developed countries, as well as significant gains in health and well-being outcomes in developing regions. Nearly zero energy buildings (nZEB) or low-energy buildings are achievable in all regions and climate zones for both new and existing buildings. {9.3, 9.8} | There is a significant lock-in risk in all regions given the long lifespansof buildings and the low ambition of building policies. This is the case for both existing buildings in developed countries, and also for new buildings in developing countries that are also challenged by the lack of technical capacity and effective governance. Emissions reductions in developed countries have been outweighed by the increase in population growth, floor area per capita and the demand for electricity and heat. {9.3, 9.9} |
The decarbonisation of most industrial processes has been demonstrated using technologies that include electricity and hydrogen for energy and feedstocks, carbon capture and utilisation technologies, and innovation in circular material flows. (TS.5.5) {11.2} | Industry emissions continue to increase, driven by a strong global demand for basic materials. Without reductions in material demand growth and a very rapid scale-up of low-carbon innovations, the long lifetimes of industrial capital stock risks locking-in emissions for decades to come. (TS.5.5) {11.2} |
Policies and investment | |
The Paris Agreement established a new global policy architecture to meet stringent climate goals, while avoiding many areas of deadlock that had arisen in trying to extend the Kyoto Protocol. (TS.6.3) | Current national pledges under the Paris Agreement 3 are insufficient tolimit warming to 1.5°C (>50%) with no or limited overshoot, and would requirean abrupt acceleration of mitigation efforts after 2030 to limit warming to 2°C (>67%). (TS.6.3) |
Most wealthy countries, and a growing list of developing countries, have signalled an intention to achieve net zero GHG (or net zero CO2) emissions by mid-century. National economy-wide GHG emissions targets covered 90% of global emissions in 2020 compared to 49% in 2010. Direct and indirect climate legislation has also steadily increased and this is supported by a growing list of financial investors. (TS.6.2) | Many net-zero targets are ambiguously defined, and the policies needed to achieve them are not yet in place. Opposition from status quo interests, as well as insufficient low-carbon financial flows, act as barriers to establishing and implementing stringent climate policies covering all sectors. (Box TS.6) {13.4} |
The global coverage of mandatory policies – pricing and regulation – has increased, and sectoral coverage of mitigation policies has expanded. Emission trading and carbon taxes now cover over 20% of global CO2 emissions. Allowance prices as of 1 April 2021 ranged from just over USD1 to USD50, covering between 9% and 80% of a jurisdiction’s emissions {13.6.3}. Many countries have introduced sectoral regulations that block new investment in fossil fuel technologies. (TS.6) | There is incomplete global policy coverage of non-CO2gases, CO2from industrial processes, and emissions outside the energy sector. Few of the world’s carbon prices are at a level consistent with various estimates of the carbon price needed to limit warming to 2°C or 1.5°C. {13.6} |
There has been a marked increase in civic and private engagement with climate governance. This includes business measures to limit emissions, invest in reforestation and develop carbon-neutral value chains such as using wood for construction. There is an upsurge in climate activism, and growing engagement of groups such as labour unions {1.3.3, 5.2.3}. The media coverage of climate change has also grown steadily across platforms and has generally become more accurate over time. (TS.6.2) | There is no conclusive evidence that an increase in engagement results in overall pro-mitigation outcomes. A broad group of actors influence how climate governance develops over time, including a range of civic organisations, encompassing both pro-and anti-climate action groups. Accurate transference of the climate science has been undermined significantly by climate change counter-movements, in both legacy and new/social media environments through misinformation. (TS.6.2) |
GHG emissions continued to rise to 2019, although the growth of global GHG emissions has slowed over the past decade (high confidence). Delivering the updated Nationally Determined Contributions (NDCs) to 2030 would turn this into decline, but the implied global emissions by 2030, still exceed pathways consistent with 1.5°C by a large margin and are near the upper end of the range of modelled pathways that limit warming to 2°C (>67%) or below. In all chapters of this report there is evidence of progress towards deeper mitigation, but there remain many obstacles to be overcome. Table TS.1 summarises some of the key signs of progress in emission trends, sectors, policies and investment, as well as the challenges that persist.
TS.3 Emission Trends and Drivers
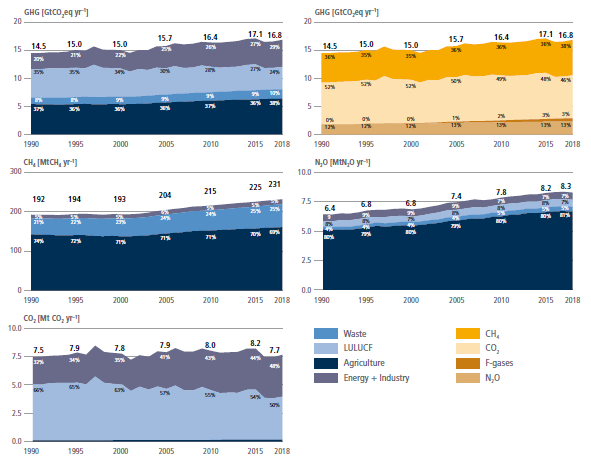
Global net anthropogenic GHG emissions during the decade 2010–2019 were higher than any previous time in human history (high confidence). Since 2010, GHG emissions have continued to grow reaching 59 ± 6.6 GtCO2-eq in 2019, 4 but the average annual growth in the last decade (1.3%, 2010–2019) was lower than in the previous decade (2.1%, 2000–2009) ( high confidence). Average annual GHG emissions were 56 GtCO2-eq yr –1 for 2010–2019 (the highest decadal average on record) growing by about 9.1 GtCO2-eq yr –1 from the previous decade (2000–2009) ( high confidence). (Figure TS.2) {2.2.2, Table 2.1, Figure 2.5}
Emissions growth has varied, but has persisted, across all groups of greenhouse gases (high confidence). The average annual emission levels of the last decade (2010–2019) were higher than in any previous decade for each group of greenhouse gases ( high confidence). In 2019, CO2 emissions were 45 ± 5.5 GtCO2, 5 methane (CH4) 11 ± 3.2 GtCO2-eq, nitrous oxide (N2O) 2.7 ± 1.6 GtCO2-eq and fluorinated gases (F-gases 6 ) 1.4 ± 0.41 GtCO2-eq. Compared to 1990, the magnitude and speed of these increases differed across gases: CO2 from fossil fuel and industry (FFI) grew by 15 GtCO2-eq yr –1 (67%), CH4 by 2.4 GtCO2-eq yr –1 (29%), F-gases by 0.97 GtCO2-eq yr –1 (250%), N2O by 0.65 GtCO2-eq yr –1 (33%). CO2 emissions from net land use, land-use change and forestry (LULUCF) have shown little long-term change, with large uncertainties preventing the detection of statistically significant trends. F-gases excluded from GHG emissions inventories such as chlorofluorocarbons and hydrochlorofluorocarbons are about the same size as those included ( high confidence). (Figure TS.2) {2.2.1, 2.2.2, Table 2.1, Figures 2.2, 2.3 and 2.5}
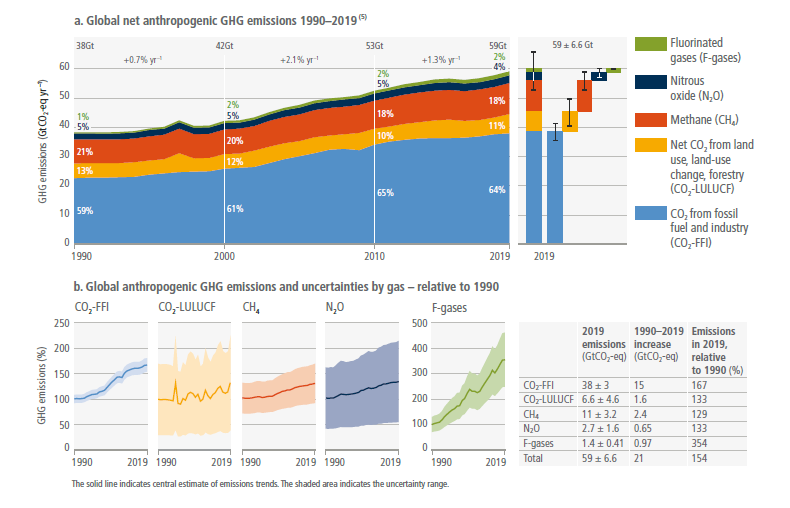
Figure TS.2 | Global net anthropogenic GHG emissions (GtCO2-eqyr–1) 1990–2019. Global net anthropogenic GHG emissions include CO2 from fossil fuel combustion and industrial processes (CO2-FFI); net CO2 from land use, land-use change and forestry (CO2-LULUCF)5; methane (CH4); nitrous oxide (N2O); and fluorinated gases (HFCs, PFCs, SF6, NF3). 6Panel a shows aggregate annual global net anthropogenic GHG emissions by groups of gases from 1990 to 2019 reported in GtCO2-eq converted based on global warming potentials with a 100-year time horizon (GWP100-AR6) from the IPCC Sixth Assessment Report Working Group I (Chapter 7). The fraction of global emissions for each gas is shown for 1990, 2000, 2010 and 2019; as well as the aggregate average annual growth rate between these decades. At the right side of Panel a, GHG emissions in 2019 are broken down into individual components with the associated uncertainties (90% confidence interval) indicated by the error bars: CO2-FFI ±8%; CO2-LULUCF ±70%; CH4±30%; N2O ±60%; F-gases ±30%; GHG ±11%. Uncertainties in GHG emissions are assessed in Supplementary Material 2.2. The single-year peak of emissions in 1997 was due to higher CO2-LULUCF emissions from a forest and peat fire event in South East Asia. Panel b shows global anthropogenic CO2-FFI, net CO2-LULUCF, CH4, N2O and F-gas emissions individually for the period 1990–2019, normalised relative to 100 in 1990. Note the different scale for the included F-gas emissions compared to other gases, highlighting its rapid growth from a low base. Shaded areas indicate the uncertainty range. Uncertainty ranges as shown here are specific for individual groups of greenhouse gases and cannot be compared. The table shows the central estimate for: absolute emissions in 2019; the absolute change in emissions between 1990 and 2019; and emissions in 2019 expressed as a percentage of 1990 emissions. {2.2, Figure 2.5, Supplementary Material 2.2, Figure TS.2}
Globally, gross domestic product (GDP) per capita and population growth remained the strongest drivers of CO2 emissions from fossil fuel combustion in the last decade (high confidence). Trends since 1990 continued in the years 2010 to 2019 with GDP per capita and population growth increasing emissions by 2.3% yr –1 and 1.2% yr –1, respectively. This growth outpaced the reduction in the use of energy per unit of GDP (–2% yr –1, globally) as well as improvements in the carbon intensity of energy (–0.3% yr –1). {2.4.1, Figure 2.19}
Box TS.1 | The COVID-19 Pandemic: Impact on Emissions and Opportunities for Mitigation
The COVID-19 pandemic triggered the deepest global economic contraction as well as CO2 emission reductions since the Second World War {2.2.2}. While emissions and most economies rebounded in 2020, some impacts of the pandemic could last well beyond this. Owing to the very recent nature of this event, it remains unclear what the exact short- and long-term impacts on global emissions drivers, trends, macroeconomics and finance will be.
Starting in the spring of 2020 a major break in global emissions trends was observed due to lockdown policies implemented in response to the pandemic. Overall, global CO2-FFI emissions are estimated to have declined by 5.8% (5.1–6.3%) in 2020, or about 2.2 (1.9–2.4%) GtCO2 in total. This exceeds any previous global emissions decline since 1970 both in relative and absolute terms (Box TS.1, Figure 1). During periods of economic lockdown, daily emissions, estimated based on activity and power-generation data, declined substantially compared to 2019, particularly in April 2020 – as shown in Box TS.1, Figure 1 – but rebounded by the end of 2020. Impacts were differentiated by sector, with road transport and aviation particularly affected. Different databases estimate the total power-sector CO2 reduction from 2019 to 2020 at 3% (IEA7 ) and 4.5% (EDGAR8 ). Approaches that predict near real-time estimates of the power-sector reduction are more uncertain and estimates range more widely between 1.8%, 4.1% and 6.8%, the latter taking into account the over-proportional reduction of coal generation due to low gas prices and merit order effects.

Box TS.1, Figure1 | Global carbon emissions in 2020 and the impact of COVID-19. Panel (a) depicts carbon emissions from fossil fuel and industry over the past five decades. The single-year declines in emissions following major economic and geopolitical events are shown, as well as the decline recorded in five different datasets for emissions in 2020 compared to 2019. Panel (b) depicts the perturbation of daily carbon emissions in 2020 compared to 2019, showing the impact of COVID-19 lockdown policies. {Figure 2.6}
The lockdowns implemented in many countries accelerated some specific trends, such as the uptake in urban cycling. The acceptability of collective social change over a longer term towards less resource-intensive lifestyles, however, depends on the social mandate for change. This mandate can be built through public participation, discussion and debate, to produce recommendations that inform policymaking. {Box 5.2}
Most countries were forced to undertake unprecedented levels of short-term public expenditures in 2021. This is expected to slow economic growth and may squeeze financial resources for mitigation and relevant investments in the near future. Pandemic responses have increased sovereign debt across countries in all income bands and the sharp increase in most developing economies and regions has caused debt distress, widening the gap in developing countries’ access to capital. {15.6.3}
The wider overall reduction in energy investment has prompted a relative shift towards low-carbon investment particularly for major future investment decisions by the private sector {15.2.1, 15.3.1, 15.6.1}. Some countries and regions have prioritised green stimulus expenditures, for example, as part of a ‘Green New Deal’ {Box 13.1}. This is motivated by assessments that investing in new growth industries can boost the macroeconomic effectiveness (‘multipliers’) of public spending, crowd-in and revive private investment, whilst also delivering on mitigation commitments. {15.2.3}
The impacts of COVID-19 may have temporarily set back development and the delivery of many SDGs. It also distracts political and financial capacity away from efforts to accelerate climate change mitigation and shift development pathways to increased sustainability. Yet, studies of previous post-shock periods suggest that waves of innovation that are ready to emerge can be accelerated by crises, which may prompt new behaviours, weaken incumbent systems, and initiate rapid reform. {1.6.5}
Institutional change can be slow but major economic dislocation can create significant opportunities for new ways of financing and enabling ‘leapfrogging’ investment {10.8}. Given the unambiguous risks of climate change, and consequent stranded asset risks from new fossil fuel investments {Box 6.11}, the most robust recoveries may well be those which align with lower carbon and resilient development pathways.
Cumulative net CO2 emissions over the last decade (2010–2019) are about the same size as the remaining carbon budget to limit warming to 1.5°C (>67%) (medium confidence). 62% of total cumulative CO2 emissions from 1850 to 2019 occurred since 1970 (1500 ± 140 GtCO2), about 43% since 1990 (1000 ± 90 GtCO2), and about 17% since 2010 (410 ± 30 GtCO2). For comparison, the remaining carbon budget for keeping warming to 1.5°C with a 67% (50%) probability is about 400 (500) ± 220 GtCO2 (Figure TS.3). {2.2.2, Figure 2.7, AR6 WGI Chapter 5.5, AR6 WGI Chapter 5, Table 5.8}
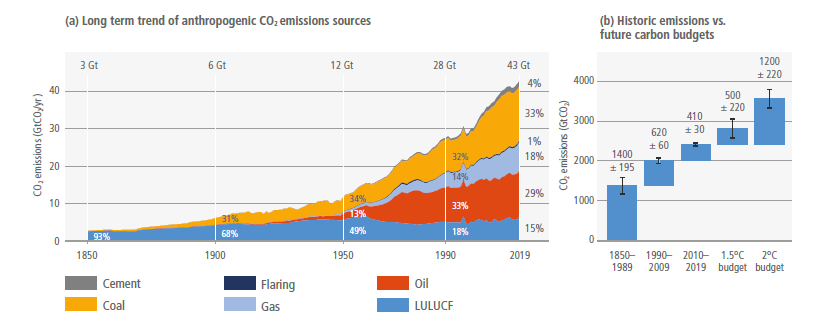
Figure TS. 3 | Historic anthropogenic CO2emission and cumulative CO2 emissions (1850–2019) as well as remaining carbon budgets for limiting warming to 1.5°C (>67%) and 2°C (>67%). Panel (a) shows historic annual anthropogenic CO2 emissions (GtCO2 yr –1) by fuel type and process. Panel (b) shows historic cumulative anthropogenic CO2 emissions for the periods 1850–1989, 1990–2009, and 2010–2019 as well as remaining future carbon budgets as of 1 January 2020 to limit warming to 1.5°C and 2°C at the 67th percentile of the transient climate response to cumulative CO2 emissions. The whiskers indicate a budget uncertainty of ±220 GtCO2-eq for each budget and the aggregate uncertainty range at one standard deviation for historical cumulative CO2 emissions, consistent with WGI. {Figure 2.7}
A growing number of countries have achieved GHG emission reductions over periods longer than 10 years – a few at rates that are broadly consistent with the global rates described in climate change mitigation scenarios that limit warming to 2°C (>67%) (high confidence). At least 18 countries have reduced CO2 and GHG emissions for longer than 10 years. Reduction rates in a few countries have reached 4% in some years, in line with global rates observed in pathways that limit warming to 2°C (>67%). However, the total reduction in annual GHG emissions of these countries is small (about 3.2 GtCO2-eq yr –1) compared to global emissions growth observed over the last decades. Complementary evidence suggests that countries have decoupled territorial CO2 emissions from GDP, but fewer have decoupled consumption-based emissions from GDP. Decoupling has mostly occurred in countries with high per-capita GDP and high per-capita CO2 emissions. (Figure TS.4, Box TS.2) {2.2.3, 2.3.3, Figure 2.11, Tables 2.3 and 2.4}
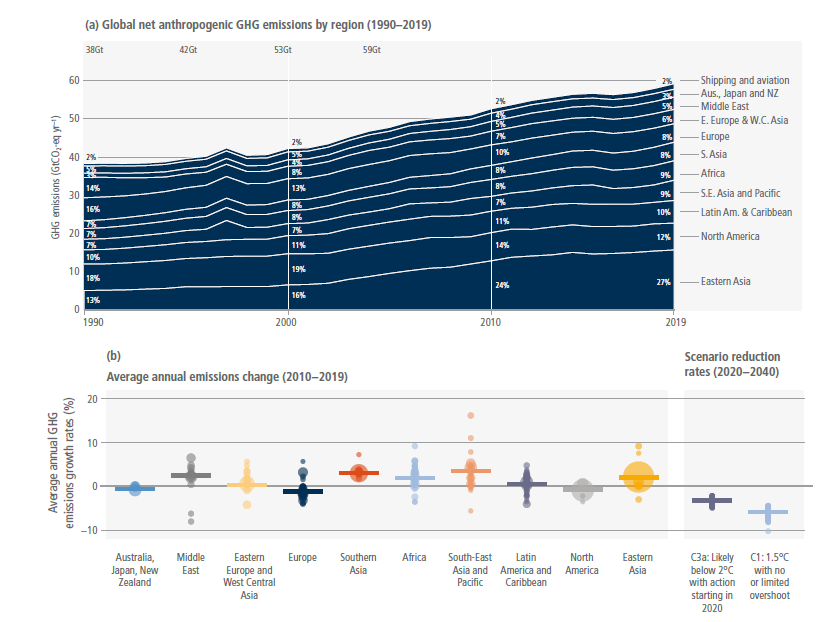
Figure TS.4 | Emissions have grown in most regions, although some countries have achieved sustained emission reductions in line with 2°C scenarios. Emissions have grown in most regions, although some countries have achieved sustained emission reductions in line with 2°C scenarios. Change in regional GHG emissions and rates of change compatible with warming targets. Panel (a): Regional GHG emission trends (in GtCO2-eq yr –1 (GWP100; AR6) for the time period 1990–2019. Panel (b): Historical GHG emissions change by region (2010–2019). Circles depict countries, scaled by total emissions in 2019, short horizontal lines depict the average change by region. Also shown are global rates of reduction over the period 2020–2040 in scenarios assessed in AR6 that limit global warming to 1.5°C and 2°C with different probabilities. The 5–95th percentile range of emissions changes for scenarios below 1.5°C with no or limited overshoot (scenario category C1) and scenarios below 2°C (>67%) with immediate action (scenario category C3a) are shown as a shaded area with a horizontal line at the mean value. Panel b excludes CO2LULUCF due to a lack of consistent historical national data, and International Shipping and Aviation, which cannot be allocated to regions. Global rates of reduction in scenarios are shown for illustrative purposes only and do not suggest rates of reduction at the regional or national level. {Figures 2.9 and 2.11}
Box TS.2 | Greenhouse Gas (GHG) Emission Metrics Provide Simplified Information About the Effects of Different Greenhouse Gases
Comprehensive mitigation policy relies on consideration of all anthropogenic forcing agents, which differ widely in their atmospheric lifetimes and impacts on the climate system. GHG emission metrics provide simplified information about the effect that emissions of different gases have on global temperature or other aspects of climate, usually expressed relative to the effect of emitting CO2. 9 This information can support choices about priorities, trade-offs and synergies in mitigation policies and emission targets for non-CO2 gases relative to CO2 as well as baskets of gases expressed in CO2-eq.
The choice of metric can affect the timing and emphasis placed on reducing emissions of short-lived climate forcers (SLCFs) relative to CO2 within multi-gas abatement strategies as well as the costs of such strategies. Different metric choices can also alter the time at which net zero GHG emissions are calculated to be reached for any given emissions scenario. A wide range of GHG emission metrics has been published in the scientific literature, which differ in terms of: (i) the key measure of climate change they consider, (ii) whether they consider climate outcomes for a specified point in time or integrated over a specified time horizon, (iii) the time horizon over which the metric is applied, (iv) whether they apply to a single emission pulse, to emissions sustained over a period of time, or to a combination of both, and (v) whether they consider the climate effect from an emission compared to the absence of that emission, or compared to a reference emissions level or climate state. {Annex II}
Parties to the Paris Agreement decided to report aggregated emissions and removals (expressed as CO2-eq) based on the Global Warming Potential (GWP) with a time horizon of 100 years (GWP100) using values from IPCC AR5 or from a subsequent IPCC report as agreed upon by the CMA, 10 and to account for future Nationally Determined Contributions (NDCs) in accordance with this approach. Parties may also report supplemental information on aggregate emissions and removals, expressed as CO2-eq, using other GHG emission metrics assessed by the IPCC.
The WGIII contribution to AR6 uses updated GWP100 values from AR6 WGI to report aggregate emissions and removals unless stated otherwise. These reflect updated scientific understanding of the response of the climate system to emissions of different gases and include a methodological update to incorporate climate-carbon cycle feedbacks associated with the emission of non-CO2 gases (see Annex II.II.8 for a list of GWP100 metric values). The choice of GWP100 was made inter alia for consistency with decisions under the Rulebook for the Paris Agreement and because it is the dominant metric used in the literature assessed by WGIII. Furthermore, for mitigation pathways that limit global warming to 2°C (>67%) or lower, using GWP100 to inform cost-effective abatement choices between gases would achieve such long-term temperature goals at close to least global cost within a few percent ( high confidence).
However, GWP100 is not well-suited to estimate the cumulative effect on climate from sustained SLCF emissions and the resulting warming at specific points in time. This is because the warming caused by an individual SLCF emission pulse is not permanent, and hence, unlike CO2, the warming from successive SLCF emission pulses over multiple decades or centuries depends mostly on their ongoing rate of emissions rather than cumulative emissions. Recently developed step/pulse metrics such as the CGTP (combined global temperature change potential) and GWP* (referred to as GWP-star and indicated by an asterisk) recognise that a sustained increase/decrease in the rate of SLCF emissions has indeed a similar effect on global surface temperature as one-off emission/removal of CO2. These metrics use this relationship to calculate the CO2 emissions or removals that would result in roughly the same temperature change as a sustained change in the rate of SLCF emissions (CGTP) over a given time period, or as a varying time series of CH4 emissions (GWP*). IFrom a mitigation perspective, this makes these metrics well-suited in principle to estimate the effect on the remaining carbon budget from more, or less, ambitious SLCF mitigation over multiple decades compared to a given reference scenario ( high confidence). However, potential application in wider climate policy (e.g., to inform equitable and ambitious emission targets or to support sector-specific mitigation policies) is contested and relevant literature still limited.
All metrics have limitations and uncertainties, given that they simplify the complexity of the physical climate system and its response to past and future GHG emissions. For this reason, the WGIII contribution to the AR6 reports emissions and mitigation options for individual gases where possible; CO2-equivalent emissions are reported in addition to individual gas emissions where this is judged to be policy-relevant. This approach aims to reduce the ambiguity regarding actual climate outcomes over time arising from the use of any specific GHG emission metric. {Cross-Chapter Box 2 in Chapter 2, SM.2.3, Annex II.II.8; AR6 WGI Chapter 7.6}
Consumption-based CO2 emissions in Developed Countries and the Asia and Pacific region are higher than in other regions (high confidence). In Developed Countries, consumption-based CO2 emissions peaked at 15 GtCO2 in 2007, declining to about 13 GtCO2 in 2018. The Asia and Developing Pacific region, with 52% of the current global population, has become a major contributor to consumption-based CO2 emission growth since 2000 (5.5% yr –1 for 2000–2018); in 2015 it exceeded the Developed Countries region, with 16% of global population, as the largest emitter of consumption-based CO2. {2.3.2, Figure 2.14}
Carbon-intensity improvements in the production of traded products has led to a net reduction in CO2 emissions embodied in international trade (high confidence). A decrease in the carbon intensity of traded products has offset increased trade volumes between 2006 and 2016. Emissions embodied in internationally traded products depend on the composition of the global supply chain across sectors and countries and the respective carbon intensity of production processes (emissions per unit of economic output). {2.3, 2.4}
Developed Countries tend to be net CO2emission importers, whereas developing countries tend to be net emission exporters (high confidence). Net CO2 emission transfers from developing to Developed Countries via global supply chains have decreased between 2006 and 2016. Between 2004 and 2011, CO2 emissions embodied in trade between developing countries have more than doubled (from 0.47 to 1.1 Gt) with the centre of trade activities shifting from Europe to Asia. {2.3.4, Figure 2.15}
Territorial emissions from developing country regions continue to grow, mostly driven by increased consumption and investment, albeit starting from a low base of per-capita emissions and with a lower historic contribution to cumulative emissions than developed countries (high confidence). Average 2019 per-capita CO2-FFI emissions in three developing regions, Africa (1.2 tCO2), Asia and Pacific (4.4 tCO2), and Latin America and Caribbean (2.7 tCO2), remained less than half of Developed Countries’ 2019 CO2-FFI emissions (9.5 tCO2). In these three developing regions together, CO2-FFI emissions grew by 26% between 2010 and 2019 (compared to 260% between 1990 and 2010). In contrast, in Developed Countries emissions contracted by 9.9% between 2010 and 2019 and by 9.6% between 1990 and 2010. Historically, these three developing regions together contributed 28% to cumulative CO2-FFI emissions between 1850 and 2019, whereas Developed Countries contributed 57%, and least developed countries contributed 0.4%. (Figure TS.5) {2.2, Figures 2.9 and 2.10}
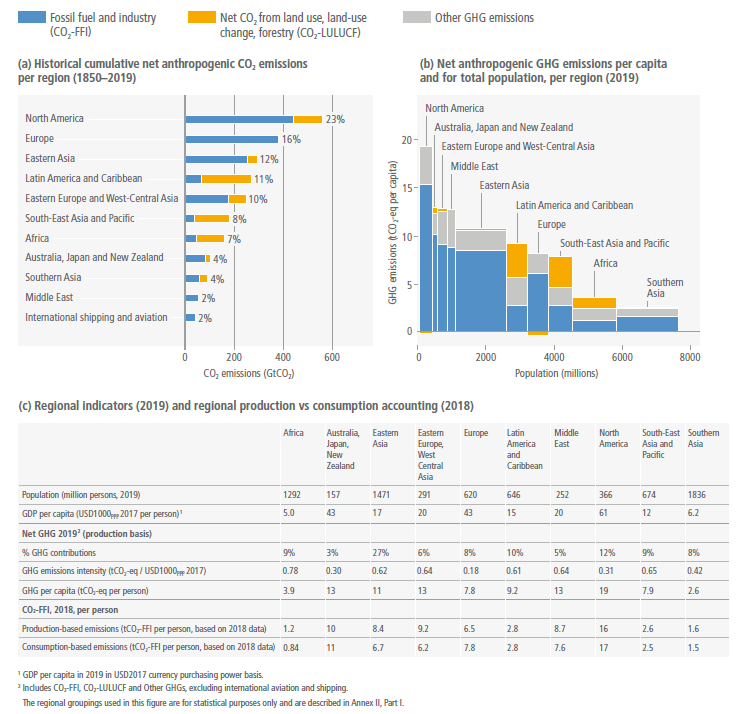
Figure TS.5 | Global emissions are distributed unevenly, both in the present day and cumulatively since 1850. Panel (a) shows the distribution of regional GHG emissions in tonnes CO2-eq per capita by region in 2019. GHG emissions are categorised into: CO2 fossil fuel and industry (CO2-FFI); CO2 land use, land-use change and forestry (CO2-LULUCF); and other GHG emissions (CH4, nitrous oxide, F-gas, expressed in CO2-eq using GWP100). The height of each rectangle shows per-capita emissions, the width shows the population of the region, so that the area of the rectangles refers to the total emissions for each regional. Percentages refer to overall GHG contributions to total global emissions in 2019. Emissions from international aviation and shipping are not included. Panel (b) shows the share of historical net CO2 emissions per region from 1850 to 2019. This includes CO2-FFI and CO2-LULUCF (GtCO2). Other GHG emissions are not included. Emissions from international aviation and shipping are included. Panel (c) shows population, GDP per person, emission indicators by region in 2019 for percentage GHG contributions, total GHG per person, and total GHG emissions intensity, together with production-based and consumption-based CO2-FFI data, which is assessed in this report up to 2018. Consumption-based emissions are emissions released to the atmosphere in order to generate the goods and services consumed by a certain entity (e.g., region). Emissions from international aviation and shipping are not included. {1.3, Figure 1.2a, 2.2, Figure 2.10}
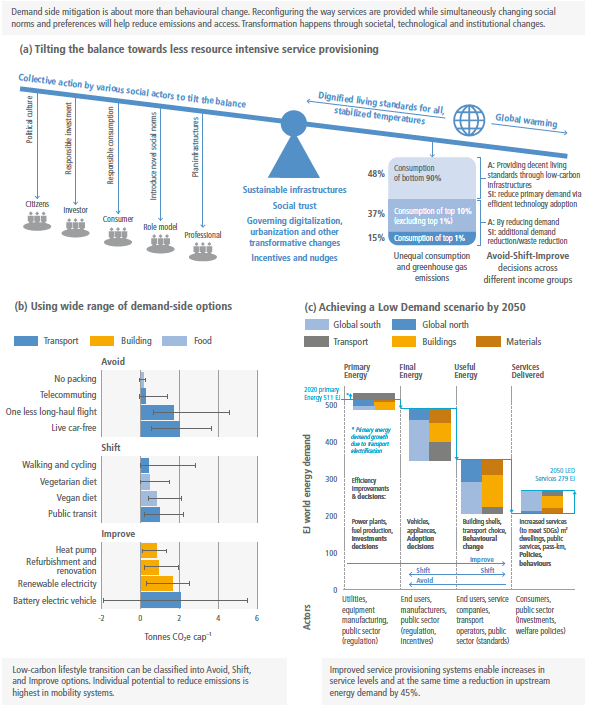
Globally, households with income in the top 10% contribute about 36–45% of global GHG emissions (robust evidence, medium agreement). About two thirds of the top 10% live in Developed Countries and one third in other economies. The lifestyle consumption emissions of the middle income and poorest citizens in emerging economies are between five and 50 times below their counterparts in high-income countries (medium confidence). Increasing inequality within a country can exacerbate dilemmas of redistribution and social cohesion, and affect the willingness of the rich and poor to accept policies to protect the environment, and to accept and afford lifestyle changes that favour mitigation (medium confidence). {2.6.1, 2.6.2, Figure 2.29}
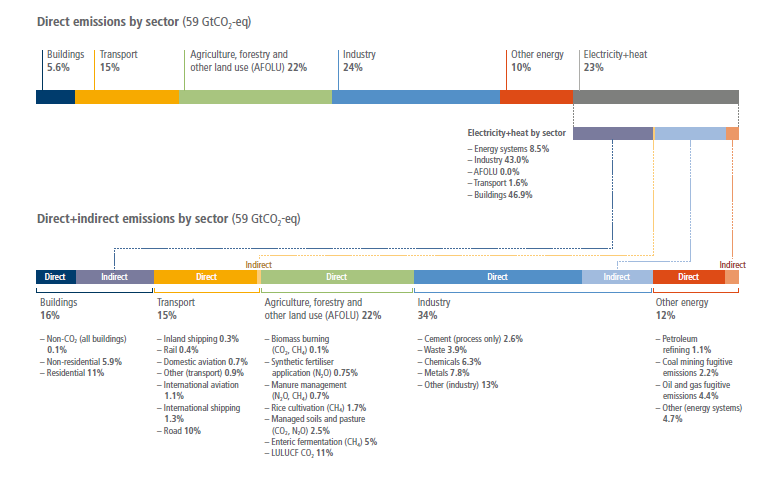
Globally, GHG emissions continued to rise across all sectors and subsectors, and most rapidly in transport and industry (high confidence). In 2019, 34% (20 GtCO2-eq) of global GHG emissions came from the energy sector, 24% (14 GtCO2-eq) from industry, 22% (13 GtCO2-eq) from agriculture, forestry and other land use (AFOLU), 15% (8.7 GtCO2-eq) from transport, and 5.6% (3.3 GtCO2-eq) from buildings. Once indirect emissions from energy use are considered, the relative shares of industry and buildings emissions rise to 34% and 16%, respectively. Average annual GHG emissions growth during 2010–2019 slowed compared to the previous decade in energy supply (from 2.3% to 1.0%) and industry (from 3.4% to 1.4%, direct emissions only), but remained roughly constant at about 2% yr –1 in the transport sector ( high confidence). Emission growth in AFOLU is more uncertain due to the high share of CO2-LULUCF emissions (medium confidence). (Figure TS.8) {2.2.4, Figure 2.13 and Figures 2.16–2.21}
There is a discrepancy, equating to 5.5 GtCO2yr–1, between alternative methods of accounting for anthropogenic land CO2fluxes. Accounting for this discrepancy would assist in assessing collective progress in a global stocktake (high confidence). The principal accounting approaches are national GHG inventories (NGHGI) and global modelling 11 approaches. NGHGI, based on IPCC guidelines, consider a much larger area of forest to be under human management than global models. NGHGI consider the fluxes due to human-induced environmental change on this area to be anthropogenic and are thus reported. Global models, in contrast, consider these fluxes to be natural and are excluded from the total reported anthropogenic land CO2 flux. The accounting method used will affect the assessment of collective progress in a global stocktake (medium confidence) {Cross-Chapter Box 6 in Chapter 7}. In the absence of these adjustments, allowing a like-with-like comparison, collective progress would appear better than it is. {7.2}
This accounting discrepancy also applies to Integrated Assessment Models (IAMs), with the consequence that anthropogenic land CO2fluxes reported in IAM pathways cannot be compared directly with those reported in national GHG inventories (high confidence). Methodologies enabling a more like-for-like comparison between models’ and countries’ approaches would support more accurate assessment of the collective progress achieved under the Paris Agreement. {3.4, 7.2.2}
Average annual growth in GHG emissions from energy supply decreased from 2.3% for 2000–2009 to 1.0% for 2010–2019 (high confidence). This slowing of growth is attributable to further improvements in energy efficiency and reductions in the carbon intensity of energy supply driven by fuel switching from coal to gas, reduced expansion of coal capacity, particularly in Eastern Asia, and the increased use of renewables (medium confidence). (Figure TS.6) {2.2.4, 2.4.2.1, Figure 2.17}
The industry, buildings and transport sectors make up 44% of global GHG emissions, or 66% when the emissions from electricity and heat production are reallocated asindirect emissions (high confidence). This reallocation makes a substantial difference to overall industry and buildings emissions as shown in Figure TS.6. Industry, buildings, and transport emissions are driven, respectively, by the large rise in demand for basic materials and manufactured products, a global trend of increasing floor space per capita, building energy service use, travel distances, and vehicle size and weight. Between 2010 and 2019, aviation grew particularly fast on average at about 3.3% per annum. Globally, energy efficiency has improved in all three demand sectors, but carbon intensities have not. (Figure TS.6) {2.2.4, Figures 2.18, 2.19 and 2.20}

Figure TS.6 | Total anthropogenic direct and indirect GHG emissions for the year 2019 (in GtCO2-eq) by sector and subsector. Direct emissions estimates assign emissions to the sector in which they arise (scope 1 reporting). Indirect emissions – as used here – refer to the reallocation of emissions from electricity and heat to the sector of final use (scope 2 reporting). Note that cement refers to process emissions only, as a lack of data prevents the full reallocation of indirect emissions to this sector. More comprehensive conceptualisations of indirect emissions including all products and services (scope 3 reporting) are discussed in Section 2.3. Emissions are converted into CO2-equivalents based on global warming potentials with a 100-year time horizon (GWP100) from the IPCC Sixth Assessment Report. Percentages may not add up to 100 across categories due to rounding at the second significant digit. {Figure 2.12, 2.3}
Providing access to modern energy services universally would increase global GHG emissions by a few percent at most (high confidence). The additional energy demand needed to support decent living standards12 for all is estimated to be well below current average energy consumption (medium evidence, high agreement ). More equitable income distribution could also reduce carbon emissions, but the nature of this relationship can vary by level of income and development (limited evidence, medium agreement ). {2.4.3}
Evidence of rapid energy transitions exists in some case studies (medium confidence). Emerging evidence since AR5 on past energy transitions identifies a growing number of cases of accelerated technology diffusion at sub-global scales and describes mechanisms by which future energy transitions may occur more quickly than those in the past. Important drivers include technology transfer and cooperation, international policy and financial support, and harnessing synergies among technologies within a sustainable energy system perspective (medium confidence). A fast global low-carbon energy transition enabled by finance to facilitate low-carbon technology adoption in developing and particularly in least developed countries can facilitate achieving climate stabilisation targets ( high confidence). {2.5.2, Table 2.5}
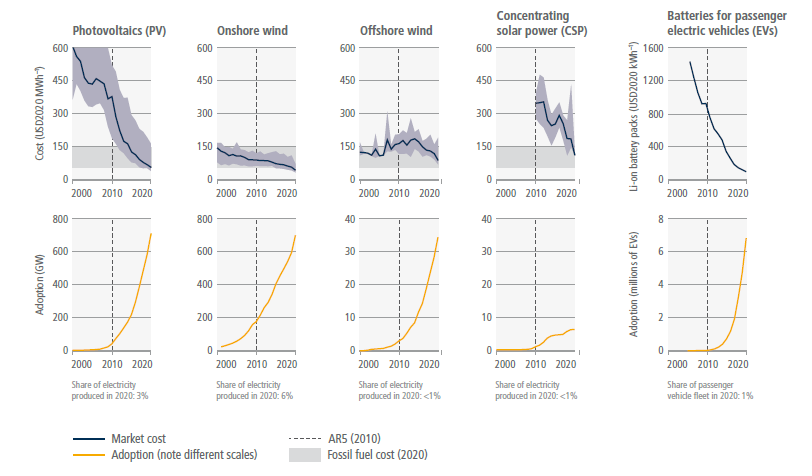
Multiple low-carbon technologies have shown rapid progress since AR5 – in cost, performance, and adoption – enhancing the feasibility of rapid energy transitions (high confidence). The rapid deployment and unit cost decrease of modular technologies like solar, wind, and batteries have occurred much faster than anticipated by experts and modelled in previous mitigation scenarios, as shown in Figure TS.7 ( high confidence). The political, economic, social, and technical feasibility of solar energy, wind energy and electricity storage technologies has improved dramatically over the past few years. In contrast, the adoption of nuclear energy and CO2 capture and storage (CCS) in the electricity sector has been slower than the growth rates anticipated in stabilisation scenarios. Emerging evidence since AR5 indicates that small-scale technologies (e.g., solar, batteries) tend to improve faster and be adopted more quickly than large-scale technologies (nuclear, CCS) (medium confidence). (Figure TS.7, Box TS.15) {2.5.3, 2.5.4, Figures 2.22 and 2.23}

Figure TS.7 | The unit costs of batteries and some forms of renewable energy have fallen significantly, and their adoption continues to increase. The top panel shows global costs per unit of energy (USD per MWh) for some rapidly changing mitigation technologies. Solid blue lines indicate average unit cost in each year. Light blue shaded areas show the range between the 5th and 95th percentiles in each year. Grey shading indicates the range of unit costs for new fossil fuel (coal and gas) power in 2020 (corresponding to USD55–148 per MWh). In 2020, the levelised costs of energy (LCOE) of the four renewable energy technologies could compete with fossil fuels in many places. For batteries, costs shown are for 1 kWh of battery storage capacity; for the others, costs are LCOE, which includes installation, capital, operations, and maintenance costs per MWh of electricity produced. The literature uses LCOE because it allows consistent comparisons of cost trends across a diverse set of energy technologies to be made. However, it does not include the costs of grid integration or climate impacts. Further, LCOE does not take into account other environmental and social externalities that may modify the overall (monetary and non-monetary) costs of technologies and alter their deployment. The bottom panel shows cumulative global adoption for each technology, in GW of installed capacity for renewable energy and in millions of vehicles for battery-electric vehicles. A vertical dashed line is placed in 2010 to indicate the change since AR5. Shares of electricity produced and share of passenger vehicle fleet are indicated in text for 2020 based on provisional data, i.e., percentage of total electricity production (for PV, onshore wind, offshore wind, CSP) and of total stock of passenger vehicles (for EVs). The electricity production share reflects different capacity factors; for example, for the same amount of installed capacity, wind produces about twice as much electricity as solar PV. {2.5, 6.4} Renewable energy and battery technologies were selected as illustrative examples because they have recently shown rapid changes in costs and adoption, and because consistent data are available. Other mitigation options assessed in the report are not included as they do not meet these criteria.
Robust incentives for investment in innovation, especially incentives reinforced by national policy and international agreements, are central to accelerating low-carbon technological change (robust evidence, medium agreement). Policies have driven innovation, including instruments for technology push (e.g., scientific training, research and development (R&D)) and demand pull (e.g., carbon pricing, adoption subsidies), as well as those promoting knowledge flows and especially technology transfer. The magnitude of the scale-up challenge elevates the importance of rapid technology development and adoption. This includes ensuring participation of developing countries in an enhanced global flow of knowledge, skills, experience, equipment, and technology; which in turn requires strong financial, institutional, and capacity-building support. {16.4, 16.5}
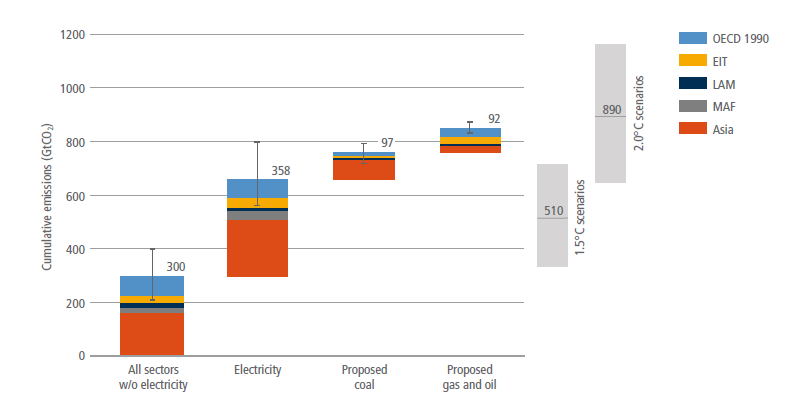
Estimates of future CO2 emissions from existing fossil fuel infrastructures already exceed remaining cumulative net CO2 emissions in pathways limiting warming to 1.5°C (>50%) with no or limited overshoot (high confidence). Assuming variations in historic patterns of use and decommissioning, estimated future CO2 emissions from existing fossil fuel infrastructure alone are 660 (460–890) GtCO2 and from existing and currently planned infrastructure 850 (600–1100) GtCO2. This compares to overall cumulative net CO2 emissions until reaching net zero CO2 of 510 (330–710) GtCO2 in pathways that limit warming to 1.5°C (>50%) with no or limited overshoot, and 890 (640–1160) GtCO2 in pathways that limit warming to 2°C (>67%) ( high confidence). While most future CO2 emissions from existing and currently planned fossil fuel infrastructure are situated in the power sector, most remaining fossil fuel CO2 emissions in pathways that limit warming to 2°C (>67%) and below are from non-electric energy – most importantly from the industry and transportation sectors ( high confidence). Decommissioning and reduced utilisation of existing fossil fuel installations in the power sector as well as cancellation of new installations are required to align future CO2 emissions from the power sector with projections in these pathways ( high confidence). (Figure TS.8) {2.7.2, 2.7.3, Figure 2.26, Tables 2.6 and 2.7}

Figure TS.8 | Future CO2 emissions from existing and currently planned fossil fuel infrastructure in the context of the Paris Agreement carbon budgets in GtCO2based on historic patterns of infrastructure lifetimes and Future CO2 emissions estimates of existing infrastructure for the electricity sector as well as all other sectors (industry, transport, buildings, other fossil fuel infrastructures) and of proposed infrastructures for coal power as well as gas and oil power. Grey bars on the right depict the range (5–95th percentile) in overall cumulative net CO2 emissions until reaching net zero CO2 in pathways that limit warming to 1.5°C (>50%) with no or limited overshoot (1.5°C scenarios), and in pathways that limit warming to 2°C (>67%) (2°C scenarios). {Figure 2.26}
TS.4 Mitigation and Development Pathways
While previous WGIII assessments have explored mitigation pathways, since AR5 there has been an increasing emphasis in the literature on development pathways, and in particular at the national scale. Chapter 4 assesses near-term (2019–2030) to mid-term (2030–2050) pathways, complementing Chapter 3 which focuses on long-term pathways (up to 2100). While there is considerable literature on country-level mitigation pathways, including but not limited to NDCs, the country distribution of this literature is very unequal ( high confidence). {4.2.1, Cross-Chapter Box 4 in Chapter 4}
TS.4.1 Mitigation and Development Pathways in the Near- to Mid-term
An emissions gap persists, exacerbated by an implementation gap, despite mitigation efforts including those in Nationally Determined Contributions (NDCs). In this report the emissions gap is understood as the difference between projected global emissions with Nationally Determined Contributions (NDCs) in 2030, and emissions in 2030 if mitigation pathways consistent with the Paris temperature goals were achieved. The term implementation gap refers to the gap between NDC mitigation pledges and the expected outcome of existing policies.
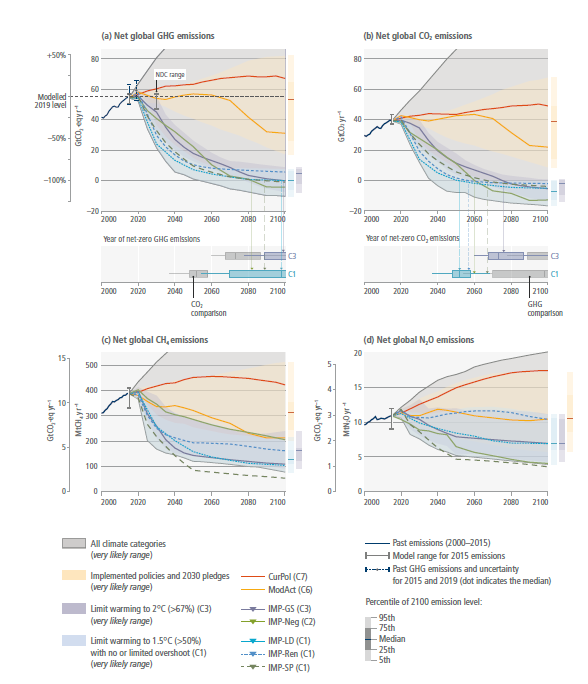
Pathways consistent with the implementation and extrapolation of countries’ current 13 policies see GHG emissions reaching 57 (52–60) GtCO2-eq yr–1by 2030 and to 46–67 GtCO2-eq yr–1by 2050, leading to a median global warming of 2.4°C to 3.5°C by 2100 (medium confidence). NDCs with unconditional and conditional elements 14 lead to 53 (50–57) and 50 (47–55) GtCO2-eq, respectively (medium confidence) {Table 4.1}. This leaves median estimated emissions gaps of 14–23 GtCO2-eq to limit warming to 2°C and 25–34 GtCO2-eq to limit warming to 1.5°C relative to mitigation pathways. (Figure TS.9) {Cross-Chapter Box 4, Figure 1 in Chapter 4}
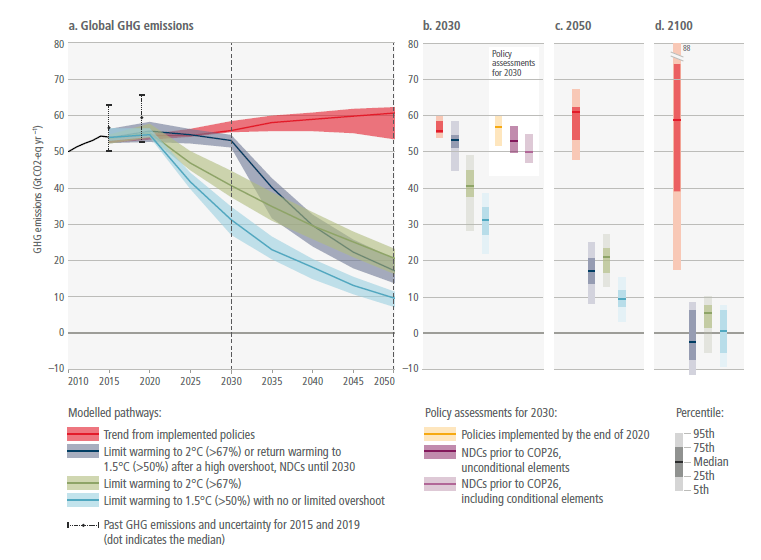
Figure TS.9 | Aggregate greenhouse gas (GHG) emissions of global mitigation pathways (coloured funnels and bars) and projected emission outcomes from current policies and emissions implied by unconditional and conditional elements of NDCs, based on updates available by 11 October 2021 (grey bars). Shaded areas show GHG emission medians and 25–75th percentiles over 2020–2050 for four types of pathways in the AR6 scenario database: (i) pathways with near-term emissions developments in line with current policies and extended with comparable ambition levels beyond 2030; (ii) pathways likely to limit warming to 2°C with near-term emissions developments reflecting 2030 emissions implied by current NDCs followed by accelerated emissions reductions; (iii) pathways likely to limit warming to 2°C based on immediate actions from 2020 onwards; (iv) pathways that limit warming to 1.5°C with no or limited overshoot. Right-hand panels show two snapshots of the 2030 and 2050 emission ranges of the pathways in detail (median, 25–75th and 5–95th percentiles). The 2030 snapshot includes the projected emissions from the implementation of the NDCs as assessed in Section 4.2 (Table 4.1; median and full range). Historic GHG emissions trends as used in model studies are shown for 2010–2015. GHG emissions are in CO2-equivalent using GWP100 values from AR6. {3.5, Table 4.1, Cross-Chapter Box 4 in Chapter 4}
Projected global emissions from aggregated NDCs place limiting global warming to 1.5°C beyond reach and make it harder after 2030 to limit warming to 2°C (high confidence). Pathways following NDCs until 2030 show a smaller reduction in fossil fuel use, slower deployment of low-carbon alternatives, and a smaller reduction in CO2, CH4 and overall GHG emissions in 2030 compared to immediate action scenarios. This is followed by a much faster reduction of emissions and fossil fuels after 2030, and a larger increase in the deployment of low-carbon alternatives during the medium term in order to get close to the levels of the immediate action pathways in 2050. Those pathways also deploy a larger amount of carbon dioxide removal (CDR) to compensate for higher emissions before 2030. The faster transition during 2030 to 2050 entails greater investment in fossil fuel infrastructure and lower deployment of low-carbon alternatives in 2030, which adds to the socio-economic challenges in realising the higher transition rates. (TS.4.2) {3.5}
Studies evaluating up to 105 updated NDCs15 indicate that emissions in NDCs with conditional elements have been reduced by 4.5 (2.7–6.3) GtCO2-eq. This closes the emission gaps by about one third to 2°C and about 20% to 1.5°C compared to the original NDCs submitted in 2015/16 (medium confidence) {4.2.2, Cross-Chapter Box 4 in Chapter 4}. An implementation gap also exists between the projected emissions with ‘current policies’ and the projected emissions resulting from the implementation of the unconditional and conditional elements of NDCs; this is estimated to be around 4 and 7 GtCO2-eq in 2030, respectively (medium confidence) {4.2.2}. Many countries would therefore require additional policies and associated action on climate change to meet their autonomously determined mitigation targets as specified under the first NDCs (limited evidence). The disruptions triggered by the COVID-19 pandemic increase uncertainty over the range of projections relative to pre-COVID-19 literature. As indicated by a growing number of studies at the national and global level, how large near- to mid-term emissions implications of the COVID-19 pandemic are, to a large degree depends on how stimulus or recovery packages are designed. {4.2}
There is a need to explore how accelerated mitigation – relative to NDCs and current policies – could close both emission gaps and implementation gaps. There is increasing understanding of the technical content of accelerated mitigation pathways, differentiated by national circumstances, with considerable, though uneven, literature at country-level (medium evidence, high agreement ). Transformative technological and institutional changes for the near term include demand reductions through efficiency and reduced activity, rapid decarbonisation of the electricity sector and low-carbon electrification of buildings, industry and transport (robust evidence, medium agreement ). A focus on energy use and supply is essential, but not sufficient on its own – the land sector and food systems deserve attention. The literature does not adequately include demand-side options and systems analysis, and captures the impact from non-CO2GHGs (medium confidence). {4.2.5}
If obstacles to accelerated mitigation are rooted in underlying structural features of society, then transforming such structures can support emission reductions {4.2.6}. Countries and regions will have different starting points for transition pathways. Some critical differences between countries include climate conditions resulting in different heating and cooling needs, endowments with different energy resources, patterns of spatial development, and political and economic conditions {4.2.5}. The way countries develop determines their capacity to accelerate mitigation and achieve other sustainable development objectives simultaneously (medium confidence){4.3.1, 4.3.2}. Yet meeting ambitious mitigation and development goals cannot be achieved through incremental change (robust evidence, medium agreement ). Though development pathways result from the actions of a wide range of actors, it is possible to shift development pathways through policies and enhancing enabling conditions (limited evidence, medium agreement ).
Shifting development pathways towards sustainabilityoffers ways to broaden the range of levers and enablers that a society can use to accelerate mitigation and increases the likelihood of making progress simultaneously on climate action and other development goals (Box TS.3) {Cross-Chapter Box 5 in Chapter 4, Figure 4.7, 4.3}. There are practical options to shift development pathways in ways that advance mitigation and other sustainable development objectives, support political feasibility, increase resources to meet multiple goals, and reduce emissions (limited evidence, high agreement ). Concrete examples, assessed in Chapter 4 of this report, include high-employment and low-emissions structural change; fiscal reforms for mitigation and social contract, combining housing policies to deliver both housing and transport mitigation; and changed economic, social and spatial patterns of agriculture sector development, providing the basis for sustained reductions in emissions from deforestation. {4.4.1, 4.4, 1.10}
Table TS. 2 | Comparison of key characteristics of mitigation pathways with immediate action towards limiting warming to 1.5-2°C vs. pathways following NDCs announced prior to COP26 until 2030. Key characteristics are reported for five groups of mitigation pathways: (i) immediate action to limit warming to 1.5°C (>50%) with no or limited overshoot (C1 in Table TS.3; 97 scenarios), (ii) near term action following the NDCs until 2030 and returning warming to 1.5°C (> 50%) by 2100 after a high overshoot (subset of 42 scenarios following the NDCs until 2030 in C2), (iii) immediate action to limit warming to 2°C (>67%), (C3a in Table TS.3; 204 scenarios), (iv) near term action following the NDCs until 2030 followed by post-2030 action to limit warming to 2°C (>67%) (C3b in Table TS.3; 97 scenarios). Also shown are the characteristics for (v) the combined class of all scenarios that limit warming to 2°C (>67%). The groups (i), (iii), and the combination of (ii) and (iv) are depicted in Figure TS.9. Reported are median and interquartile ranges (in brackets) for selected global indicators. Numbers are rounded to the nearest five, with the exception of cumulative net negative CO2 emissions rounded to the nearest 10. Changes from 2019 are relative to modelled 2019 values. Emissions reductions are based on harmonised model emissions used for the climate assessment. {Section 3.5} {Table 3.6}
Global indicators | 1.5°C (>50%) | 1.5°C (>50%) by 2100 | 2°C (>67%) | ||
Immediate action, with no or limited overshoot | NDCs until 2030, with overshoot before 2100 | Immediate action | NDCs until 2030 | All | |
Cumulative net negative CO2 emissions until 2100 (GtCO2) | 220 (70,430) | 380 (300,470) | 30 (0,130) | 60 (20,210) | 40 (10,180) |
Change in GHG emissions in 2030 (% rel to 2019) | –45 (–50,–40) | –5 (–5,0) | –25 (–35,–20) | –5 (–10,0) | –20 (–30,–10) |
in 2050 (% rel to 2019) | –85 (–90,–80) | –75 (–85,–70) | –65 (–70,–60) | –70 (–70,–60) | –65 (–70,–60) |
Change in CO2 emissions in 2030 (% rel to 2019) | –50 (–60,–40) | –5 (–5,0) | –25 (–35,–20) | –5 (–5,0) | –20 (–30,–5) |
in 2050 (% rel to 2019) | –100 (–105,–95) | –85 (–95,–80) | –70 (–80,–65) | –75 (–80,–65) | –75 (–80,–65) |
Change in net land use CO2 emissions in 2030 (% rel to 2019) | –100 (–105,–95) | –30 (–60,–20) | –90 (–105,–75) | –20 (–80,–20) | –80 (–100,–30) |
in 2050 (% rel to 2019) | –150 (–200,–100) | –135 (–165,–120) | –135 (–185,–100) | –130 (–145,–115) | –135 (–180,–100) |
Change in CH4 emissions in 2030 (% rel to 2019) | –35 (–40,–30) | –5 (–5,0) | –25 (–35,–20) | –10 (–15,–5) | –20 (–25,–10) |
in 2050 (% rel to 2019) | –50 (–60,–45) | –50 (–60,–45) | –45 (–50,–40) | –50 (–65,–45) | –45 (–55,–40) |
Change in primary energy from coal in 2030 (% rel to 2019) | –75 (–80,–65) | –10 (–20,–5) | –50 (–65,–35) | –15 (–20,–10) | –35 (–55,–20) |
in 2050 (% rel to 2019) | –95 (–100,–80) | –90 (–100,–85) | –85 (–100,–65) | –80 (–90,–70) | –85 (–95,–65) |
Change in primary energy from oil in 2030 (% rel to 2019) | –10 (–25,0) | 5 (5,10) | 0 (–10,10) | 10 (5,10) | 5 (0,10) |
in 2050 (% rel to 2019) | –60 (–75,–40) | –50 (–65,–35) | –30 (–45,–15) | –40 (–55,–20) | –30 (–50,–15) |
Change in primary energy from gas in 2030 (% rel to 2019) | –10 (–30,0) | 15 (10,25) | 10 (0,15) | 15 (10,15) | 10 (0,15) |
in 2050 (% rel to 2019) | –45 (–60,–20) | –45 (–55,–30) | –10 (–35,15) | –30 (–45,–5) | –15 (–40,10) |
Change in primary energy from nuclear in 2030 (% rel to 2019) | 40 (10,70) | 10 (0,25) | 35 (5,50) | 10 (0,30) | 25 (0,45) |
in 2050 (% rel to 2019) | 90 (15,295) | 100 (45,130) | 85 (30,200) | 75 (30,120) | 80 (30,140) |
Change in primary energy from modern biomass in 2030 (% rel to 2019) | 75 (55,130) | 45 (20,75) | 60 (35,105) | 45 (20,80) | 55 (35,105) |
in 2050 (% rel to 2019) | 290 (215,430) | 230 (170,420) | 240 (130,355) | 260 (95,435) | 250 (115,405) |
Change in primary energy from non-biomass renewables in 2030 (% rel to 2019) | 225 (155,270) | 100 (85,145) | 150 (115,190) | 115 (85,130) | 130 (90,170) |
in 2050 (% rel to 2019) | 725 (545,950) | 665 (535,925) | 565 (415,765) | 625 (545,700) | 605 (470,735) |
Change in carbon intensity of electricity in 2030 (% rel to 2019) | –75 (–80,–70) | –30 (–40,–30) | –60 (–70,–50) | –35 (–40,–30) | –50 (–65,–35) |
in 2050 (% rel to 2019) | –100 (–100,–100) | –100 (–100,–100) | –95 (–100,–95) | –100 (–100,–95) | –95 (–100,–95) |
Box TS.3 | Shifting Development Pathways to Increase Sustainability and Broaden Mitigation Options
In this report, development pathways refer to the patterns of development resulting from multiple decisions and choices made by many actors in the national and global contexts. Each society whether in developing or developed regions follows its own pattern of growth (Figure TS.13). Development pathways can also be described at smaller scales (e.g., for regions or cities) and for sectoral systems.
Development pathways are major drivers of GHG emissions {1, 2}. There is compelling evidence to show that continuing along existing development pathways will not achieve rapid and deep emission reductions. In the absence of shifts in development pathways, conventional mitigation policy instruments may not be able to limit global emissions to a degree sufficient to meet ambitious mitigation goals or they may only be able to do so at very high economic and social costs.
Policies to shift development pathways, on the other hand, make mitigation policies more effective. Shifting development pathways broadens the scope for synergies between sustainable development objectives and mitigation. Development pathways also determine the enablers and levers available for adaptation {AR6 WGII TS.E.1.2} and for achieving other SDGs.
There are many instances in which reducing GHG emissions and moving towards the achievement of other development objectives can go hand in hand {Chapter 3, Figure 3.33, Chapters 6–12, and 17}. Integrated policies can support the creation of synergies between action to combat climate change and its impacts (SDG 13 – climate action) and other SDGs. For example, when measures promoting walkable urban areas are combined with electrification and clean renewable energy, there are several co-benefits to be attained. These include reduced pressures on agricultural land from reduced urban growth, health co-benefits from cleaner air, and benefits from enhanced mobility {8.2, 8.4, 4.4.1}. Energy efficiency in buildings and energy poverty alleviation through improved access to clean fuels also deliver significant health benefits. {9.8.1 and 9.8.2}
However, decisions about mitigation actions, and their timing and scale, may entail trade-offs with the achievement of other national development objectives in the near, mid- and long term {Chapter 12}. In the near term, for example, regulations may ban vehicles from city centres to reduce congestion and local air pollution but reduce mobility and choice. Increasing green spaces within cities without caps on housing prices may involve trade-offs with affordable housing and push low-income residents outside the city {8.2.2}. In the mid- and long term, large-scale deployment of biomass energy raises concerns about food security and biodiversity conservation {3.7.1, 3.7.5, 7.4.4, 9.8.1, 12.5.2, 12.5.3}. Prioritising is one way to manage these trade-offs, addressing some national development objectives earlier than others. Another way is to adopt policy packages aimed at shifting development pathways towards increased sustainability (SDPS) as they expand the range of tools available to simultaneously achieve multiple development objectives and accelerate mitigation. (Box TS.3, Figure 1)
What does shifting development pathways towards increased sustainability entail?
Shifting development pathways towards increased sustainability implies making transformative changes that disrupt existing developmental trends. Such choices would not be marginal, but include technological, systemic and socio-behavioural changes {4.4}. Decision points also arise with new infrastructure, sustainable supply chains, institutional capacities for evidence-based and integrated decision-making, financial alignment towards low-carbon socially responsible investments, just transitions and shifts in behaviour and norms to support shifts away from fossil fuel consumption. Adopting multi-level governance modes, tackling corruption where it inhibits shifts to sustainability, and improving social and political trust are also key for aligning and supporting long-term environmentally just policies and processes. {4.4, Cross-Chapter Box 5 in Chapter 4}
How can development pathways be ‘shifted’?
Shifting development paths is complex. Changes that involve ‘dissimilar, unfamiliar and more complex science-based components’ take more time, acceptance and legitimation and involve complex social learning, even when they promise large gains. Despite the complexities of the interactions that result in patterns of development, history also shows that societies can influence the direction of development pathways based on choices made by decision-makers, citizens, the private sector, and social stakeholders. Shifts in development pathways result from both sustained political interventions and bottom-up changes in public opinion. Collective action by individuals as part of social movements or lifestyle changes underpins system change. {5.2.3, 5.4.1, 5.4.5}
Sectoral transitions that aim to shift development pathways often have multiple objectives and deploy a diverse mix of policies and institutional measures. Context-specific governance conditions can significantly enable or disable sectoral transitions. {Cross-Chapter Box 12 in Chapter 16}
The necessary transformational changes are anticipated to be more acceptable if rooted in the development aspirations of the economy and society within which they take place and may enable a new social contract to address a complex set of interlinkages across sectors, classes, and the whole economy. Taking advantage of windows of opportunity and disruptions to mindsets and socio-technical systems could advance deeper transformations.
How can shifts in development pathways be implemented by actors in different contexts?
Shifting development pathways to increased sustainability is a shared aspiration. Yet since countries differ in starting points (e.g., social, economic, cultural, political) and historical backgrounds, they have different urgent needs in terms of facilitating the economic, social, and environmental dimensions of sustainable development and, therefore, give different priorities {4.3.2, 17.1}. The appropriate set of policies to shift development pathways thus depends on national circumstances and capacities.
Shifting development pathways towards sustainability needs to be supported by multilateral partnerships to strengthen suitable capacity, technological innovation (TS.6.5), and financial flows (TS.6.4). The international community can play a particularly key role by helping ensure the necessary broad participation in climate-mitigation efforts, including by countries at different development levels, through sustained support for policies and partnerships that support shifting development pathways towards sustainability while promoting equity and being mindful of different transition capacities. {4.3, 16.5, 16.6}
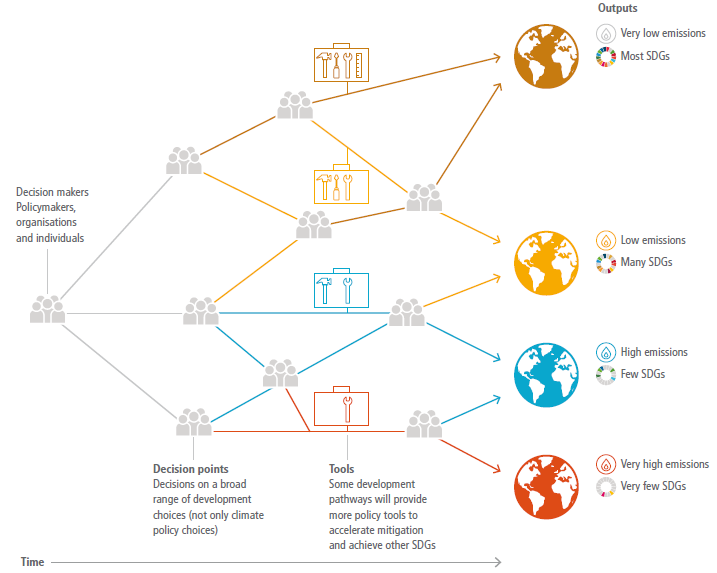
Box TS.3, Figure 1 | Shifting development pathways to increased sustainability: choices by a wide range of actors at key decision points on development pathways can reduce barriers and provide more tools to accelerate mitigation and achieve other Sustainable Development Goals. {4.7}
Policies can shift development pathways. There are examples of policies implemented in the pursuit of overall societal development objectives, such as job creation, macroeconomic stability, economic growth, and public health and welfare. In some countries, such policies are framed as part of a Just Transition (Box TS.3), however, they can have major influence on mitigative capacity, and hence can be seen as tools to broaden mitigation options (medium confidence){4.3.3}. Coordinated policy mixes would need to orchestrate multiple actors – individuals, groups and collectives, corporate actors, institutions and infrastructure actors – to deepen decarbonisation and shift pathways towards sustainability. Shifts in one country may spill over to other countries. Shifting development pathways can jointly support mitigation and adaptation {4.4.2}. Some studies explore the risks of high complexity and potential delay attached to shifting development pathways. (Box TS.4, Figure TS.11) {4.4.3}
An increasing number of mitigation strategies up to 2050 (mid-term) have been developed by various actors. A growing number of such strategies aim at net zero GHG or CO2 emissions, but it is not yet possible to draw global implications due to the limited size of sample (medium evidence, low agreement) {4.2.4}. Non-state actors are also engaging in a wide range of mitigation initiatives. When adding up emission reduction potentials, sub-national and non-state international cooperative initiatives could reduce emissions by up to about 20 GtCO2-eq in 2030 (limited evidence, medium agreement ) {4.2.3}. Yet perceived or real conflicts between mitigation and other SDGs can impede such action. If undertaken without precaution, accelerated mitigation is found to have significant implications for development objectives and macroeconomic costs at country level. The literature shows that the employment effect of mitigation policies tends to be limited on aggregate but can be significant at sectoral level (limited evidence, medium agreement ). Detailed design of mitigation policies is critical for distributional impacts and avoiding lock-in ( high confidence), though further research is needed in that direction. {4.2.6}
The literature identifies a broad set of enabling conditions that can both fostershifting development pathwaysandaccelerated mitigation (medium evidence, high agreement). Policy integration is a necessary component of shifting development pathways, addressing multiple objectives. To this aim, mobilising a range of policies is preferable to single policy instruments ( high confidence). {4.4.1}. Governance for climate mitigation and shifting development pathways is enhanced when tailored to national and local contexts. Improved institutions and effective governance enable ambitious action on climate and can help bridge implementation gaps (medium evidence, high agreement ). Given that strengthening institutions may be a long-term endeavour, it needs attention in the near term {4.4.1}. Accelerated mitigation and shifting development pathways necessitates both redirecting existing financial flows from high- to low-emissions technologies and systems, and providing additional resources to overcome current financial barriers ( high confidence) {4.4.1}. Opportunities exist in the near term to close the finance gap {15.2.2}. At the national level, public finance for actions promoting sustainable development helps broaden the scope of mitigation (medium confidence). Changes in behaviour and lifestyles are important to move beyond mitigation as incremental change, and when supporting shifts to more sustainable development pathways will broaden the scope of mitigation (medium confidence). {4.4.1, Figure 4.8}
Some enabling conditions can be put in place relatively quickly while some others may take time to establish underscoring the importance of early action (high confidence). Depending on context, some enabling conditions such as promoting innovation may take time to establish. Other enabling conditions, such as improved access to financing, can be put in place in a relatively short time frame, and can yield rapid results {4.4, Figure 5.14, 13.9, 14.5, 15.6, 16.3, 16.4, 16.5, Cross-Chapter Box 12 in Chapter 16}. Focusing on development pathways and considering how to shift them may also yield rapid results by providing tools to accelerate mitigation and achieve other sustainable development goals {4.4.1}. Charting just transitions to net zero may provide a vision, which policy measures can help achieve (Boxes TS.4 and TS.8).
Equity can be an important enabler, increasing the level of ambition for accelerated mitigation (high confidence) {4.5}. Equity deals with the distribution of costs and benefits and how these are shared, as per social contracts, national policy and international agreements. Transition pathways have distributional consequences such as large changes in employment and economic structure ( high confidence). The Just Transition concept has become an international focal point tying together social movements, trade unions, and other key stakeholders to ensure equity is better accounted for in low-carbon transitions (Box TS.4). The effectiveness of cooperative action and the perception of fairness of such arrangements are closely related in that pathways that prioritise equity and allow broad stakeholder participation can enable broader consensus for the transformational change implicit in the need for deeper mitigation (robust evidence, medium agreement ). (Box TS.4) {4.5, Figure 4.9}
Box TS.4 | Just Transition
The Just Transition framework refers to a set of principles, processes and practices aimed at ensuring that no people, workers, places, sectors, countries or regions are left behind in the move from a high-carbon to a low-carbon economy. It includes respect and dignity for vulnerable groups; creation of decent jobs; social protection; employment rights; fairness in energy access and use and social dialogue and democratic consultation with relevant stakeholders.
The concept has evolved, becoming prominent in the United States of America in 1980, related to environmental regulations that resulted in job losses from highly polluting industries. Traced from a purely labour movement, trade union space, the Just Transition framework emphasises that decent work and environmental protection are not incompatible. During COP 24, with the Just Transition Silesia Declaration, the concept gained in recognition and was signed by 56 heads of state.
Implicit in a Just Transition is the notion of well-being, equity and justice – the realisation that transitions are inherently disruptive and deliberate effort may be required to ensure communities dependent on fossil-fuel based economies and industries do not suffer disproportionately {Chapter 4}. ‘Just Transitions’ are integral to the European Union as mentioned in the EU Green Deal, the Scottish Government’s development plans and other national low-carbon transition strategies. The US Green New Deal Resolution puts structural inequality, poverty mitigation, and ‘Just Transitions’ at its centre. There is a growing awareness of the need for shifting finance towards Just Transition in the context of COVID-19, in particular, public finance and governance have a major role in allowing a Just Transition more broadly {Chapter 15}.
In the immediate aftermath of the COVID-19 pandemic, low oil prices created additional financial problems for fossil fuel producer countries faced with loss of revenue and reduced fiscal latitude and space. Public spending and social safety nets associated with the proceeds from producer economies can be affected as assets become stranded and spending on strategic sustainable development goals such as free education and health-care services are neglected. Fiscal challenges are intricately linked to ‘Just Transitions’ and the management associated with sustainable energy transition. There is no certainty on how energy systems will recover post-COVID-19. However, ‘Just Transitions’ will have equity implications if stimulus packages are implemented without due regard for the differentiated scales and speeds and national and regional contexts, especially in the context of developing countries.
A Just Transition entails targeted and proactive measures from governments, agencies, and other non-state authorities to ensure that any negative social, environmental, or economic impacts of economy-wide transitions are minimised, whilst benefits are maximised for those disproportionally affected. These proactive measures include eradication of poverty, regulating prosperity and creating jobs in ‘green’ sectors. In addition, governments, polluting industries, corporations, and those more able to pay higher associated taxes, can pay for transition costs by providing a welfare safety net and adequate compensation to people, communities, and regions that have been impacted by pollution, or are marginalised, or are negatively impacted by a transition from a high- to low-carbon economy and society. There is, nonetheless, increased recognition that resources that can enable the transition, international development institutions, as well as other transitional drivers such as tools, strategies and finance, are scarce. A sample of global efforts is summarised in Box TS.4, Figure 1.

Box TS.4 Figure 1 | Just Transitions around the world, 2020. Panel (a) shows commissions, task forces, and dialogues behind a Just Transition in many countries. Panel (b) shows the funds related to the Just Transition within the European Union Green Deal. Panel (c) shows the European Union’s Platform for Coal Regions in Transition. {Figure 4.9}
TS.4.2 Long-term Mitigation Pathways
The characteristics of a wide range of long-term mitigation pathways, their common elements and differences are assessed in Chapter 3. Differences between pathways typically represent choices that can steer the system in alternative directions through the selection of different combinations of response options (high confidence). More than 2000 quantitative emissions pathways were submitted to the AR6 scenarios database, of which more than 1200 pathways included sufficient information for the associated warming to be assessed (consistent with AR6 WGI methods). (Box TS.5) {3.2, 3.3}
Many pathways in the literature show how to limit global warming to 2°C (>67%) with no overshoot or to limit warming to 1.5°C (>50%) with limited overshoot compared to1850–1900. The likelihood of limiting warming to 1.5°C with no or limited overshoot has dropped in AR6 WGIII compared to AR6 SR1.5 because global GHG emissions have risen since 2017, leading to higher near-term emissions (2030) and higher cumulative CO2 emissions until the time of net zero (medium confidence). Only a small number of published pathways limit global warming to 1.5°C without overshoot over the course of the 21st century. {3.3, Annex III.II.3}
Mitigation pathways limiting warming to 1.5°C with no or limited overshoot reach 50% CO2reductions in the 2030s, relative to 2019, then reduce emissions further to reach net zero CO2 emissions in the 2050s. Pathways limiting warming to 2°C (>67%) reach 50% reductions in the 2040s and net zero CO2by the 2070s (medium confidence). (Figure TS.10, Box TS.6) {3.3}
Cost-effective mitigation pathways assuming immediate action to limit warming to 2°C (>67%) are associated with net global GHG emissions of 30–49 GtCO2-eq yr–1by 2030 and 14–27 GtCO2-eq yr–1by 2050 (medium confidence). This corresponds to reductions, relative to 2019 levels, of 13–45% by 2030 and 52–76% by 2050. Pathways that limit global warming to below 1.5°C with no or limited overshoot require a further acceleration in the pace of transformation, with net GHG emissions typically around 21–36 GtCO2-eq yr –1 by 2030 and 1–15 GtCO2-eq yr –1 by 2050; this corresponds to reductions of 34–60% by 2030 and 73–98% by 2050 relative to 2019 levels. {3.3}
Box TS.5 | Illustrative Mitigation Pathways (IMPs), and Shared Socio-economic Pathways (SSPs)
The Illustrative Mitigation Pathways (IMPs)
The over 2500 model-based pathways submitted to the AR6 scenarios database pathways explore different possible evolutions of future energy and land use (with and without climate policy) and the consequences for greenhouse gas emissions.
From the full range of pathways, five archetype scenarios – referred to in this report as Illustrative Mitigation Pathways (IMPs) – were selected to illustrate key mitigation-strategy themes that flow through several chapters in this report. A further two pathways illustrative of high emissions assuming continuation of current policies or moderately increased action were selected to show the consequences of current policies and pledges. Together these pathways provide illustrations of potential future developments that can be shaped by human choices, including: Where are current policies and pledges leading us? What is needed to reach specific temperature goals? What are the consequences of using different strategies to meet these goals? What are the consequences of delay? How can we shift development from current practices to give higher priority to sustainability and the SDGs?
Each of the IMPs comprises: a storyline and a quantitative illustration. The storyline describes the key characteristics of the pathway qualitatively; the quantitative illustration is selected from the literature on long-term scenarios to effectively represent the IMP numerically. The five Illustrative Mitigation Pathways (IMPs) each emphasise a different scenario element as its defining feature, and are named accordingly: heavy reliance on ren ewables (IMP-Ren), strong emphasis on l ow d emand for energy (IMP-LD), extensive use of carbon dioxide removal (CDR) in the energy and the industry sectors to achieve net negative emissions (IMP-Neg), mitigation in the context of broader sustainable development and s hifting development p athways (IMP-SP), and the implications of a less rapid and g radual s trengthening of near-term mitigation actions (IMP-GS). In some cases, sectoral chapters may use different quantifications that follow the same storyline narrative but contain data that better exemplify the chapter’s assessment. Some IMP variants are also used to explore the sensitivity around alternative temperature goals. {3.2, 3.3}
The two additional pathways illustrative of higher emissions are current policies (CurPol) and moderate action (ModAct).
This framework is summarised in Box TS.5, Table.1 below, which also shows where the IMPs are situated with respect to the classification of emissions scenarios into warming levels (C1–C8) introduced in Chapter 3, and the CMIP6 (Coupled Model Intercomparison Project 6) scenarios used in the AR6 WGI report.
Box TS.5, Table.1 | Illustrative Mitigation Pathways (IMPs) andpathways illustrative of higher emissionsin relation to scenarios’ categories, and CMIP6 scenarios.
Classification of emissions scenarios into warming levels: C1–C8 | Pathways illustrative of higher emissions | Illustrative mitigation pathways (IMPs) | CMIP6 scenarios |
C8 exceeding warming of 4°C (≥50%) | SSP5-8.5 | ||
C7 limit warming to 4°C (>50%) | CurPol | SSP3-7.0 | |
C6 limit warming to 3°C (>50%) | ModAct | SSP2-4.5 | |
C5 limit warming to 2.5°C (>50%) | SSP4-3.7 | ||
C4 limit warming to 2°C (>50%) | |||
C3 limit warming to 2°C (>67%) | IMP-GS (Sensitivities: Neg; Ren) | SSP2-2.6 | |
C2 return warming to 1.5°C (>50%) after a high overshoot | IMP-Neg | ||
C1 limit warming to 1.5°C (>50%) with no or limited overshoot | IMP-LD IMP-Ren IMP-SP | SSP1-1.9 |
The Shared Socio-economic Pathways (SSPs)
First published in 2017, the Shared Socio-economic Pathways (SSPs) are alternative projections of socio-economic developments that may influence future GHG emissions.
The initial set of SSP narratives described worlds with different challenges to mitigation and adaptation: SSP1 (sustainability), SSP2 (middle of the road), SSP3 (regional rivalry), SSP4 (inequality) and SSP5 (rapid growth). The SSPs were subsequently quantified in terms of energy, land-use change, and emission pathways for both (i) no-climate-policy reference scenarios and (ii) mitigation scenarios that follow similar radiative forcing pathways as the representative concentration pathways (RCPs) assessed in AR5 WGI. {3.2.3}
Most of the scenarios in the AR6 database are SSP-based. The majority of the assessed scenarios are consistent with SSP2. Using the SSPs permits a more systematic assessment of future GHG emissions and their uncertainties than was possible in AR5. The main emissions drivers across the SSPs include growth in population reaching 8.5–9.7 billion by 2050, and an increase in global GDP of 2.7–4.1% per year between 2015 and 2050. Final energy demand in the absence of any new climate policies is projected to grow to around 480 to 750 EJ yr –1 in 2050 (compared to around 390 EJ yr –1 in 2015) (medium confidence). The highest emissions scenarios in the literature result in global warming of >5°C by 2100, based on assumptions of rapid economic growth and pervasive climate policy failures ( high confidence). {3.3}
Pathways following current NDCs until 2030 reach annual emissions of 47–57 GtCO2-eq yr–1by 2030, thereby making it impossible to limit warming to 1.5°C (>50%) with no or limited overshoot and strongly increasing the challenge of limiting warming to 2°C (>67%) (high confidence). A high overshoot of 1.5°C increases the risks from climate impacts and increases dependence on large-scale carbon dioxide removal (CDR) from the atmosphere. A future consistent with current NDCs implies higher fossil fuel deployment and lower reliance on low-carbon alternatives until 2030, compared to mitigation pathways describing immediate action that limits warming to 1.5°C (>50%) with no or limited overshoot, or limits warming to 2°C (>67%) and below. After following the NDCs to 2030, to limit warming to 2°C (>67%) the pace of global GHG emission reductions would need to abruptly increase from 2030 onward to an average of 1.3–2.1 GtCO2-eq per year between 2030 and 2050. This is similar to the global CO2 emission reductions in 2020 that occurred due to the COVID-19 pandemic lockdowns, and around 70% faster than in pathways where immediate action is taken to limit warming to 2°C (>67%). Accelerating emission reductions after following an NDC pathway to 2030 would also be particularly challenging because of the continued buildup of fossil fuel infrastructure that would take place between now and 2030. (TS4.1, Table TS.3) {3.5, 4.2}
Table TS.3 | GHG, CO2 emissions and warming characteristics of different mitigation pathways submitted to the AR6 scenarios database, and as categorised in the climate assessment. {Table 3.2}
p50 [p5–p95]a | GHG emissions (GtCO2-eqyr–1) g | GHG emissions reductions from 2019 (%) h | Emissions milestonesi, j | Cumulative CO2 emissions (GtCO2) m | Cumulative net-negative CO2 emissions (GtCO2) | Global mean temperature changes 50% probability (°C) n | Likelihood of peak global warming staying below (%) o | |||||||||||||
Categoryb, c, d[# pathways] | Category/subset label | WGI SSP & WGIII IPs/IMPsalignment e, f | 2030 | 2040 | 2050 | 2030 | 2040 | 2050 | Peak CO2 emissions (% peak before 2100) | Peak GHG emissions (% peak before 2100) | Net zero CO2 (%net zero pathways) | Net zeroGHGs (% net zeropathways) k, l | 2020 to net zero CO2 | 2020–2100 | Year of net zero CO2 to 2100 | at peak warming | 2100 | <1.5°C | <2.0°C | <3.0°C |
Modelled global emissions pathways categorised by projected global warming levels (GWL). Detailed likelihood definitions are provided in SPM Box 1. The five illustrative scenarios (SSPx-yy) considered by AR6 WGI and the Illustrative (Mitigation) Pathways assessed in WGIII are aligned with the temperature categories and are indicated in a separate column. Global emission pathways contain regionally differentiated information. This assessment focuses on their global characteristics. | Projected median annual GHG emissions in the year across the scenarios, with the 5th–95th percentile in brackets. Modelled GHG emissions in 2019: 55 [53–58]GtCO2-eq. | Projected median GHG emissions reductions of pathways in the year across the scenarios compared to modelled 2019, with the 5th–95th percentile in brackets. Negative numbers indicate increase in emissions compared to 2019. | Median 5-year intervals at which projected CO2& GHG emissions peak, with the 5th–95th percentile interval in square brackets. Percentage of peaking pathways is denoted in round brackets. Three dots (…) denotes emissions peak in 2100 or beyond for that percentile. | Median 5-year intervals at which projected CO2 & GHG emissions of pathways in this category reachnet zero, with the 5th–95th percentile interval in square brackets. Percentage of net zero pathways is denoted in round brackets. Three dots (…) denotes net zero not reached for that percentile. | Median cumulative net CO2 emissions across the projected scenarios in this category until reaching net zero or until 2100, with the 5th–95th percentile interval in square brackets. | Median cumulative net-negativeCO2 emissions between the year of net zero CO2 and 2100. Morenet-negativeresults in greater temperature declines after peak. | Projected temperature change of pathways in this category (50% probability across the range of climate uncertainties), relative to 1850–1900, at peak warming and in 2100, for the median value across the scenarios and the 5th–95th percentile interval in square brackets. | Median likelihood that the projected pathways in this category stay below a given global warming level, with the 5th–95th percentile interval in square brackets. | ||||||||||||
C1 [97] | limit warming to 1.5°C (>50%) with no or limited overshoot | 31 [21–36] | 17 [6–23] | 9 [1–15] | 43 [34–60] | 69 [58–90] | 84 [73–98] | 2020–2025 (100%) [2020–2025] | 2050–2055 (100%) [2035–2070] | 2095–2100 (52%) [2050–...] | 510 [330–710] | 320 [–210 to 570] | –220 [–660 to –20] | 1.6 [1.4–1.6] | 1.3 [1.1–1.5] | 38 [33–58] | 90 [86–97] | 100 [99–100] | ||
C1a [50] | … with net zeroGHGs | SSP1–1.9, SP LD | 33 [22–37] | 18 [6–24] | 8 [0–15] | 41 [31–59] | 66 [58–89] | 85 [72–100] | 2070–2075 (100%) [2050–2090] | 550 [340–760] | 160 [–220 to 620] | –360 [–680 to –140] | 1.6 [1.4–1.6] | 1.2 [1.1–1.4] | 38 [34–60] | 90 [85–98] | 100 [99–100] | |||
C1b [47] | … without net zeroGHGs | Ren | 29 [21–36] | 16 [7–21] | 9 [4–13] | 48 [35–61] | 70 [62–87] | 84 [76–93] | …–… [0%] | 460 [320–590] | 360 [10–540] | –60 [–440 to 0] | 1.6 [1.5–1.6] | 1.4 [1.3–1.5] | 37 [33–56] | 89 [87–96] | 100 [99–100] | |||
[…–…] | ||||||||||||||||||||
C2 [133] | return warming to 1.5°C (>50%) after a high overshoot | Neg | 42 [31–55] | 25 [17–34] | 14 [5–21] | 23 [0–44] | 55 [40–71] | 75 [62–91] | 2020–2025 (100%) | 2055–2060 (100%) [2045–2070] | 2070–2075 (87%) [2055–...] | 720 [530–930] | 400 [–90 to 620] | –360 [–680 to –60] | 1.7 [1.5–1.8] | 1.4 [1.2–1.5] | 24 [15–42] | 82 [71–93] | 100 [99–100] | |
[2020–2030] | [2020–2025] | |||||||||||||||||||
C3 [311] | limit warming to 2°C (>67%) | 44 [32–55] | 29 [20–36] | 20 [13–26] | 21 [1–42] | 46 [34–63] | 64 [53–77] | 2020–2025 (100%) | 2070–2075 (93%) [2055–...] | ...–... (30%) [2075–...] | 890 [640–1160] | 800 [510–1140] | –40 [–290 to 0] | 1.7 [1.6–1.8] | 1.6 [1.5–1.8] | 20 [13–41] | 76 [68–91] | 99 [98–100] | ||
[2020–2030] | [2020–2025] | |||||||||||||||||||
C3a [204] | … with action starting in 2020 | SSP1–2.6 | 40 [30–49] | 29 [21–36] | 20 [14–27] | 27 [13–45] | 47 [35–63] | 63 [52–76] | 2020–2025 (100%) [2020–2025] | 2070–2075 (91%) [2055–...] | ...–... (24%) [2080–...] | 860 [640–1180] | 790 [480–1150] | –30 [–280 to 0] | 1.7 [1.6–1.8] | 1.6 [1.5–1.8] | 21 [14–42] | 78 [69–91] | 100 [98–100] | |
C3b [97] | … NDCs until 2030 | GS | 52 [47–56] | 29 [20–36] | 18 [10–25] | 5 [0–14] | 46 [34–63] | 68 [56–82] | 2020–2025 (100%) [2020–2030] | 2065–2070 (97%) [2055–2090] | ...–... (41%) [2075–...] | 910 [720–1150] | 800 [560–1050] | –60 [–300 to 0] | 1.8 [1.6–1.8] | 1.6 [1.5–1.7] | 17 [12–35] | 73 [67–87] | 99 [98–99] | |
C4 [159] | limit warming to 2°C (>50%) | 50 [41–56] | 38 [28–44] | 28 [19–35] | 10 [0–27] | 31 [20–50] | 49 [35–65] | 2080–2085 (86%) [2065–...] | ...–... (31%) [2075–...] | 1210 [970–1490] | 1160 [700–1490] | –30 [–390 to 0] | 1.9 [1.7–2.0] | 1.8 [1.5–2.0] | 11 [7–22] | 59 [50–77] | 98 [95–99] | |||
C5 [212] | limit warming to 2.5°C (>50%) | 52 [46–56] | 45 [37–53] | 39 [30–49] | 6 [–1 to 18] | 18 [4–33] | 29 [11–48] | ...–... (41%) [2080–...] | ...–... (12%) [2090–...] | 1780 [1400–2360] | 1780 [1260–2360] | 0 [–160 to 0] | 2.2 [1.9–2.5] | 2.1 [1.9–2.5] | 4 [0–10] | 37 [18–59] | 91 [83–98] | |||
C6 [97] | limit warming to 3°C (>50%) | SSP2–4.5 ModAct | 54 [50–62] | 53 [48–61] | 52 [45–57] | 2 [–10 to 11] | 3 [–14 to 14] | 5 [–2 to 18] | 2030–2035 (96%) | 2020–2025 (97%) | nonet zero | nonet zero | 2790 [2440–3520] | nonet zero | temperaturedoes not peak by 2100 | 2.7 [2.4–2.9] | 0 [0–0] | 8 [2–18] | 71 [53–88] | |
[2020–2090] | ||||||||||||||||||||
C7 [164] | limit warming to 4°C (>50%) | SSP3–7.0 CurPol | 62 [53–69] | 67 [56–76] | 70 [58–83] | –11 [–18 to 3] | –19 [–31 to 1] | –24 [–41 to –2] | 2085–2090 (57%) | 2090–2095 (56%) | 4220 [3160–5000] | 3.5 [2.8–3.9] | 0 [0–0] | 0 [0–2] | 22 [7–60] | |||||
[2040–...] | ||||||||||||||||||||
C8 [29] | exceed warming of 4°C (≥50%) | SSP5–8.5 | 71 [69–81] | 80 [78–96] | 88 [82–112] | –20 [–34 to –17] | –35 [–65 to –29] | –46 [–92 to –36] | 2080–2085 (90%) [2070–...] | 5600 | 4.2 [3.7–5.0] | 0 [0–0] | 0 [0–0] | 4 [0–11] | ||||||
[4910–7450] | ||||||||||||||||||||
aValues in the table refer to the 50th and [5th–95th] percentile values across the pathways falling within a given category as defined in Box SPM.1. For emissions-related columns these values relate to the distribution of all the pathways in that category. Harmonised emissions values are given for consistency with projected global warming outcomes using climate emulators. Based on the assessment of climate emulators in AR6 WGI (WG1 Chapter 7, Box 7.1), two climate emulators are used for the probabilistic assessment of the resulting warming of the pathways. For the ‘Temperature change’ and ‘Likelihood’ columns, the single upper-row values represent the 50th percentile across the pathways in that category and the median [50th percentile] across the warming estimates of the probabilistic MAGICC climate model emulator. For the bracketed ranges, the median warming for every pathway in that category is calculated for each of the two climate model emulators (MAGICC and FaIR). Subsequently, the 5th and 95th percentile values across all pathways for each emulator are calculated. The coolest and warmest outcomes (i.e., the lowest p5 of two emulators, and the highest p95, respectively) are shown in square brackets. These ranges therefore cover both the uncertainty of the emissions pathways as well as the climate emulators’ uncertainty.
bFor a description of pathways categories see Box SPM.1 and Table 3.1.
cAll global warming levels are relative to 1850–1900. (See footnote n below and Box SPM.1 for more details.)
dC3 pathways are sub-categorised according to the timing of policy action to match the emissions pathways in Figure SPM.4. Two pathways derived from a cost-benefit analysis have been added to C3a, whilst 10 pathways with specifically designed near-term action until 2030, whose emissions fall below those implied by NDCs announced prior to COP26, are not included in either of the two subsets.
eAlignment with the categories of the illustrative SSP scenarios considered in AR6 WGI, and the Illustrative (Mitigation) Pathways (IPs/IMPs) of WGIII. The IMPs have common features such as deep and rapid emissions reductions, but also different combinations of sectoral mitigation strategies. See Box SPM.1 for an introduction of the IPs and IMPs, and Chapter 3 for full descriptions. {3.2, 3.3, Annex III.II.4}
f The Illustrative Mitigation Pathway ‘Neg’ has extensive use of carbon dioxide removal (CDR) in the AFOLU, energy and the industry sectors to achieve net negative emissions. Warming peaks around 2060 and declines to below 1.5°C (50% likelihood) shortly after 2100. Whilst technically classified as C3, it strongly exhibits the characteristics of C2 high-overshoot pathways, hence it has been placed in the C2 category. See Box SPM.1 for an introduction of the IPs and IMPs.
gThe 2019 range of harmonised GHG emissions across the pathways [53–58 GtCO2-eq] is within the uncertainty ranges of 2019 emissions assessed in Chapter 2 [53–66 GtCO2-eq]. (Figure SPM.1, Figure SPM.2, Box SPM.1)
hRates of global emission reduction in mitigation pathways are reported on a pathway-by-pathway basis relative to harmonised modelled global emissions in 2019 rather than the global emissions reported in SPM Section B and Chapter 2; this ensures internal consistency in assumptions about emission sources and activities, as well as consistency with temperature projections based on the physical climate science assessment by WGI. {Annex III.II.2.5}. Negative values (e.g., in C7, C8) represent an increase in emissions.
iEmissions milestones are provided for five-year intervals in order to be consistent with the underlying five-year time-step data of the modelled pathways. Peak emissions (CO2 and GHGs) are assessed for five-year reporting intervals starting in 2020. The interval 2020–2025 signifies that projected emissions peak as soon as possible between 2020 and at latest before 2025. The upper five-year interval refers to the median interval within which the emissions peak or reach net zero. Ranges in square brackets underneath refer to the range across the pathways, comprising the lower bound of the 5th percentile five-year interval and the upper bound of the 95th percentile five-year interval. Numbers in round brackets signify the fraction of pathways that reach specific milestones.
jPercentiles reported across all pathways in that category include those that do not reach net zero before 2100 (fraction of pathways reaching net zero is given in round brackets). If the fraction of pathways that reach net zero before 2100 is lower than the fraction of pathways covered by a percentile (e.g., 0.95 for the 95th percentile), the percentile is not defined and denoted with ‘…’. The fraction of pathways reaching net zero includes all with reported non-harmonised, and/or harmonised emissions profiles that reach net zero. Pathways were counted when at least one of the two profiles fell below 100 MtCO2 yr –1 until 2100.
kThe timing of net zero is further discussed in SPM C2.4 and Cross-Chapter Box 3 in Chapter 3 on net zero CO2 and net zero GHG emissions.
lFor cases where models do not report all GHGs, missing GHG species are infilled and aggregated into a Kyoto basket of GHG emissions in CO2-eq defined by the 100-year global warming potential. For each pathway, reporting of CO2, CH4, and N2O emissions was the minimum required for the assessment of the climate response and the assignment to a climate category. Emissions pathways without climate assessment are not included in the ranges presented here. {See Annex III.II.5}
mCumulative emissions are calculated from the start of 2020 to the time of net zero and 2100, respectively. They are based on harmonised net CO2 emissions, ensuring consistency with the WGI assessment of the remaining carbon budget. {Box 3.4}
nGlobal mean temperature change for category (at peak, if peak temperature occurs before 2100, and in 2100) relative to 1850–1900, based on the median global warming for each pathway assessed using the probabilistic climate model emulators calibrated to the AR6 WGI assessment. (See also Box SPM.1) {Annex III.II.2.5; WGI Cross-Chapter Box 7.1}
oProbability of staying below the temperature thresholds for the pathways in each category, taking into consideration the range of uncertainty from the climate model emulators consistent with the AR6 WGI assessment. The probabilities refer to the probability at peak temperature. Note that in the case of temperature overshoot (e.g., category C2 and some pathways in C1), the probabilities of staying below at the end of the century are higher than the probabilities at peak temperature.
Pathways accelerating action compared to current NDCs – that reduce annual GHG emissions to 47 (38–51) GtCO2-eq by 2030 (which is 3–9 GtCO2-eq below projected emissions from fully implementing current NDCs) – make it less challenging to limit warming to 2°C (>67%) after 2030 (medium confidence). The accelerated action pathways are characterised by a global, but regionally differentiated, roll-out of regulatory and pricing policies. Compared to current NDCs, they describe less fossil fuel use and more low-carbon fuel use until 2030; they narrow, but do not close the gap to pathways that assume immediate global action using all available least-cost abatement options. All delayed or accelerated action pathways limiting warming to below 2°C (>67%) converge to a global mitigation regime at some point after 2030 by putting a significant value on reducing carbon and other GHG emissions in all sectors and regions. {3.5}
In mitigation pathways, peak warming is determined by the cumulative net CO2 emissions until the time of net zero CO2together with the warming contribution of other GHGs and climate forcers at that time (high confidence). Cumulative net CO2 emissions from 2020 to the time of net zero CO2 are 510 (330–710) GtCO2 in pathways that limit warming to 1.5°C (>50%) with no or limited overshoot and 890 (640–1160) GtCO2 in pathways limiting warming to 2°C (>67%). These estimates are consistent with the AR6 WGI assessment of remaining carbon budgets adjusting for methodological differences and non-CO2 warming. {3.3, Box 3.4}
Rapid reductions in non-CO2GHGs, particularly CH4, would lower the level of peak warming (high confidence). Non-CO2 emissions – at the time of reaching net zero CO2– range between 4–11 GtCO2-eq yr –1 in pathways limiting warming to 2°C (>67%) or below. CH4 is reduced by around 20% (1–46%) in 2030 and almost 50% (26–64%) in 2050, relative to 2019. CH4 emission reductions in pathways limiting warming to 1.5°C with no or limited overshoot are substantially higher by 2030, 33% (19–57%), but only moderately so by 2050, 50% (33–69%). CH4 emissions reductions are thus attainable at comparatively low costs, but, at the same time, reductions are limited in scope in most 1.5°C–2°C pathways. Deeper CH4 emissions reductions by 2050 could further constrain the peak warming. N2O emissions are also reduced, but similar to CH4, N2O emission reductions saturate for more stringent climate goals. The emissions of cooling aerosols in mitigation pathways decrease as fossil fuels use is reduced. The overall impact on non-CO2-related warming combines all these factors. {3.3}
Net zero GHG emissions imply net negative CO2 emissions at a level that compensates for residual non-CO2 emissions. Only 30% of the pathways limiting warming to 2°C (>67%) or below reach net zero GHG emissions in the 21st century (high confidence). In those pathways reaching net zero GHGs, net zero GHGs is achieved around 10–20 years later than net zero CO2 is achieved (medium confidence). The reported quantity of residual non-CO2 emissions depends on accounting choices, and in particular the choice of GHG metric (Box TS.2). Reaching and sustaining global net zero GHG emissions – when emissions are measured and reported in terms of GWP100 – results in a gradual decline in temperature ( high confidence). (Box TS.6) {3.3}
Pathways that limit warming to 2°C (>67%) or lower exhibit substantial reductions in emissions from all sectors (high confidence). Pathways that limit warming to 1.5°C (>50%) with no or limited overshoot entail CO2 emissions reductions between 2019 and 2050 of around 77% (31–96%) for energy demand, around 115% (90–167%) for energy supply, and around 148% (94–387%) for AFOLU. 16 In pathways that limit warming to 2°C (>67%), projected CO2 emissions are reduced between 2019 and 2050 by around 49% for energy demand, 97% for energy supply, and 136% for AFOLU (medium confidence). {3.4}
If warming is to be limited, delaying or failing to achieve emissions reductions in one sector or region necessitates compensating reductions in other sectors or regions (high confidence). Mitigation pathways show differences in the timing of decarbonisation and when net zero CO2 emissions are achieved across sectors and regions. At the time of global net zero CO2 emissions, emissions in some sectors and regions are positive while others are negative; whether specific sectors and regions are positive or negative depends on the availability and cost of mitigation options in those regions, and the policies implemented. In cost-effective mitigation pathways, the energy supply sector typically reaches net zero CO2 before the economy as a whole, while the demand sectors reach net zero CO2 later, if ever ( high confidence). (Figure TS.10) {3.4}


Figure TS.10: Mitigation pathways that limit warming to 1.5°C, or 2°C, involve deep, rapid and sustained emissions reductions. Net zero CO2and net zero GHG emissions are possible through different mitigation portfolios. Panels (a) and (b) show the development of global GHG and CO2 emissions in modelled global pathways (upper sub-panels) and the associated timing of when GHG and CO2 emissions reach net zero (lower sub-panels). Panels (c) and (d) show the development of global CH4 and N2O emissions, respectively. Coloured ranges denote the 5th to 95th percentile across pathways. The red ranges depict emissions pathways assuming policies that were implemented by the end of 2020 and pathways assuming implementation of NDCs (announced prior to COP26). Ranges of modelled pathways that limit warming to 1.5°C (>50%) with no or limited overshoot are shown in light blue (category C1) and pathways that limit warming to 2°C (>67%) are shown in light purple (category C3). The grey range comprises all assessed pathways (C1–C8) from the 5th percentile of the lowest warming category (C1) to the 95th percentile of the highest warming category (C8). The modelled pathway ranges are compared to the emissions from two pathways illustrative of high emissions (CurPol and ModAct) and five IMPs: IMP-LD, IMP-Ren, IMP-SP, IMP-Neg and IMP-GS. Emissions are harmonised to the same 2015 base year. The vertical error bars in 2015 show the 5–95th percentile uncertainty range of the non-harmonised emissions across the pathways, and the uncertainty range, and median value, in emission estimates for 2015 and 2019. The vertical error bars in 2030 (panel a) depict the assessed range of the NDCs, as announced prior to COP26. 17 Panel (e) shows the sectoral contributions of CO2 and non-CO2 emissions sources and sinks at the time when net zero CO2 emissions are reached in the IMPs. Positive and negative emissions for different IMPs are compared to the GHG emissions from the year 2019. Energy supply (neg.) includes BECCS and DACCS. DACCS features in only two of the five IMPs (IMP-REN and IMP-GS) and contributes <1% and 64%, respectively, to the net negative emissions in Energy Supply (neg.). Panel (f) shows the contribution of different sectors and sources to the emissions reductions from a 2019 baseline for reaching net zero GHG emissions. Bars denote the median emissions reductions for all pathways that reach net zero GHG emissions. The whiskers indicate the p5–p95 range. The contributions of the service sectors (transport, buildings, industry) are split into direct (demand-side) as well as indirect (supply-side) CO2 emissions reductions. Direct emissions represent demand-side emissions due to the fuel use in the respective demand sector. Indirect emissions represent upstream emissions due to industrial processes and energy conversion, transmission and distribution. In addition, the contributions from the LULUCF sector and reductions from non-CO2 emissions sources (green and grey bars) are displayed. {3.3, 3.4}
Pathways limiting warming to 2°C (>67%) or 1.5°C involve substantial reductions in fossil fuel consumption and a near elimination of coal use without CCS (high confidence). These pathways show an increase in low-carbon energy, with 88% (69–97%) of primary energy coming from low-carbon sources by 2100. {3.4}
Stringent emissions reductions at the level required for 2°C or 1.5°C are achieved through the increased electrification of buildings, transport, and industry, consequently all pathways entail increased electricity generation (high confidence). Nearly all electricity in pathways limiting warming to 2°C (>67%) or 1.5°C (>50%) is also from low- or no-carbon technologies, with different shares across pathways of: nuclear, biomass, non-biomass renewables, and fossil fuels in combination with CCS. {3.4}
Measures required to limit warming to 2°C (>67%) or below can result in large-scale transformation of the land surface (high confidence). These pathways are projected to reach net zero CO2 emissions in the AFOLU sector between the 2020s and 2070.
Pathways limiting warming to 1.5°C with no or limited overshoot show an increase in forest cover of about 322 (–67 to 890) million ha in 2050 (high confidence). In these pathways the cropland area to supply biomass for bioenergy (including bioenergy with carbon capture and storage (BECCS)) is around 199 (56–482) million ha in 2050. The use of bioenergy can lead to either increased or reduced emissions, depending on the scale of deployment, conversion technology, fuel displaced, and how, and where, the biomass is produced ( high confidence). {3.4}
Pathways limiting warming to 2°C (>67%) or 1.5°C (>50%) require some amount of CDR to compensate for residual GHG emissions, even alongside substantial direct emissions reductions are achieved in all sectors and regions (high confidence). CDR deployment in pathways serves multiple purposes: accelerating the pace of emissions reductions, offsetting residual emissions, and creating the option for net negative CO2 emissions in case temperature reductions need to be achieved in the long term ( high confidence). CDR options in pathways are mostly limited to BECCS, afforestation and direct air CO2 capture and storage (DACCS). CDR through some measures in AFOLU can be maintained for decades but not over the very long term because these sinks will ultimately saturate ( high confidence). {3.4}
Mitigation pathways show reductions in energy demand, relative to reference scenarios that assume continuation of current policies, through a diverse set of demand-side interventions (high confidence). Bottom-up and non-IAM studies show significant potential for demand-side mitigation. A stronger emphasis on demand-side mitigation implies less dependence on CDR and, consequently, reduced pressure on land and biodiversity. {3.4, 3.7}
Limiting warming requires shifting energy investments away from fossil fuels and towards low-carbon technologies (high confidence). The bulk of investments are needed in medium- and low-income regions. Investment needs in the electricity sector are on average 2.3 trillion USD2015 yr –1 over 2023–2052 for pathways limiting temperature to 1.5°C (>50%) with no or limited overshoot, and 1.7 trillion USD2015 yr –1 for pathways limiting warming to 2°C (>67%). {3.6.1}
Pathways that avoid overshoot of 2°C (>67%) warming require more rapid near-term transformations and are associated with higher upfront transition costs, but at the same time bring long-term gains for the economy as well as earlier benefits in avoided climate change impacts (high confidence). This conclusion is independent of the discount rate applied, though the modelled cost-optimal balance of mitigation action over time does depend on the discount rate. Lower discount rates favour earlier mitigation, reducing reliance on CDR and temperature overshoot. {3.6.1, 3.8}
Mitigation pathwaysthat limit warming to 2°C (>67%) entail losses in global GDP with respect to reference scenarios of between 1.3% and 2.7% in 2050. In pathways limiting warming to 1.5°C (>50%) with no or limited overshoot, losses are between 2.6% and 4.2%. These estimates do not account for the economic benefits of avoided climate change impacts (medium confidence). In mitigation pathways limiting warming to 2°C (>67%), marginal abatement costs of carbon are about 90 (60–120) USD2015 tCO2 in 2030 and about 210 (140–340) USD2015/tCO2 in 2050. This compares with about 220 (170–290) USD2015 tCO2 in 2030 and about 630 (430–990) USD2015 tCO2 in 205018 in pathways that limit warming to 1.5°C (>50%) with no or limited overshoot. Reference scenarios, in the AR6 scenarios database, describe possible emission trajectories in the absence of new stringent climate policies. Reference scenarios have a broad range depending on socio-economic assumptions and model characteristics. {3.2.1, 3.6.1}
The global benefits of pathways limiting warming to 2°C (>67%) outweigh global mitigation costs over the 21st century, if aggregated economic impacts of climate change are at the moderate to high end of the assessed range, and a weight consistent with economic theory is given to economic impacts over the long term. This holds true even without accounting for benefits in other sustainable development dimensions or non-market damages from climate change (medium confidence). The aggregate global economic repercussions of mitigation pathways include: the macroeconomic impacts of investments in low-carbon solutions and structural changes away from emitting activities; co-benefits and adverse side effects of mitigation; avoided climate change impacts; and reduced adaptation costs. Existing quantifications of the global aggregate economic impacts show a strong dependence on socio-economic development conditions, as these shape exposure and vulnerability and adaptation opportunities and responses. Avoided impacts for poorer households and poorer countries represent a smaller share in aggregate economic quantifications expressed in GDP or monetary terms, whereas their well-being and welfare effects are comparatively larger. When aggregate economic benefits from avoided climate change impacts are accounted for, mitigation is a welfare-enhancing strategy ( high confidence). {3.6.2}
The economic benefits on human health from air quality improvement arising from mitigation action can be of the same order of magnitude as mitigation costs, and potentially even larger (medium confidence). {3.6.3}
Differences in aggregate employment between mitigation pathways and reference scenarios are relatively small, although there may be substantial reallocations across sectors, with job creation in some sectors and job losses in others (medium confidence). The net employment effect (and whether employment increases or decreases) depends on the scenario assumptions, modelling framework, and modelled policy design. Mitigation has implications for employment through multiple channels, each of which impacts geographies, sectors and skill categories differently. {3.6.4}
The economic repercussions of mitigation vary widely across regions and households, depending on policy design and the level of international cooperation (high confidence). Delayed global cooperation increases policy costs across regions, especially in those that are relatively carbon intensive at present ( high confidence). Pathways with uniform carbon values show higher mitigation costs in more carbon-intensive regions, in fossil fuel-exporting regions, and in poorer regions ( high confidence). Aggregate quantifications expressed in GDP or monetary terms undervalue the economic effects on households in poorer countries; the actual effects on welfare and well-being are comparatively larger ( high confidence). Mitigation at the speed and scale required to limit warming to 2°C (>67%) or below implies deep economic and structural changes, thereby raising multiple types of distributional concerns across regions, income classes, and sectors ( high confidence). (Box TS.7) {3.6.1, 3.6.4}
Box TS.6 | Understanding Net Zero CO2and Net Zero GHG Emissions
Reaching net zero CO2 emissions 19 globally along with reductions in other GHG emissions is necessary to halt global warming at any level. At the point of net zero, the amount of CO2 human activity is putting into the atmosphere equals the amount of CO2 human activity is removing from the atmosphere. Reaching and sustaining net zero CO2 emissions globally would stabilise CO2-induced warming. Moving to net negative CO2 emissions globally would reduce peak cumulative net CO2 emissions – which occurs at the time of reaching net zero CO2 emissions – and lead to a peak and decline in CO2-induced warming. {Cross-Chapter Box 3 in Chapter 3}
Reaching net zero CO2 emissions sooner can reduce cumulative CO2 emissions and result in less human-induced global warming. Overall human-induced warming depends not only on CO2 emissions but also on the contribution from other anthropogenic climate forcers, including aerosols and other GHGs (e.g., CH4 and F-gases). To halt total human-induced warming, emissions of other GHGs, in particular CH4, need to be strongly reduced.
In the AR6 scenario database, global emissions pathways limi warming to 1.5°C (>50%) with no or limited overshoot reach net zero CO2 emissions between 2050–2055 (2035–2070) (median and 5–95th percentile ranges; 100% of pathways); pathways limiting warming to 2°C (>67%) reach net zero CO2 emissions between 2070–2075 (2055–…) (median and 5–95th percentile ranges; 90% of pathways). This is later than assessed in the AR6 SR1.5 primarily due to more pathways in the literature that approach net zero CO2 emissions more gradually after a rapid decline of emissions until 2040. (Box TS.6, Figure 1)

Box TS.6, Figure1 | CO2 Emissions (panel (a)) and temperature change (panel (b)) of three alternative pathways limiting warming to 2°C (>67%) and reaching net zero CO2 emissions at different points in time. Limiting warming to a specific level can be consistent with a range of dates when net zero CO2 emissions need to be achieved. This difference in the date of net zero CO2 emissions reflects the different emissions profiles that are possible while staying within a specific carbon budget and the associated warming limit. Shifting the year of net zero to a later point in time (>2050), however, requires more rapid and deeper near-term emissions reductions (in 2030 and 2040) if warming is to be limited to the same level. Funnels show pathways limiting warming to 1.5°C (>50%) with no or limited overshoot (light blue) and limiting warming to 2°C (>67%) (beige).
It does not mean that the world has more time for emissions reductions while still limiting warming to 1.5°C than reported in the SR1.5. It only means that the exact timing of reaching net zero CO2 after a steep decline of CO2 emissions until 2040 can show some variation. The SR1.5 median value of 2050 is still close to the middle of the current range. If emissions are reduced less rapidly in the period up to 2030, an earlier net zero year is needed.
Reaching net zero GHG emissions requires net negative CO2 emissions to balance residual CH4, N2O and F-gas emissions. If achieved globally, net zero GHG emissions would reduce global warming from an earlier peak. Around half global emission pathways limiting warming to 1.5°C (>50%), and a third of pathways limiting warming to 2°C (>67%), reach net zero GHG emissions (based on GWP100) in the second half of the century, around 10 to 40 years later than net zero CO2 emissions. They show warming being halted at some peak value followed by a gradual decline towards the end of the century. The remainder of the pathways do not reach net zero GHG emissions during the 21st century and show little decline of warming after it stabilised.
Global net zero CO2 or GHG emissions can be achieved even while some sectors and regions continue to be net emitters, provided that others achieve net GHG removal. Sectors and regions have different potentials and costs to achieve net zero or even net GHG removal. The adoption and implementation of net zero emission targets by countries and regions depends on multiple factors, including equity and capacity criteria and international and cross-sectoral mechanisms to balance emissions and removals. The formulation of net zero pathways by countries will benefit from clarity on scope, plans of action, and fairness. Achieving net zero emission targets relies on policies, institutions and milestones against which to track progress.
Box TS.7 | The Long-term Economic Benefits of Mitigation from Avoided Climate Change Impacts
Integrated studies use either a cost-effectiveness analysis (CEA) approach (minimising the total mitigation costs of achieving a given policy goal) or a cost-benefit analysis (CBA) approach (balancing the cost and benefits of climate action). In the majority of studies that have produced the body of work on the cost of mitigation assessed in this report, a CEA approach is adopted, and the feedbacks of climate change impacts on the economic development pathways are not accounted for. This omission of climate impacts leads to overly optimistic economic projections in the reference scenarios, in particular in reference scenarios with no or limited mitigation action where the extent of global warming is the greatest. Mitigation cost estimates computed against no or limited policy reference scenarios therefore omit economic benefits brought by avoided climate change impact along mitigation pathways. {1.7, 3.6.1}
The difference in aggregate economic impacts from climate change between two given temperature levels represents the aggregate economic benefits arising from avoided climate change impacts due to mitigation action. Estimates of these benefits vary widely, depending on the methodology used and impacts included, as well as on assumed socio-economic development conditions, which shape exposure and vulnerability. The aggregate economic benefits of avoiding climate impacts increase with the stringency of the mitigation. Global economic impact studies with regional estimates find large differences across regions, with developing and transitional economies typically more vulnerable. Furthermore, avoided impacts for poorer households and poorer countries represent a smaller share in aggregate quantifications expressed in GDP terms or monetary terms, compared to their influence on well-being and welfare ( high confidence). {3.6.2, Cross-Working Group Box 1 in Chapter 3}
CBA analysis and CBA integrated assessment models (IAMs) remain limited in their ability to represent all damages from climate change, including non-monetary damages, and capture the uncertain and heterogeneous nature of damages and the risk of catastrophic damages, such that other lines of evidence should be considered in decision-making. However, emerging evidence suggests that, even without accounting for co-benefits of mitigation on other sustainable development dimensions, the global benefits of pathways limiting warming to 2°C (>67%) outweigh global mitigation costs over the 21st century (medium confidence). Depending on the study, the reason for this result lies in assumptions of economic damages from climate change in the higher end of available estimates, in the consideration of risks of tipping points or damages to natural capital and non-market goods, or in the combination of updated representations of carbon cycle and climate modules, updated damage estimates and updated representations of economic and mitigation dynamics. In the studies that perform a sensitivity analysis, this result is found to be robust to a wide range of assumptions on social preferences (in particular on inequality aversion and pure rate of time preference), and holds except if assumptions of economic damages from climate change are in the lower end of available estimates and the pure rate of time preference is in the higher range of values usually considered (typically above 1.5%). However, although such pathways bring overall net benefits over time (in terms of aggregate discounted present value), they involve distributional consequences between and within generations. {3.6.2}
TS.5 Mitigation Responses in Sectors and Systems
Chapters 5 to 12 assess recent advances in knowledge in individual sectors and systems. These chapters –Energy (Chapter 6), Urban and Other Settlements (Chapter 8), Transport (Chapter 10), BuildingsChapter 9), Industry (Chapter 11), and Agriculture, Forestry and Other Land Use (AFOLU) (Chapter 7)– correspond broadly to the IPCC National Greenhouse Gas Inventory reporting categories and build on similar chapters in previous WGIII reports. Chapters 5 and 12 tie together the cross-sectoral aspects of this group of chapters including the assessment of costs and potentials, demand-side aspects of mitigation, and carbon dioxide removal (CDR).
TS.5.1 Energy
A broad-based approach to deploying energy-sector mitigation options can reduce emissions over the next ten years and set the stage for still deeper reductions beyond 2030 (high confidence). There are substantial, cost-effective opportunities to reduce emissions rapidly, including in electricity generation, but near-term reductions will not be sufficient to limit warming to 2°C (>67%) or limit warming to 1.5°C (>50%) with no or limited overshoot. {6.4, 6.6, 6.7}
Warming cannot be limited to 2°C or 1.5°C without rapid and deep reductions in energy system CO2and GHG emissions (high confidence). In scenarios limiting warming to 1.5°C (>50%) with no or limited overshoot (likely below 2°C), net energy system CO2 emissions fall by 87–97% (interquartile range 60–79%) in 2050. In 2030, in scenarios limiting warming to 1.5°C with no or limited overshoot, net CO2 and GHG emissions fall by 35–51% and 38–52% respectively. In scenarios limiting warming to 1.5°C with no or limited overshoot (likely below 2°C), net electricity sector CO2 emissions reach zero globally between 2045 and 2055 (2050 and 2080) ( high confidence). {6.7}
Limiting warming to 2°C or 1.5°C will require substantial energy system changes over the next 30 years. This includes reduced fossil fuel consumption, increased production from low- and zero-carbon energy sources, and increased use of electricity and alternative energy carriers (high confidence). Coal consumption without CCS falls by 67–82% (interquartile range) in 2030 in scenarios limiting warming to 1.5°C with no or limited overshoot. Oil and gas consumption fall more slowly. Low-carbon sources produce 93–97% of global electricity by 2050 in scenarios that limit warming to 2°C (>67%) or below. In scenarios limiting warming to 1.5°C with no or limited overshoot (likely below 2°C), electricity supplies 48–58% (36–47%) of final energy in 2050, up from 20% in 2019. {6.7}
Net zero energy systems will share common characteristics, but the approach in every country will depend on national circumstances (high confidence). Common characteristics of net-zero energy systems will include: (i) electricity systems that produce no net CO2 or remove CO2 from the atmosphere; (ii) widespread electrification of end uses, including light-duty transport, space heating, and cooking; (iii) substantially lower use of fossil fuels than today; (iv) use of alternative energy carriers such as hydrogen, bioenergy, and ammonia to substitute for fossil fuels in sectors less amenable to electrification; (v) more efficient use of energy than today; (vi) greater energy system integration across regions and across components of the energy system; and (vii) use of CO2 removal including DACCS and BECCS to offset residual emissions. {6.6}
Energy demands and energy sector emissions have continued to rise (high confidence). From 2015 to 2019, global final energy consumption grew by 6.6%, CO2 emissions from the global energy system grew by 4.6%, and total GHG emissions from energy supply rose by 2.7%. Fugitive CH4 emissions from oil, gas, and coal, accounted for 18% of GHG emissions in 2019. Coal electricity capacity grew by 7.6% between 2015 and 2019, as new builds in some countries offset declines in others. Total consumption of oil and oil products increased by 5%, and natural gas consumption grew by 15%. Declining energy intensity in almost all regions has been balanced by increased energy consumption. {6.3}
The unit costs for several key energy system mitigation options have dropped rapidly over the last five years, notably solar PV, wind power, and batteries (high confidence). From 2015 to 2020, the costs of electricity from PV and wind dropped 56% and 45%, respectively, and battery prices dropped by 64%. Electricity from PV and wind is now cheaper than electricity from fossil sources in many regions, electric vehicles are increasingly competitive with internal combustion engines, and large-scale battery storage on electricity grids is increasingly viable. (Figure TS.7) {6.3, 6.4}
Global wind and solar PV capacity and generation have increased rapidly driven by policy, societal pressure to limit fossil generation, low interest rates, and cost reductions (high confidence). Solar PV grew by 170% (to 680 TWh); wind grew by 70% (to 1420 TWh) from 2015 to 2019. Solar PV and wind together accounted for 21% of total low-carbon electricity generation and 8% of total electricity generation in 2019. Nuclear generation grew 9% between 2015 and 2019 and accounted for 10% of total generation in 2019 (2790 TWh); hydro-electric power grew by 10% and accounted for 16% (4290 TWh) of total generation. In total, low- and zero-carbon electricity generation technologies produced 37% of global electricity in 2019. {6.3, 6.4}
If investments in coal and other fossil infrastructure continue, energy systems will be locked-in to higher emissions, making it harder to limit warming to 2°C or 1.5°C (high confidence). Many aspects of the energy system – physical infrastructure; institutions, laws, and regulations; and behaviour – are resistant to change or take many years to change. New investments in coal-fired electricity without CCS are inconsistent with limiting warming to well below 2°C. {6.3, 6.7}
Limiting warming to 2°C or 1.5°C will strand fossil-related assets, including fossil infrastructure and unburned fossil fuel resources (high confidence). The economic impacts of stranded assets could amount to trillions of dollars. Coal assets are most vulnerable over the coming decade; oil and gas assets are more vulnerable toward mid-century. CCS can allow fossil fuels to be used longer, reducing potential stranded assets. (Box TS.8) {6.7}
Box TS.8 | Stranded Assets
Limiting warming to 2°C or 1.5°C is expected to result in the ‘stranding’ of carbon-intensive assets. Stranded assets can be broadly defined as assets which ‘suffer from unanticipated or premature write-offs, downward revaluations or conversion to liabilities’. Climate policies, other policies and regulations, innovation in competing technologies, and shifts in fuel prices could all lead to stranded assets. The loss of wealth from stranded assets would create risks for financial market stabilityand reduce fiscal revenue for hydrocarbon-dependent economies, which in turn could affect macroeconomic stability and the prospects for a Just Transition. (Box TS.4) {6.7, 15.6, Chapter 17}
Two types of assets are at risk of being stranded: (i) in-ground fossil resources and (ii) human-made capital assets (e.g., power plants and cars). About 30% of oil, 50% of gas, and 80% of coal reserves will remain unburnable if warming is limited to 2°C. {6.7, Box 6.11}
Practically all long-lived technologies and investments that cannot be adapted to low-carbon and zero-emission modes could face stranding under climate policy – depending on their current age and expected lifetimes. Scenario evidence suggests that without carbon capture, the worldwide fleet of coal- and gas power plants would need to retire about 23 and 17 years earlier than expected lifetimes, respectively, in order to limit global warming to 1.5°C and 2°C {2.7}. Blast furnaces and cement factories without CCS {11.4}, new fleets of airplanes and internal combustion engine vehicles {10.4, 10.5}, and new urban infrastructures adapted to sprawl and motorisation may also be stranded. {Chapter 8; Box 10.1}
Many countries, businesses, and individuals stand to lose wealth from stranded assets. Countries, businesses, and individuals may therefore desire to keep assets in operation even if financial, social, or environmental concerns call for retirement. This creates political economic risks, including actions by asset owners to hinder climate policy reform {6.7; Box 6.11}. It will be easier to retire these assets if the risks are communicated, if sustainability reporting is mandated and enforced, and if corporations are protected with arrangements that shield them from short-term shareholder value maximisation.
Without early retirements, or reductions in utilisation, the current fossil infrastructure will emit more GHGs than is compatible with limiting warming to 1.5°C {2.7}. Including the pipeline of planned investments would push these future emissions into the uncertainty range of 2°C carbon budgets {2.7}. Continuing to build new coal-fired power plants and other fossil infrastructure will increase future transition costs and may jeopardise efforts to limit warming to 2°C (>67%) or 1.5°C with no or limited overshoot. One study has estimated that USD11.8 trillion in current assets will need to be stranded by 2050 for a 2°C world; further delaying action for another 10 years would result in an additional USD7.7 trillion in stranded assets by 2050. {15.5.2}
Experience from past stranding indicates that compensation for the devaluation costs of private-sector stakeholders by the public sector is common. Limiting new investments in fossil technologies hence also reduces public finance risks in the long term. {15.6.3}
A low-carbon energy transition will shift investment patterns and create new economic opportunities (high confidence). Total energy investment needs will rise, relative to today, over the next decades, if warming is limited to 2°C or lower (>67%), or if warming is limited to 1.5°C (>50%) with no or limited overshoot. These increases will be far less pronounced, however, than the reallocations of investment flows that are anticipated across subsectors, namely from fossil fuels (extraction, conversion, and electricity generation) without CCS and toward renewables, nuclear power, CCS, electricity networks and storage, and end-use energy efficiency. A significant and growing share of investments between now and 2050 will be made in emerging economies, particularly in Asia. {6.7}
Climate change will affect many future local and national low-carbon energy systems. The impacts, however, are uncertain, particularly at the regional scale (high confidence). Climate change will alter hydropower production, bioenergy and agricultural yields, thermal power plant efficiencies, and demands for heating and cooling, and it will directly impact power system infrastructure. Climate change will not affect wind and solar resources to the extent that it would compromise their ability to reduce emissions. {6.5}
Electricity systems powered predominantly by renewables will be increasingly viable over the coming decades, but it will be challenging to supply the entire energy system with renewable energy (high confidence). Large shares of variable solar PV and wind power can be incorporated in electricity grids through batteries, hydrogen, and other forms of storage; transmission; flexible non-renewable generation; advanced controls; and greater demand-side responses. Because some applications (e.g., aviation) are not currently amenable to electrification, it is anticipated that 100% renewable energy systems will need to include alternative fuels such as hydrogen or biofuels. Economic, regulatory, social, and operational challenges increase with higher shares of renewable electricity and energy. The ability to overcome these challenges in practice is not fully understood. (Box TS.9) {6.6}
Box TS.9 | The Transformation in Energy Carriers: Electrification and Hydrogen
To use energy, it must be ‘carried’ from where it was produced – at a power plant, for example, or a refinery, or a coal mine – to where it is used. As countries reduce CO2 emissions, they will need to switch from gasoline and other petroleum-based fuels, natural gas, coal, and electricity produced from these fossil fuels to energy carriers with little or no carbon footprint. An important question is which new energy carriers will emerge to support low-carbon transitions.
Low-carbon energy systems are expected to rely heavily on end-use electrification, where electricity produced with low GHG emissions is used for building and industrial heating, transport and other applications that rely heavily on fossil fuels at present. But not all end-uses are expected to be commercially electrifiable in the short to medium term {11.3.5}, and many will require low GHG liquid and gaseous fuels, that is, hydrogen, ammonia, and biogenic and synthetic low GHG hydrocarbons made from low GHG hydrogen, oxygen and carbon sources (the latter from CCU, 20 biomass, or direct air capture {11.3.6}). The future role of hydrogen and hydrogen derivatives will depend on how quickly and how far production technology improves, that is, from electrolysis (‘green’), biogasification, and fossil fuel reforming with CCS (‘blue’) sources. As a general rule, and across all sectors, it is more efficient to use electricity directly and avoid the progressively larger conversion losses from producing hydrogen, ammonia, or constructed low GHG hydrocarbons. What hydrogen does do, however, is add time and space option value to electricity produced using variable clean sources, for use as hydrogen, as stored future electricity via a fuel cell or turbine, or as an industrial feedstock. Furthermore, electrification and hydrogen involve a symbiotic range of general-purpose technologies, such as electric motors, power electronics, heat pumps, batteries, electrolysis, fuel cells, and so on, that have different applications across sectors but cumulative economies of innovation and production scale benefits. Finally, neither electrification nor hydrogen produce local air pollutants at point of end-use.
For almost 140 years we have primarily produced electricity by burning coal, oil, and gas to drive steam turbines connected to electricity generators. When switching to low-carbon energy sources – renewable sources, nuclear power, and fossil or bioenergy with CCS – electricity is expected to become a more pervasive energy carrier. Electricity is a versatile energy carrier, with much higher end-use efficiencies than fuels, and it can be used directly to avoid conversion losses.
An increasing reliance on electricity from variable renewable sources, notably wind and solar power, disrupts old concepts and makes many existing guidelines obsolete for power system planning, for example, that specific generation types are needed for baseload, intermediate load, and peak load to follow and meet demand. In future power systems with high shares of variable electricity from renewable sources, system planning and markets will focus more on demand flexibility, grid infrastructure and interconnections, storage on various timelines (on the minute, hourly, overnight and seasonal scale), and increased coupling between the energy sector and the building, transport and industrial sectors. This shifts the focus to energy systems that can handle variable supply rather than always follow demand. Hydrogen may prove valuable to improve the resilience of electricity systems with high penetration of variable renewable electricity. Flexible hydrogen electrolysis, hydrogen power plants and long-duration hydrogen storage may all improve resilience. Electricity-to-hydrogen-to-electricity round-trip efficiencies are projected to reach up to 50% by 2030. {6.4.3}
Electrification is expected to be the dominant strategy in buildings as electricity is increasingly used for heating and for cooking. Electricity will help to integrate renewable energy into buildings and will also lead to more flexible demand for heating, cooling, and electricity. District heating and cooling offers potential for demand flexibility through energy storage and supply flexibility through cogeneration. Heat pumps are increasingly used in buildings and industry for heating and cooling {9.3.3, Box 9.3}. The ease of switching to electricity means that hydrogen is not expected to be a dominant pathway for buildings {Box 9.6}. Using electricity directly for heating, cooling and other building energy demand is more efficient than using hydrogen as a fuel, for example, in boilers or fuel cells. In addition, electricity distribution is already well developed in many regions compared to essentially non-existent hydrogen infrastructure, except for a few chemicals industry pipelines. At the same time, hydrogen could potentially be used for on-site storage should technology advance sufficiently.
Electrification is already occurring in several modes of personal and light-freight transport, and vehicle-to-grid solutions for flexibility have been extensively explored in the literature and small-scale pilots. The role of hydrogen in transport depends on how far technology develops. Batteries are currently a more attractive option than hydrogen and fuel cells for light-duty vehicles. Hydrogen and hydrogen-derived synthetic fuels, such as ammonia and methanol, may have a more important role in heavy vehicles, shipping, and aviation {10.3}. Current transport of fossil fuels may be replaced by future transport of hydrogen and hydrogen carriers such as ammonia and methanol, or energy-intensive basic materials processed with hydrogen (e.g., reduced iron) in regions with bountiful renewable resources. {Box 11.1}
Both light and heavy industry are potentially large and flexible users of electricity for both final energy use (e.g., directly and using heat pumps in light industry) and for feedstocks (e.g., hydrogen for steel-making and chemicals). For example, industrial process heat demand, ranging from below 100°C to above 1000°C, can be met through a wide range of electrically powered technologies instead of using fuels. Future demand for hydrogen (e.g., for nitrogen fertiliser or as a reduction agent in steel production) also offers electricity-demand flexibility for electrolysis through hydrogen storage and flexible production cycles {11.3.5}. The main use of hydrogen and hydrogen carriers in industry is expected to be as feedstock (e.g., for ammonia and organic chemicals) rather than for energy as industrial electrification increases.
Multiple energy supply options are available to reduce emissions over the next decade (high confidence). Nuclear power and hydropower are already established technologies. Solar PV and wind are now cheaper than fossil-generated electricity in many locations. Bioenergy accounts for about a tenth of global primary energy. Carbon capture is widely used in the oil and gas industry, with early applications in electricity production and biofuels. It will not be possible to widely deploy all of these and other options without efforts to address the geophysical, environmental-ecological, economic, technological, socio-cultural, and institutional factors that can facilitate or hinder their implementation ( high confidence). (Figures TS.11 and TS.31) {6.4}
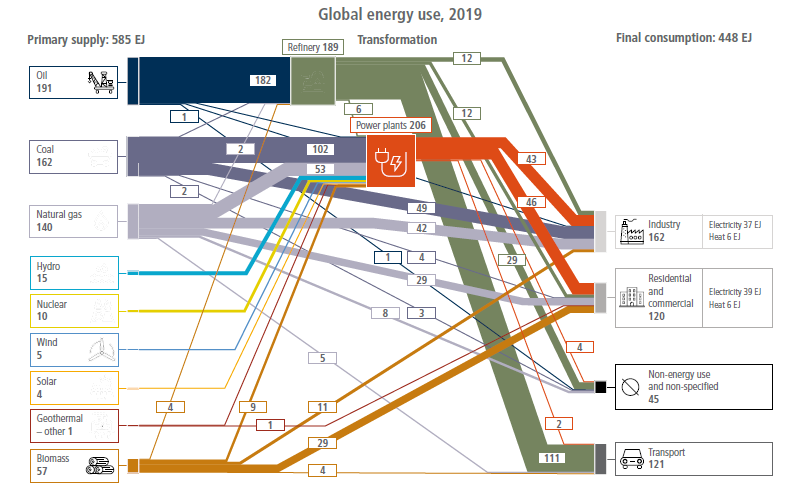
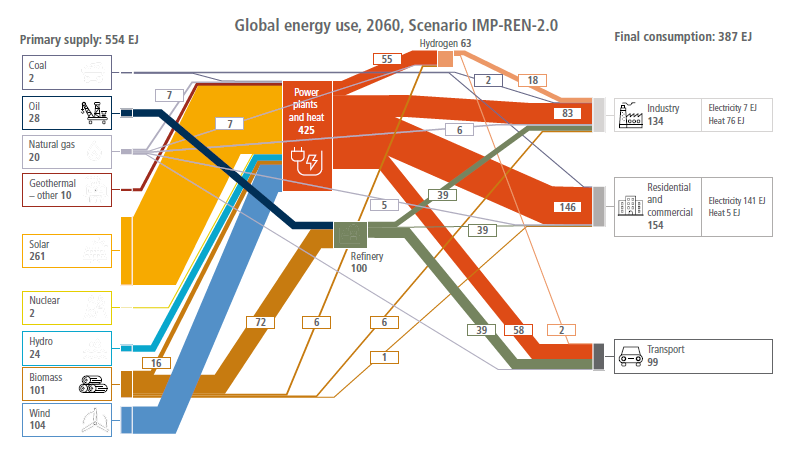

Figure TS.11 continued: Global energy flows within the 2019 global energy system (top panel) and within two illustrative future, net-zero CO2 emissions global energy system (bottom panels). Source: IEA, AR6 Scenarios Database. Flows below 1 EJ are not represented. The illustrative net-zero scenarios correspond to the years in which net energy system CO2 emissions reach zero – 2045 in IMP-Ren and 2060 in IMP-Neg-2.0. Source: data from IMP-Ren: Luderer et al.(2022); IMP-Neg-2.0: Riahi, K. et al. 2021.
Enhanced integration across energy system sectors and across scales will lower costs and facilitate low-carbon energy system transitions (high confidence). Greater integration between the electricity sector and end-use sectors can facilitate integration of variable renewable energy options. Energy systems can be integrated across district, regional, national, and international scales ( high confidence). {6.4, 6.6}
The viable speed and scope of a low-carbon energy system transition will depend on how well it can support SDGs and other societal objectives (high confidence). Energy systems are linked to a range of societal objectives, including energy access, air and water pollution, health, energy security, water security, food security, economic prosperity, international competitiveness, and employment. These linkages and their importance vary among regions. Energy-sector mitigation and efforts to achieve SDGs generally support one another, though there are important region-specific exceptions ( high confidence). (Figure TS.29) {6.1, 6.7}
The economic outcomes of low-carbon transitions in some sectors and regions may be on par with, or superior to those of an emissions-intensive future (high confidence). Cost reductions in key technologies, particularly in electricity and light-duty transport, have increased the economic attractiveness of near-term low-carbon transitions. Long-term mitigation costs are not well understood and depend on policy design and implementation, and the future costs and availability of technologies. Advances in low-carbon energy resources and carriers such as next-generation biofuels, hydrogen produced from electrolysis, synthetic fuels, and carbon-neutral ammonia would substantially improve the economics of net zero energy systems (medium confidence). {6.4, 6.7}
TS.5.2 Urban Systems and Other Settlements
Although urbanisation is a global trend often associated with increased incomes and higher consumption, the growing concentration of people and activities is an opportunity to increase resource efficiency and decarbonise at scale (very high confidence). The same urbanisation level can have large variations in per-capita urban carbon emissions. For most regions, per-capita urban emissions are lower than per-capita national emissions (excluding aviation, shipping and biogenic sources) (very high confidence). {8.1.4, 8.3.3, 8.4, Box 8.1}
Most future urban population growth will occur in developing countries, where per-capita emissions are currently low, but are expected to increase with the construction and use of new infrastructure, and the built environment, and changes in incomes and lifestyles (very high confidence). The drivers of urban GHG emissions are complex and include an interplay of population size, income, state of urbanisation, and how cities are laid out (i.e., urban form). How new cities and towns are designed, constructed, managed, and powered will lock-in behaviour, lifestyles, and future urban GHG emissions. Urban strategies can improve well-being while minimising impact on GHG emissions. However, urbanisation can result in increased global GHG emissions through emissions outside the city’s boundaries (very high confidence). {8.1.4, 8.3, Box 8.1, 8.4, 8.6}
The urban share of combined global CO2 and CH4) emissions is substantial and continues to increase (high confidence). In 2015, urban emissions were estimated to be 25GtCO2-eq (about 62% of the global share) and in 2020 were 29 GtCO2-eq (67–72% of the global share). 21 Around 100 of the highest-emitting urban areas account for approximately 18% of the global carbon footprint ( high confidence). {8.1, 8.3}
The urban share of regional GHG emissions increased between 2000 and 2015, with much inter-regional variation in the magnitude of the increase (high confidence). Globally, the urban share of national emissions increased six percentage points, from 56% in 2000 to 62% in 2015. For 2000 to 2015, the urban emissions share increased from 28% to 38% in Africa, from 46% to 54% in Asia and Pacific, from 62% to 72% in Developed Countries, from 57% to 62% in Eastern Europe and West Central Asia, from 55% to 66% in Latin America and Caribbean, and from 68% to 69% in the Middle East ( high confidence). {8.1.6, 8.3.3}
Per-capita urban GHG emissions increased between 2000 and 2015, with cities in developed countries accounting for nearly seven times more per capita than the lowest emitting region (medium confidence). From 2000 to 2015, global urban GHG emissions per capita increased from 5.5 to 6.2 tCO2-eq per person (an increase of 11.8%). Emissions in Africa increased from 1.3 to 1.5 tCO2-eq per person (22.6%); in Asia and Pacific from 3.0 to 5.1 tCO2-eq per person (71.7%); in Eastern Europe and West Central Asia from 6.9 to 9.8 tCO2-eq per person (40.9%); in Latin America and the Caribbean from 2.7 to 3.7 tCO2-eq per person (40.4%); and in the Middle East from 7.4 to 9.6 tCO2-eq per person (30.1%). Albeit starting from the highest level, developed countries showed a modest decline of 11.4 to 10.7 tCO2-eq per person (–6.5%). (Figure TS.12) {8.3.3}

Figure TS.12 | Changes in six metrics associated with urban and national-scale combined CO2and CH4 emissions represented in the AR6 WGIII six-region aggregation, with (a) 2000 and (b) 2015. The trends in Luqman et al. (2021) were combined with the work of Moran et al. (2018) to estimate the regional urban CO2-eq share of global urban emissions, the urban share of national CO2-eq emissions, and the urban per capita CO2-eq emissions by region. This estimate is derived from consumption-based accounting that includes both direct emissions from within urban areas and indirect emissions from outside urban areas related to the production of electricity, goods, and services consumed in cities. It incorporates all CO2 and CH4 emissions except aviation, shipping and biogenic sources (i.e., land-use change, forestry, and agriculture). The dashed grey line represents the global average urban per capita CO2-eq emissions. The regional urban population share, regional CO2-eq share in total emissions, and national per capita CO2-eq emissions by region are given for comparison. Source: adapted from Gurney et al. (2022).
The global share of future urban GHG emissions is expected to increase through 2050 with moderate to low mitigation efforts due to growth trends in population, urban land expansion, and infrastructure and service demands, but the extent of the increase depends on the scenario and the scale and timing of urban mitigation action (medium confidence). 22 In modelled scenarios, global consumption-based urban CO2 and CH4 emissions are projected to rise from 29 GtCO2-eq in 2020 to 34 GtCO2-eq in 2050 with moderate mitigation efforts (intermediate GHG emissions, SSP2-4.5), and up to 40 GtCO2-eq in 2050 with low mitigation efforts (high GHG emissions, SSP 3-7.0). With aggressive and immediate mitigation efforts to limit global warming to 1.5°C (>50%) with no or limited overshoot by the end of the century (very low emissions, SSP1-1.9), including high levels of electrification, energy and material efficiency, renewable energy preferences, and socio-behavioural responses, urban GHG emissions could approach net-zero and reach a maximum of 3 GtCO2-eq in 2050. Under a scenario with aggressive but not immediate urban mitigation policies to limit global warming to 2°C (>67%) (low emissions, SSP1-2.6), urban emissions could reach 17 GtCO2-eq in 2050. 23 (Figure TS.13) {8.3.4}
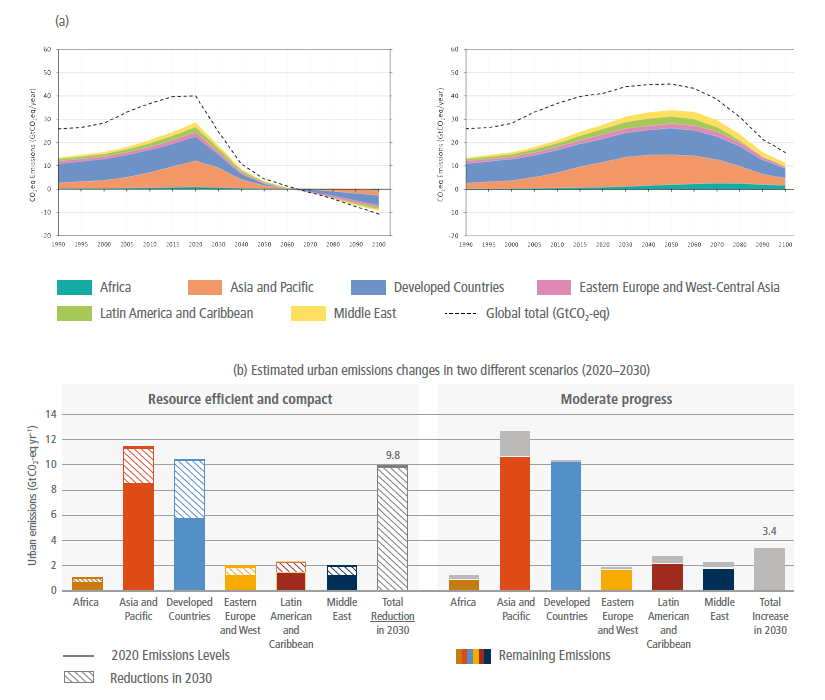
FigureTS.13 | Panel (a): carbon dioxide-equivalent emissions from global urban areas from 1990 to 2100. Urban areas are aggregated to six regional domains; Panel (b): comparison of urban emissions under different urbanisation scenarios (GtCO2-eq yr–1) for different regions. 21{Figures 8.13 and 8.14}
Urban land areas could triple between 2015 and 2050, with significant implications for future carbon lock-in (medium confidence). There is a large range in the forecasts of urban land expansion across scenarios and models, which highlights an opportunity to shape future urban development towards low- or net zero GHG emissions. By 2050, urban areas could increase up to 211% over the 2015 global urban extent, with the median projected increase ranging from 43% to 106%. While the largest absolute amount of new urban land is forecasted to occur in Asia and Pacific, and in Developed Countries, the highest rate of urban land growth is projected to occur in Africa, Eastern Europe and West Central Asia, and in the Middle East. Given past trends, the expansion of urban areas is expected to take place on agricultural lands and forests, with implications for the loss of carbon stocks. The infrastructure that will be constructed concomitant with urban land expansion will lock-in patterns of energy consumption that will persist for decades. {8.3.1, 8.3.4, 8.4.1, 8.6}
The construction of new, and upgrading of existing, urban infrastructure through 2030 will add to emissions (medium evidence, high agreement). The construction of new and upgrading of existing urban infrastructure using conventional practices and technologies can result in a significant increase in CO2 emissions, ranging from 8.5 GtCO2 to 14 GtCO2 annually up to 2030 and more than double annual resource requirements for raw materials to about 90 billion tonnes per year by 2050, up from 40 billion tonnes in 2010. {8.4.1, 8.6}
Given the dual challenges of rising urban GHG emissions and future projections of more frequent extreme climate events, there is an urgent need to integrate urban mitigation and adaptation strategies for cities to address climate change (very high confidence). Mitigation strategies can enhance resilience against climate change impacts while contributing to social equity, public health, and human well-being. Urban mitigation actions that facilitate economic decoupling can have positive impacts on employment and local economic competitiveness. {8.2, Cross-Working Group Box 2 in Chapter 8, 8.4}
Cities can achieve net-zero GHG emissions only through deep decarbonisation and systemic transformation (very high confidence). Three broad mitigation strategies have been found to be effective in reducing emissions when implemented concurrently: (i) reducing or changing urban energy and material use towards more sustainable production and consumption across all sectors, including through compact and efficient urban forms and supporting infrastructure; (ii) electrification and switching to low-carbon energy sources; and (iii) enhancing carbon uptake and storage in the urban environment ( high confidence). Given the regional and global reach of urban supply chains, cities can achieve net-zero emissions only if emissions are reduced both within and outside of their administrative boundaries through supply chains. {8.1.6, 8.3.4, 8.4, 8.6}
Packages of mitigation policies that implement multiple urban-scale interventions can have cascading effects across sectors, reduce GHG emissions outside a city’s administrative boundaries, and reduce emissions more than the net sum of individual interventions, particularly if multiple scales of governance are included (high confidence). Cities have the ability to implement policy packages across sectors using an urban systems approach, especially those that affect key infrastructure based on spatial planning, electrification of the urban energy system, and urban green and blue infrastructure. The institutional capacity of cities to develop, coordinate, and integrate sectoral mitigation strategies within their jurisdiction varies by context, particularly those related to governance, the regulatory system, and budgetary control. {8.4, 8.5, 8.6}
Integrated spatial planning to achieve compact and resource-efficient urban growth through co-location of higher residential and job densities, mixed land use, and transit-oriented development could reduce urban energy use between 23% and 26% by 2050 compared to the business-as-usual scenario (high confidence). Compact cities with shortened distances between housing and jobs, and interventions that support a modal shift away from private motor vehicles towards walking, cycling, and low-emissions shared, or public, transportation, passive energy comfort in buildings, and urban green infrastructure can deliver significant public health benefits and lower GHG emissions. {8.2, 8.3.4, 8.4, 8.6}
Urban green and blue infrastructure can mitigate climate change through carbon sinks, avoided emissions, and reduced energy use while offering multiple co-benefits (high confidence). Urban green and blue infrastructure, including urban forests and street trees, permeable surfaces, and green roofs 24 offer potentials to mitigate climate change directly through storing carbon, and indirectly by inducing a cooling effect that both reduces energy demand and reduces energy use for water treatment. Globally, urban trees store approximately 7.4 billion tonnes of carbon, and sequester approximately 217 million tonnes of carbon annually, although carbon storage is highly dependent on biome. Among the multiple co-benefits of green and blue infrastructure are reducing the urban heat island (UHI) effect and heat stress, reducing stormwater runoff, improving air quality, and improving the mental and physical health of urban dwellers. Many of these options also provide benefits to climate adaptation. ( high agreement, robust evidence) {8.2, 8.4.4}
The potential and sequencing of mitigation strategies to reduce GHG emissions will vary depending on a city’s land use, spatial form, development level, and state of urbanisation (i.e., whether it is an established city with existing infrastructure, a rapidly growing city with new infrastructure, or an emerging city with infrastructure buildup) (high confidence). New and emerging cities will have significant infrastructure development needs to achieve high quality of life, which can be met through energy-efficient infrastructures and services, and people-centred urban design (high confidence). The long lifespan of urban infrastructures locks in behaviour and committed emissions. Urban infrastructures and urban form can enable sociocultural and lifestyle changes that can significantly reduce carbon footprints. Rapidly growing cities can avoid higher future emissions through urban planning to co-locate jobs and housing to achieve compact urban form, and by leapfrogging to low-carbon technologies. Established cities will achieve the largest GHG emissions savings by replacing, repurposing, or retrofitting the building stock, targeted infilling and densifying, as well as through modal shift and the electrification of the urban energy system. New and emerging cities have unparalleled potential to become low or net zero GHG emissions while achieving high quality of life by creating compact, co-located, and walkable urban areas with mixed land use and transit-oriented design, that also preserve existing green and blue assets. {8.2, 8.4, 8.6}
With over 880 million people living in informal settlements, there are opportunities to harness and enable informal practices and institutions in cities related to housing, waste, energy, water, and sanitation to reduce resource use and mitigate climate change (low evidence, medium agreement). The upgrading of informal settlements and inadequate housing to improve resilience and well-being offers a chance to create a low-carbon transition. However, there is limited quantifiable data on these practices and their cumulative impacts on GHG emissions. {8.1.4, 8.2.2, Cross-Working Group Box 2 in Chapter 8, 8.3.2, 8.4, 8.6, 8.7}
Achieving transformational changes in cities for climate change mitigation and adaptation will require engaging multiple scales of governance, including governments and non-state actors, and in connection with substantial financing beyond sectoral approaches (very high confidence). Large and complex infrastructure projects for urban mitigation are often beyond the capacity of local municipality budgets, jurisdictions, and institutions. Partnerships between cities and international institutions, national and regional governments, transnational networks, and local stakeholders play a pivotal role in mobilising global climate finance resources for a range of infrastructure projects with low-carbon emissions and related spatial planning programs across key sectors. {8.4, 8.5}
TS.5.3 Transport
Meeting climate mitigation goals would require transformative changes in the transport sector. In 2019, direct GHG emissions from the transport sector were 8.7 GtCO2-eq (up from 5.0 GtCO2-eq in 1990) and accounted for 23% of global energy-related CO2 emissions. Road vehicles accounted for 70% of direct transport emissions, while 1%, 11%, and 12% of direct emissions came from rail, shipping, and aviation, respectively. Emissions from shipping and aviation continue to grow rapidly. Transport-related emissions in developing regions of the world have increased more rapidly than in Europe or North America, a trend that is expected to continue in coming decades ( high confidence). {10.1, 10.5, 10.6}
Since AR5 there has been a growing awareness of the need for demand management solutions combined with new technologies, such as the rapidly growing use of electromobility for land transport and the emerging options in advanced biofuels and hydrogen-based fuels for shipping and aviation and in other specific land-based contexts (high confidence). There is a growing need for systemic infrastructure changes that enable behavioural modifications and reductions in demand for transport services that can in turn reduce energy demand. The response to the COVID-19 pandemic has also shown that behavioural interventions can reduce transport-related GHG emissions. For example, COVID-19-based lockdowns have confirmed the transformative value of telecommuting replacing significant numbers of work and personal journeys as well as promoting local active transport. There are growing opportunities to implement strategies that drive behavioural change and support the adoption of new transport technology options. {Chapter 5, 10.2, 10.3, 10.4, 10.8}
Changes in urban form, behaviour programs, the circular economy, the shared economy, and digitalisation trends can support systemic changes that lead to reductions in demand for transport services or expand the use of more efficient transport modes (high confidence). Cities can reduce their transport-related fuel consumption by around 25% through combinations of more compact land use and the provision of less car-dependent transport infrastructure. Appropriate infrastructure, including protected pedestrian and bike pathways, can also support much greater localised active travel. 25 Transport demand management incentives are expected to be necessary to support these systemic changes. There is mixed evidence of the effect of circular economy initiatives, shared economy initiatives, and digitalisation on demand for transport services (Box TS.14). For example, while dematerialisation can reduce the amount of material that needs to be transported to manufacturing facilities, an increase in online shopping with priority delivery can increase demand for freight transport. Similarly, while teleworking could reduce travel demand, increased ride-sharing could increase vehicle kilometres travelled (VKT). {Chapters 1 and 5, 10.2, 10.8}
Battery electric vehicles (BEVs) have lower lifecycle greenhouse gas (GHG) emissions than internal combustion engine vehicles (ICEVs) when BEVs are charged with low-carbon electricity (high confidence). Electromobility is being rapidly implemented in micro-mobility (e-autorickshaws, e-scooters, e-bikes), in transit systems, especially buses, and to a lesser degree, in personal vehicles. BEVs could also have the added benefit of supporting grid operations. The commercial availability of mature lithium-ion batteries (LIBs) has underpinned this growth in electromobility. As global battery production increases, unit costs are declining. Further efforts to reduce the GHG footprint of battery production, however, are essential for maximising the mitigation potential of BEVs. The continued growth of electromobility for land transport would entail investments in electric charging and related grid infrastructure. Electromobility powered by low-carbon electricity has the potential to rapidly reduce transport GHG and can be applied with multiple co-benefits, especially in developing countries. {10.3, 10.4, 10.8}
Land-based, long-range, heavy-duty trucks can be decarbonised through battery-electric haulage (including the use of electric road systems), complemented by hydrogen- and biofuel-based fuels in some contexts. These same technologies and expanded use of available electric rail systems can support rail decarbonisation (medium confidence). Initial deployments of battery-electric, hydrogen- and bio-based haulage are underway, and commercial operations of some of these technologies are considered feasible by 2030 (medium confidence). These technologies nevertheless face challenges regarding driving range, capital and operating costs, and infrastructure availability. In particular, fuel-cell durability, high energy consumption, and costs continue to challenge the commercialisation of hydrogen-based fuel-cell vehicles. Increased capacity for low-carbon hydrogen production would also be essential for hydrogen-based fuels to serve as an emissions reduction strategy ( high confidence). (Box TS.15) {10.3, 10.4, 10.8}
Decarbonisation options for shipping and aviation still require R&D, though advanced biofuels, ammonia, and synthetic fuels are emerging as viable options (medium confidence). Increased efficiency has been insufficient to limit the emissions from shipping and aviation, and natural gas-based fuels are expected to be inadequate to meet stringent decarbonisation goals for these segments ( high confidence). High-energy density, low-carbon fuels are required, but they have not yet reached commercial scale. Advanced biofuels could provide low-carbon jet fuel (medium confidence). The production of synthetic fuels using low-carbon hydrogen with CO2 captured through DACCS/BECCS could provide jet and marine fuels but these options still require demonstration at scale (low confidence). Ammonia produced with low-carbon hydrogen could also serve as a marine fuel (medium confidence). Deployment of these fuels requires reductions in production costs. (Figure TS.14) {10.2, 10.3, 10.4, 10.5, 10.6, 10.8}
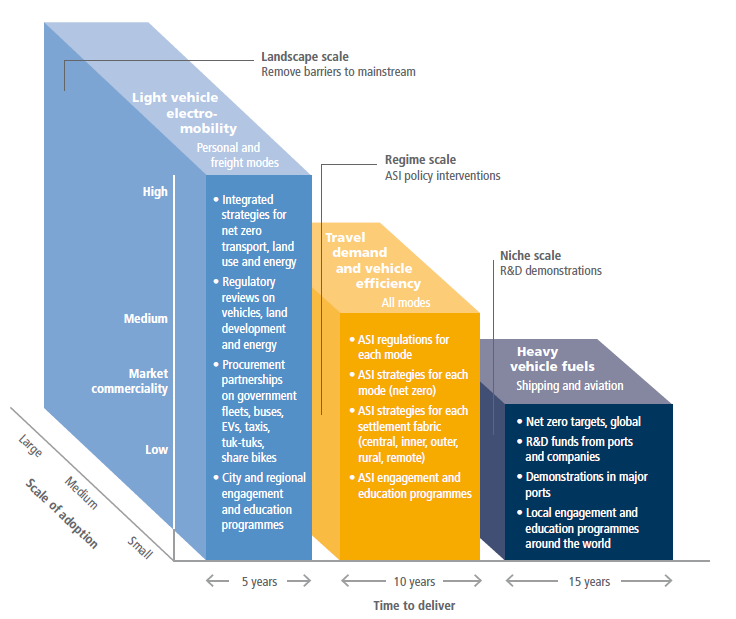
Figure TS.14 | Mitigation options and enabling conditions for transport. ‘Niche’ scale includes strategies that still require innovation. {Figure 10.22}ASI: Avoid-Shift-Improve; TRL: technology readiness level.
Scenarios from bottom-up and top-down models indicate that, without intervention, CO2 emissions from transport could grow in the range of 16% and 50% by 2050 (medium confidence). The scenarios literature projects continued growth in demand for freight and passenger services, particularly in developing countries in Africa and Asia ( high confidence). This growth is projected to take place across all transport modes. Increases in demand notwithstanding, scenarios that limit warming to 1.5°C degree with no or limited overshoot suggest that a 59% reduction (42–68% interquartile range) in transport-related CO2 emissions by 2050, compared to modelled 2020 levels is required. While many global scenarios place greater reliance on emissions reduction in sectors other than transport, a quarter of the 1.5°C scenarios describe transport-related CO2 emissions reductions in excess of 68% (relative to modelled 2020 levels) (medium confidence). Illustrative Mitigation Pathways IMP-Ren and IMP-LD (TS 4.2) describe emission reductions of 80% and 90% in the transport sector, respectively, by 2050. Transport-related emission reductions, however, may not happen uniformly across regions. For example, transport emissions from the Developed Countries, and Eastern Europe and West Central Asia countries decrease from 2020 levels by 2050 across all scenarios limiting global warming to 1.5°C by 2100, but could increase in Africa, Asia and Pacific (APC), Latin America and Caribbean, and the Middle East in some of these scenarios. {10.7}
The scenarios literature indicates that fuel and technology shifts are crucial in reducing carbon emissions to meet temperature goals (high confidence). In general terms, electrification tends to play the key role in land-based transport, but biofuels and hydrogen (and derivatives) could play a role in decarbonisation of freight in some contexts. Biofuels and hydrogen (and derivatives) are expected to be more prominent in shipping and aviation. The shifts towards these alternative fuels must occur alongside shifts towards clean technologies in other sectors. {10.7}
There is a growing awareness of the need to plan for the significant expansion of low-carbon energy infrastructure, including low-carbon power generation and hydrogen production, to support emissions reductions in the transport sector (high confidence). Integrated energy planning and operations that take into account energy demand and system constraints across all sectors (transport, buildings, and industry) offer the opportunity to leverage sectoral synergies and avoid inefficient allocation of energy resources. Integrated planning of transport and power infrastructure would be particularly useful in developing countries where ‘greenfield’ development doesn’t suffer from constraints imposed by legacy systems. {10.3, 10.4, 10.8}
The deployment of low-carbon aviation and shipping fuels that support decarbonisation of the transport sector could require changes to national and international governance structures (medium confidence). The UNFCCC does not specifically cover emissions from international shipping and aviation. Reporting emissions from international transport is at the discretion of each country. While the International Civil Aviation Organization (ICAO) and International Maritime Organization (IMO) have established emissions reductions targets, only strategies to improve fuel efficiency and demand reductions have been pursued, and there has been minimal commitment to new technologies. {10.5, 10.6, 10.7}
There are growing concerns about resource availability, labour rights, non-climate environmental impacts, and costs of critical minerals needed for lithium-ion batteries (medium confidence). Emerging national strategies on critical minerals and the requirements from major vehicle manufacturers are leading to new, more geographically diverse mines. The standardisation of battery modules and packaging within and across vehicle platforms, as well as increased focus on design for recyclability are important. Given the high degree of potential recyclability of lithium-ion batteries, a nearly closed-loop system in the future could mitigate concerns about critical mineral issues (medium confidence). {10.3, 10.8}
Legislated climate strategies are emerging at all levels of government, and together with pledges for personal choices, could spur the deployment of demand- and supply-side transport mitigation strategies (medium confidence). At the local level, legislation can support local transport plans that include commitments or pledges from local institutions to encourage behaviour change by adopting an organisational culture that motivates sustainable behaviour with inputs from the creative arts. Such institution-led mechanisms could include bike-to-work campaigns, free transport passes, parking charges, or eliminating car benefits. Community-based solutions such as solar sharing, community charging, and mobility as a service can generate new opportunities to facilitate low-carbon transport futures. At the regional and national levels, legislation can include vehicle and fuel efficiency standards, R&D support, and large-scale investments in low-carbon transport infrastructure. (Figure TS.14) {10.8, Chapter 15}
TS.5.4 Buildings
Global GHG emissions from buildings were 12 GtCO2-eq in 2019, equivalent to 21% of global GHG emissions. Of this, 57% (6.8 GtCO2-eq) were indirect emissions from off-site generation of electricity and heat, 24% (2.9 GtCO2-eq) were direct emissions produced on-site and 18% (2.2 GtCO2-eq) were embodied emissions from the production of cement and steel used in buildings (high confidence). Most building-sector emissions are CO2. Final energy demand from buildings reached 128 EJ globally in 2019 (around 31% of global final energy demand), and electricity demand from buildings was slightly above 43 EJ globally (around 18% of global electricity demand). Residential buildings consumed 70% (90 EJ) of the global final energy demand from buildings. Over the period 1990–2019, global CO2 emissions from buildings increased by 50%, global final energy demand from buildings grew by 38%, and global final electricity demand increased by 161%. {9.3}
In most regions, historical improvements in efficiency have been approximately matched by growth in floor area per capita (high confidence). At the global level, building-specific drivers of GHG emissions include: (i) population growth, especially in developing countries; (ii) increasing floor area per capita, driven by the increasing size of dwellings while the size of households kept decreasing, especially in developed countries; (iii) the inefficiency of newly constructed buildings, especially in developing countries, and the low renovation rates and low ambition level in developed countries when existing buildings are renovated; (iv) the increase in use, number and size of appliances and equipment, especially information and communication technologies (ICT) and cooling, driven by income; and, (v) the continued reliance on carbon-intensive electricity and heat. These factors taken together are projected to continue driving increased GHG emissions in the building sector in the future. {9.3, 9.6, 9.9}
Building-sector GHG emissions were assessed using the Sufficiency, Efficiency, Renewable (SER) framework. Sufficiency measures tackle the causes of GHG emissions by limiting the demand for energy and materials over the lifecycle of buildings and appliances (high confidence). In Chapter 9 of this report, sufficiency differs from efficiency: sufficiency is about long-term actions driven by non-technological solutions, which consume less energy in absolute terms; efficiency, in contrast is about continuous short-term marginal technological improvements. Sufficiency policies are a set of measures and daily practices that avoid demand for energy, materials, land and water while delivering human well-being-for-all within planetary boundaries. Use of the SER framework aims to reduce the cost of constructing and using buildings without reducing occupants’ well-being and comfort. {9.1, 9.4, 9.5, 9.9}
Sufficiency interventions do not consume energy during the use phase of buildings and do not require maintenance nor replacement over the lifetime of buildings. Density, compacity, bioclimatic design to optimise the use of nature-based solutions, multi-functionality of space through shared space and to allow for adjusting the size of buildings to the evolving needs of households, circular use of materials and repurposing unused existing buildings to avoid using virgin materials, optimisation of the use of buildings through lifestyle changes, use of the thermal mass of buildings to reduce thermal needs, and moving from ownership to usership of appliances, are among the sufficiency interventions implemented in leading municipalities ( high confidence). At a global level, up to 17% of the mitigation potential in the buildings sector could be captured by 2050 through sufficiency interventions (medium confidence). (Figure TS.15) {9.2, 9.3, 9.4, 9.5, 9.9}

Figure TS.15: Decompositions of changes in historical residential energy emissions 1990–2019, changes in emissions projected by baseline scenarios for 2020–2050, and differences between scenarios in 2050 using scenarios from three models: IEA, IMAGE, and RECC. RECC-LED data for (a) global, and (b) for nine world regions, include only space heating and cooling and water heating in residential buildings. Emissions are decomposed using the equation, which shows changes in driver variables of population, sufficiency (floor area per capita), efficiency (final energy per floor area), and renewables (GHG emissions per final energy). ‘Renewables’ is a summary term describing changes in GHG intensity of energy supply. Emission projections to 2050, and differences between scenarios in 2050, demonstrate mitigation potentials from the dimensions of the SER framework realised in each model scenario. In most regions, historical improvements in efficiency have been approximately matched by growth in floor area per capita. Implementing sufficiency measures that limit growth in floor area per capita, particularly in developed regions, reduces the dependence of climate mitigation on technological solutions. {Figure 9.5, Box 9.2}
The potential associated with sufficiency measures, as well as the replacement of appliances, equipment and lights by efficient ones, is below zero cost (high confidence). The construction of high-performance buildings is expected to become a business-as-usual technology by 2050 with costs below USD20 tCO2–1 in developed countries and below USD100 tCO2–1 in developing countries (medium confidence). For existing buildings, there have been many examples of deep retrofits where additional costs per CO2 abated are not significantly higher than those of shallow retrofits. However, for the whole building stock they tend to be in cost intervals of USD–200 tCO2–1 and >USD200 tCO2–1 (medium confidence). Literature emphasises the critical role of the 2020–2030 decade in accelerating the learning of know-how and skills to reduce the costs and remove feasibility constraints for achieving high-efficiency buildings at scale and set the sector on the pathway to realise its full potential ( high confidence). {9.3, 9.6, 9.9}.
The development, since AR5, of integrated approaches to the construction and retrofit of buildings has led to increasing the number of zero-energy or zero-carbon buildings in almost all climate zones. The complementarity and interdependency of measures leads to cost reductions, while optimising the mitigation potential achieved and avoiding the lock-in-effect (medium confidence). {9.6, 9.9}
The decarbonisation of buildings is constrained by multiple barriers and obstacles as well as limited finance flows (high confidence). The lack of institutional capacity, especially in developing countries, and appropriate governance structures slow down the decarbonisation of the global building stock (medium confidence). The building sector is highly heterogenous with many different building types, sizes, and operational uses. The sub-segment representing rented property faces principal/agent problems where the tenant benefits from the decarbonisation’s investment made by the landlord. The organisational context and the governance structure could trigger or hinder the decarbonisation of buildings. Global investment in the decarbonisation of buildings was estimated at USD164 billion in 2020. However, this is not enough by far to close the investment gap ( high confidence). {9.9}
Policy packages could grasp the full mitigation potential of the global building stock. Building energy codes represent the main regulatory instrument to reduce emissions from both new and existing buildings (high confidence). The most advanced building energy codes include requirements on each of the three pillars of the SER framework in the use and construction phase of buildings. Building energy codes have proven to be effective if compulsory and combined with other regulatory instruments such as minimum energy performance standard for appliances and equipment, if the performance level is set at the level of the best available technologies in the market ( high confidence). Market-based instruments such as carbon taxes with recycling of the revenues and personal or building carbon allowances could also contribute to fostering the decarbonisation of the building sector (medium confidence). {9.9}
Adapting buildings to future climate while ensuring well-being for all requires action. Expected heatwaves will inevitably increase cooling needs to limit the health impacts of climate change (medium confidence). Global warming will impact cooling and heating needs but also the performance, durability and safety of buildings, especially historical and coastal ones, through changes in temperature, humidity, atmospheric concentrations of CO2 and chloride, and sea level rise. Adaptation measures to cope with climate change may increase the demand for energy and materials leading to an increase in GHG emissions if not mitigated. Sufficiency measures which anticipate climate change, and include natural ventilation, white walls, and nature-based solutions (e.g., green roofs) will decrease the demand for cooling. Shared cooled spaces with highly efficient cooling solutions are among the mitigation strategies which can limit the effect of the expected heatwaves on people’s health. {9.7, 9.8}
Well-designed and effectively implemented mitigation actions in the buildings sector have significant potential to help achieve the SDGs (high confidence). As shown in Figure TS.16, the impacts of mitigation actions in the building sector go far beyond the goal of climate action (SDG 13) and contribute to meeting 15 other SDGs. Mitigation actions in the building sector bring health gains through improved indoor air quality and thermal comfort, and have positive significant macro- and micro-economic effects, such as increased productivity of labour, job creation, reduced poverty, especially energy poverty, and improved energy security ( high confidence). (Figure TS.29) {9.8}

Figure TS.16 | Contribution of building-sector mitigation policies to meeting Sustainable Development Goals. {Figure 9.18}
The COVID-19 pandemic emphasised the importance of buildings for human well-being and highlighted the inequalities in access for all to suitable, healthy buildings, which provide natural daylight and clean air to their occupants (medium confidence). Recent WHO health recommendations have also emphasise indoor air quality, preventive maintenance of centralised mechanical heating, ventilation, and cooling systems. There are opportunities for repurposing existing non-residential buildings, no longer in use due to the expected spread of teleworking triggered by the health crisis and enabled by digitalisation. (Box TS.14) {9.1}
TS.5.5 Industry
The industry chapter focuses on new developments since AR5 and emphasises the role of the energy-intensive and emissions-intensive basic materials industries in strategies for reaching net zero emissions. The Paris Agreement, the SDGs and the COVID-19 pandemic provide a new context for the evolution of industry and mitigation of industry greenhouse gas (GHG) emissions ( high confidence). {11.1.1}
Net zero CO2industrial-sector emissions are possible but challenging (high confidence). Energy efficiency will continue to be important. Reduced materials demand, material efficiency, and circular economy solutions can reduce the need for primary production. Primary production options include switching to new processes that use low-to-zero GHG energy carriers and feedstocks (e.g., electricity, hydrogen, biofuels, and carbon dioxide capture and utilisation (CCU) to provide carbon feedstocks). Carbon capture and storage (CCS) will be required to mitigate remaining CO2 emissions {11.3}. These options require substantial scaling up of electricity, hydrogen, recycling, CO2, and other infrastructure, as well as phase-out or conversion of existing industrial plants. While improvements in the GHG intensities of major basic materials have nearly stagnated over the last 30 years, analysis of historical technology shifts and newly available technologies indicate these intensities can be significantly reduced by mid-century. {11.2, 11.3, 11.4}
Industry-sector emissions have been growing faster since 2000 than emissions in any other sector, driven by increased basic materials extraction and production (high confidence). GHG emissions attributed to the industrial sector originate from fuel combustion, process emissions, product use and waste, which jointly accounted for 14.1 GtCO2-eq or 24% of all direct anthropogenic emissions in 2019, second behind the energy supply sector. Industry is a leading GHG emitter – 20 GtCO2-eq or 34% of global emissions in 2019 – if indirect emissions from power and heat generation are included. The share of emissions originating from direct fuel combustion is decreasing and was 7 GtCO2-eq, 50% of direct industrial emissions in 2019. {11.2.2}
Global material intensity – the in-use stock of manufactured capital in tonnes per unit of GDP – is increasing (high confidence). In-use stock of manufactured capital per capita has been growing faster than GDP per capita since 2000. Total global in-use stock of manufactured capital grew by 3.4% yr –1 in 2000–2019. At the same time, per-capita material stocks in several developed countries have stopped growing, showing a decoupling from GDP per capita. {11.2.1, 11.3.1}
The demand for plastic has been growing most strongly since 1970 (high confidence). The current >99% reliance on fossil feedstock, very low recycling, and high emissions from petrochemical processes is a challenge for reaching net zero emissions. At the same time, plastics are important for reducing emissions elsewhere, for example, light-weighting vehicles. There are as yet no shared visions for fossil-free plastics, but several possibilities. {11.4.1.3}
Scenario analyses show that significant reductions in global GHG emissions and even close to net zero emissions from GHG intensive industry (e.g., steel, plastics, ammonia, and cement) can be achieved by 2050 by deploying multiple available and emerging options (medium confidence). Significant reductions in industry emissions require a reorientation from the historic focus on important but incremental improvements (e.g., energy efficiency) to transformational changes in energy and feedstock sourcing, materials efficiency, and more circular material flows. {11.3, 11.4}
Key mitigation options such as materials efficiency, circular material flows and emerging primary processes, are not well represented in climate change scenario modelling and integrated assessment models (IAMs), albeit with some progress in recent years (high confidence). The character of these interventions (e.g., appearing in many forms across complex value chains, making cost estimates difficult) combined with the limited data on new fossil-free primary processes help explain why they are less represented in models than, for example, CCS. As a result, overall mitigation costs and the need for CCS may be overestimated. {11.4.2.1}
Electrification is emerging as a key mitigation option for industry (high confidence). Using electricity directly, or indirectly via hydrogen from electrolysis for high temperature and chemical feedstock requirements, offers many options to reduce emissions. It also can provide substantial grid-balancing services, for example, through electrolysis and storage of hydrogen for chemical process use or demand response. (Box TS.9) {11.3.5}
Carbon is a key building block in organic chemicals, fuels and materials and will remain important (high confidence). In order to reach net zero CO2 emissions for the carbon needed in society (e.g., plastics, wood, aviation fuels, solvents, etc.), it is important to close the use loops for carbon and carbon dioxide through increased circularity with mechanical and chemical recycling, more efficient use of biomass feedstock with addition of low-GHG hydrogen to increase product yields (e.g., for biomethane and methanol), and potentially direct air capture of CO2 as a new carbon source. {11.3, 11.4.1}
Production costs for very low to zero emissions basic materials may be high but the cost for final consumers and the general economy will be low (medium confidence). Costs and emissions reductions potential in industry, and especially heavy industry, are highly contingent on innovation, commercialisation, and market-uptake policies. Technologies exist to take all industry sectors to very low or zero emissions, but require five to fifteen years of intensive innovation, commercialisation, and policy to ensure uptake. Mitigation costs are in the rough range of USD50–150 tCO2-eq –1, with wide variation within and outside this band. This affects competitiveness and requires supporting policy. Although production cost increases can be significant, they translate to very small increases in the costs for final products, typically less than a few percent depending on product, assumptions, and system boundaries. (Figure TS.17) {11.4.1.5}
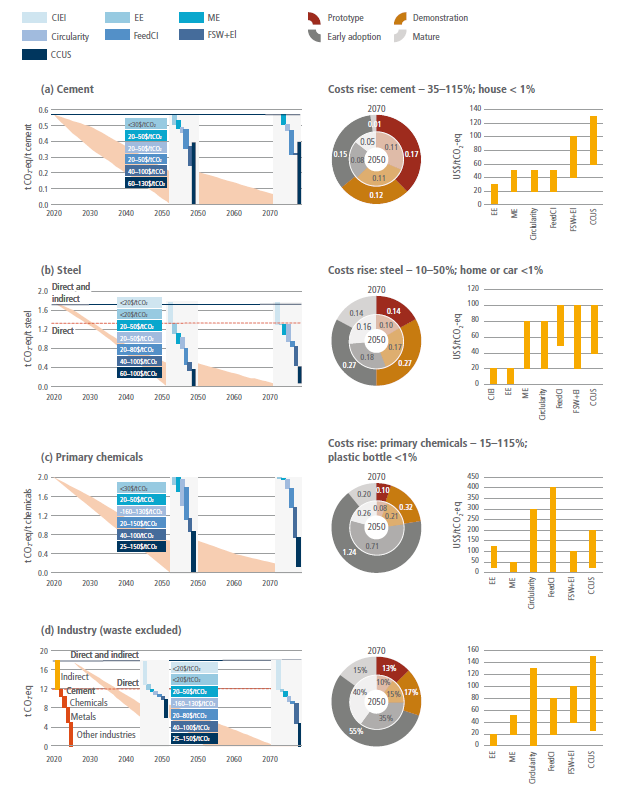
Figure TS.17: Potentials and costs for zero-carbon mitigation options for industry and basic materials. CIEl – carbon intensity of electricity for indirect emissions; EE – energy efficiency; ME – material efficiency; Circularity – material flows (clinker substituted by coal fly ash, blast furnace slag or other by-products and waste, steel scrap, plastic recycling, etc.); FeedCI – feedstock carbon intensity (hydrogen, biomass, novel cement, natural clinker substitutes); FSW+El – fuel switch and processes electrification with low-carbon electricity. Ranges for mitigation options are shown based on bottom-up studies for grouped technologies packages, not for single technologies. In circles, contribution to mitigation from technologies based on their readiness are shown for 2050 (2040) and 2070. Direct emissions include fuel combustion and process emissions. Indirect emissions include emissions attributed to consumed electricity and purchased heat. For basic chemicals, only methanol, ammonia and high-value chemicals are considered. Total for industry does not include emissions from waste. Negative mitigation costs for some options such as Circularity are not reflected. {Figure 11.13}
Several technological options exist for very low to zero emissions steel, but their uptake will require integrated material efficiency, recycling, and production decarbonisation policies (high confidence). Material efficiency can potentially reduce steel demand by up to 40% based on design for less steel use, long life, reuse, constructability, and low-contamination recycling. Secondary production through high-quality recycling must be maximised. Production decarbonisation will also be required, starting with the retrofitting of existing facilities for partial fuel switching (e.g., to biomass or hydrogen), CCU and CCS, followed by very low and zero emissions production based on high-capture CCS or direct hydrogen, or electrolytic iron-ore reduction followed by an electric arc furnace. {11.3.2, 11.4.1.1}
Several current and emerging options can significantly reduce cement and concrete emissions. Producer, user, and regulator education, as well as innovation and commercialisation policy are needed (medium confidence). Cement and concrete are currently overused because they are inexpensive, durable, and ubiquitous, and consumption decisions typically do not give weight to their production emissions. Basic material efficiency efforts to use only well-made concrete thoughtfully and only where needed (e.g., using right-sized, prefabricated components) could reduce emissions by 24–50% through lower demand for clinker. Cementitious material substitution with various materials (e.g., ground limestone and calcined clays) can reduce process calcination emissions by up to 50% and occasionally much more. Until a very low GHG emissions alternative binder to Portland cement is commercialised – which is not anticipated in the near to mid-term – CCS will be essential for eliminating the limestone calcination process emissions for making clinker, which currently represent 60% of GHG emissions in best-available technology plants. {11.3.2, 11.3.6, 11.4.1.2}
While several technological options exist for decarbonising the main industrial feedstock chemicals and their derivatives, the costs vary widely (high confidence). Fossil fuel-based feedstocks are inexpensive and still without carbon pricing, and their biomass- and electricity-based replacements are expected to be more expensive. The chemical industry consumes large amounts of hydrogen, ammonia, methanol, carbon monoxide, ethylene, propylene, benzene, toluene, and mixed xylenes and aromatics from fossil feedstock, and from these basic chemicals produces tens of thousands of derivative end-use chemicals. Hydrogen, biogenic or air-capture carbon, and collected plastic waste for the primary feedstocks can greatly reduce total emissions. Biogenic carbon feedstock is expected to be limited due to competing land uses. {11.4.1}
Light industry and manufacturing can be largely decarbonised through switching to low-GHG fuels (e.g., biofuels and hydrogen) and electricity (e.g., for electrothermal heating and heat pumps) (high confidence). Most of these technologies are already mature, for example for low-temperature heat, but a major challenge is the current low cost of fossil CH4 and coal relative to low- and zero-GHG electricity, hydrogen, and biofuels. {11.4.1}
The pulp and paper industry has significant biogenic carbon emissions but relatively small fossil carbon emissions. Pulp mills have access to biomass residues and by-products and in paper mills the use of process heat at low to medium temperatures allows for electrification (high confidence). Competition for feedstock will increase if wood substitutes for building materials and petrochemicals feedstock. The pulp and paper industry can also be a source of biogenic carbon dioxide, carbon for organic chemicals feedstock, and for CDR using CCS. {11.4.1}
The geographical distribution of renewable resources has implications for industry (medium confidence). The potential for zero-emission electricity and low-cost hydrogen from electrolysis powered by solar and wind, or hydrogen from other very low emission sources, may reshape where currently energy- and emissions-intensive basic materials production is located, how value chains are organised, trade patterns, and what gets transported in international shipping. Regions with bountiful solar and wind resources, or low fugitive CH4 co-located with CCS geology, may become exporters of hydrogen or hydrogen carriers such as methanol and ammonia, or home to the production of iron and steel, organic platform chemicals, and other energy-intensive basic materials. {11.2, 11.4, Box 11.1}
The level of policy maturity and experience varies widely across the mitigation options (high confidence). Energy efficiency is a well-established policy field with decades of experience from voluntary and negotiated agreements, regulations, energy auditing and demand-side management (DSM) programmes. In contrast, materials demand management and efficiency are not well understood and addressed from a policy perspective. Barriers to recycling that policy could address are often specific to the different material loops (e.g., copper contamination for steel and lack of technologies or poor economics for plastics) or waste-management systems. For electrification and fuel switching the focus has so far been mainly on innovation and developing technical supply-side solutions rather than creating market demand. {11.5.2, 11.6}
Industry has so far largely been sheltered from the impacts of climate policy and carbon pricing due to concerns about carbon leakage26 and reducing competitiveness (high confidence). New approaches to industrial development policy are emerging for a transition to net zero GHG emissions. The transition requires a clear direction towards net zero, technology development, market demand for low-carbon materials and products, governance capacity and learning, socially inclusive phase-out plans, as well as international coordination of climate and trade policies (see also TS.6.5). It requires comprehensive and sequential industrial policy strategies leading to immediate action as well as preparedness for future decarbonisation, governance at different levels (from international to local) and integration with other policy domains. {11.6}
TS.5.6 Agriculture, Forestry, Other Land Uses, and Food Systems
TS.5.6.1 Agricultre, Forestry, and Other Land Use (AFOLU)
The agriculture, forestry and other land use (AFOLU) 27 sector encompasses managed ecosystems and offers significant mitigation opportunities while providing food, wood and other renewable resources as well as biodiversity conservation, provided the sector adapts to climate change. Land-based mitigation measures can reduce GHG emissions within the AFOLU sector, deliver CDR and provide biomass thereby enabling emission reductions in other sectors. 28 The rapid deployment of AFOLU measures features in all pathways that limit global warming to 1.5°C. Where carefully and appropriately implemented, AFOLU mitigation measures are positioned to deliver substantial co-benefits and help address many of the wider challenges associated with land management. If AFOLU measures are deployed badly, when taken together with the increasing need to produce sufficient food, feed, fuel and wood, they may exacerbate trade-offs with the conservation of habitats, adaptation, biodiversity and other services. At the same time the capacity of the land to support these functions may be threatened by climate change ( high confidence). {AR6 WGI Figure SPM.7; AR6 WGII, 7.1, 7.6}
The AFOLU sector, on average, accounted for 13–21% of global total anthropogenic GHG emissions in the period 2010–2019. At the same time managed and natural terrestrial ecosystems were a carbon sink, absorbing around one third of anthropogenic CO2 emissions (medium confidence). Estimated anthropogenic net CO2 emissions from AFOLU (based on bookkeeping models) result in a net source of +5.9 ± 4.1GtCO2 yr –1 between 2010 and 2019 with an unclear trend. Based on FAOSTAT or national GHG inventories, the net CO2 emissions from AFOLU were 0.0 to +0.8 GtCO2 yr –1 over the same period. There is a discrepancy in the reported CO2AFOLU emissions magnitude because alternative methodological approaches that incorporate different assumptions are used {7.2.2}. If the responses of all managed and natural land to both anthropogenic environmental change and natural climate variability, estimated to be a gross sink of –12.5 ± 3.2 GtCO2 yr –1 for the period 2010–2019, are added to land-use emissions, then land overall constituted a net sink of –6.6 ± 5.2 GtCO2 yr –1 in terms of CO2 emissions (medium confidence). (Table TS.4) {7.2, Table 7.1}
Table TS.4 | Net anthropogenic emissions (annual averages for 2010–2019a) from agriculture, forestry and other land use (AFOLU). For context, the net flux due to the natural response of land to climate and environmental change is also shown for CO2 in column E. Positive values represent emissions, negative values represent removals. Due to different approaches to estimate anthropogenic fluxes, AFOLU CO2 estimates in the table below are not directly comparable to LULUCF in national greenhouse gas inventories (NGHGIs).
Anthropogenic | Natural response | Natural and anthropogenic | |||||
Gas | Units | AFOLU net anthropogenic emissions | Non-AFOLU anthropogenic GHG emissions | Total net anthropogenic emissions (AFOLU and non-AFOLU) by gas | AFOLU as a % of total net anthropogenic emissions by gas | Natural land sinks including natural response of land to anthropogenic environmental change and climate variability | Net-land atmosphere CO2flux (i.e., anthropogenic AFOLU and natural fluxes across entire land surface) |
A | B | C = A + B | D = (A/C) *100 | E | F = A + E | ||
CO2 | GtCO2-eq yr –1 | 5.9 ± 4.1 (bookkeeping models, managed soils and pasture). 0 to 0.8 (NGHGI/ FAOSTAT data) | 36.2 ± 2.9 | 42.0 ± 29.0 | 14% | –12.5 ± 3.2 | –6.6 ± 4.6 |
CH4 | MtCH4 yr –1 | 157.0 ± 47.1 | 207.5 ± 62.2 | 364.4 ± 109.3 | |||
GtCO2-eq yr –1 | 4.2 ± 1.3 | 5.9 ± 1.8 | 10.2 ± 3.0 | 41% | |||
N2O | MtN2O yr –1 | 6.6 ± 4.0 | 2.8 ± 1.7 | 9.4 ± 5.6 | |||
GtCO2-eq yr –1 | 1.8 ± 1.1 | 0.8 ± 0.5 | 2.6 ± 1.5 | 69% | |||
Total | GtCO2-eq yr –1 | 11.9 ± 4.4 (CO2 component considers bookkeeping models only) | 44 ± 3.4 | 55.9 ± 6.1 | 21% | ||
aEstimates are given for 2019 as this is the latest date when data are available for all gases, consistent with Chapter 2 of this report. Positive fluxes are emission from land to the atmosphere. Negative fluxes are removals. For all Table footnotes see Table 7.1. {Table 7.1}
Land-use change drives net AFOLU CO2emission fluxes. The rate of deforestation, which accounts for 45% of total AFOLU emissions, has generally declined, while global tree cover and global forest-growing stock levels arelikely increasing (medium confidence). There are substantial regional differences, with losses of carbon generally observed in tropical regions and gains in temperate and boreal regions. Agricultural CH4 and N2O emissions are estimated to average 157 ± 47.1 MtCH4 yr –1 and 6.6 ± 4.0 MtN2O yr –1 or 4.2 ± 1.3 and 1.8 ± 1.1 GtCO2-eq yr –1 (using IPCC AR6 GWP100 values for CH4 and N2O) respectively between 2010 and 2019 {7.2.1, 7.2.3}. AFOLU CH4 emissions continue to increase , the main source of which is enteric fermentation from ruminant animals. Similarly, AFOLU N2O emissions are increasing, dominated by agriculture, notably from manure application, nitrogen deposition, and nitrogen fertiliser use ( high confidence). In addition to being a net carbon sink and source of GHG emissions, land plays an important role in climate through albedo effects, evapotranspiration, and aerosol loading through emissions of volatile organic compounds (VOCs). The combined role of CH4, N2O and aerosols in total climate forcing, however, is unclear and varies strongly with bioclimatic region and management practice. {2.4.2.5, 7.2, 7.3}
The AFOLU sector offers significant near-term mitigation potential at relatively low cost and can provide 20–30% of the 2050 emissions reduction described in scenarios that limit warming to 2°C (>67%) or lower (high evidence, medium agreement). The AFOLU sector can provide 20–30% (interquartile range) of the global mitigation needed for a 1.5°C or 2°C pathway towards 2050, though there are highly variable mitigation strategies for how AFOLU potential can be deployed for achieving climate targets {Illustrative Mitigation Pathways in 7.5}. The estimated economic (<USD100 tCO2-eq –1) AFOLU sector mitigation potential is 8 to 14 GtCO2-eq yr –1 between 2020–2050, with the bottom end of this range representing the mean from IAMs and the upper end representing the mean estimate from global sectoral studies. The economic potential is about half of the technical potential from AFOLU, and about 30–50% could be achieved under USD20 tCO2-eq –1{7.4}. The implementation of robust measurement, reporting and verification processes is paramount to improving the transparency of changes in land carbon stocks and this can help prevent misleading assumptions or claims on mitigation. {7.1, 7.4, 7.5}
Between 2020 and 2050, mitigation measures in forests and other natural ecosystems provide the largest share of the AFOLU mitigation potential (up to USD100 tCO2-eq–1), followed by agriculture and demand-side measures (high confidence). In the global sectoral studies, the protection, improved management, and restoration of forests, peatlands, coastal wetlands, savannas and grasslands have the potential to reduce emissions and/or sequester 7.3 mean (3.9–13.1) GtCO2-eq yr –1. Agriculture provides the second largest share of the mitigation potential, with 4.1 (1.7–6.7) GtCO2-eq yr –1 (up to USD100 tCO2-eq –1) from cropland and grassland soil carbon management, agroforestry, use of biochar, improved rice cultivation, and livestock and nutrient management. Demand-side measures including shifting to sustainable healthy diets, reducing food waste, building with wood, biochemicals, and bio-textiles, have a mitigation potential of 2.2 (1.1–3.6) GtCO2-eq yr –1. Most mitigation options are available and ready to deploy. Emissions reductions can be achieved relatively quickly, whereas CDR needs upfront investment. Sustainable intensification in agriculture, shifting diets, and reducing food waste could enhance efficiencies and reduce agricultural land needs, and are therefore critical for enabling supply-side measures such as reforestation, restoration, as well as decreasing CH4 and N2O emissions from agricultural production. In addition, emerging technologies (e.g., vaccines or CH4 inhibitors) have the potential to substantially increase the CH4 mitigation potential beyond current estimates. AFOLU mitigation is not only relevant in countries with large land areas. Many smaller countries and regions, particularly with wetlands, have disproportionately high levels of AFOLU mitigation potential density. {7.4, 7.5}
The economic and political feasibility of implementing AFOLU mitigation measures is hampered by persistent barriers. Assisting countries to overcome barriers will help to achieve significant short-term mitigation (medium confidence). Finance forms a critical barrier to achieving these gains as currently mitigation efforts rely principally on government sources and funding mechanisms which do not provide sufficient resources to enable the economic potential to be realised. Differences in cultural values, governance, accountability and institutional capacity are also important barriers. Climate change itself could reduce the mitigation potential from the AFOLU sector, although an increase in the capacity of natural sinks could occur despite changes in climate (medium confidence) {AR6 WGI Figure SPM.7 and Sections 7.4 and 7.6}. The continued loss of biodiversity makes ecosystems less resilient to climate change extremes and this may further jeopardise the achievement of the AFOLU mitigation potentials indicated in this chapter ( high confidence). (Box TS.15) {7.6}
The provision of biomass for bioenergy (with/without BECCS) and other bio-based products represents an important share of the total mitigation potential associated with the AFOLU sector, though these mitigation effects accrue to other sectors (high confidence). Recent estimates of the technical bioenergy potential, when constrained by food security and environmental considerations, are within the ranges 5–50 and 50–250 EJ yr –1 by 2050 for residues and dedicated biomass production systems, respectively. 29 (TS.5.7) {7.4, 12.3}
Bioenergy is the most land-intensive energy option, but total land occupation of other renewable energy options can also become significant in high deployment scenarios. While not as closely connected to the AFOLU sector as bioenergy, other renewable energy options can influence AFOLU activities in both synergistic and detrimental ways (high confidence). The character of land occupation, and associated impacts, vary considerably among mitigation options and also for the same option depending on geographic location, scale, system design and deployment strategy. Land occupation can be large uniform areas, for example, reservoir hydropower dams and tree plantations, and more distributed occupation that is integrated with other land uses, for example, wind turbines and agroforestry in agriculture landscapes. Deployment can be partly decoupled from additional land use, for example, use of organic waste and residues and integration of solar PV into buildings and other infrastructure ( high confidence). Wind and solar power can coexist with agriculture in beneficial ways (medium confidence). Indirect land occupation includes new agriculture areas following displacement of food production with bioenergy plantations and expansion of mining activities providing minerals required for manufacture of EV batteries, PV, and wind power. {7.4, 12.5}
The deployment of land-based mitigation measures can provide co-benefits, but there are also risks and trade-offs from inappropriate land management (high confidence). Such risks can best be managed if AFOLU mitigation is pursued in response to the needs and perspectives of multiple stakeholders to achieve outcomes that maximise synergies while limiting trade-offs (medium confidence). The results of implementing AFOLU measures are often variable and highly context-specific. Depending on local conditions (e.g., ecosystem, climate, food system, land ownership) and management strategies (e.g., scale, method), mitigation measures can positively or negatively affect biodiversity, ecosystem functioning, air quality, water availability and quality, soil productivity, rights infringements, food security, and human well-being. The agriculture and forestry sectors can devise management approaches that enable biomass production and use for energy in conjunction with the production of food and timber, thereby reducing the conversion pressure on natural ecosystems (medium confidence). Mitigation measures addressing GHGs may also affect other climate forcers such as albedo and evapotranspiration. Integrated responses that contribute to mitigation, adaptation, and other land challenges will have greater likelihood of being successful ( high confidence); measures which provide additional benefits to biodiversity and human well-being are sometimes described as ‘Nature-based Solutions’. {7.1, 7.4, 7.6, 12.4, 12.5}
AFOLU mitigation measures have been well understood for decades but deployment remains slow, and emissions trends indicate unsatisfactory progress despite beneficial contributions to global emissions reduction from forest-related options (high confidence). Globally, the AFOLU sector has so far contributed modestly to net mitigation, as past policies have delivered about 0.65 GtCO2 yr –1 of mitigation during 2010–2019 or 1.4% of global gross emissions. The majority (>80%) of emission reduction resulted from forestry measures. Although the mitigation potential of AFOLU measures is large from a biophysical and ecological perspective, its feasibility is hampered by lack of institutional support, uncertainty over long-term additionality and trade-offs, weak governance, fragmented land ownership, and uncertain permanence effects. Despite these impediments to change, AFOLU mitigation options are demonstrably effective and with appropriate support can enable rapid emission reductions in most countries. {7.4, 7.6}
Concerted, rapid and sustained effort by all stakeholders, from policymakers and investors to land owners and managers is a pre-requisite for achieving high levels of mitigation in the AFOLU sector (high confidence). To date USD0.7 billion yr –1 is estimated to have been spent on AFOLU mitigation. This is well short of the more than USD400 billion yr –1 that is estimated to be necessary to deliver the up to 30% of global mitigation effort envisaged in deep mitigation scenarios (medium confidence). This estimate of the global funding requirement is smaller than current subsidies provided to agriculture and forestry. A gradual redirection of existing agriculture and forestry subsidies would greatly advance mitigation. Effective policy interventions and national (investment) plans as part of NDCs, specific to local circumstances and needs, are urgently needed to accelerate the deployment of AFOLU mitigation options. These interventions are effective when they include funding schemes and long-term consistent support for implementation with governments taking the initiative together with private funders and non-state actors. {7.6}
Realising the mitigation potential of the AFOLU sector depends strongly on policies that directly address emissions and drive the deployment of land-based mitigation options, consistent with carbon prices in deep mitigation scenarios (high confidence). Examples of successful policies and measures include establishing and respecting tenure rights and community forestry, improved agricultural management and sustainable intensification, biodiversity conservation, payments for ecosystem services, improved forest management and wood-chain usage, bioenergy, voluntary supply chain management efforts, consumer behaviour campaigns, private funding and joint regulatory efforts to avoid, for example, leakage. The efficacy of different policies, however, will depend on numerous region-specific factors. In addition to funding, these factors include governance, institutions, long-term consistent execution of measures, and the specific policy setting. While the governance of land-based mitigation can draw on lessons from previous experience with regulating biofuels and forest carbon, integrating these insights requires governance that goes beyond project-level approaches emphasising integrated land-use planning and management within the frame of the Sustainable Development Goals. {7.4, Box 7.2, 7.6}
Addressing the many knowledge gaps in the development and testing of AFOLU mitigation options can rapidly advance the likelihood of achieving sustained mitigation (highconfidence). Research priorities include improved quantification of anthropogenic and natural GHG fluxes and emissions modelling, better understanding of the impacts of climate change on the mitigation potential, permanence and additionality of estimated mitigation actions, and improved (real-time and cheap) measurement, reporting and verification. There is a need to include a greater suite of mitigation measures in IAMs, informed by more realistic assessments that take into account local circumstances and socio-economic factors and cross-sector synergies and trade-offs. Finally, there is a critical need for more targeted research to develop appropriate country-level, locally specific, policy and land-management response options. These options could support more specific NDCs with AFOLU measures that enable mitigation while also contributing to biodiversity conservation, ecosystem functioning, livelihoods for millions of farmers and foresters, and many other SDGs. {7.7, Figure 17.1}
TS.5.6.2Food Systems
Realising the full mitigation potential from the food system requires change at all stages from producer to consumer and waste management, which can be facilitated through integrated policy packages (high confidence). Food systems are associated with 23–42% of global GHG emissions, while there is still widespread food insecurity and malnutrition. Absolute GHG emissions from food systems increased from 14 to 17 GtCO2-eq yr –1 in the period 1990–2018. Both supply- and demand-side measures are important to reduce the GHG intensity of food systems. Integrated food policy packages based on a combination of market-based, administrative, informative, and behavioural policies can reduce cost compared to uncoordinated interventions, address multiple sustainability goals, and increase acceptance across stakeholders and civil society (limited evidence, medium agreement ). Food systems governance may be pioneered through local food policy initiatives complemented by national and international initiatives, but governance on the national level tends to be fragmented, and thus has limited capacity to address structural issues like inequities in access. (Figure TS.18, Table TS.5, Table TS.6) {7.2, 7.4, 12.4}

Figure TS.18 | Food-system GHG emissions from the agriculture, and land use, land-use change and forestry (LULUCF), waste, and energy and industry sectors. {Figure 12.5}
Table TS.5 | Food system mitigation opportunities.
Food system mitigation options (I: incremental; T: transformative) | Direct and indirect effect on GHG mitigation (+/0/–) a | Co-benefits/adverse effectsb | |
Food from agriculture, aquaculture and fisheries | (I) Dietary shift, in particular increased share of plant-based protein sources | D+↓GHG footprint | A+ Animal welfare L+ Land sparing H+ Good nutritional properties, potentially ↓ risk from zoonotic diseases, pesticides and antibiotics |
(I/T) Digital agriculture | D+↑ logistics | L+ Land sparing R+↑ resource-use efficiencies | |
(T) Gene technology | D+↑ productivity or efficiency | H+↑ nutritional quality E0↓ use of agrochemicals; ↑ probability of off-target impacts | |
(I) Sustainable intensification Land-use optimisation | D+↓GHG footprint E0 Mixed effects | L+ Land sparing R– Might ↑ pollution/biodiversity loss | |
(I) Agroecology | D+↓GHG/area, positive micro-climatic effects E+↓ energy, possibly ↓ transport FL+ Circular approaches | E+ Focus on co-benefits/ecosystem services R+ Circular, ↑ nutrient and water use efficiencies | |
Controlled environment agriculture | (T) Soil-less agriculture | D+↑ productivity, weather independent FL+ Harvest on demand E– Currently ↑ energy demand, but ↓ transport, building spaces can be used for renewable energy | R+ Controlled loops ↑ nutrient- and water-use efficiency L+ Land sparing H+ Crop breeding can be optimised for taste and/or nutritional quality |
Emerging food production technologies | (T) Insects | D0 Good feed conversion efficiency FW+ Can be fed on food waste | H0 Good nutritional qualities but attention to allergies and food safety issues required |
(I/T) Algae and bivalves | D+↓GHG footprints | A+ Animal welfare L+ Land sparing H+ Good nutritional qualities; risk of heavy-metal and pathogen contamination R+ Biofiltration of nutrient-polluted waters | |
(I/T) Plant-based alternatives to animal-based food products | D+ No emissions from animals, ↓ inputs for feed | A+ Animal welfare L+ Land sparing H+ Potentially ↓ risk from zoonotic diseases, pesticides and antibiotics; but ↑ processing demand | |
(T) Cellular agriculture (including cultured meat, microbial protein) | D+ No emissions from animals, high protein conversion efficiency E–↑ energy need FLW+↓ food loss and waste | A+ Animal welfare R+↓ emissions of reactive nitrogen or other pollutants H0 Potentially ↓ risk from zoonotic diseases, pesticides and antibiotics; ↑ research on safety aspects needed | |
Food processing and packaging | (I) Valorisation of by-products, FLW logistics and management | M+ Substitution of bio-based materials FL+↓ of food losses | |
(I) Food conservation | FW+↓ of food waste E0↑ energy demand but also energy savings possible (e.g., refrigeration, transport) | ||
(I) Smart packaging and other technologies | FW+↓ of food waste M0↑ material demand and ↑ material efficiency E0↑ energy demand; energy savings possible | H+ Possibly ↑ freshness/reduced food safety risks | |
(I) Energy efficiency | E+↓ energy | ||
Storage and distribution | (I) Improved logistics | D+↓ transport emissions FL+↓ losses in transport FW– Easier access to food could ↑ food waste | |
(I) Specific measures to reduce food waste in retail and food catering | FW+↓ of food waste E+↓ downstream energy demand M+↓ downstream material demand | ||
(I) Alternative fuels/transport modes | D+↓ emissions from transport | ||
(I) Energy efficiency | E+↓ energy in refrigeration, lightening, climatisation | ||
(I) Replacing refrigerants | D+↓ emissions from the cold chain | ||
aDirect and indirect GHG effects: D – direct emissions except emissions from energy use, E – energy demand, M – material demand, FL – food losses, FW – food waste; direction of effect on GHG mitigation: (+) increased mitigation, (0) neutral, (–) decreased mitigation.
bCo-benefits/adverse effects: H – health aspects, A – animal welfare, R – resource use, L – land demand, E – ecosystem services; (+) co-benefits, (–) adverse effects. {Table 12.8}
Table TS.6 | Assessment of food system policies targeting (post-farm gate) food-chain actors and consumers.
Level G: global/multinational; N: national; L: local | Transformative potential | Environmental effectiveness | Feasibility | Distributional effects | Cost | Co-benefitsaand adverse side effect | Implications for coordination, coherence and consistency in policy packageb | |
Integrated food policy packages | NL | can be controlled | cost efficient | + balanced, addresses multiple sustainability goals | Reduces cost of uncoordinated interventions; increases acceptance across stakeholders and civil society (robust evidence, high agreement ) | |||
Taxes on food products | GN | regressive | low # 1 | – unintended substitution effects | High enforcing effect on other food policies; higher acceptance if compensation or hypothecated taxes (medium evidence, high agreement ) | |||
GHG taxes on food | GN | regressive | low # 2 | – unintended substitution effects | Supportive, enabling effect on other food policies, agricultural/fishery policies; requires changes in power distribution and trade agreements (medium evidence, medium agreement ) | |||
+ high spillover effect | ||||||||
Trade policies | G | impacts global distribution | complex effects | + counters leakage effects | Requires changes in existing trade agreements (mediumevidence, high agreement ) | |||
+/– effects on market structure and jobs | ||||||||
Investment into research and innovation | GN | none | medium | + high spillover effect + converging with digital society | Can fill targeted gaps for coordinated policy packages (e.g., monitoring methods) (robust evidence, high agreement ) | |||
Food and marketing regulations | N | low | Can be supportive; might be supportive to realise innovation; voluntary standards might be less effective (medium evidence, medium agreement ) | |||||
Organisational-level procurement policies | NL | low | + can address multiple sustainability goals | Enabling effect on other food policies; reaches large share of population (medium evidence, high agreement ) | ||||
Sustainable food-based dietary guidelines | GNL | none | low | + can address multiple sustainability goals | Little attention so far on environmental aspects; can serve as benchmark for other policies (labels, food formulation standards, etc.) (medium evidence, medium agreement ) | |||
Food labels/ information | GNL | education level relevant | low | + empowers citizens + increases awareness + multiple objectives | Effective mainly as part of a policy package; incorporation of other objectives (e.g., animal welfare, fair trade); higher effect if mandatory (medium evidence, mediumagreement ) | |||
Nudges | NL | none | low | + possibly counteracting information deficits in population subgroups | High enabling effect on other food policies (mediumevidence, high agreement ) |
Effect of measures:  negative
  none/unclear
  slightly positive
  positive 
Notes: #1Minimum level to be effective 20% price increase; #2Minimum level to be effective USD50–80 tCO2-eq. aIn addition, all interventions are assumed to address health and climate change mitigation. bRequires coordination between policy areas, participation of stakeholders, transparent methods and indicators to manage trade-offs and prioritisation between possibly conflicting objectives; and suitable indicators for monitoring and evaluation against objectives.
Diets high in plant protein and low in meat and dairy are associated with lower GHG emissions (high confidence). Ruminant meat shows the highest GHG intensity. Beef from dairy systems has lower emissions intensity than beef from beef herds (8–23 and 17–94 kgCO2-eq (100 g protein)–1, respectively) when some emissions are allocated to dairy products. The wide variation in emissions reflects differences in production systems, which range from intensive feedlots with stock raised largely on grains through to rangeland and transhumance production systems. Where appropriate, a shift to diets with a higher share of plant protein, moderate intake of animal-source foods and reduced intake of saturated fats could lead to substantial decreases in GHG emissions. Benefits would also include reduced land occupation and nutrient losses to the surrounding environment, while at the same time providing health benefits and reducing mortality from diet-related non-communicable diseases. (Figure TS.19) {7.4.5, 12.4}
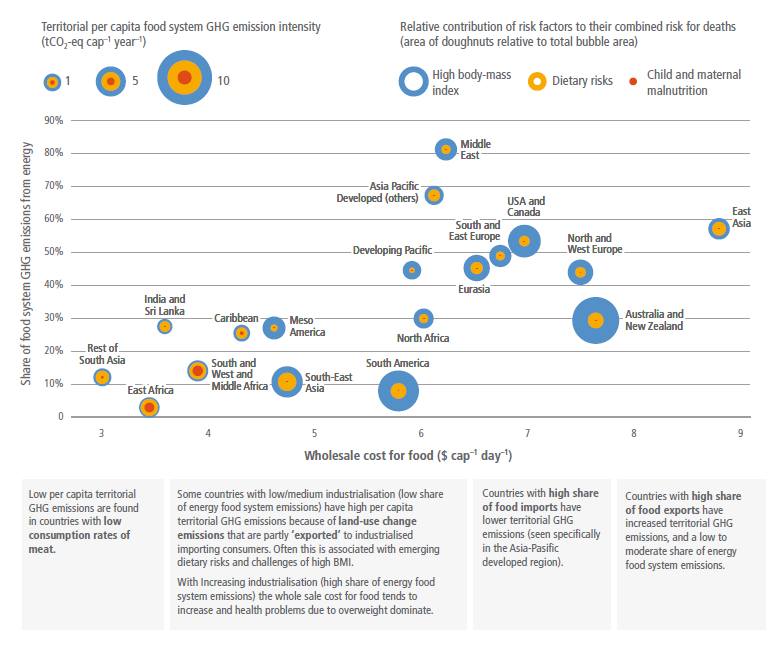
Figure TS.19 | Regional differences in health outcome, territorial per-capita GHG emissions from national food systems, and share of food system GHG emission from energy use. GHG emissions are calculated according to the IPCC Tier 1 approach and are assigned to the country where they occur, not necessarily where the food is consumed. Health outcome is expressed as relative contribution of each of the following risk factors to their combined risk for deaths: Child and maternal malnutrition (red), Dietary risks (yellow) or High body-mass index (blue). {Figure 12.7}
Emerging food technologies such as cellular fermentation, cultured meat, plant-based alternatives to animal-based food products, and controlled environment agriculture, can bring substantial reduction in direct GHG emissions from food production (limited evidence, high agreement). These technologies have lower land, water, and nutrient footprints, and address concerns over animal welfare. Realising the full mitigation potential depends on access to low-carbon energy as some emerging technologies are relatively more energy intensive. This also holds for deployment of cold-chain and packaging technologies, which can help reduce food loss and waste, but increase energy and materials use in the food system. (Table TS.5) {11.4.1.3, 12.4}
TS.5.7 Carbon Dioxide Removal (CDR)
CDR is a key element in scenarios that limit warming to 2°C (>67%) or 1.5°C (>50%) by 2100 (high confidence). Implementation strategies need to reflect that CDR methods differ in terms of removal process, timescale of carbon storage, technological maturity, mitigation potential, cost, co-benefits, adverse side effects, and governance requirements. (Box TS.10)
All the illustrative mitigation pathways (IMPs) assessed in this report use land-based biological CDR (primarily afforestation/reforestation (A/R)) and/or bioenergy with carbon capture and storage (BECCS). Some also include direct air CO2capture and storage (DACCS) (high confidence). Across the scenarios limiting warming to 2°C (>67%) or below, cumulative volumes 30 of BECCS reach 328 (168–763) GtCO2, CO2 removal from AFOLU (mainly A/R) reaches 252 (20–418) GtCO2, and DACCS reaches 29 (0–339) GtCO2, for the 2020–2100 period. Annual volumes in 2050 are 2.75 (0.52–9.45) GtCO2 yr –1 for BECCS, 2.98 (0.23–6.38) GtCO2 yr –1 for the CO2 removal from AFOLU (mainly A/R), and 0.02 (0–1.74) GtCO2 yr –1 for DACCS. (Box TS.10) {12.3, Cross-Chapter Box 8 in Chapter 12}
Despite limited current deployment, estimated mitigation potentials for DACCS, enhanced weathering (EW) and ocean-based CDR methods (including ocean alkalinity enhancement and ocean fertilisation) are moderate to large (medium confidence). The potential for DACCS (5–40 GtCO2 yr –1) is limited mainly by requirements for low-carbon energy and by cost (100–300 (full range: 84–386) USD tCO2–1). DACCS is currently at a medium technology readiness level. EW has the potential to remove 2–4 (full range: <1 to around 100) GtCO2 yr –1, at costs ranging from 50 to 200 (full range: 24–578) USD tCO2–1. Ocean-based methods have a combined potential to remove 1–100 GtCO2 yr –1 at costs of USD40–500 tCO2–1, but their feasibility is uncertain due to possible side effects on the marine environment. EW and ocean-based methods are currently at a low technology readiness level. {12.3}
CDR governance and policymaking can draw on widespread experience with emissions reduction measures (high confidence). Additionally, to accelerate research, development, and demonstration, and to incentivise CDR deployment, a political commitment to formal integration into existing climate policy frameworks is required, including reliable measurement, reporting and verification (MRV) of carbon flows. {12.3.3, 12.4, 12.5}
Box TS.10 | Carbon Dioxide Removal (CDR)
Carbon Dioxide Removal (CDR) is necessary to achieve net zero CO2 and GHG emissions both globally and nationally, counterbalancing ‘hard-to-abate’ residual emissions. CDR is also an essential element of scenarios that limit warming to 1.5°C or below 2°C (>67%) by 2100, regardless of whether global emissions reach near zero, net zero or net negative levels. While national mitigation portfolios aiming at net zero emissions or lower will need to include some level of CDR, the choice of methods and the scale and timing of their deployment will depend on the achievement of gross emission reductions, and managing multiple sustainability and feasibility constraints, including political preferences and social acceptability.
CDR refers to anthropogenic activities removing CO2 from the atmosphere and durably storing it in geological, terrestrial, or ocean reservoirs, or in products. It includes existing and potential anthropogenic enhancement of biological, geochemical or chemical CO2 sinks, but excludes natural CO2 uptake not directly caused by human activities (Annex I). Carbon Capture and Storage (CCS) and Carbon Capture and Utilisation (CCU) applied to fossil CO2 do not count as removal technologies. CCS and CCU can only be part of CDR methods if the CO2 is biogenic or directly captured from ambient air, and stored durably in geological reservoirs or products. {12.3}
There is a great variety of CDR methods and respective implementation options {Cross-Chapter Box 8, Figure 1 in Chapter 12}. Some of these methods (like afforestation and soil carbon sequestration) have been practiced for decades to millennia, although not necessarily with the intention to remove carbon from the atmosphere. Conversely, for methods such as DACCS and BECCS, experience is growing but still limited in scale. A categorisation of CDR methods can be based on several criteria, depending on the highlighted characteristics. In this report, the categorisation is focused on the role of CDR methods in the carbon cycle, that is on the removal process (land-based biological; ocean-based biological; geochemical; chemical) and on the time scale of storage (decades to centuries; centuries to millennia; 10,000 years or longer), the latter being closely linked to different carbon storage media. Within one category (e.g., ocean-based biological CDR) options often differ with respect to other dynamic or context-specific dimensions such as mitigation potential, cost, potential for co-benefits and adverse side effects, and technology readiness level. (Table TS.7, TS.5.6, TS. 5.7) {12.3}
It is useful to distinguish between CO2 removal from the atmosphere as the outcome of deliberate activities implementing CDR options, and the net emissions outcome achieved with the help of CDR deployment (i.e., gross emissions minus gross removals). As part of ambitious mitigation strategies at global or national levels, gross CDR can fulfil three different roles in complementing emissions abatement: (i) lowering net CO2 or GHG emissions in the near term; (ii) counterbalancing ‘hard-to-abate’ residual emissions such as CO2 from industrial activities and long-distance transport, or CH4 and nitrous oxide from agriculture, in order to help reach net zero CO2 or GHG emissions in the mid-term; (iii) achieving net negative CO2 or GHG emissions in the long term if deployed at levels exceeding annual residual emissions {2.7, 3.3, 3.4, 3.5}. These roles of CDR are not mutually exclusive: for example, achieving net zero CO2 or GHG emissions globally might involve individual developed countries attaining net negative CO2 emissions at the time of global net zero, thereby allowing developing countries a smoother transition. {Cross-Chapter Box 8, Figure 2 in Chapter 12}
Table TS.7 | Summary of status, costs, potentials, risk and impacts, co-benefits, trade-offs and spillover effects and the role in mitigation pathways for CDR methods {12.3.2, 7.4}. (TRL = technology readiness level.)
CDR method | Status (TRL) | Cost 1 (USD tCO2–1) | Mitigation potential1 (GtCO2yr–1) | Risk and impacts | Co-benefits | Trade-offs and spillover effects | Role in mitigation pathways | Section |
Afforestation/reforestation | 8–9 | 0–240 | 0.5–10 | Reversal of carbon removal through wildfire, disease, pests may occur. Reduced catchment water yield and lower groundwater level if species and biome are inappropriate. | Enhanced employment and local livelihoods, improved biodiversity, improved renewable wood products provision, soil carbon and nutrient cycling. Possibly less pressure on primary forest. | Inappropriate deployment at large scale can lead to competition for land with biodiversity conservation and food production. | Substantial contribution in IAMs and also in bottom-up sectoral studies. | {7.4} |
Soil carbon sequestration in croplands and grasslands | 8–9 | –45–100 | 0.6–9.3 | Risk of increased nitrous oxide emissions due to higher levels of organic nitrogen in the soil; risk of reversal of carbon sequestration. | Improved soil quality, resilience and agricultural productivity. | Attempts to increase carbon sequestration potential at the expense of production. Net addition per hectare is very small; hard to monitor. | In development – not yet in global mitigation pathways simulated by IAMs in bottom-up studies: with medium contribution. | {7.4} |
Peatland and coastal wetland restoration | 8–9 | Insufficient data | 0.5–2.1 | Reversal of carbon removal in drought or future disturbance. Risk of increased CH4 emissions. | Enhanced employment and local livelihoods, increased productivity of fisheries, improved biodiversity, soil carbon and nutrient cycling. | Competition for land for food production on some peatlands used for food production. | Not in IAMs but some bottom-up studies with medium contribution. | {7.4} |
Agroforestry | 8–9 | Insufficient data | 0.3–9.4 | Risk that some land area lost from food production; requires very high skills. | Enhanced employment and local livelihoods, variety of products improved soil quality, more resilient systems. | Some trade-off with agricultural crop production, but enhanced biodiversity, and resilience of system. | No data from IAMs, but in bottom-up sectoral studies with medium contribution. | {7.4} |
Improved forest management | 8–9 | Insufficient data | 0.1–2.1 | If improved management is understood as merely intensification involving increased fertiliser use and introduced species, then it could reduce biodiversity and increase eutrophication. | In case of sustainable forest management, it leads to enhanced employment and local livelihoods, enhanced biodiversity, improved productivity. | If it involves increased fertiliser use and introduced species it could reduce biodiversity and increase eutrophication and upstream GHG emissions. | No data from IAMs, but in bottom-up sectoral studies with medium contribution. | {7.4} |
Biochar | 6–7 | 10–345 | 0.3–6.6 | Particulate and GHG emissions from production; biodiversity and carbon stock loss from unsustainable biomass harvest. | Increased crop yields and reduced non-CO2 emissions from soil; and resilience to drought. | Environmental impacts associated particulate matter; competition for biomass resource. | In development – not yet in global mitigation pathways simulated by IAMs. | {7.4} |
Direct air carbon capture and storage (DACCS) | 6 | 100–300 (84–386) | 5–40 | Increased energy and water use. | Water produced (solid sorbent DAC designs only). | Potentially increased emissions from water supply and energy generation. | In a few IAMs; DACCS complements other CDR methods. | {12.3} |
Bioenergy with carbon capture and storage (BECCS) | 5–6 | 15–400 | 0.5–11 | Inappropriate deployment at very large scale leads to additional land and water use to grow biomass feedstock. Biodiversity and carbon stock loss if from unsustainable biomass harvest. | Reduction of air pollutants, fuel security, optimal use of residues, additional income, health benefits, and if implemented well, it can enhance biodiversity. | Competition for land with biodiversity conservation and food production. | Substantial contribution in IAMs and bottom-up sectoral studies. Note – mitigation through avoided GHG emissions resulting from bioenergy use is of the same magnitude as the mitigation from CDR (TS.5.6). | {7.4} |
Enhanced weathering (EW) | 3–4 | 50–200 (24–578) | 2–4 (<1–95) | Mining impacts; air quality impacts of rock dust when spreading on soil. | Enhanced plant growth, reduced erosion, enhanced soil carbon, reduced soil acidity, enhanced soil water retention. | Potentially increased emissions from water supply and energy generation. | In a few IAMs; EW complements other CDR methods. | {12.3} |
‘Blue carbon management’ in coastal wetlands | 2–3 | Insufficient data | <1 | If degraded or lost, coastal blue carbon ecosystems are expected to release most of their carbon back to the atmosphere; potential for sediment contaminants, toxicity, bioaccumulation and biomagnification in organisms; issues related to altering degradability of coastal plants; use of sub-tidal areas for tidal wetland carbon removal; effect of shoreline modifications on sediment redeposition and natural marsh accretion; abusive use of coastal blue carbon as means to reclaim land for purposes that degrade capacity for carbon removal. | Provide many non-climatic benefits and can contribute to ecosystem-based adaptation, coastal protection, increased biodiversity, reduced upper ocean acidification; could potentially benefit human nutrition or produce fertiliser for terrestrial agriculture, anti-methanogenic feed additive, or as an industrial or materials feedstock. | If degraded or lost, coastal blue carbon ecosystems are likely to release most of their carbon back to the atmosphere. The full delivery of the benefits at their maximum global capacity will require years to decades to be achieved. | Not incorporated in IAMs, but in some bottom-up studies: small contribution. | {7.4, 12.3.1} |
Ocean fertilisation | 1–2 | 50–500 | 1–3 | Nutrient redistribution, restructuring of the ecosystem, enhanced oxygen consumption and acidification in deeper waters, potential for decadal-to-millennial-scale return to the atmosphere of nearly all the extra carbon removed, risks of unintended side effects. | Increased productivity and fisheries, reduced upper-ocean acidification. | Sub-surface ocean acidification, deoxygenation; altered meridional supply of macro-nutrients as they are utilised in the iron-fertilised region and become unavailable for transport to, and utilisation in other regions, fundamental alteration of food webs, biodiversity. | No data. | {12.3.1} |
Ocean alkalinity enhancement (OAE) | 1–2 | 40–260 | 1–100 | Increased seawater pH and saturation states and may impact marine biota. Possible release of nutritive or toxic elements and compounds. Mining impacts. | Limiting ocean acidification. | Potentially increased emissions of CO2 and dust from mining, transport and deployment operations. | No data. | {12.3.1} |
1Range based on authors’ estimates (as assessed from literature) are shown, with full literature ranges shown in ( ) brackets.
TS.5.8 Demand-side Aspects of Mitigation
The assessment of the social science literature and regional case studies reveals how social norms, culture, and individual choices interact with infrastructure and other structural changes over time. This provides new insight into climate change mitigation strategies, and how economic and social activity might be organised across sectors to support emission reductions. To enhance well-being, people demand services and not primary energy and physical resources per se. Focusing on demand for services and the different social and political roles people play broadens the participation in climate action. (Box TS.11)
Demand-side mitigation and new ways of providing services can helpAvoidandShift final service demands andImproveservice delivery. Rapid and deep changes in demand make it easier for every sector to reduce GHG emissions in the near and mid-term (high confidence). {5.2, 5.3}
The indicative potential of demand-side strategies to reduce emissions of direct and indirect CO2and non-CO2GHG emissions in three end-use sectors (buildings, land transport, and food) is 40–70% globally by 2050 (high confidence). Technical mitigation potentials compared to the 2050 emissions projection of two scenarios consistent with policies announced by national governments until 2020 amount to 6.8 GtCO2 for building use and construction, 4.6 GtCO2 for land transport and 8.0 GtCO2-eq for food demand, and amount to 4.4 GtCO2 for industry. Mitigation strategies can be classified as Avoid-Shift-Improve (ASI) options, that reflect opportunities for socio-cultural, infrastructural, and technological change. The greatest Avoid potential comes from reducing long-haul aviation and providing short-distance low-carbon urban infrastructures. The greatest Shift potential would come from switching to plant-based diets. The greatest Improve potential comes from within the building sector, and in particular increased use of energy-efficient end-use technologies and passive housing. (Figures TS.20 and TS.21) {5.3.1, 5.3.2, Figures 5.7 and 5.8, Table 5.1 and Table SM.5.2}

Figure TS.20 | Demand-side strategies for mitigation. Demand-side mitigation is about more than behavioural change and transformation happens through societal, technological and institutional changes. {Figure 5.10, Figure 5.14}

Figure TS.21 | Demand-side mitigation can be achieved through changes in socio-cultural factors, infrastructure design and use, and technology adoption. Mitigation response options related to demand for services have been categorised into three domains: ‘socio-cultural factors’, related to social norms, culture, and individual choices and behaviour; ‘infrastructure use’, related to the provision and use of supporting infrastructure that enables individual choices and behaviour; and ‘technology adoption’, which refers to the uptake of technologies by end users. Potentials in 2050 are estimated using the International Energy Agency’s 2020 World Energy Outlook STEPS (Stated Policy Scenarios) as a baseline. This scenario is based on a sector-by-sector assessment of specific policies in place, as well as those that have been announced by countries by mid-2020. This scenario was selected due to the detailed representation of options across sectors and sub-sectors. The heights of the coloured columns represent the potentials on which there is a high level of agreement in the literature, based on a range of case studies. The range shown by the dots connected by dotted lines represents the highest and lowest potentials reported in the literature which have low to medium levels of agreement. The demand-side potential of socio-cultural factors in the food system has two parts. The economic potential of direct emissions (mostly non-CO2) demand reduction through socio-cultural factors alone is 1.9 GtCO2-eq without considering land-use change by diversion of agricultural land from food production to carbon sequestration. If further changes in land use enabled by this change in demand are considered, the indicative potential could reach 7 GtCO2-eq. The electricity panel presents separately the mitigation potential from changes in electricity demand and changes associated with enhanced electrification in end-use sectors. Electrification increases electricity demand, while it is avoided though demand-side mitigation strategies. Load management refers to demand-side flexibility that can be achieved through incentive design such as time-of-use pricing/monitoring by artificial intelligence, diversification of storage facilities, and so on. NZE (IEA Net-Zero Emissions by 2050 scenario) is used to compute the impact of end-use sector electrification, while the impact of demand-side response options is based on bottom-up assessments. Dark grey columns show the emissions that cannot be avoided through demand-side mitigation options. The table indicates which demand-side mitigation options are included. Options are categorised according to: socio-cultural factors, infrastructure use, and technology adoption. Figure SPM.7 covers potential of demand-side options for the year 2050. Figure SPM.8 covers both supply- and demand-side options and their potentials for the year 2030. {5.3, Figure 5.7, 5.SM.II}
Socio-cultural and lifestyle changes can accelerate climate change mitigation (medium confidence). Among 60 identified actions that could change individual consumption, individual mobility choices have the largest potential to reduce carbon footprints. Prioritising car-free mobility by walking and cycling and adoption of electric mobility could save 2 tCO2-eq cap –1 yr –1. Other options with high mitigation potential include reducing air travel, cooling setpoint adjustments, reduced appliance use, shifts to public transit, and shifting consumption towards plant-based diets. {5.3.1, 5.3.1.2, Figure 5.8}
Box TS.11| A New Chapter in AR6 WGIII Focusing on the Social Science of Demand, and Social Aspects of Mitigation
The WGIII contribution to the Sixth Assessment Report of the IPCC (AR6) features a distinct chapter on demand, services and social aspects of mitigation {5}. The scope, theories, and evidence for such an assessment are addressed in Sections 5.1 and 5.4 within Chapter 5 and a Social Science Primer as an Appendix to Chapter 5.
The literature on social science – from sociology, psychology, gender studies and political science for example – and climate change mitigation is growing rapidly. A bibliometric search of the literature identified 99,065 peer-reviewed academic papers, based on 34 search queries with content relevant to Chapter 5. This literature is expanding by 15% per year, with twice as many publications in the AR6 period (2014–2020) as in all previous years.
The models of stakeholders’ decisions assessed by IPCC have continuously evolved. From AR1 to AR4, rational choice was the implicit assumption: agents with perfect information and unlimited processing capacity maximising self-focused expected utility and differing only in wealth, risk attitude, and time discount rate. The AR5 introduced a broader range of goals (material, social, and psychological) and decision processes (calculation-based, affect-based, and rule-based processes). However, its perspective was still individual- and agency-focused, neglecting structural, cultural, and institutional constraints and the influence of physical and social context.
A social science perspective is important in two ways. By adding new actors and perspectives, it (i) provides more options for climate mitigation; and (ii) helps to identify and address important social and cultural barriers and opportunities to socio-economic, technological, and institutional change. Demand-side mitigation involves five sets of social actors: individuals (e.g., consumption choices, habits), groups and collectives (e.g., social movements, values), corporate actors (e.g., investments, advertising), institutions (e.g., political agency, regulations), and infrastructure actors (e.g., very long-term investments and financing). Actors either contribute to the status-quo of global high-carbon consumption, and a GDP growth-oriented economy, or help generate the desired change to a low-carbon energy-services, well-being, and equity-oriented economy. Each set of actors has novel implications for the design and implementation of both demand- and supply-side mitigation policies. They show important synergies, making energy demand mitigation a dynamic problem where the packaging and/or sequencing of different policies play a role in their effectiveness {5.5, 5.6}. Incremental interventions change social practices, simultaneously affecting emissions and well-being. The transformative change requires coordinated action across all five sets of actors (Table 5.4), using social science insights about intersection of behaviour, culture, institutional and infrastructural changes for policy design and implementation. Avoid, Shift , and Improve choices by individuals, households and communities support mitigation {5.3.1.1, Table 5.1}. They are instigated by role models, changing social norms driven by policies and social movements. They also require appropriate infrastructures designed by urban planners and building and transport professionals, corresponding investments, and a political culture supportive of demand-side mitigation action.
Leveraging improvements in end-use service delivery through behavioural and technological innovations, and innovations in market organisation, leads to large reductions in upstream resource use (high confidence). Analysis of indicative potentials range from a factor 10- to 20-fold improvement in the case of available energy (exergy) analysis, with the highest improvement potentials at the end-user and service-provisioning levels. Realisable service level efficiency improvements could reduce upstream energy demand by 45% in 2050. (Figure TS.20) {5.3.2, Figure 5.10}
Decent living standards (DLS) and well-being for all (SDG 3) are achievable if high-efficiency low-demand mitigation pathways are followed (medium confidence). Minimum requirements of energy use consistent with enabling well-being for all is between 20 and 50 GJ cap –1 yr –1 depending on the context. (Figure TS.22) {5.2.2.1, 5.2.2.2, Box 5.3}
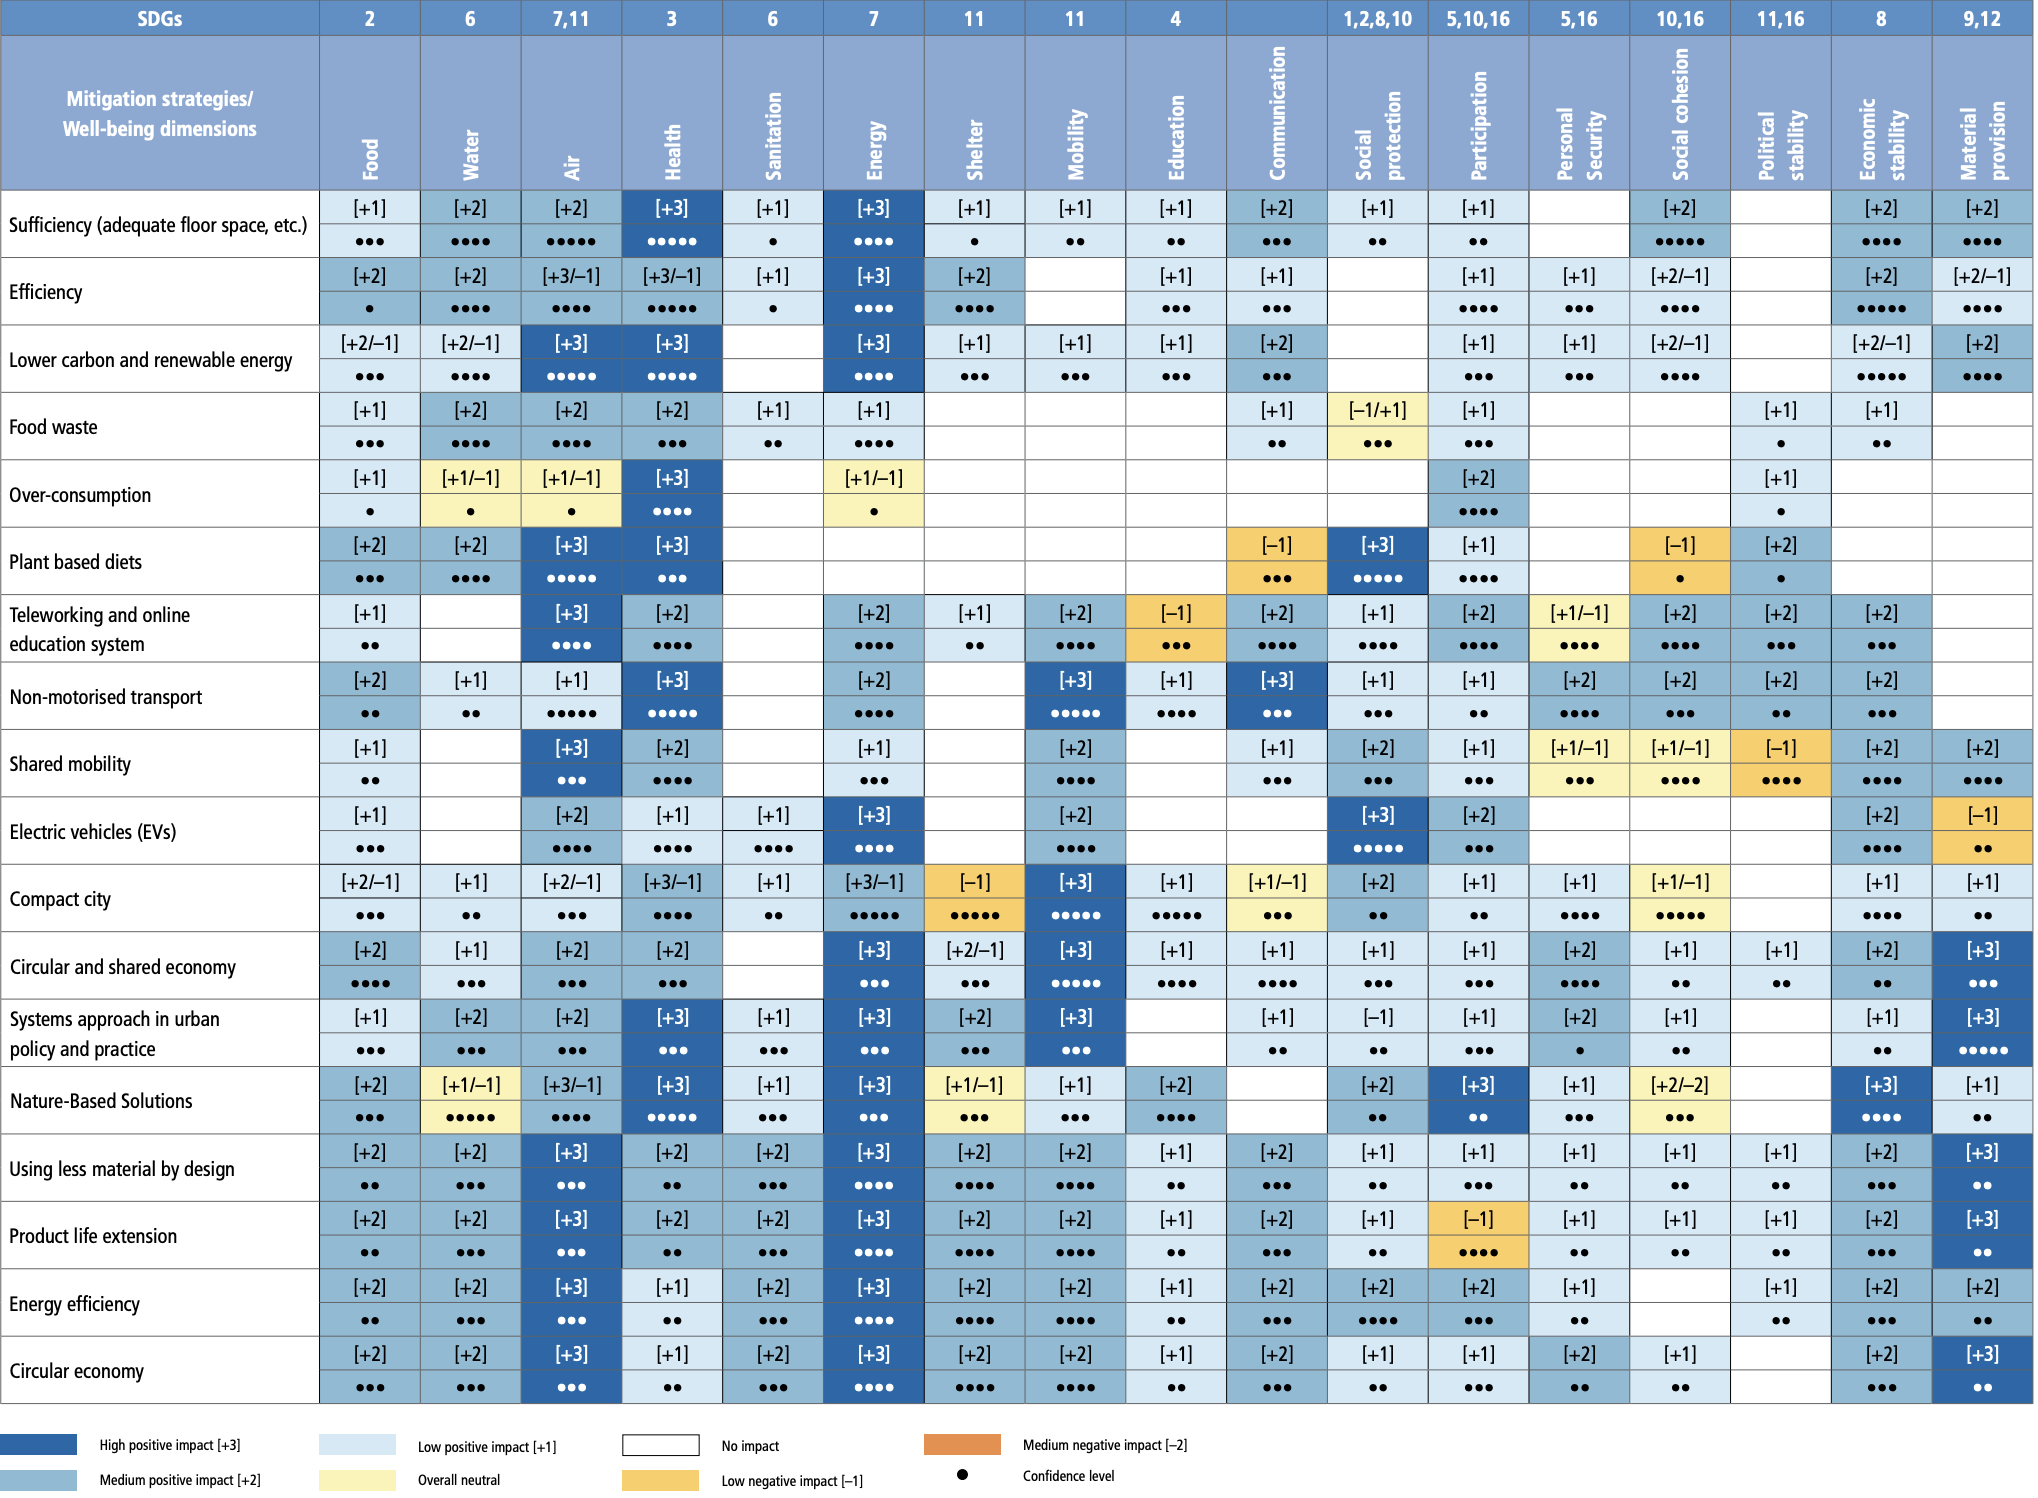
Figure TS.22 | Demand-side mitigation options, well-being and SDGs. {Figure 5.6}
Alternative service provision systems, for example, those enabled through digitalisation, sharing economy initiatives and circular economy initiatives, have to date made a limited contribution to climate change mitigation (medium confidence). While digitalisation through specific new products and applications holds potential for improvement in service-level efficiencies, without public policies and regulations, it also has the potential to increase consumption and energy use. Reducing the energy use of data centres, networks, and connected devices is possible in managing low-carbon digitalisation. Claims on the benefits of the circular economy for sustainability and climate change mitigation have limited evidence. (Box TS.12, Box TS.14) {5.3.4, Figures 5.12 and 5.13}
Box TS.12 | Circular Economy (CE)
In AR6, the circular economy (CE) concept {Annex I} is highlighted as an increasingly important mitigation approach that can help deliver human well-being by minimising waste of energy and resources. While definitions of CE vary, its essence is to shift away from linear ‘make and dispose’ economic models to those that emphasise product longevity, reuse, refurbishment, recycling, and material efficiency, thereby enabling more circular material systems that reduce embodied energy and emissions. {5.3.4, 8.4, 8.5, 9.5, 11.3.3}
Whereas IPCC AR4 {WGIII, Chapter 10} included a separate chapter on waste-sector emissions and waste-management practices, and AR5 {WGIII, Chapter 10} reviewed the importance of ‘reduce, reuse, recycle’ and related policies, AR6 focuses on how CE can reduce waste in materials production and consumption by optimising materials’ end-use service utility. Specific examples of CE implementations, policies, and mitigation potentials are included in Chapters 5, 8, 9, 11 and 12. {5.3, 8.4, 9.5, 11.3, 12.6}
CE is shown to empower new social actors in mitigation actions, given that it relies on the synergistic actions of producers, sellers, and consumers {11.3.3}. As an energy and resource demand-reduction strategy, it is consistent with high levels of human well-being {5.3.4.3} and ensures better environmental quality (Figure TS.22) {5.2.1}. It also creates jobs through increased sharing, reuse, refurbishment, and recycling activities. Therefore, CE contributes to several SDGs, including clean water and sanitation (SDG 6), affordable energy and clean energy (SDG 7), decent work and economic growth (SDG 8), responsible production and consumption (SDG 12) and climate action (SDG 13). {11.5.3.2}
Emissions savings derive from reduced primary material production and transport. For example, in buildings, lifetime extension, material efficiency, and reusable components reduce embodied emissions by avoiding demand for structural materials {9.3, 9.5}. At regional scales, urban/industrial symbiosis reduce primary material demand through by-product exchange networks {11.3.3}. CE strategies also exhibit enabling effects, such as material-efficient and circular vehicle designs that also improve fuel economy {10.2.2.2}. There is growing interest in ‘circular bioeconomy’ concepts applied to bio-based materials {Box 12.2} and even a ‘circular carbon economy’, wherein carbon captured via CCU {11.3.6} or CDR {3.4.6} is converted into reusable materials, which is especially relevant for the transitions of economies dependent on fossil fuel revenue. {12.6}
While there are many recycling policies, CE-oriented policies for more efficient material use with higher value retention are comparatively far fewer; these policy gaps have been attributed to institutional failures, lack of coordination, and lack of strong advocates {5.3, 9.5.3.6, Boxes 11.5 and 12.2}. Reviews of mitigation potentials reveal unevenness in the savings of CE applications and potential risks of rebound effects {5.3}. Therefore, CE policies that identify system determinants maximise potential emissions reductions, which vary by material, location, and application.
There are knowledge gaps for assessing CE opportunities within mitigation models due to CE’s many cross-sectoral linkages and data gaps related to its nascent state {3.4.4}. Opportunity exists to bridge knowledge from the industrial ecology field, which has historically studied CE, to the mitigation modelling community for improved analysis of interventions and policies for AR7. For instance, a global CE knowledge-sharing platform is helpful for CE performance measurement, reporting and accounting. {5.3, 9.5, 11.7}
Providing better services with less energy and resource input has high technical potential and is consistent with providing well-being for all (medium confidence). The assessment of 19 demand-side mitigation options and 18 different constituents of well-being showed that positive impacts on well-being outweigh negative ones by a factor of 11. {5.2, 5.2.3, Figure 5.6}
Demand-side mitigation options bring multiple interacting benefits (high confidence). Energy services to meet human needs for nutrition, shelter, health, and so on, are met in many different ways with different emissions implications that depend on local contexts, cultures, geography, available technologies, and social preferences. In the near term, many less-developed countries, and poor people everywhere, require better access to safe and low-emissions energy sources to ensure decent living standards and increase energy savings from service improvements by about 20–25%. (Figure TS.22) {5.2, 5.4.5, Figures 5.3, 5.4, 5.5 and 5.6, Boxes 5.2 and 5.3}
Granular technologies and decentralised energy end-use, characterised by modularity, small unit sizes and small unit costs, diffuse faster into markets and are associated with faster technological learning benefits, greater efficiency, more opportunities to escape technological lock-in, and greater employment (high confidence). Examples include solar PV systems, batteries, and thermal heat pumps. {5.3, 5.5, 5.5.3}
Wealthy individuals contribute disproportionately to higher emissions and have a high potential for emissions reductions while maintaining decent living standards and well-being (high confidence). Individuals with high socio-economic status are capable of reducing their GHG emissions by becoming role models of low-carbon lifestyles, investing in low-carbon businesses, and advocating for stringent climate policies. {5.4.1, 5.4.3, 5.4.4, Figure 5.14}
Demand-side solutions require both motivation and capacity for change (high confidence). Motivation by individuals or households worldwide to change energy consumption behaviour is generally low. Individual behavioural change is insufficient for climate change mitigation unless embedded in structural and cultural change. Different factors influence individual motivation and capacity for change in different demographics and geographies. These factors go beyond traditional socio-demographic and economic predictors and include psychological variables such as awareness, perceived risk, subjective and social norms, values, and perceived behavioural control. Behavioural nudges promote easy behaviour change, for example, ‘Improve’ actions such as making investments in energy efficiency, but fail to motivate harder lifestyle changes ( high confidence). {5.4}
Behavioural interventions, including the way choices are presented to end users (an intervention practice known as choice architecture), work synergistically with price signals, making the combination more effective (medium confidence). Behavioural interventions through nudges, and alternative ways of redesigning and motivating decisions, alone provide small to medium contributions to reduce energy consumption and GHG emissions. Green defaults, such as automatic enrolment in ‘green energy’ provision, are highly effective. Judicious labelling, framing, and communication of social norms can also increase the effect of mandates, subsidies, or taxes. {5.4, 5.4.1, Table 5.3, 5.3}
Cultural change, in combination with new or adapted infrastructure, is necessary to enable and realise manyAvoidandShift options (medium confidence). By drawing support from diverse actors, narratives of change can enable coalitions to form, providing the basis for social movements to campaign in favour of (or against) societal transformations. People act and contribute to climate change mitigation in their diverse capacities as consumers, citizens, professionals, role models, investors, and policymakers. {5.4, 5.5, 5.6}
Collective action as part of social or lifestyle movements underpins system change (high confidence). Collective action and social organising are crucial to shift the possibility space of public policy on climate change mitigation. For example, climate strikes have given voice to youth in more than 180 countries. In other instances, mitigation policies allow the active participation of all stakeholders, resulting in building social trust, new coalitions, legitimising change, and thus initiate a positive cycle in climate governance capacity and policies. {5.4.2, Figure 5.14}
Transition pathways and changes in social norms often start with pilot experiments led by dedicated individuals and niche groups (high confidence). Collectively, such initiatives can find entry points to prompt policy, infrastructure, and policy reconfigurations, supporting the further uptake of technological and lifestyle innovations. Individuals’ agency is central as social change agents and narrators of meaning. These bottom-up socio-cultural forces catalyse a supportive policy environment, which enables changes. {5.5.2}
The current effects of climate change, as well as some mitigation strategies, are threatening the viability of existing business practices, while some corporate efforts also delay mitigation action (medium confidence). Policy packages that include job creation programmes can help to preserve social trust, livelihoods, respect, and dignity of all workers and employees involved. Business models that protect rent-extracting behaviour may sometimes delay political action. Corporate advertisement and brand-building strategies may also attempt to deflect corporate responsibility to individuals or aim to appropriate climate-care sentiments in their own brand–building. {5.4.3, 5.6.4}
Middle actors – professionals, experts, and regulators – play a crucial, albeit underestimated and underutilised, role in establishing low-carbon standards and practices (medium confidence). Building managers, landlords, energy-efficiency advisers, technology installers, and car dealers influence patterns of mobility and energy consumption by acting as middle actors or intermediaries in the provision of building or mobility services and need greater capacity and motivation to play this role. (Figure TS.20a) {5.4.3}
Social influencers and thought leaders can increase the adoption of low-carbon technologies, behaviours, and lifestyles (high confidence). Preferences are malleable and can align with a cultural shift. The modelling of such shifts by salient and respected community members can help bring about changes in different service provisioning systems. Between 10% and 30% of committed individuals are required to set new social norms. {5.2.1, 5.4}
TS.5.9 Mitigation Potential Across Sectors and Systems
The total emission mitigation potential achievable by the year 2030, calculated based on sectoral assessments, is sufficient to reduce global greenhouse gas (GHG) emissions to half of the current (2019) level or less (high confidence). This potential – 31–44 GtCO2-eq – requires the implementation of a wide range of mitigation options. Options with mitigation costs lower than USD20 tCO2–1 make up more than half of this potential and are available for all sectors. The market benefits of some options exceed their costs. (Figure TS.23) {12.2, Table 12.3}

Figure TS.23 | Overview of emission mitigation options and their cost and potential for the year 2030. The mitigation potential of each option is the quantity of net greenhouse gas emission reductions that can be achieved by a given mitigation option relative to specified emission baselines that reflects what would be considered current policies in the period 2015–2019. Mitigation options may overlap or interact and cannot simply be summed together. The potential for each option is broken down into cost categories (see legend). Only monetary costs and revenues are considered. If costs are less than zero, lifetime monetary revenues are higher than lifetime monetary costs. For wind energy, for example, negative cost indicates that the cost is lower than that of fossil-based electricity production. The error bars refer to the total potential for each option. The breakdown into cost categories is subject to uncertainty. Where a smooth colour transition is shown, the breakdown of the potential into cost categories is not well researched, and the colours indicate only into which cost category the potential can predominantly be found in the literature. {Figure SPM.8, 6.4, Table 7.3, Supplementary Material Table 9.SM.2, Supplementary Material Table 9.SM.3, 10.6, 11.4, Figure 11.13, 12.2, Supplementary Material 12.SM.1.2.3}
Cross-sectoral considerations in mitigation finance are critical for the effectiveness of mitigation action as well as for balancing the often conflicting social, developmental, and environmental policy goals at the sectoral level (medium confidence). True resource mobilisation plans that properly address mitigation costs and benefits at sectoral level cannot be developed in isolation of their cross-sectoral implications. There is an urgent need for multilateral financing institutions to align their frameworks and delivery mechanisms, including the use of blended financing to facilitate cross-sectoral solutions as opposed to causing competition for resources among sectors . {12.6.4}
Carbon leakage is a cross-sectoral and cross-country consequence of differentiated climate policy (robust evidence, medium agreement). Carbon leakage occurs when mitigation measures implemented in one country/sector leads to increased emissions in other countries/sectors. Global commodity value chains and associated international transport are important mechanisms through which carbon leakage occurs. Reducing emissions from the value chain and transportation can offer opportunities to mitigate three elements of cross-sectoral spillovers and related leakage: (i) domestic cross-sectoral spillovers within the same country; (ii) international spillovers within a single sector resulting from substitution of domestic production of carbon-intensive goods with their imports from abroad; and (iii) international cross-sectoral spillovers among sectors in different countries . {12.6.3}
TS.6 Implementation and Enabling Conditions
Chapters 13 to 16 address the enabling conditions that can accelerate or impede rapid progress on mitigation. Chapters 13 and 14 focus on policy, governance and institutional capacity , and international cooperation, respectively taking a national and international perspective; Chapter 15 focuses on investment and finance ; and Chapter 16 focuses on innovation and technology . The assessment of social aspects of mitigation draws on material assessed in Chapter 5.
TS.6.1 Policy and Institutions
Long-term deep emission reductions, including the reduction of emissions to net zero, is best achieved through institutions and governance that nurture new mitigation policies, while at the same time reconsidering existing policies that support the continued emission of GHGs (high confidence). To do so effectively, the scope of climate governance needs to include both direct efforts to target GHG emissions and indirect opportunities to tackle GHG emissions that result from efforts directed towards other policy objectives. {13.2, 13.5, 13.6, 13.7, 13.9}
Institutions and governance underpin mitigation by providing the legal basis for action. This includes setting up implementing organisations and the frameworks through which diverse actors interact (medium evidence, high agreement). Institutions can create mitigation and sectoral policy instruments; policy packages for low-carbon system transition; and economy-wide measures for systemic restructuring. {13.2, 13.7, 13.9}
Policies have had a discernible impact on mitigation for specific countries, sectors, and technologies (high confidence), avoiding emissions of several GtCO2-eq yr–1 (medium confidence). Both market-based and regulatory policies have distinct but complementary roles. The share of global GHG emissions subject to mitigation policy has increased rapidly in recent years, but big gaps remain in policy coverage, and the stringency of many policies falls short of what is needed to achieve the desired mitigation outcomes. (Box TS.13){13.6, Cross-Chapter Box 10 in Chapter 14}
Climate laws enable mitigation action by signalling the direction of travel, setting targets, mainstreaming mitigation into sector policies, enhancing regulatory certainty, creating law-backed agencies, creating focal points for social mobilisation, and attracting international finance (medium evidence, high agreement). By 2020, ‘direct’ climate laws primarily focused on GHG reductions were present in 56 countries covering 53% of global emissions (Figure TS.24). More than 690 laws, including ‘indirect’ laws, however, may also have an effect on mitigation. Among direct laws, ‘framework’ laws set an overarching legal basis for mitigation either by pursuing a target and implementation approach, or by seeking to mainstream climate objectives through sectoral plans and integrative institutions. (Figure TS.24) {13.2}
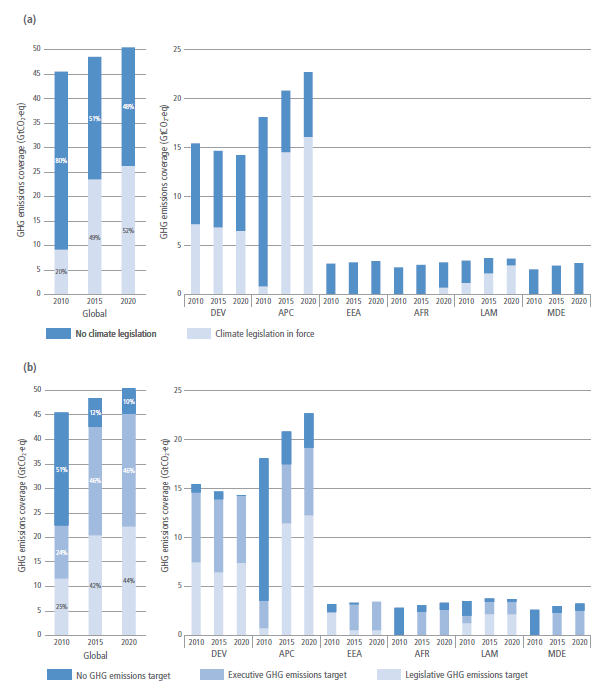
Figure TS.24 | Prevalence of legislation and emissions targets across regions. Panel (a): shares of global GHG emissions under national climate change legislations – in 2010, 2015 and 2020. Climate legislation is defined as an act passed by a parliament that includes the reduction of GHGs in its title or objectives. Panel (b): shares of global GHG emissions under national climate emission targets – in 2010, 2015 and 2020. Emissions reductions targets were taken into account as a legislative target when they were defined in a law or as part of a country’s submission under the Kyoto Protocol, or as an executive target when they were included in a national policy or official submissions under the UNFCCC. Targets were included if they were economy-wide or included at least the energy sector. The proportion of national emissions covered are scaled to reflect coverage and whether targets are in GHG or CO2 terms. Emissions data used are for 2019. 2020 data was excluded as emissions shares across regions deviated from past patterns due to COVID-19. AR6 regions: DEV = Developed countries; APC = Asia and Pacific; EEA = Eastern Europe and West Central Asia; AFR = Africa; LAM = Latin America and the Caribbean; ME = Middle East. {Figure 13.1 and 13.2}
Institutions can enable improved governance by coordinating across sectors, scales and actors, building consensus for action, and setting strategies (medium evidence, high agreement). Institutions are more stable and effective when they are congruent with national contexts, leading to mitigation-focused institutions in some countries and the pursuit of multiple objectives in others. Sub-national institutions play a complementary role to national institutions by developing locally relevant visions and plans, addressing policy gaps or limits in national institutions, building local administrative structures and convening actors for place-based decarbonisation. {13.2}
Mitigation strategies, instruments and policies that fit with dominant ideas, values and belief systems within a country or within a sector are more easily adopted and implemented (medium confidence). Ideas, values and beliefs may change over time. Policies that bring perceived direct benefits, such as subsidies, usually receive greater support. The awareness of co-benefits for the public increases support of climate policies ( high confidence). {13.2, 13.3, 13.4}
Climate governance is constrained and enabled by domestic structural factors, but it is still possible for actors to make substantial changes (medium evidence, high agreement). Key structural factors are domestic material endowments (such as fossil fuels and land-based resources); domestic political systems; and prevalent ideas, values and belief systems. Developing Countries face additional material constraints in climate governance due to development challenges and scarce economic or natural resources. A broad group of actors influence how climate governance develop over time, including a range of civic organisations, encompassing both pro- and anti-climate action groups . {13.3, 13.4}
Sub-national actors are important for mitigation because municipalities and regional governments have jurisdiction over climate-relevant sectors such as land use, waste and urban policy. They are able to experiment with climate solutions and can forge partnerships with the private sector and internationally to leverage enhanced climate action (high confidence). More than 10,500 cities and nearly 250 regions representing more than 2 billion people have pledged largely voluntary action to reduce emissions. Indirect gains include innovation, establishing norms and developing capacity. However, sub-national actors often lack national support, funding, and capacity to mobilise finance and human resources, and create new institutional competences. {13.5}
Climate litigation is growing and can affect the outcome and ambition of climate governance (medium evidence, high agreement). Since 2015, at least 37 systemic cases have been initiated against states that challenge the overall effort of a state to mitigate or adapt to climate change. If successful, such cases can lead to an increase in a country’s overall ambition to tackle climate change. Climate litigation has also successfully challenged governments’ authorisations of high-emitting projects, setting precedents in favour of climate action. Climate litigation against private sector and financial institutions is also on the rise. {13.4}
The media shapes the public discourse about climate mitigation. This can usefully build public support to accelerate mitigation action but may also be used to impede decarbonisation (medium evidence, high agreement). Global media coverage (across a study of 59 countries) has been growing, from about 47,000 articles in 2016–17 to about 87,000 in 2020–21. Generally, the media representation of climate science has increased and become more accurate over time. On occasion, the propagation of scientifically misleading information by organised counter-movements has fuelled polarisation, with negative implications for climate policy. {13.4}
Explicit attention to equity and justice is salient to both social acceptance and fair and effective policymaking for mitigation (high confidence). Distributional implications of alternative climate policy choices can be usefully evaluated at city, local and national scales as an input to policymaking. It is anticipated that institutions and governance frameworks that enable consideration of justice and Just Transitions can build broader support for climate policymaking . {13.2, 13.6, 13.8, 13.9}
Carbon pricing is effective in promoting implementation of low-cost emissions reductions (high confidence). While the coverage of emissions trading and carbon taxes has risen to over 20 percent of global CO2 emissions, both coverage and price are lower than is needed for deep reductions. Market mechanisms ideally are designed to be effective as well as efficient, balance distributional goals and find social acceptance. Practical experience has driven progress in market mechanism design, especially of emissions trading schemes. Carbon pricing is limited in its effect on adoption of higher-cost mitigation options, and where decisions are often not sensitive to price incentives, such as in energy efficiency, urban planning, and infrastructure (robust evidence, medium agreement ). Subsidies have been used to improve energy efficiency, encourage the uptake of renewable energy and other sector-specific emissions-saving options. {13.6}
Carbon pricing is most effective if revenues are redistributed or used impartially (high confidence). A carbon levy earmarked for green infrastructures or saliently returned to taxpayers corresponding to widely accepted notions of fairness increases the political acceptability of carbon pricing. {5.6, Box 5.11}
Removing fossil fuel subsidies would reduce emissions, improve public revenue and macroeconomic performance, and yield other environmental and sustainable development benefits. Subsidy removal may have adverse distributional impacts especially on the most economically vulnerable groups which, in some cases can be mitigated by measures such as redistributing revenue saved, all of which depend on national circumstances ( high confidence); fossil fuel subsidy removal is projected by various studies (using alternative methodologies) to reduce global CO2 emissions by 1–4%, and GHG emissions by up to 10% by 2030, varying across regions (medium confidence). {6.3, 13.6} {13.6}
Regulatory instruments play an important role in achieving specific mitigation outcomes in sectoral applications (high confidence). Regulation is effective in particular applications and often enjoys greater political support, but tends to be more economically costly than pricing instruments (robust evidence, medium agreement ). Flexible forms of regulation (e.g., performance standards) have achieved aggregate goals for renewable energy generation, vehicle efficiency and fuel standards, and energy efficiency in buildings and industry. Infrastructure investment decisions are significant for mitigation because they lock-in high- or low-emissions trajectories over long periods. Information and voluntary programs can contribute to overall mitigation outcomes (medium evidence, high agreement ). Designing for overlap and interactions among mitigation policies enhances their effectiveness. {13.6}
National mitigation policies interact internationally with effects that both support and hinder mitigation action (medium evidence, high agreement). Reductions in demand for fossil fuels tend to negatively affect fossil fuel-exporting countries. Creation of markets for emission reduction credits tends to benefit countries able to supply credits. Policies to support technology development and diffusion tend to have positive spillover effects. There is no consistent evidence of significant emissions leakage or competitiveness effects between countries, including for emissions-intensive trade-exposed industries covered by emission-trading systems (medium confidence). {13.6}
Policy packages are better able to support socio-technical transitions and shifts in development pathways toward low-carbon futures than are individual policies (high confidence). For best effect, they need to be harnessed to a clear vision for change and designed with attention to local governance context. Comprehensiveness in coverage, coherence to ensure complementarity, and consistency of policies with the overarching vision and its objectives are important design criteria. Integration across objectives occurs when a policy package is informed by a clear problem framing and identification of the full range of relevant policy subsystems. The climate policy landscape is outlined in Table TS.8, which maps framings of desired national policy outcomes to policymaking approaches. {13.7, Figure 13.6}
TableTS.8 | Mapping the landscape of climate policy. {Figure 13.6}
Approach to policymaking | Framing of outcome | |
Enhancing mitigation | Addressing multiple objectives of mitigation and development | |
Shifting incentives | ‘Direct mitigation focus’ {2.8, 13.6} Objective: reduce GHG emissions now. Literature: how to design and implement policy instruments, with attention to distributional and other concerns. Examples: carbon tax, cap and trade, border carbon adjustment (BCA), disclosure policies. | ‘Co-benefits’ {5.6.2, 12.4.4, 17.3} Objective: synergies between mitigation and development. Literature: scope for and policies to realise synergies and avoid trade-offs across climate and development objectives. Examples: appliance standards, fuel taxes, community forest management, sustainable dietary guidelines, green building codes, packages for air pollution, packages for public transport. |
Enabling transition | ‘Socio-technical transitions’ {1.7.3, 5.5, 6.7, 10.8, Cross-Chapter Box 12 in Chapter 16} Objective: accelerate low-carbon shifts in socio-technical systems. Literature: understand socio-technical transition processes, integrated policies for different stages of a technology ‘S curve’ and explore structural, social and political elements of transitions. Examples: packages for renewable-energy transition and coal phase-out; diffusion of electric vehicles, process and fuel switching in key industries. | ‘System transitions to shift development pathways’ {7.4.5, 11.6.6, 13.9, 17.3.3, Cross-Chapter Box 5 in Chapter 4, Cro</span><span class="•-Condensed-italic">ss-Cha</span><span class="•-Condensed-italic">pter Box 12 in Chapter 16} Objective: accelerate system transitions and shift development pathways to expand mitigation options and meet other development goals. Literature: examines how structural development patterns and broad cross-sector and economy-wide measures drive ability to mitigate while achieving development goals through integrated policies and aligning enabling conditions. Examples: packages for sustainable urbanisation, land-energy-water nexus approaches, green industrial policy, regional Just Transition plans. |
The co-benefits and trade-offs of integrating adaptation and mitigation are most usefully identified and assessed prior to policymaking rather than being accidentally discovered (high confidence). This requires strengthening relevant national institutions to reduce silos and overlaps, increasing knowledge exchange at the country and regional levels, and supporting engagement with bilateral and multilateral funding partners. Local governments are well placed to develop policies that generate social and environmental co-benefits but to do so require legal backing and adequate capacity and resources. {13.8}
Climate change mitigation is accelerated when attention is given to integrated policy and economy-wide approaches, and when enabling conditions (governance, institutions, behaviour and lifestyle, innovation, policy, andfinance), are present (robust evidence, medium agreement). Accelerating climate mitigation includes simultaneously weakening high-carbon systems and encouraging low-carbon systems; ensuring interaction between adjacent systems (e.g., energy and agriculture); overcoming resistance to policies (e.g., from incumbents in high-carbon-emitting industries), including by providing transitional support to the vulnerable and negatively affected by distributional impacts; inducing changes in consumer practices and routines; providing transition support; and addressing coordination challenges in policy and governance. Table TS.9 elucidates the complexity of policymaking in driving sectoral transitions by summarising case studies of sectoral transitions from Chapters 5 to 12. These real-world sectoral transitions reinforce critical lessons on policy integration. (Table TS.9) {13.7, 13.9}
Table TS.9 | Case studies of integrated policymaking for sectoral transitions. Real-world sectoral transitions reinforce critical lessons on policy integration: a high-level strategic goal (column A), the need for a clear sectoral outcome framing (column B), a carefully coordinated mix of policy instruments and governance actions (column C), and the importance of context-specific governance factors (column D). Illustrative examples, drawn from sectors, help elucidate the complexity of policymaking in driving sectoral transitions. {Cross-Chapter Box 9 in Chapter 13, Table 1}
A. Illustrative case | B. Objective | C. Policy mix | D. Governance context | |
Enablers | Barriers | |||
Shift in mobility service provision in Kolkata, India {Box 5.8} | –Improve system efficiency, sustainability and comfort –Shift public perceptions of public transport | –Strengthen coordination between modes –Formalise and green auto-rickshaws –Procure fuel-efficient, comfortable low-floor AC buses –Ban cycling on busy roads –Deploy policy actors as change-agents, mediating between interest groups | –Cultural norms around informal transport-sharing, linked to high levels of social trust –Historically crucial role of buses in transit –App-cab companies shifting norms and formalising mobility-sharing –Digitalisation and safety on board | –Complexity: multiple modes with separate networks and meanings –Accommodating and addressing legitimate concerns from social movements about the exclusionary effects of ‘premium’ fares, cycling bans on busy roads |
LPG subsidy (‘Zero Kero’) programme, Indonesia {Box 6.3} | –Decrease fiscal expenditures on kerosene subsidies for cooking | –Subsidise provision of liquefied petroleum gas (LPG) cylinders and initial equipment –Convert existing kerosene suppliers to LPG suppliers | –Provincial government and industry support in targeting beneficiaries and implementation –Synergies in kerosene and LPG distribution infrastructures | –Continued user preference for traditional solid fuels –Reduced GHG benefits as subsidy shifted between fossil fuels |
Action Plan for Prevention and Control of Deforestation in the Legal Amazon, Brazil {Box 7.9} | –Control deforestation and promote sustainable development | –Expand protected areas; homologation of indigenous lands –Improve inspections, satellite-based monitoring –Restrict public credit for enterprises and municipalities with high deforestation rates –Set up a REDD+ mechanism (Amazon Fund) | –Participatory agenda-setting process –Cross-sectoral consultations on conservation guidelines –Mainstreaming of deforestation in government programmes and projects | –Political polarisation leading to erosion of environmental governance –Reduced representation and independence of civil society in decision-making bodies –Lack of clarity around land ownership |
Climate smart cocoa (CSC) production, Ghana {Box 7.12} | –Promote sustainable intensification of cocoa production –Reduce deforestation –Enhance incomes and adaptive capacities | –Distribute shade tree seedlings –Provide access to agronomic information and agrochemical inputs –Design a multi-stakeholder program including MNCs, farmers and NGOs | –Local resource governance mechanisms ensuring voice for smallholders –Community governance allowed adapting to local context –Private-sector role in popularising CSC | –Lack of secure tenure (tree rights) –Bureaucratic and legal hurdles to register trees –State monopoly on cocoa marketing, export |
Coordination mechanism for joining fragmented urban policymaking in Shanghai, China {Box 8.3} | –Integrate policymaking across objectives, towards low-carbon urban development | –Combine central targets and evaluation with local flexibility for initiating varied policy experiments –Establish a local leadership team for coordinating cross-sectoral policies involving multiple institutions –Create a direct programme fund for implementation and capacity-building | –Strong vertical linkages between central and local levels –Mandate for policy learning to inform national policy –Experience with mainstreaming mitigation in related areas (e.g., air pollution) | –Challenging starting point – low share of renewable energy, high dependency on fossil fuels –Continued need for high investments in a developing context |
Policy package for building energy efficiency, EU {Box SM.9.1} | –Reduce energy consumption, integrating renewable energy and mitigating GHG emissions from buildings | –Energy performance standards, set at nearly zero energy for new buildings –Energy performance standards for appliances –Energy performance certificates shown during sale –Long-term renovation strategies | –Binding EU-level targets, directives and sectoral effort-sharing regulations –Supportive urban policies, coordinated through city partnerships –Funds raised from allowances auctioned under the Emissions Trading Scheme (ETS) | –Inadequate local technical capacity to implement multiple instruments –Complex governance structure leading to uneven stringency |
African electromobility – trackless trams with solar in Bulawayo and e-motorbikes in Kampala {Box 10.4} | –Leapfrog into a decarbonised transport future –Achieve multiple social benefits beyond mobility provision | –Develop urban centres with solar at station precincts –Public-private partnerships for financing –Sanction demonstration projects for new electric transit and new electric motorbikes (for freight) | –‘Achieving SDGs’ was an enabling policy framing –Multi-objective policy process for mobility, mitigation and manufacturing –Potential for funding through climate finance –Co-benefits such as local employment generation | –Economic decline in the first decade of the 21st century –Limited fiscal capacity for public funding of infrastructure –Inadequate charging infrastructure for e-motorbikes |
Initiative for a climate-friendly industry in North Rhine Westphalia (NRW), Germany {Box 11.3} | –Collaboratively develop innovative strategies towards a net zero GHG industrial sector, while securing competitiveness | –Build platform to bring together industry, scientists and government in self-organised innovation teams –Intensive cross-branch cooperation to articulate policy/infrastructure needs | –NRW is Germany’s industrial heartland, with an export-oriented industrial base –Established government-industry ties –Active discourse between industry and public | –Compliance rules preventing in-depth co-operation |
Food2030 strategy, Finland {Box 12.2} | –Local, organic and climate-friendly food production –Responsible and healthy food consumption –A competitive food supply chain | –Target funding and knowledge support for innovations –Apply administrative means (legislation, guidance) to increase organic food production and procurement –Use education and information instruments to shift behaviour (media campaigns, websites) | –Year-long deliberative stakeholder engagement process across sectors –Institutional structures for agenda-setting, guiding policy implementation and reflexive discussions | –Weak role of integrated impact assessments (IAMs) to inform agenda-setting –Monitoring and evaluation close to ministry in charge –Lack of standardised indicators of food system sustainability |
Economy-wide packages, including economic-stimulus packages, can contribute to shifting sustainable development pathways and achieving net zero outcomes whilst meeting short-term economic goals (medium evidence, high agreement). The 2008–9 global recession showed that policies for sustained economic recovery go beyond short-term fiscal stimulus to include long-term commitments of public spending on the low-carbon economy, pricing reform, addressing affordability, and minimising distributional impacts. COVID-19 spurred stimulus packages and multi-objective recovery policies may also have potential to meet short-term economic goals while enabling longer-term sustainability goals. (Table TS.8) {13.9}
Box TS.13 | Policy Attribution: Methodologies For – and Estimations of – the Macro-level Impact of Mitigation Policies on Indices of GHG Mitigation
Policy attribution examines the extent to which GHG emission reductions, the proximate drivers of emissions, and the deployment of technologies that reduce emissions may be reasonably attributed to policies implemented prior to the observed changes. Such policies include regulatory instruments such as energy-efficiency programmes or technical standards and codes, carbon pricing, financial support for low-carbon energy technologies and efficiency, voluntary agreements, and regulation of land-use practices.
The vast majority of literature reviewed for this report examines the effect of particular instruments in particular contexts {13.6, 14.3, 16.4}, and only a small number directly or plausibly infer global impacts of policies. Policies also differ in design, scope, and stringency, may change over time as they require amendments or new laws, and often partially overlap with other instruments. These factors complicate analysis, because they give rise to the potential for double counting emissions reductions that have been observed. These lines of evidence on the impact of polices include:
- GHG Emissions. Evidence from econometric assessments of the impact of policies in countries which took on Kyoto Protocol targets; decomposition analyses that identify policy-related, absolute reductions from historical levels in particular countries. {13.6.2, 14.3.3, Cross-Chapter Box 10 in Chapter 14}
Proximateemission drivers. Trends in the factors that drive emissions including reduced rates of deforestation {7.6.2}, industrial energy efficiency {Box 16.3}, buildings energy efficiency {Figure 2.22}, and the policy-driven displacement of fossil fuel combustion by renewable energy. (Box TS.13, Table 1; Box TS.13, Figure 1) {Chapters 2 and 6, Cross-Chapter Box 10 in Chapter 14}
- Technologies. The literature indicates unambiguously that the rapid expansion of low-carbon energy technologies is substantially attributable to policy. {6.7.5, 16.5}
As illustrated in Box TS.13, Figure 1, these multiple lines of evidence point to policies having had a discernible impact on mitigation for specific countries, sectors, and technologies ( high confidence), avoiding emissions of several GtCO2-eq yr –1 globally (medium confidence).
Box TS.13, Table 1 | The effects of policy on GHG emissions, drivers of emissions, and technology deployment.
Sector | Effects on emissions | Effects on immediate drivers | Effects on low-carbon technology |
Energy supply {Chapter 6} | Carbon pricing, emissions standards, and technology support have led to declining emissions associated with the supply of energy. | Carbon pricing and technology support have led to improvements in the efficiency of energy conversion. | A variety of market-based instruments, especially technology-support policies have led to high diffusion rates and cost reductions for renewable energy technologies. |
AFOLU {Chapter 7} | Regulation of land-use rights and practices have led to falling aggregate AFOLU-sector emissions. | Regulation of land-use rights and practices, payments for ecosystem service, and offsets, have led to decreasing rates of deforestation (medium confidence). | |
Buildings {Chapter 9} | Regulatory standards have led to reduced emissions from new buildings. | Regulatory standards, financial support for building renovation and market-based instruments have led to improvements in building and building-system efficiencies. | Technology support and regulatory standards have led to adoption of low-carbon heating systems and high-efficiency appliances. |
Transport {Chapter 10} | Vehicle standards, land-use planning, and carbon pricing have led to avoided emissions in ground transportation. | Vehicle standard, carbon pricing, and support for electrification have led to automobile efficiency improvements. | Technology support and emissions standards have increased diffusion rates and cost reductions for electric vehicles. |
Industry {Chapter 11} | Carbon pricing has led to efficiency improvements in industrial facilities. |
Note: statements describe the effects of policies across those countries where policies are in place. Unless otherwise noted, all findings are of high confidence.
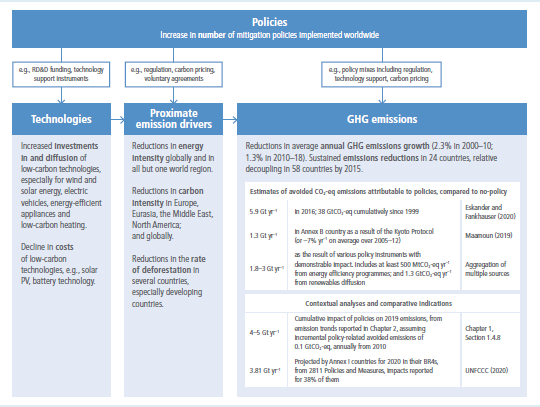
Box TS.13, Figure1 | Policy impacts on key outcome indices: GHG emissions, proximate emission drivers, and technologies, including several lines of evidence on GHG abatement attributable to policies. {Cross-Chapter Box 10, Figure 1 in Chapter 14}
TS.6.2 International Cooperation
International cooperation is having positive and measurable results (high confidence). The Kyoto Protocol led to measurable and substantial avoided emissions, including in 20 countries with Kyoto first-commitment period targets that have experienced a decade of declining absolute emissions. It also built national capacity for GHG accounting, catalysed the creation of GHG markets, and increased investments in low-carbon technologies. Other international agreements and institutions have led to avoided CO2 emissions from land-use practices, as well as avoided emissions of some non-CO2 greenhouse gases (medium confidence). {14.3, 14.5, 14.6}
New forms of international cooperation have emerged since AR5 in line with an evolving understanding of effective mitigation policies, processes, and institutions. Both new and pre-existing forms of cooperation are vital for achieving climate mitigation goals in the context of sustainable development (high confidence). While previous IPCC assessments have noted important synergies between the outcomes of climate mitigation and achieving sustainable development objectives, there now appear to be synergies between the two processes themselves (medium confidence). Since AR5, international cooperation has shifted towards facilitating national-level mitigation action through numerous channels, including though processes established under the UNFCCC regime and through regional and sectoral agreements and organisations. {14.2, 14.3, 14.5, 14.6}
Participation in international agreements and transboundary networks is associated with the adoption of climate policies at the national and sub-national levels, as well as by non-state actors (high confidence). International cooperation helps countries achieve long-term mitigation targets when it supports development and diffusion of low-carbon technologies, often at the level of individual sectors, which can simultaneously lead to significant benefits in the areas of sustainable development and equity (medium confidence). {14.2, 14.3, 14.5, 14.6}
International cooperation under the UN climate regime took an important new direction with the entry into force of the 2015 Paris Agreement, which strengthened the objective of the UN climate regime, including its long-term temperature goal, while adopting a different architecture to that of the Kyoto Protocol (high confidence). The core national commitments under the Kyoto Protocol were legally binding quantified emission targets for developed countries tied to well-defined mechanisms for monitoring and enforcement. By contrast, the commitments under the Paris Agreement are primarily procedural, extend to all parties, and are designed to trigger domestic policies and measures, enhance transparency, and stimulate climate investments, particularly in developing countries, and to lead iteratively to rising levels of ambition across all countries. Issues of equity remain of central importance in the UN climate regime, notwithstanding shifts in the operationalisation of ‘common but differentiated responsibilities and respective capabilities’ from Kyoto to Paris. {14.3}
There are conflicting views on whether the Paris Agreement’s commitments and mechanisms will lead to the attainment of its stated goals (medium confidence). Arguments in support of the Paris Agreement are that the processes it initiates and supports will in multiple ways lead, and indeed have already led, to rising levels of ambition over time. The recent proliferation of national mid-century net zero GHG targets can be attributed in part to the Paris Agreement. Moreover, its processes and commitments will enhance countries’ abilities to achieve their stated level of ambition, particularly among developing countries. Arguments against the Paris Agreement are that it lacks a mechanism to review the adequacy of individual Parties’ Nationally Determined Contributions (NDCs), that collectively current NDCs are inconsistent in their level of ambition with achieving the Paris Agreement’s long-term temperature goal, that its processes will not lead to sufficiently rising levels of ambition in the NDCs, and that NDCs will not be achieved because the targets, policies and measures they contain are not legally binding at the international level. To some extent, arguments on both sides are aligned with different analytic frameworks, including assumptions about the main barriers to mitigation that international cooperation can help overcome. The extent to which countries increase the ambition of their NDCs and ensure they are effectively implemented will depend in part on the successful implementation of the support mechanisms in the Paris Agreement, and in turn will determine whether the goals of the Paris Agreement are met ( high confidence). {14.2, 14.3, 14.4}
International cooperation outside the UNFCCC processes and agreements provides critical support for mitigation in particular regions, sectors and industries, for particular types of emissions, and at the sub- and trans-national levels (high confidence). Agreements addressing ozone depletion, transboundary air pollution, and release of mercury are all leading to reductions in the emissions of specific greenhouse gases. Cooperation is occurring at multiple governance levels including cities. Transnational partnerships and alliances involving non-state and sub-national actors are also playing a growing role in stimulating low-carbon technology diffusion and emissions reductions (medium confidence). Such transnational efforts include those focused on climate litigation; the impacts of these are unclear but promising. Climate change is being addressed in a growing number of international agreements operating at sectoral levels, as well as within the practices of many multilateral organisations and institutions. Sub-global and regional cooperation, often described as climate clubs, can play an important role in accelerating mitigation, including the potential for reducing mitigation costs through linking national carbon markets, although actual examples of these remain limited. {14.2, 14.4, 14.5, 14.6}
International cooperation will need to be strengthened in several key respects in order to support mitigation action consistent with limiting temperature rise to well below 2°C in the context of sustainable development and equity (high confidence). Many developing countries’ NDCs have components or additional actions that are conditional on receiving assistance with respect to finance, technology development and transfer, and capacity-building, greater than what has been provided to date. Sectoral and sub-global cooperation is providing critical support, and yet there is room for further progress. In some cases, notably with respect to aviation and shipping, sectoral agreements have adopted climate mitigation goals that fall far short of what would be required to achieve the long-term temperature goal of the Paris Agreement. Moreover, there are cases where international cooperation may be hindering mitigation efforts, namely evidence that trade and investment agreements, as well as agreements within the energy sector, impede national mitigation efforts (medium confidence). International cooperation is emerging but so far fails to fully address transboundary issues associated with solar radiation modification (SRM) and carbon dioxide removal (CDR). {14.2, 14.3, 14.4, 14.5, 14.6, Cross-Working Group Box 4 in Chapter 14}
TS.6.3 Societal Aspects of Mitigation
Social equity reinforces capacity and motivation for mitigating climate change (medium confidence). Impartial governance such as fair treatment by law-and-order institutions, fair treatment by gender, and income equity, increases social trust, thus enabling demand-side climate policies. High-status (often high-carbon) item consumption may be reduced by taxing absolute wealth without compromising well-being. {5.2, 5.4.2, 5.6}
Policies that increase the political access and participation of women, racialised, and marginalised groups, increase the democratic impetus for climate action (high confidence) . Including more differently situated knowledge and diverse perspectives makes climate mitigation policies more effective. {5.2, 5.6}
Greater contextualisation and granularity in policy approaches better addresses the challenges of rapid transitions towards zero-carbon systems (high confidence). Larger systems take more time to evolve, grow, and change compared to smaller ones. Creating and scaling up entirely new systems takes longer than replacing existing technologies and practices. Late adopters tend to adopt faster than early pioneers. Obstacles and feasibility barriers are high in the early transition phases. Barriers decrease as a result of technical and social learning processes, network building, scale economies, cultural debates, and institutional adjustments. {5.5, 5.6}
Mitigation policies that integrate and communicate with the values people hold are more successful (high confidence). Values differ between cultures. Measures that support autonomy, energy security and safety, equity and environmental protection, and fairness resonate well in many communities and social groups. Changing from a commercialised, individualised, entrepreneurial training model to an education cognisant of planetary health and human well-being can accelerate climate change awareness and action. {5.4.1, 5.4.2}
Changes in consumption choices that are supported by structural changes and political action enable the uptake of low-carbon choices (high confidence). Policy instruments applied in coordination can help to accelerate change in a consistent desired direction. Targeted technological change, regulation, and public policy can help in steering digitalisation, the sharing economy, and circular economy towards climate change mitigation. (Boxes TS.12 and TS.14) {5.3, 5.6}
Complementarity in policies helps in the design of an optimal demand-side policy mix (medium confidence). In the case of energy efficiency, for example, this may involve CO2 pricing, standards and norms, and information feedback. {5.3, 5.4, 5.6}
TS.6.4 Investment and Finance
Finance to reduce net GHG emissions and enhance resilience to climate impacts is a critical enabling factor for the lo w-carbon transition. Fundamental inequities in access to finance as well as finance terms and conditions, and countries’ exposure to physical impacts of climate change overall, result in a worsening outlook for a global Just Transition (high confidence). Decarbonising the economy requires global action to address fundamental economic inequities and overcome the climate investment trap that exists for many developing countries. For these countries the costs and risks of financing often represent a significant challenge for stakeholders at all levels. This challenge is exacerbated by these countries’ general economic vulnerability and indebtedness. The rising public fiscal costs of mitigation, and of adapting to climate shocks, is affecting many countries and worsening public indebtedness and country credit ratings at a time when there were already significant stresses on public finances. The COVID-19 pandemic has made these stresses worse and tightened public finances still further. Other major challenges for commercial climate finance include: the mismatch between capital and investment needs, home bias 31 considerations, differences in risk perceptions for regions, as well as limited institutional capacity to ensure safeguards are effective ( high confidence). {15.2, 15.6.3}
Investors, central banks, and financial regulators are driving increased awareness of climate risk. This increased awareness can support climate policy development and implementation (high confidence) {15.2, 15.6}. Climate-related financial risks arise from physical impacts of climate change (already relevant in the short term), and from a disorderly transition to a low-carbon economy. Awareness of these risks is increasing, leading also to concerns about financial stability. Financial regulators and institutions have responded with multiple regulatory and voluntary initiatives to assess and address these risks. Yet despite these initiatives, climate-related financial risks remain greatly underestimated by financial institutions and markets, limiting the capital reallocation needed for the low-carbon transition. Moreover, risks relating to national and international inequity – which act as a barrier to the transformation – are not yet reflected in decisions by the financial community. Stronger steering by regulators and policymakers has the potential to close this gap. Despite the increasing attention of investors to climate change, there is limited evidence that this attention has directly impacted emission reductions. This leaves high uncertainty, both near term (2021–30) and longer term (2021–50), on the feasibility of an alignment of financial flows with the Paris Agreement goals ( high confidence). {15.2, 15.6}
Progress on the alignment of financial flows with low-GHG emissions pathways remains slow. There is a climate financing gap which reflects a persistent misallocation of global capital (high confidence) {15.2, 15.3}. Persistently high levels of both public and private fossil fuel-related financing continue to be of major concern despite promising recent commitments. This reflects policy misalignment, the current perceived risk-return profile of fossil fuel-related investments, and political economy constraints ( high confidence). Estimates of climate finance flows 32 exhibit highly divergent patterns across regions and sectors and a slowing growth {15.3}. When the perceived risks are too high, the misallocation of abundant savings persists and investors refrain from investing in infrastructure and industry in search of safer financial assets, even earning low or negative real returns ( high confidence). {15.2, 15.3}
Global climate finance is heavily focused on mitigation (more than 90% on average between 2017–2020) (high confidence) {15.4, 15.5}. This is despite the significant economic effects of climate change’s expected physical impacts, and the increasing awareness of these effects on financial stability. To meet the needs for rapid deployment of mitigation options, global mitigation investments are expected to need to increase by the factor of three to six ( high confidence). The gaps represent a major challenge for developing countries, especially Least-Developed Countries (LDCs), where flows have to increase by the factor of four to seven for specific sectors such as AFOLU, and for specific groups with limited access to, and high costs of, climate finance ( high confidence) (Figure TS.25) {15.4, 15.5}. The actual size of sectoral and regional climate financing gaps is only one component driving the magnitude of the challenge. Financial and economic viability, access to capital markets, appropriate regulatory frameworks, and institutional capacity to attract and facilitate investments and ensure safeguards are decisive to scaling-up funding. Soft costs for regulatory environment and institutional capacity, upstream funding needs as well as R&D and venture capital for development of new technologies and business models are often overlooked despite their critical role to facilitate the deployment of scaled-up climate finance ( high confidence). {15.4.1, 15.5.2}
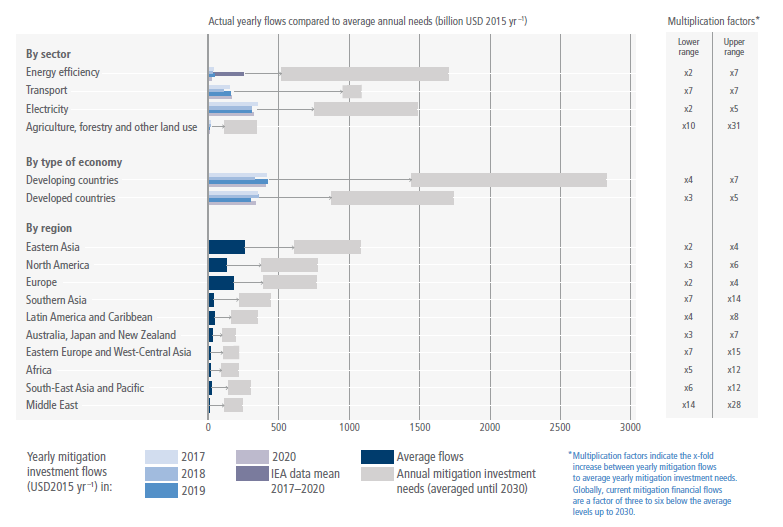
Figure TS.25 | Breakdown of recent average (downstream) mitigation investments and model-based investment requirements for 2020–2030 (USD billion) in scenarios that likely limit warming to 2°C or lower. Mitigation investment flows and model-based investment requirements by sector / segment (energy efficiency in buildings and industry, transport including efficiency, electricity generation, transmission and distribution including electrification, and agriculture, forestry and other land use), by type of economy, and by region (see Annex II Part I Section 1: By region is based on intermediate level (R10) classification scheme. By type of economy is based on intermediate level (R10) classification scheme, which considers ‘North America’, ‘Europe’, and ’Australia, Japan and New Zealand’ as developed countries, and the other seven regions as developing countries). Breakdown by sector / segment may differ slightly from sectoral analysis in other contexts due to the availability of investment needs data. The granularity of the models assessed in Chapter 3, and other studies, do not allow for a robust assessment of the specific investment needs of LDCs or SIDSs. Investment requirements in developing countries might be underestimated due to missing data points as well as underestimated technology costs. In modelled pathways, regional investments are projected to occur when and where they are cost cost-effective to limit global warming. The model quantifications help to identify high-priority areas for cost-effective investments, but do not provide any indication on who would finance the regional investments. Investment requirements and flows covering downstream / mitigation technology deployment only. Data includes investments with a direct mitigation effect, and in the case of electricity, additional transmission and distribution investments. See section 15.4.2 Quantitative assessment of financing needs for detailed data on investment requirements. Data on mitigation investment flows are based on a single series of reports (Climate Policy Initiative, CPI) which assembles data from multiple sources. Investment flows for energy efficiency are adjusted based on data from the International Energy Agency (IEA). Data on mitigation investments do not include technical assistance (i.e., policy and national budget support or capacity building), other non-technology deployment financing. Adaptation only flows are also excluded. Data on mitigation investment requirements for electricity are based on emission pathways C1, C2 and C3 (Table SPM.1). For electricity investment requirements, the upper end refers to the mean of C1 pathways and the lower end to the mean of C3 pathways. Data points for energy efficiency, transport and AFOLU cannot always be linked to C1–C3 scenarios. Data do not include needs for adaptation or general infrastructure investment or investment related to meeting the SDGs other than mitigation, which may be at least partially required to facilitate mitigation. The multiplication factors show the ratio of average annual model-based mitigation investment requirements (2020–2030) and most recent annual mitigation investments (averaged for 2017–2020). The lower and upper multiplication factors refer to the lower and upper ends of the range of investment needs.
Given the multiple sources and lack of harmonised methodologies, the data can only be indicative of the size and pattern of investment gaps. The gap between most recent flows and required investments is only a single indicator. A more comprehensive (and qualitative) assessment is required in order to understand the magnitude of the challenge of scaling up investment in sectors and regions. The analysis also does not consider the effects of misaligned flows. {15.3, 15.4, 15.5, Table 15.2, Table 15.3, Table 15.4}
The relatively slow implementation of commitments by countries and stakeholders in the financial sector to scale up climate finance reflects neither the urgent need for ambitious climate action, nor the economic rationale for ambitious climate action (high confidence) . Delayed climate investments and financing – and limited alignment of investment activity with the Paris Agreement – will result in significant carbon lock-ins, stranded assets, and other additional costs. This will particularly impact urban infrastructure and the energy and transport sectors ( high confidence). A common understanding of debt sustainability and debt transparency, including negative implications of deferred climate investments on future GDP, and how stranded assets and resources may be compensated, has not yet been developed (medium confidence). {15.6}
There is a mismatch between capital availability in the developed world and the future emissions expected in developing countries (high confidence). This emphasises the need to recognise the explicit and positive social value of global cross-border mitigation financing. A significant push for international climate finance access for vulnerable and poor countries is particularly important given these countries’ high costs of financing, debt stress and the impacts of ongoing climate change ( high confidence). {15.2, 15.3.2.3, 15.5.2, 15.6.1, 15.6.7}
Innovative financing approaches could help reduce the systemic under-pricing of climate risk in markets and foster demand for investment opportunities aligned with the Paris Agreement goals. Approaches include de-risking investments, robust ‘green’ labelling and disclosure schemes, in addition to a regulatory focus on transparency and reforming international monetary system financial sector regulations (medium confidence). Green bond markets and markets for sustainable finance products have grown significantly since AR5 and the landscape continues to evolve. Underpinning this evolution is investors’ preference for scalable and identifiable low-carbon investment opportunities. These relatively new labelled financial products will help by allowing a smooth integration into existing asset allocation models ( high confidence). Green bond markets and markets for sustainable finance products have also increased significantly since AR5, but challenges nevertheless remain, in particular, there are concerns about ‘greenwashing’ and the limited application of these markets to developing countries ( high confidence). {15.6.2, 15.6.6}
New business models (e.g., pay-as-you-go) can facilitate the aggregation of small-scale financing needs and provide scalable investment opportunities with more attractive risk-return profiles (high confidence). Support and guidance for enhancing transparency can promote capital markets’ climate financing by providing quality information to price climate risks and opportunities. Examples include SDG and environmental, social and governance (ESG) disclosure, scenario analysis and climate risk assessments, including the Task Force on Climate-related Financial Disclosures (TCFD). The outcome of these market-correcting approaches on capital flows cannot be taken for granted, however, without appropriate fiscal, monetary and financial policies. Mitigation policies will be required to enhance the risk-weighted return of low-emission and climate-resilient options, accelerate the emergence and support for financial products based on real projects, such as green bonds, and phase-out fossil fuel subsidies. Greater public-private cooperation can also encourage the private sector to increase and broaden investments, within a context of safeguards and standards, and this can be integrated into national climate change policies and plans ( high confidence). {15.1, 15.2.4, 15.3.1, 15.3.2, 15.3.3, 15.5.2, 15.6.1, 15.6.2, 15.6.6, 15.6.7, 15.6.8}
Ambitious global climate policy coordination and stepped-up public climate financing over the next decade (2021–2030) can help redirect capital markets and overcome challenges relating to the need for parallel investments in mitigation. It can also help address macroeconomic uncertainty and alleviate developing countries’ debt burden post-COVID-19 (high confidence). Providing strong climate policy signals helps guide investment decisions. Credible signalling by governments and the international community can reduce uncertainty for financial decision-makers and help reduce transition risk. In addition to indirect and direct subsidies, the public sector’s role in addressing market failures, barriers, provision of information, and risk-sharing can encourage the efficient mobilisation of private sector finance ( high confidence){15.2, 15.6.1, 15.6.2}. The mutual benefits of coordinated support for climate mitigation and adaptation in the next decade for both developed and developing regions could potentially be very high in the post-COVID era. Climate-compatible stimulus packages could significantly reduce the macro-financial uncertainty generated by the pandemic and increase the sustainability of the world economic recovery {15.2, 15.3.2.3, 15.5.2, 15.6.1, 15.6.7}. Political leadership and intervention remain central to addressing uncertainty, which is a fundamental barrier for the redirection of financial flows. Existing policy misalignments – for example, in fossil fuel subsidies – undermine the credibility of public commitments, reduce perceived transition risks and limit financial sector action ( high confidence). {15.2, 15.3.3, 15.6.1, 15.6.2, 15.6.3}
The greater the urgency of action to remain on a 1.5°C pathway, the greater need for parallel investment decisions in upstream and downstream parts of the value chain (high confidence). Greater urgency also reduces the lead times to build trust in regulatory frameworks. Consequently, many investment decisions will need to be made based on the long-term global goals. This highlights the importance of trust in political leadership which, in turn, affects risk perception and ultimately financing costs ( high confidence). {15.6.1, 15.6.2}
Accelerated international cooperation on finance is a critical enabler of a low-carbon and Just Transition (very high confidence). Scaled-up public grants for adaptation and mitigation, and funding for low-income and vulnerable regions, especially in Sub-Saharan Africa, may have the highest returns. Key options include: increased public finance flows from developed to developing countries beyond USD100 billion a year; shifting from a direct lending modality towards public guarantees to reduce risks and greatly leverage private flows at lower cost; local capital markets development; and, changing the enabling operational definitions. A coordinated effort to green the post-pandemic recovery is also essential in countries facing much higher debt costs ( high confidence). {15.2, 15.6}
TS.6.5 Innovation, Technology Development and Transfer
Innovation in climate mitigation technologies has seen enormous activity and significant progress in recent years. Innovation has also led to, and exacerbated, trade-offs in relation to sustainable development. Innovation can leverage action to mitigate climate change by reinforcing other interventions. In conjunction with other enabling conditions, innovation can support system transitions to limit warming and help shift development pathways. The currently widespread implementation of solar PV and LED lighting, for instance, could not have happened without technological innovation . Technological innovation can also bring about new and improved ways of delivering services that are essential to human well-being ( high confidence) {16.1, 16.3, 16.4, 16.6}. At the same time as delivering benefits, innovation can result in trade-offs that undermine both progress on mitigation and progress towards other Sustainable Development Goals (SDGs). Trade-offs include negative externalities’ – for instance, greater environmental pollution and social inequalities – rebound effects leading to lower net emission reductions or even increases in emissions, and increased dependency on foreign knowledge and providers ( high confidence). Effective governance and policy have the potential to avoid and minimise such misalignments (medium evidence, high agreement ). {16.2, 16.3, 16.4, 16.5.1, 16.6}
A systemic view of innovation to direct and organise the processes has grown over the last decade. This systemic view of innovation takes into account the role of actors, institutions, and their interactions, and can inform how innovation systems that vary across technologies, sectors and countries, can be strengthened (high confidence) {16.2, 16.3, 16.5}. Where a systemic view of innovation has been taken, it has enabled the development and implementation of indicators that are better able to provide insights in innovation processes. This, in turn, has enabled the analysis and strengthening of innovation systems. Traditional quantitative innovation indicators mainly include R&D investments and patents. Figure TS.26 illustrates that energy-related research, development and demonstration (RD&D) has risen slowly in the last two decades, and that there has been a reorientation of the portfolio of funded energy technologies. Systemic indicators of innovation, however, go well beyond these approaches. They include structural innovation system elements including actors and networks, as well as indicators for how innovation systems function, such as access to finance, employment in relevant sectors, and lobbying activities {16.3.4, Table 16.7}. For example, in Latin America, monitoring systemic innovation indicators for the effectiveness of agroecological mitigation approaches has provided insights on the appropriateness and social alignment of new technologies and practices {Box 16.5}. Climate-energy-economy models, including integrated assessment models (IAMs), generally employ a stylised and necessarily incomplete view of innovation, and have yet to incorporate a systemic representation of innovation systems. {16.2.4, Box 16.1}
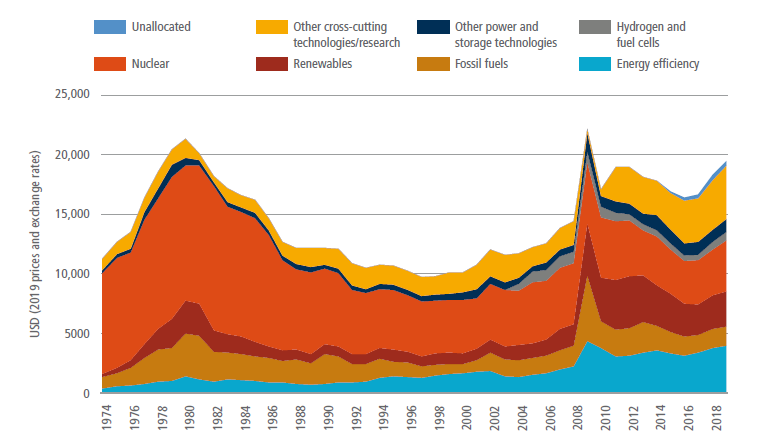
Figure TS.26 | Fraction of public energy research, development and demonstration (RD&D) spending by technology over time for IEA (largely OECD) countries between 1974 and 2018. {Box 16.3, Figure 1}
A systemic perspective on technological change can provide insights to policymakers supporting their selection of effective innovation policy instruments (high confidence) {16.4, 16.5}. A combination of scaled-up innovation investments with demand-pull interventions can achieve faster technology unit cost reductions and more rapid scale-up than either approach in isolation . These innovation policy instruments would nonetheless have to be tailored to local development priorities, to the specific context of different countries, and to the technology being supported. The timing of interventions and any trade-offs with sustainable development also need to be addressed. Public R&D funding and support, as well as innovation procurement, have shown to be valuable for fostering innovation in small-to-medium clean-tech firms (Figure TS.27) {16.4.4.3}. Innovation outcomes of policy instruments not necessarily aimed at innovation, such as feed-in tariffs, auctions, emissions trading schemes, taxes and renewable portfolio standards, vary from negligible to positive for climate change mitigation. Some specific designs of environmental taxation can also result in negative distributional outcomes {16.4.4}. Most of the available literature and evidence on innovation systems come from industrialised countries and larger developing countries. However, there is a growing body of evidence from developing countries and Small Island Developing States (SIDS). {16.4, 16.5, 16.7}
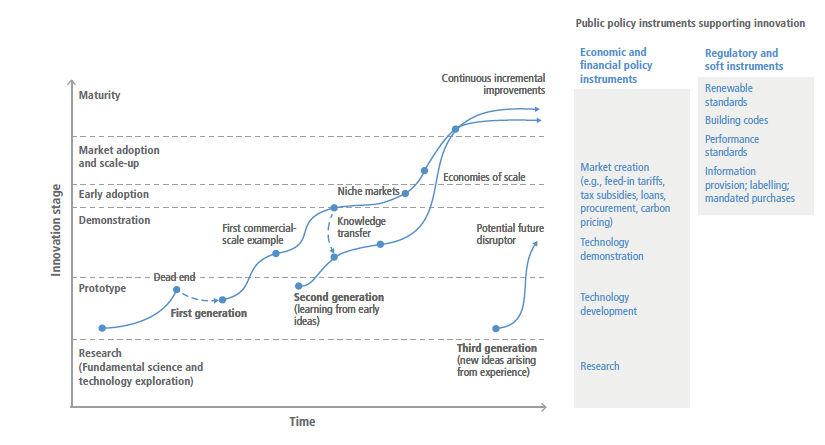
Figure TS.27 | Technology innovation process and the (illustrative) roles of different public policy instruments (on the right-hand side). {Figure 16.1}Note that demand-pull instruments in the regulatory instrument category, for instance, can also shape the early stages of the innovation process. Their position in the latter stages is highlighted in this figure because typically these instruments have been introduced in latter stages of the development of the technology. {16.4.4}
Experience and analyses show that technological change is inhibited if technological innovation system functions are not adequately fulfilled; this inhibition occurs more often in developing countries (high confidence). Examples of such functions are knowledge development, resource mobilisation, and activities that shape the needs, requirements and expectations of actors within the innovation system (guidance of the search). Capabilities play a key role in these functions, the buildup of which can be enhanced by domestic measures, but also by international cooperation. For instance, innovation cooperation on wind energy has contributed to the accelerated global spread of this technology. As another example, the policy guidance by the Indian government, which also promoted development of data, testing capabilities and knowledge within the private sector, has been a key determinant of the success of an energy-efficiency programme for air conditioners and refrigerators in India. {16.3, 16.5, 16.6, Cross-Chapter Box 12 in Chapter 16, Box 16.3}
Consistent with innovation system approaches, the sharing of knowledge and experiences between developed and developing countries can contribute to addressing global climate and the SDGs. The effectiveness of such international cooperation arrangements, however, depends on the way they are developed and implemented (high confidence). The effectiveness and sustainable development benefits of technology sharing under market conditions appears to be determined primarily by the complexity of technologies, local capabilities and the policy regime. This suggests that the development of planning and innovation capabilities remains necessary, especially in Least-Developed Countries (LDCs) and SIDS. International diffusion of low-emission technologies is also facilitated by knowledge spillovers from regions engaged in clean R&D (medium confidence). {16.2}
The evidence on the role of intellectual property rights (IPR) in innovation is mixed. Some literature suggests that it is a barrier while other sources suggests that it is an enabler to the diffusion of climate-related technologies (medium confidence). There is agreement that countries with well-developed institutional capacity may benefit from a strengthened IPR regime, but that countries with limited capabilities might face greater barriers to innovation as a consequence. This enhances the continued need for capacity-building. Ideas to improve the alignment of the global IPR regime and addressing climate change include specific arrangements for LDCs, case-by-case decision-making and patent-pooling institutions. {16.2.3, 16.5, Box 16.10}
Although some initiativeshave mobilised investments in developing countries, gaps in innovation cooperation remain, including in the Paris Agreement instruments. These gaps could be filled by enhancing financial support for international technology cooperation, by strengthening cooperative approaches, and by helping build suitable capacity in developing countries across all technological innovation system functions (high confidence). The implementation of current arrangements of international cooperation for technology development and transfer, as well as capacity-building, are insufficient to meet climate objectives and contribute to sustainable development. For example, despite building a large market for mitigation technologies in developing countries, the lack of a systemic perspective in the implementation of the Clean Development Mechanism (CDM), operational since the mid-2000s, has only led to some technology transfer, especially to larger developing countries, but limited capacity building and minimal technology development (medium confidence). In the current climate regime, a more systemic approach to innovation cooperation could be introduced by linking technology institutions, such as the Technology Mechanism, and financial actors, such as the Financial Mechanism. {16.5.3}
Countries are exposed to sustainable development challenges in parallel with the challenges that relate to climate change. Addressing both sets of challenges simultaneously presents multiple and recurrent obstacles that systemic approaches to technological change could help resolve, provided they are well managed (high confidence). Obstacles include both entrenched power relations dominated by vested interests that control and benefit from existing technologies, and governance structures that continue to reproduce unsustainable patterns of production and consumption (medium confidence). Studies also highlight the potential of cultural factors to strongly influence the pace and direction of technological change. Sustainable solutions require adoption and mainstreaming of locally novel technologies that can meet local needs, and simultaneously address the SDGs. Acknowledging the systemic nature of technological innovation – which involve many levels of actors, stages of innovation and scales – can lead to new opportunities to shift development pathways towards sustainability. {16.4, 16.5, 16.6}
Strategies for climate change mitigation can be most effective in accelerating transformative change when actions taken to strengthen one set of enabling conditions also reinforce and strengthen the effectiveness of other enabling conditions (medium confidence). Applying transition or system dynamics to decisions can help policymakers take advantage of such high-leverage intervention points, address the specific characteristics of technological stages, and respond to societal dynamics. Inspiration can be drawn from the global unit-cost reductions of solar PV, which were accelerated by a combination of factors interacting in a mutually reinforcing way across a limited group of countries ( high confidence) {Box 16.2, Cross-Chapter Box 12 in Chapter 16}. Transitions can be accelerated by policies appropriately targeted, which may be grouped in different ‘pillars of policy’. The relative importance of different ‘pillars’ differs according to the stage of the transition. (Figure TS.28) {1.2.3}

Figure TS.28 | Transition dynamics: levels, policies and processes. {Figure 1.7}The relative importance of different ‘pillars of policy’ differs according to the stage of the transition. The lower panel illustrates growth of innovative technologies or practices, which if successful, emerge from niches into an S-shaped dynamic of exponential growth. The diffusion stage often involves new infrastructure and reconfiguration of existing market and regulatory structures. During the phase of more widespread diffusion, growth levels off to linear, then slows as the industry and market matures. The processes displace incumbent technologies/practices which decline, initially slowly, but then at an accelerating pace. Many related literatures identify three main levels with different characteristics, most generally termed micro, meso and macro.
Better and more comprehensive data on innovation indicators can provide timely insights for policymakers and policy design locally, nationally and internationally, especially for developing countries, where such insights are often missing. Data needed include those that can show the strength of technological, sectoral and national innovation systems. It is also necessary to validate current results and generate insights from theoretical frameworks and empirical studies for developing countries’ contexts. Innovation studies on adaptation and mitigation other than energy and ex-post assessments of the effectiveness of various innovation-related policies and interventions, including R&D, would also provide benefits. Furthermore, methodological developments to improve the ability of IAMs to capture energy innovation system dynamics and the relevant institutions and policies (including design and implementation), would allow for more realistic assessment. {16.2, 16.3, 16.7}
Box TS.14 | Digitalisation
Digital technologies can promote large increases in energy efficiency through coordination and an economic shift to services, but they can also greatly increase energy demand because of the energy used in digital devices ( high confidence). {Cross-Chapter Box 11 in Chapter 16, 16.2}
Digital devices, including servers, increase pressure on the environment due to the demand for rare metals and end-of-life disposal. The absence of adequate governance in many countries can lead to harsh working conditions and unregulated disposal of electronic waste. Digitalisation also affects firms’ competitiveness, the demand for skills, and the distribution of, and access to resources. The existing digital divide, especially in developing countries, and the lack of appropriate governance of the digital revolution can hamper the role that digitalisation could play in supporting the achievement of stringent mitigation targets. At present, the understanding of both the direct and indirect impacts of digitalisation on energy use, carbon emissions and potential mitigation is limited (medium confidence).
The digital transformation is a megatrend that is fundamentally changing all economies and societies, albeit in very different ways depending on the level of development of a given country and on the nature of its economic system. Digital technologies have significant potential to contribute to decarbonisation due to their ability to increase energy and material efficiency, make transport and building systems less wasteful, and improve the access to services for consumers and citizens. Yet, if left unmanaged, the digital transformation will probably increase energy demand, exacerbate inequities and the concentration of power, leaving developing economies with less access to digital technologies behind, raise ethical issues, reduce labour demand and compromise citizens’ welfare. Appropriate governance of the digital transformation can ensure that digitalisation works as an enabler, rather than as a barrier and further strain in decarbonisation pathways. Governance can ensure that digitalisation not only reduces GHG emissions intensity but also contributes to reducing absolute GHG emission, constraining run-away consumption. {Cross-Chapter Box 11 in Chapter 16, 16.2}
Digital technologies have the potential to reduce energy demand in all end-use sectors through steep improvements in energy efficiency. This includes material input savings and increased coordination as they allow the use of fewer inputs to perform a given task. Smart appliances and energy management, supported by choice architectures, economic incentives and social norms, effectively reduce energy demand and associated GHG emissions by 5–10% while maintaining equal service levels. Data centres can also play a role in energy-system management, for example by waste-heat utilisation where district heat systems are close by; temporal and spatial scheduling of electricity demand can provide about 6% of the total potential demand response. {5.5, Cross-Chapter Box 11, Table 1 in Chapter 16}
Digital technologies, analytics and connectivity consume large amounts of energy, implying higher direct energy demand and related carbon emissions. Global energy demand from digital appliances reached 7.14 EJ in 2018. The demand for computing services increased by 550% between 2010 and 2018 and is now estimated at 1% of global electricity consumption. Due to efficiency improvements, the associated energy demand increased only modestly, by about 6% from 2000 to 2018. {Box 9.5}
System-wide effects endanger energy and GHG-emission savings. Rising demand can diminish energy savings, and also produce run-away effects associated with additional consumption and GHG emissions if left unregulated. Savings are varied in smart and shared mobility systems, as ride-hailing increases GHG emissions due to deadheading, whereas shared pooled mobility and shared cycling reduce GHG emissions, as occupancy levels and/or weight per person kilometre transported improve. Systemic effects have wider boundaries of analysis and are more difficult to quantify and investigate but are nonetheless very relevant. Systemic effects tend to have negative impacts, but policies and adequate infrastructures and choice architectures can help manage and contain these. {5.3, 5.4, 5.6}
TS.7 Mitigation in the Context of Sustainable Development
Accelerating climate mitigation in the context of sustainable development involves not only expediting the pace of change but also addressing the underlying drivers of vulnerability and emissions. Addressing these drivers can enable diverse communities, sectors, stakeholders, regions and cultures to participate in just, equitable and inclusive processes that improve the health and well-being of people and the planet. Looking at climate change from a justice perspective also means placing the emphasis on: (i) the protection of vulnerable populations from the impacts of climate change, (ii) mitigating the effects of low-carbon transformations, and (iii) ensuring an equitable decarbonised world ( high confidence). {17.1}
The SDG framework33 can serve as a template to evaluate the long-term implications of mitigation on sustainable development and vice versa (high confidence). Understanding the co-benefits and trade-offs associated with mitigation is key to understanding how societies prioritise among the various sectoral policy options (medium confidence). Areas with anticipated trade-offs include food and biodiversity, energy affordability/access, and mineral-resource extraction. Areas with anticipated co-benefits include health, especially regarding air pollution, clean energy access and water availability. The possible implementation of the different sectoral mitigation options therefore depends on how societies prioritise mitigation versus other products and services: not least, how societies prioritise food, material well-being, nature conservation and biodiversity protection, as well as considerations such as their future dependence on CDR. Figure TS.29 summarises the assessment of where key synergies and trade-offs exist between mitigation options and the SDGs. (Figures TS.29 and TS.31, Table TS.7) {12.3, 12.4, 12.5, 12.6.1, Figures 3.39 and 17.1}
The beneficial and adverse impacts of deploying climate-change mitigation and adaptation responses are highly context-specific and scale-dependent. There are synergies and trade-offs between adaptation and mitigation as well as synergies and trade-offs with sustainable development (high confidence). Strong links also exist between sustainable development, vulnerability and climate risks, as limited economic, social and institutional resources often result in low adaptive capacities and high vulnerability, especially in developing countries. Resource limitations in these countries can similarly weaken the capacity for climate mitigation and adaptation. The move towards climate-resilient societies requires transformational or deep systemic change. This has important implications for countries’ sustainable development pathways (medium evidence, high agreement ). (Box TS.3, Figure TS.29) {4.5, Figure 4.9, 17.3.3}

Figure TS.29 |Mitigation options have synergies with many Sustainable Development Goals (SDGs), but there are trade-offs associated with some options especially when implemented at scale. The synergies and trade-offs vary widely and depend on the context. Figure presents a summary of the chapter-level qualitative assessment of the synergies and trade-offs for selected mitigation options. Overlaps may exist in the mitigation options assessed and presented by sector and system, and interlinkages with the SDGs might differ depending on the application of that option by sector. Interactions of mitigation options with the SDGs are context-specific and dependent on the scale of implementation. For some mitigation options, these scaling and context-specific issues imply that there are both synergies and trade-offs in relation to specific SDGs. The SDGs are displayed as coloured squares. They indicate whether a synergy, trade-off, or both synergies and trade-offs exist between the SDG and the mitigation option. Confidence levels are indicated through the solidity of the squares. A solid square indicates high confidence, a partially filled square indicates medium confidence, and an outlined square indicates low confidence. The final column in the figure provides a line of sight to the chapters that provide details on context-specificity and scale of implementation. {6.3, 6.4, 6.7, 7.3, 7.4, 7.5, 7.6, 8.2, 8.4, 8.6, 9.4, 9.5, 9.8, Table 9.5, 10.3, 10.4, 10.5, 10.6, 10.8, 11.5, Table 10.3, 17.3, Figure 17.1, Supplementary Material Table 17.SM.1, Annex II.IV.12}
Many of the potential trade-offs between mitigation and other sustainable development outcomes depend on policy design and can be compensated or avoided with additional policies and investments, or through policies that integrate mitigation with other SDGs (high confidence). Targeted SDG policies and investments, for example, in the areas of healthy nutrition, sustainable consumption and production, and international collaboration, can support climate change mitigation policies and resolve or alleviate trade-offs . Trade-offs can also be addressed by complementary policies and investments, as well as through the design of cross-sectoral policies integrating mitigation with the SDGs, and in particular: good health and well-being (SDG 3), zero hunger and nutrition (SDG 2), responsible consumption and production (SDG 12), reduced inequalities (SDG 10), and life on land (SDG 15). (Figures TS.29 and TS.30) {3.7}
Decent living standards, which encompasses many SDG dimensions, are achievable at lower energy use than previously thought (high confidence). Mitigation strategies that focus on lowering demand for energy and land-based resources exhibit reduced trade-offs and negative consequences for sustainable development relative to pathways involving either high emissions and climate impacts or pathways with high consumption and emissions that are ultimately compensated by large quantities of BECCS. Figure TS.30 illustrates how, in the case of pathways limiting warming to 1.5°C (>67%), sustainable development policies can lead to overall benefits compared to mitigation policies alone. (Figures TS.22 and TS.30) {3.7, 5.2}

Figure TS.30 | Impacts on SDGs of mitigation limiting warming to 1.5°C (>50%) with narrow mitigation policies vs broader sustainable development policies. Left: benefits of mitigation from avoided impacts. Middle: sustainability co-benefits and trade-offs of narrow mitigation policies (averaged over multiple models). Right: sustainability co-benefits and trade-offs of mitigation policies integrating Sustainable Development Goals. Scale: 0% means no change compared to 3°C (left) or current policies (middle and right). Green values correspond to proportional improvements, red values to proportional worsening. Note: only the left panel considers climate impacts on sustainable development; the middle and right panels do not. ‘Res’ C&P’ stands for Responsible Consumption and Production (SDG 12). {Figure 3.39}
The timing of mitigation actions and their effectiveness will have significant consequences for broader sustainable development outcomes in the longer term (high confidence). Ambitious mitigation can be considered a precondition for achieving the SDGs. {3.7}
Adopting coordinated cross-sectoral approaches to climate mitigation can target synergies and minimise trade-offs, both between sectors and between sustainable development objectives (high confidence). This requires integrated planning using multiple-objective-multiple-impact policy frameworks. Strong inter-dependencies and cross-sectoral linkages create both opportunities for synergies and need to address trade-offs related to mitigation options and technologies. This can only be done if coordinated sectoral approaches to climate change mitigation policies are adopted that mainstream these interactions and ensure local people are involved in the development of new products, as well as production and consumption practices. For instance, there can be many synergies in urban areas between mitigation policies and the SDGs but capturing these depends on the overall planning of urban structures and on local integrated policies such as combining affordable housing and spatial planning with walkable urban areas, green electrification and clean renewable energy (medium confidence). Integrated planning and cross-sectoral alignment of climate change policies are also particularly evident in developing countries’ NDCs under the Paris Agreement, where key priority sectors such as agriculture and energy are closely aligned with the proposed mitigation and adaptation actions and the SDGs . {12.6.2, Supplementary Material Table 17.SM.1, 17.3.3}
The feasibility of deploying response options is shaped by barriers and enabling conditions across geophysical, environmental-ecological, technological, economic, socio-cultural, and institutional dimensions (high confidence). Accelerating the deployment of response options depends on reducing or removing barriers across these dimensions, as well on establishing and strengthening enabling conditions. Feasibility is context-dependent, and also depends on the scale and the speed of implementation. For example: the institutional, legal and administrative capacity to support deployment varies across countries; the feasibility of options that involve large-scale land-use changes is highly context-dependent; spatial planning has a higher potential in early stages of urban development; the geophysical potential of geothermal is site-specific; and cultural and local conditions may either inhibit or enable demand-side responses. Figure TS.31 summarises the assessment of barriers and enablers for a broad range of sector-specific, and cross-sectoral response options. (Box TS.15) {6.4, 7.4, 8.5, 9.10, 10.8, 12.3}

Figure TS.31 | Geophysical, environmental-ecological, technological, economic, socio-cultural and institutional factors can enable or act as barriers to the deployment of response options. Chapter-level assessment for selected mitigation options. Overlaps may exist in the mitigation options assessed and presented by sector and system, and feasibility might differ depending on the demarcation of that option in each sector. Chapters 6, 8, 9, 10, and 12 assess mitigation response options across six feasibility dimensions: geophysical, environmental-ecological, technological, economic, socio-cultural and institutional. AFOLU (Chapter 7) and industry (Chapter 11) are not included because of the heterogeneity of options in these sectors. For each dimension, a set of feasibility indicators was identified. Examples of indicators include impacts on land use, air pollution, economic costs, technology scalability, public acceptance and political acceptance (see Box TS.15, and Annex II.IV.11 for a detailed explanation). An indicator could refer to a barrier or an enabler to implementation, or could refer to both a barrier or an enabler, depending on the context, speed, and scale of implementation. Dark blue bars indicate the extent of enablers to deployment within each dimension. This is shown relative to the maximum number of possible enablers, as indicated by the light blue shading. Dark orange bars indicate the extent of barriers to deployment within each dimension. This is shown relative to the maximum number of possible barriers, as indicated by light orange shading. A light grey dot indicates that there is limited or no evidence to assess the option. A dark grey dot indicates that one of the feasibility indicators within that dimension is not relevant for the deployment of the option. The relevant sections in the underlying chapters include references to the literature on which the assessment is based and indicate whether the feasibility of an option varies depending on context (e.g., region), scale (e.g., small, medium or full scale), speed (e.g., implementation in 2030 versus 2050) and warming level (e.g., 1.5°C versus 2°C). {6.4, 8.5, 9.10, 10.8, 12.3, Annex II.IV.11}
Alternative mitigation pathways are also associated with different feasibility challenges (high confidence). These challenges are multi-dimensional, context-dependent, malleable to policy and to technological and societal trends. They can also be reduced by putting in place appropriate enabling conditions. Figure TS.32 highlights the dynamic and transient nature of feasibility risks. These risks are transient and concentrated in the decades before mid-century. Figure TS.32 also illustrates how different feasibility dimensions pose differentiated challenges: for example, institutional feasibility challenges are shown as unprecedented for a high proportion of scenarios, in line with the qualitative literature, but moving from 2030 to 2050 and 2100 these challenges decrease.
The feasibility challenges associated with mitigation pathways are predominantlyinstitutionalandeconomicrather thantechnologicalandgeophysical (medium confidence). The rapid pace of technological development and deployment in mitigation scenarios is not incompatible with historical records, but rather, institutional capacity is a key limiting factor for a successful transition. Emerging economies appear to have highest feasibility challenges in the near to mid-term. This suggests a key role of policy and technology as enabling factors. (Figure TS.32) {3.8}

Figure TS.32 | The feasibility of mitigation scenarios. Figure TS.32 shows the proportion of scenarios in the AR6 scenarios database – falling within the warming level classifications C1 and C3 (C1: below 1.5°C (>50%), no or limited overshoot; C3: below 2°C (>67%)) – that exceed threshold values in 2030, 2050 and 2100 for five dimensions of feasibility (Boxes TS.5 and TS.15). The feasibility dimensions shown are: geophysical, technological, economic, socio-cultural and institutional. The thresholds shown are: (i)plausible– range of values based on past historical trends or other peer reviewed assessments; (ii)best-case scenario– range of values assuming major political support or technological breakthrough; (iii)unprecedented– values going beyond those observed or reported in peer-reviewed assessments. Overlayed are the Illustrative Mitigation Pathways consistent with SSP2 (LD, SP, Ren: C1 category; Neg, GS: C3 category). The positioning of the illustrative pathways is simply indicative of the general trade-offs over time and across the feasibility dimensions, it is not determined mathematically. (Box TS.5) {3.8}
Pathways relying on a broad portfolio of mitigation strategies are more robust and resilient (high confidence). Portfolios of technological solutions reduce the feasibility risks associated with the low-carbon transition. (Figures TS.31 and TS.32, Box TS.15) {3.8}
Box TS.15 | A Harmonised Approach to Assessing Feasibility
The assessment of feasibility in this report aims to identify barriers and enablers to the deployment of mitigation options and pathways. The assessment organises evidence to support policy decisions, and decisions on actions, that would improve the feasibility of mitigation options and pathways by removing relevant barriers and by strengthening enablers of change.
The feasibility of mitigation response options
Mitigation response options are assessed against six dimensions of feasibility. Each dimension comprises a key set of indicators that can be evaluated by combining various strands of literature. {Annex II.IV.11, Table 6.1}
The assessment – undertaken by the sectoral chapters in this report – evaluates to what extent each indicator (listed in Box TS.15, Table.1) would be an enabler or barrier to implementation using a scoring methodology (described in detail in Annex II.IV.11). When appropriate, it is also indicated whether the feasibility of an option varies across context, scale, time and temperature goal. The resulting scores provide insight into the extent to which each feasibility dimension enables or inhibits the deployment of the relevant option. It also provides insight into the nature of the effort needed to reduce or remove barriers, thereby improving the feasibility of individual options. {Annex II.IV.11}
Box TS.15, Table. 1 | Feasibility dimensions and indicators to assess the barriers and enablers of implementing mitigation options.
Feasibility dimension | Indicators |
Geophysical feasibility | Availability of required geophysical resources: – Physical potential – Geophysical resource availability – Land use |
Environmental-ecological feasibility | Impacts on environment: – Air pollution – Toxic waste, ecotoxicity and eutrophication – Water quantity and quality – Biodiversity |
Technological feasibility | Extent to which the technology can be implemented at scale soon: – Simplicity – Technology scalability – Maturity and technology readiness |
Economic feasibility | Financial costs and economic effects: – Costs now, in 2030 and in the long term – Employment effects and economic growth |
Socio-cultural feasibility | Public engagement and support, and social impacts: – Public acceptance – Effects on health and well-being – Distributional effects |
Institutional feasibility | Institutional conditions that affect the implementation of the response option: – Political acceptance – Institutional capacity and governance, cross-sectoral coordination – Legal and administrative capacity |
The feasibility of mitigation scenarios
Scenarios provide internally consistent projections of emission-reduction drivers and help contextualise the scale of deployment and interactions of mitigation strategies. Recent research has proposed and operationalised frameworks for the feasibility assessment of mitigation scenarios. In this report the feasibility assessment of scenarios uses an approach that involves developing a set of multi-dimensional metrics capturing the timing, disruptiveness and the scale of the transformative change within five dimensions: geophysical, technological, economic, socio-cultural and institutional, as illustrated in Box TS.15, Figure 1.

Box TS.15, Figure1 | Steps involved in evaluating the feasibility of scenarios. {Figure 3.41}Note: in this approach the environmental-ecological dimension is captured through different scenarios’ categories.
More than 20 indicators were chosen to represent feasibility dimensions that could be related to scenario metrics. Thresholds of feasibility risks of different intensity were obtained through empirical analysis of historical data and assessed literature. Details of indicators, thresholds, and how they were applied is reported in Annex II.IV.11. {3.8}
A wide range of factors have been found to enable sustainability transitions, ranging from technological innovations to shifts in markets, and from policies and governance arrangements to shifts in belief systems and market forces (high confidence). Many of these factors have come together in a co-evolutionary process that has unfolded globally, internationally and locally over several decades (low evidence, high agreement ). Those same conditions that may serve to impede the transition (i.e., organisational structure, behaviour, technological lock-in) can also ‘flip’ to enable both the transition and the framing of sustainable development policies to create a stronger basis for policy support ( high confidence). It is important to note that strong shocks to these systems, including accelerating climate change impacts, economic crises and political changes, may provide crucial openings for accelerated transitions to sustainable systems. For example, rebuilding more sustainably after an extreme event, or renewed public debate about the drivers of social and economic vulnerability to multiple stressors (medium confidence). {17.4}
While transition pathways will vary across countries it is anticipated that they will be challenging in many contexts (high confidence). Climate change is the result of decades of unsustainable production and consumption patterns, as well as governance arrangements and political economic institutions that lock-in resource-intensive development patterns ( high confidence). Resource shortages, social divisions, inequitable distributions of wealth, poor infrastructure and limited access to advanced technologies and skilled human resources can constrain the options and capacity of developing countries to achieve sustainable and Just Transitions (medium evidence, high agreement ) {17.1.1}. Reframing development objectives and shifting development pathways towards sustainability can help transform these patterns and practices, allowing space to transform unsustainable systems (medium evidence, high agreement ). {1.6, Cross-Chapter Box 5 in Chapter 4, 17.1, 17.3}
The landscape of transitions to sustainable development is changing rapidly, with multiple transitions already underway. This creates the room to manage these transitions in ways that prioritise the needs of workers in vulnerable sectors (e.g., land, energy) to secure their jobs and maintain secure and healthy lifestyles (medium evidence, high agreement). {17.3.2}
Actions aligning sustainable development, climate mitigation and partnerships can support transitions. Strengthening different stakeholders’ ‘response capacities’ to mitigate and adapt to a changing climate will be critical for a sustainable transition (high confidence). {17.1}
Accelerating the transition to sustainability will be enabled by explicit consideration being given to the principles of justice, equality and fairness (high confidence). {5.2, 5.4, 5.6, 13.2, 13.6, 13.8, 13.9,17.4}
1 The three Special Reports are: Global Warming of 1.5°C: an IPCC Special Report on the impacts of global warming of 1.5°C above pre-industrial levels and related global greenhouse gas emission pathways, in the context of strengthening the global response to the threat of climate change, sustainable development, and efforts to eradicate poverty (2018); Climate Change and Land: an IPCC Special Report on climate change, desertification, land degradation, sustainable land management, food security, and greenhouse gas fluxes in terrestrial ecosystems (2019); IPCC Special Report on the Ocean and Cryosphere in a Changing Climate (2019).
2 Each finding is grounded in an evaluation of the underlying evidence, typeset in italics. The validity of a finding is evaluated in terms of the evidence quality – ‘limited’, ‘medium’, ‘robust ’ – and the degree of agreement between sources – ‘low’, ‘medium’, ‘ high’. A level of confidence is expressed using five qualifiers: very low, low, medium, high and very high. Generally, the level of confidence is highest where there is robust evidence from multiple sources and high agreement. For findings with, for example, ‘robust evidence, medium agreement ’, a confidence statement may not always be appropriate. The assessed likelihood of an outcome or a result is described as: virtually certain (99–100% probability); very likely (90–100%); likely (66–100%); about as likely as not (33–66%); unlikely (0–33%); very unlikely (0–10%); exceptionally unlikely (0–1%). Additional terms may also be used when appropriate, consistent with the IPCC uncertainty guidance: https://www.ipcc.ch/site/assets/uploads/2018/05/uncertainty-guidance-note.pdf .
3 Current NDCs refer to Nationally Determined Contributions submitted to the UNFCCC, as well as publicly announced but not yet submitted mitigation pledges with sufficient detail on targets, reflected in studies published up to 11 October 2021. Revised NDCs submitted or announced after 11 October 2021 are not included. Intended Nationally Determined Contributions (INDCs) were converted to NDCs as countries ratified the Paris Agreement. Original INDCs and NDCs refer to those submitted to the UNFCCC in 2015 and 2016.
4 Emissions of GHGs are weighed by global warming potentials (GWPs) with a 100-year time horizon (GWP100) from the Sixth Assessment Report. GWP100 is commonly used in wide parts of the literature on climate change mitigation and is required for reporting emissions under the United Nations Framework Convention on Climate Change (UNFCCC). All metrics have limitations and uncertainties. {Cross-Chapter Box 2, Annex II.II.8}
5 In 2019, CO2 from fossil fuel and industry (FFI) was 38 ± 3.0 Gt; CO2 from net land use, land-use change and forestry (LULUCF) was 6.6 ± 4.6 Gt.
6 Fluorinated gases, also known as ‘F-gases’, include: hydrofluorocarbons (HFCs), perfluorocarbons (PFCs), sulphur hexafluouride (SF6) and nitrogen trifluouride (NF3).
7 IEA: International Energy Agency
8 EDGAR: Emissions Database for Global Atmospheric Research
9 Emission metrics also exist for aerosols, but these are not commonly used in climate policy. This assessment focuses on GHG emission metrics only.
10 The CMA is the Conference of the Parties serving as the Meeting of the Parties to the Paris Agreement. See 18/CMA.1 (Annex, para. 37) and 4/CMA.1 (Annex II, para. 1) regarding the use of GHG emission metrics in reporting of emissions and removals and accounting for Parties’ NDCs.
11 Bookkeeping models and dynamic global vegetation models.
12 Decent Living Standards (DLS) – a benchmark of material conditions for human well-being – overlaps with many Sustainable Development Goals (SDGs). Minimum requirements of energy use consistent with enabling well-being for all is between 20 and 50 GJ per capita yr –1 depending on the context. (Figure TS.22) {5.2.2, 5.2.2, Box 5.3}
13 Current NDCs refers to the most recent Nationally Determined Contributions submitted to the UNFCCC as well as those publicly announced (with sufficient detail on targets, but not yet submitted) up to 11 October 2021, and reflected in literature published up to 11 October 2021. Original INDCs and NDCs refer to those submitted to the UNFCCC in 2015 and 2016.
14 See {4.2.1} for descriptions of ‘unconditional’ and ‘conditional’ elements of NDCs.
15 Submitted by 11 October 2021.
16 Reductions greater than 100% in energy supply and AFOLU indicate that these sectors would become carbon sinks.
17 NDCs announced prior to COP26 refer to the most recent Nationally Determined Contributions submitted to the UNFCCC up to the literature cut-off date of this report, 11 October 2021, and revised NDCs announced by China, Japan and the Republic of Korea prior to October 2021 but only submitted thereafter. 25 NDC updates were submitted between 12 October 2021 and the start of COP26.
18 Numbers in parentheses represent he interquartile range of the scenario samples.
19 In this assessment the terms net zero CO2 emissions and carbon neutrality have different meanings and are only equivalent at the global scale. At the scale of regions, or sectors, each term applies different system boundaries. This is also the case for the related terms net zero GHG and GHG neutrality. {Cross-Chapter Box 3 in Chapter 3}
20 Carbon dioxide capture and utilisation (CCU) refers to a process in which CO2 is captured and the carbon is then used in a product. The climate effect of CCU depends on the product lifetime, the product it displaces, and the CO2 source (fossil, biomass or atmosphere). CCU is sometimes referred to as carbon dioxide capture and use, or carbon capture and utilisation.
21 These estimates are based on consumption-based accounting, including both direct emissions from within urban areas, and indirect emissions from outside urban areas related to the production of electricity, goods, and services consumed in cities. Estimates include all CO2 and CH4 emission categories except for aviation and marine bunker fuels, land-use change, forestry, and agriculture. {8.1, Annex I: Glossary}
22 These scenarios have been assessed by WGI to correspond to intermediate, high, and very low GHG emissions.
23 These scenarios have been assessed by WGI to correspond to intermediate, high, and very low GHG emissions.
24 These examples are considered to be a subset of ‘nature-based solutions’ or ‘ecosystem-based approaches’.
25 ‘Active travel’ is travel that requires physical effort, for example journeys made by walking or cycling.
26 See section TS.5.9.
27 AFOLU is a sector in the 2019 Refinement to the 2006 IPCC Guidelines for National Greenhouse Gas Inventories. AFOLU anthropogenic greenhouse gas emissions and removals by sinks reported by governments under the UNFCCC are defined as all those occurring on ‘managed land’. Managed land is land where human interventions and practices have been applied to perform production, ecological or social functions.
28 For example: in the 2019 Refinement to the 2006 IPCC Guidelines for National Greenhouse Gas Inventories, CO2 emissions from biomass used for energy are reported in the AFOLU sector, calculated as an implicit component of carbon stock changes. In the energy sector, CO2 emissions from biomass combustion for energy are recorded as an information item that is not included in the sectoral total emissions for the that sector.
29 These potentials do not include avoided emissions resulting from bioenergy use associated with BECCS, which depends on energy substitution patterns, conversion efficiencies, and supply chain emissions for both the BECCS and substituted energy systems. Estimates of substitution effects of bioenergy indicate that this additional mitigation would be of the same magnitude as provided through CDR using BECCS. Bio-based products with long service life, for example, construction timber, can also provide mitigation through substitution of steel, concrete, and other products, and through carbon storage in the bio-based product pool. See section TS.5.7 for the CDR potential of BECCS. {7.4, 12.3}
30 As a median value [5–95th percentile range].
31 Most of climate finance stays within national borders, especially private climate flows (over 90%). The reasons for this range from national policy support, differences in regulatory standards, exchange rate, political and governance risks, to information market failures.
32 Climate finance flows refers to local, national, or transnational financing from public, private, and alternative sources, to support mitigation and adaptation actions addressing climate change.
33 The 17 SDGs are at the heart of the UN 2030 Agenda for Sustainable Development, adopted by all United Nations Member States in 2015.


