Atlas


This chapter should be cited as:
Gutiérrez, J.M., R.G. Jones, G.T. Narisma, L.M. Alves, M. Amjad, I.V. Gorodetskaya, M. Grose, N.A.B. Klutse, S. Krakovska, J. Li, D. Martínez-Castro, L.O. Mearns, S.H. Mernild, T. Ngo-Duc, B. van den Hurk, and J.-H. Yoon, 2021: Atlas. In Climate Change 2021: The Physical Science Basis. Contribution of Working Group I to the Sixth Assessment Report of the Intergovernmental Panel on Climate Change[Masson-Delmotte, V., P. Zhai, A. Pirani, S.L. Connors, C. Péan, S. Berger, N. Caud, Y. Chen, L. Goldfarb, M.I. Gomis, M. Huang, K. Leitzell, E. Lonnoy, J.B.R. Matthews, T.K. Maycock, T. Waterfield, O. Yelekçi, R. Yu, and B. Zhou (eds.)]. Cambridge University Press, Cambridge, United Kingdom and New York, NY, USA, pp. 1927–2058, doi: 10.1017/9781009157896.021.

Gemma Teresa Narisma
(12 April 1972 – 5 March 2021)
The Atlas of the Working Group I Contribution to the Sixth Assessment Report of the Intergovernmental Panel on Climate Change (IPCC), is dedicated to the memory of Gemma Teresa Narisma, one of the Atlas Coordinating Lead Authors.
Gemma was an internationally renowned scientist, Executive Director of the Manila Observatory (MO) and Professor of physics at the Ateneo de Manila University in the Philippines. She undertook and coordinated research into land–atmosphere interactions, the implications of land-use/biosphere changes on local and regional climate and aerosols and monsoons. She also worked in Australia and the United States and was a key figure in regional climate research in South East Asia. In the Philippines, she undertook multidisciplinary research involving local stakeholders and government on climate impacts and risks to support climate change policy, risk assessment and development planning.
Gemma was also an inspirational teacher, mentor and colleague. She supported and encouraged the young scientists she taught and worked with and focused on ensuring her research would help and empower those most at risk. And with her kindness and generosity, her soft, strong and positive energy, her sweet smile and personality she was an exceptional Coordinating Lead Author, building consensus, motivating and supporting the team whilst also linking to other chapters and Working Group II. Her loss is felt deeply, and she will always be remembered with great affection.
Executive Summary
This Atlas chapter assesses changes in mean climate at regional scales, in particular observed trends and their attribution and projected future changes. The main focus is on changes in temperature and precipitation (including snow and derived variables in polar regions) over land regions, though other variables, including for oceanic regions, are also discussed. Projected changes are presented both as relative to levels of global warming and for future time periods under a range of emissions scenarios. In order to facilitate summarizing assessment findings, a new set of WGI reference regions is used within the chapter which were derived following broad consultation and peer review. These are used in other chapters for summarizing regional information. This includes the assessment of climatic impact-driver (CID) changes in Chapter 12, which incorporates the changes in mean climate assessed in the Atlas. Another important new development since AR5 is the AR6 WGI Interactive Atlas, which is described in this chapter and is used to generate results both for the Atlas and other regional chapters. It is also a resource allowing exploration of datasets underpinning assessment findings in other chapters of the report.
Observed Trends and Projections in Regional Climate
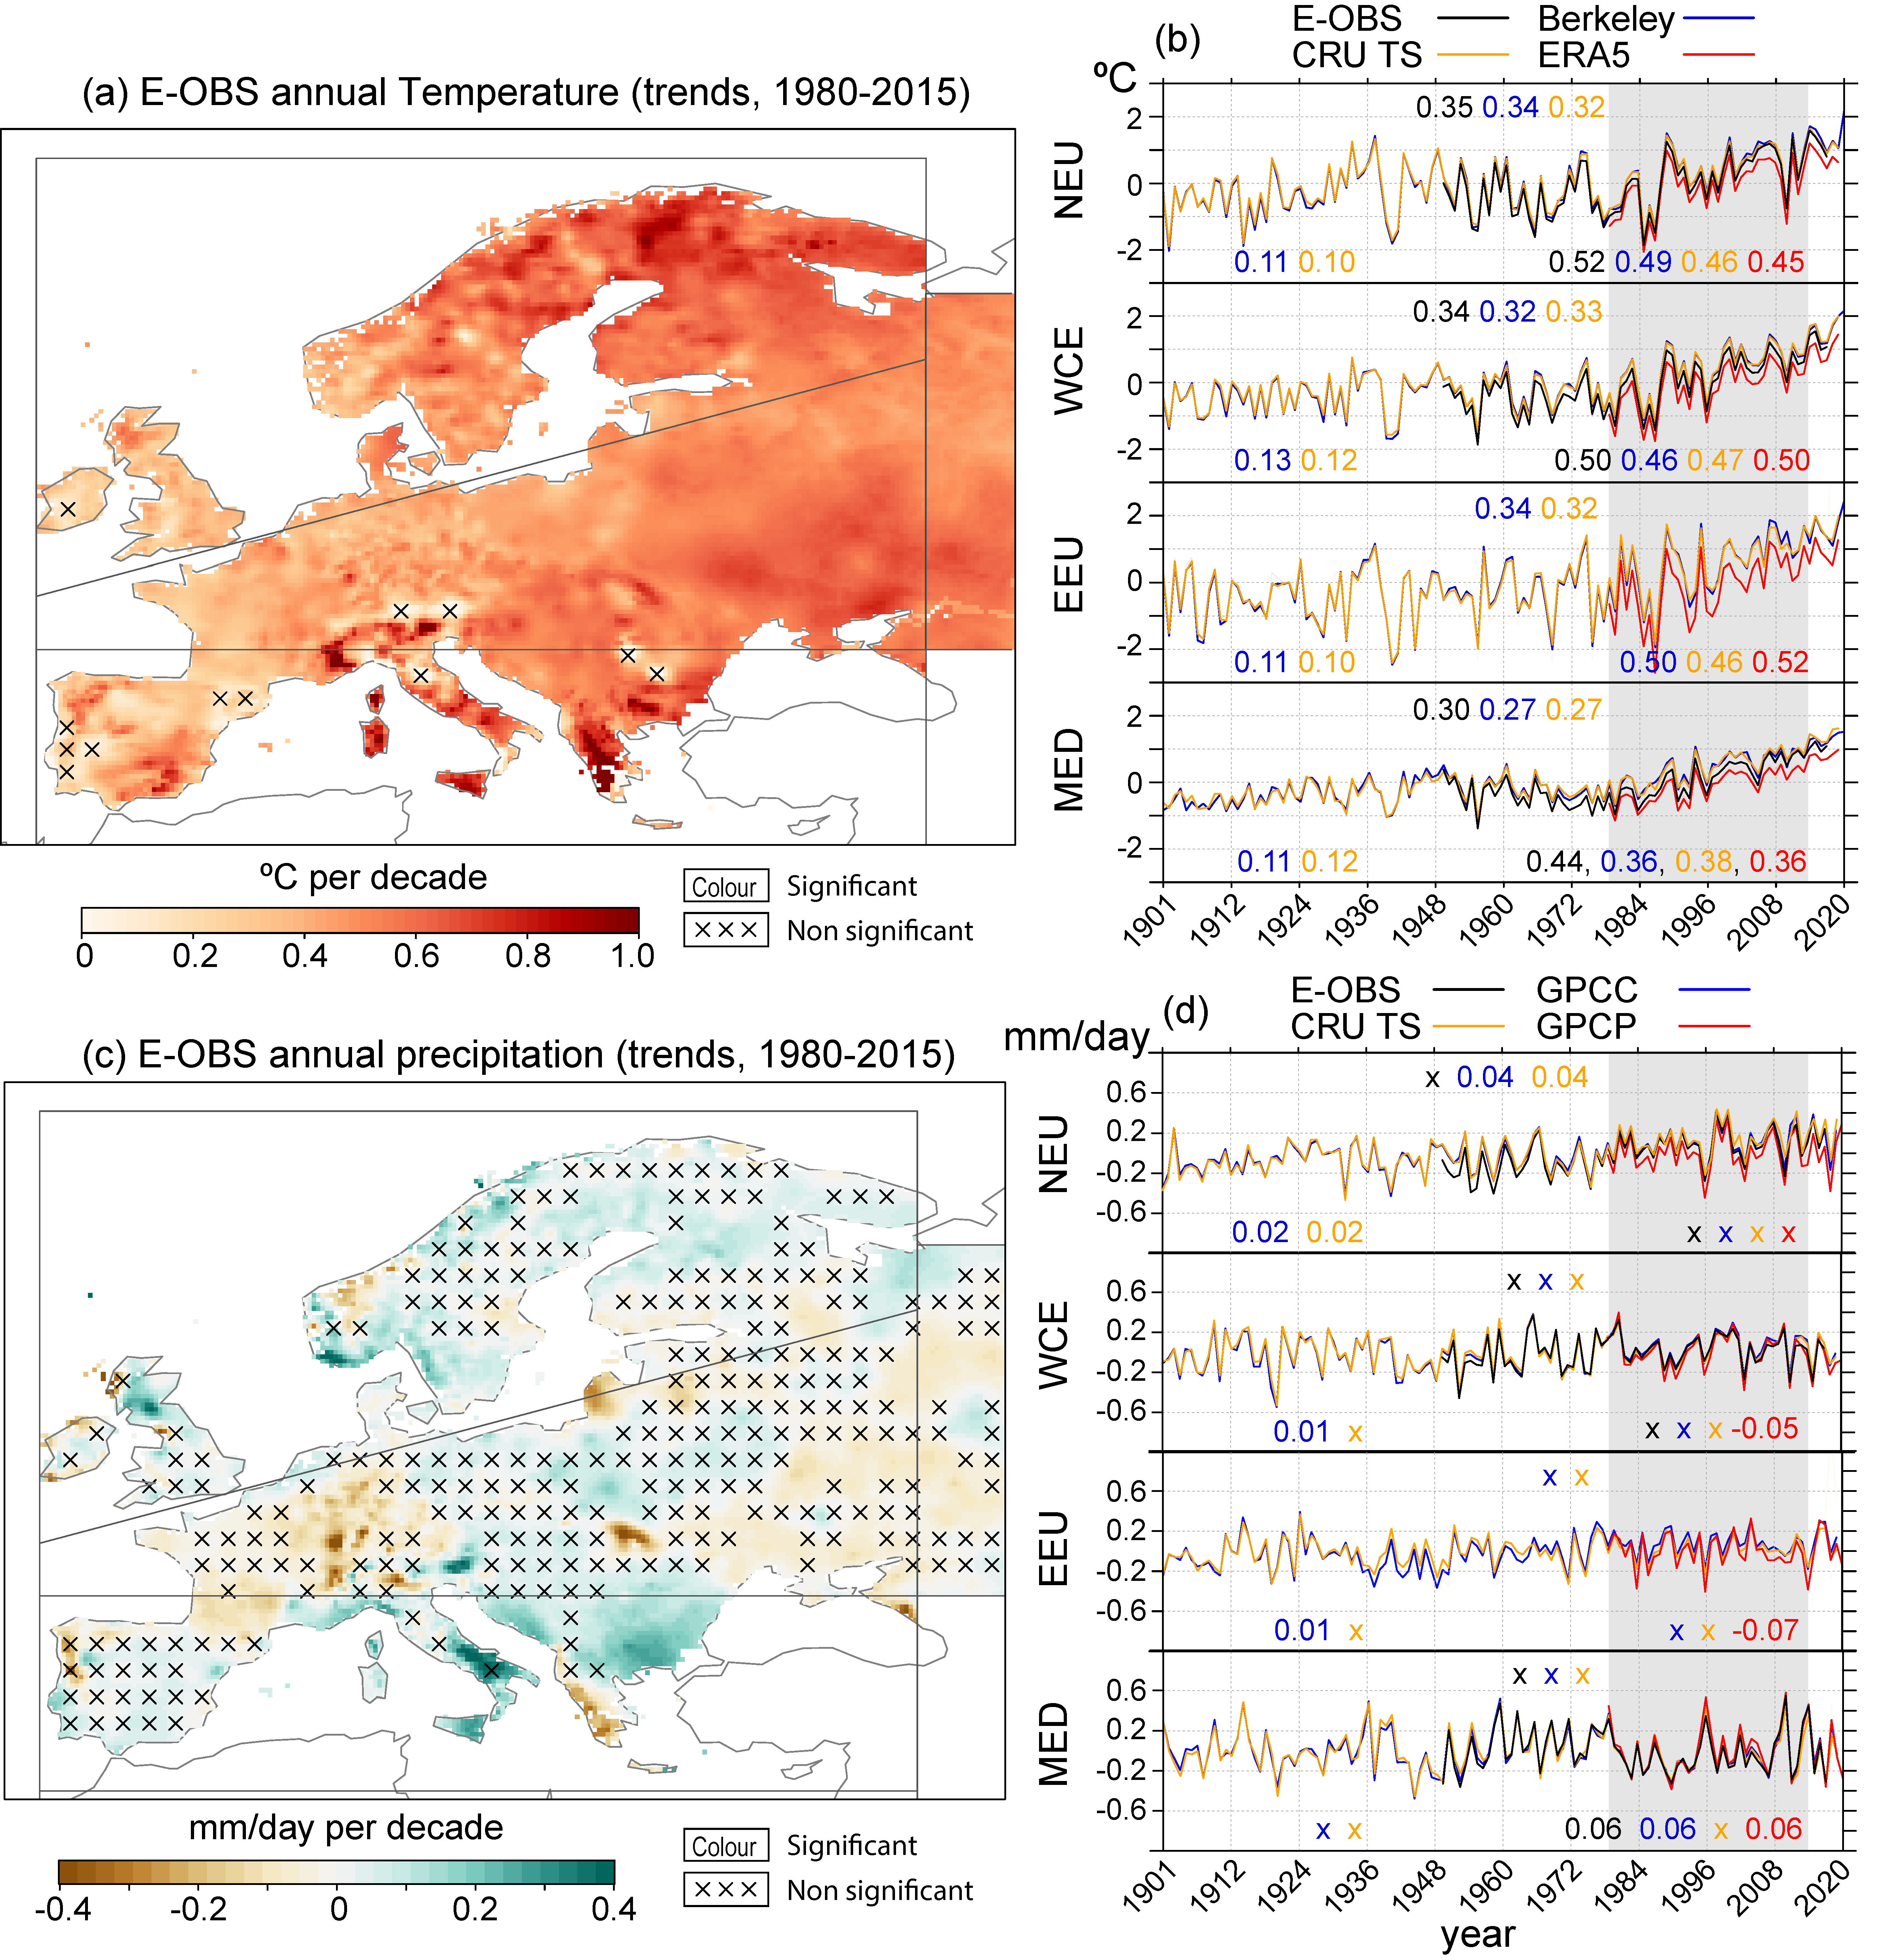
Most land areas have warmed faster than the global average (high confidence) and very likely by at least 0.1°C per decade since 1960. A surface temperature change signal has likely emerged over all land areas. Many areas very likely warmed faster since the 1980s, including areas of northern, eastern and south-western Africa, Australia, Central America, Amazonia and West Antarctica (0.2°C–0.3°C per decade), the Arabian Peninsula, Central and East Asia and Europe (0.3°C–0.5°C per decade), and Arctic and near-Arctic land regions (up to 1°C per decade, or more in a few areas). {Figure Atlas.11, Interactive Atlas, Atlas.3.1, Atlas.4.2, Atlas.5.1.2, Atlas.5.2.2, Atlas.5.3.2, Atlas.5.4.2, Atlas.5.5.2, Atlas.6.1.2, Atlas.6.2.2, Atlas.7.2, Atlas.8.2, Atlas.9.2, Atlas.10.2, Atlas.11.1.2, Atlas.11.2.2 }
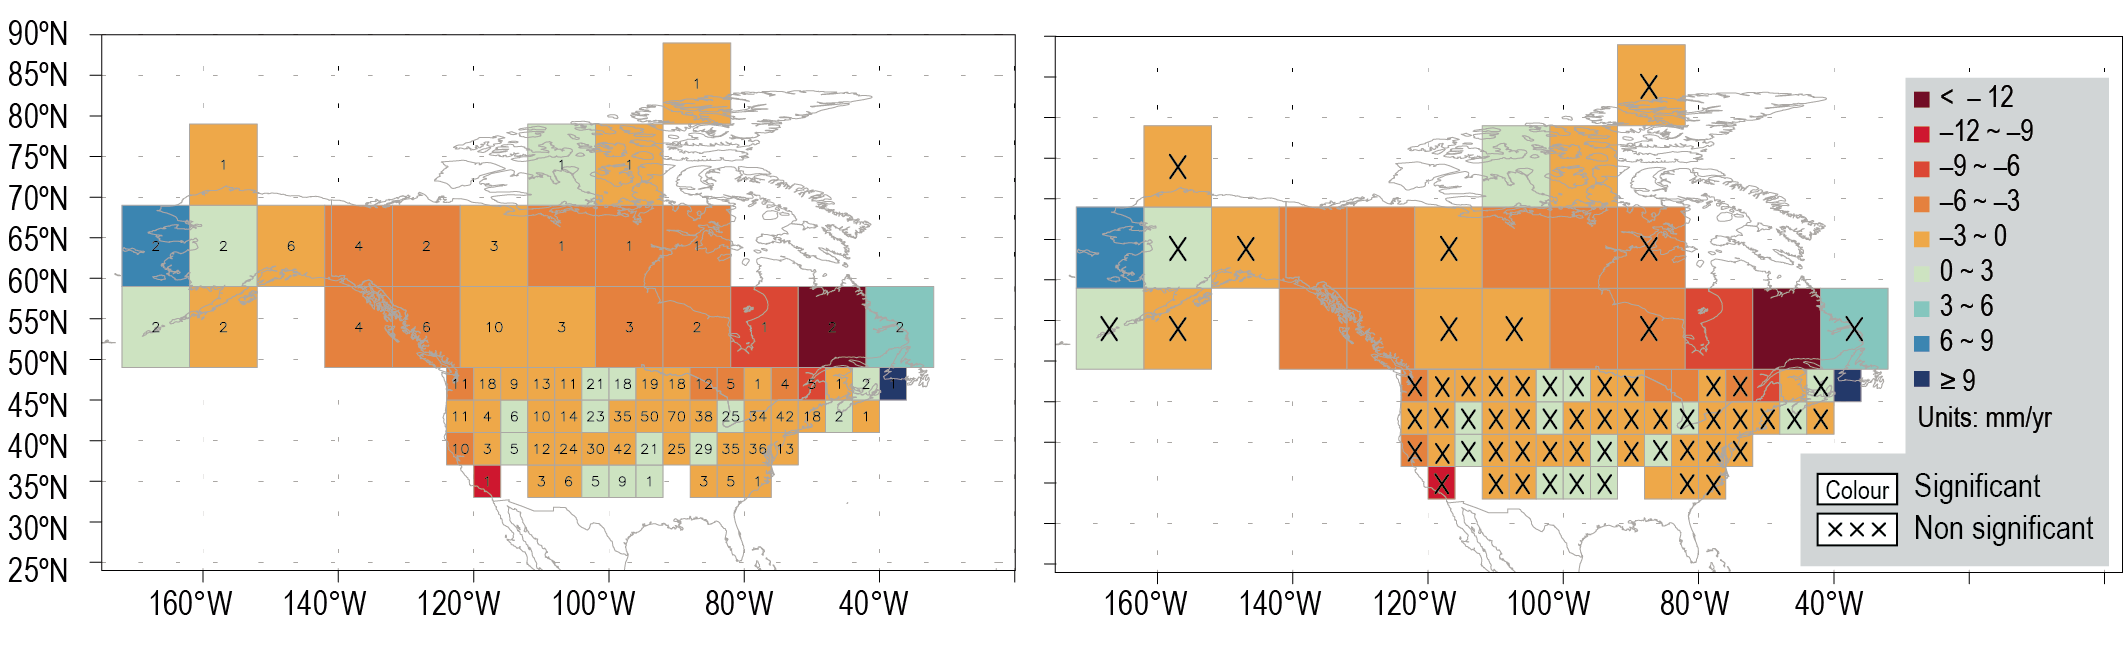
Significant positive trends in precipitation have been observed in most of North Asia, parts of West Central Asia, South-Eastern South America, Northern Europe, Eastern North America, Western Antarctica and the Arctic (medium confidence). Significant negative trends have been observed in the Horn of Africa and south-west of the state of Western Australia (high confidence), parts of the Russian Far East, some parts of the Mediterranean and of the Caribbean, south-east and north-east Brazil, and southern Africa (medium confidence), with the trend in southern Africa attributed to anthropogenic (human-caused) warming of the Indian Ocean. In many other land areas there are no significant trends in annual precipitation over the period 1960–2015 though increases in average precipitation intensity have been observed in the Sahel and South East Asia (medium confidence). { Figure Atlas.11, Interactive Atlas, Atlas.3.1, Atlas.4.2, Atlas.5.1.2, Atlas.5.2.2, Atlas.5.3.2, Atlas.5.4.2, Atlas.5.5.2, Atlas.6.1.2, Atlas.6.2.2, Atlas.7.2, Atlas.8.2, Atlas.9.2, Atlas.10.2, Atlas.11.1.2, Atlas.11.2.2 }
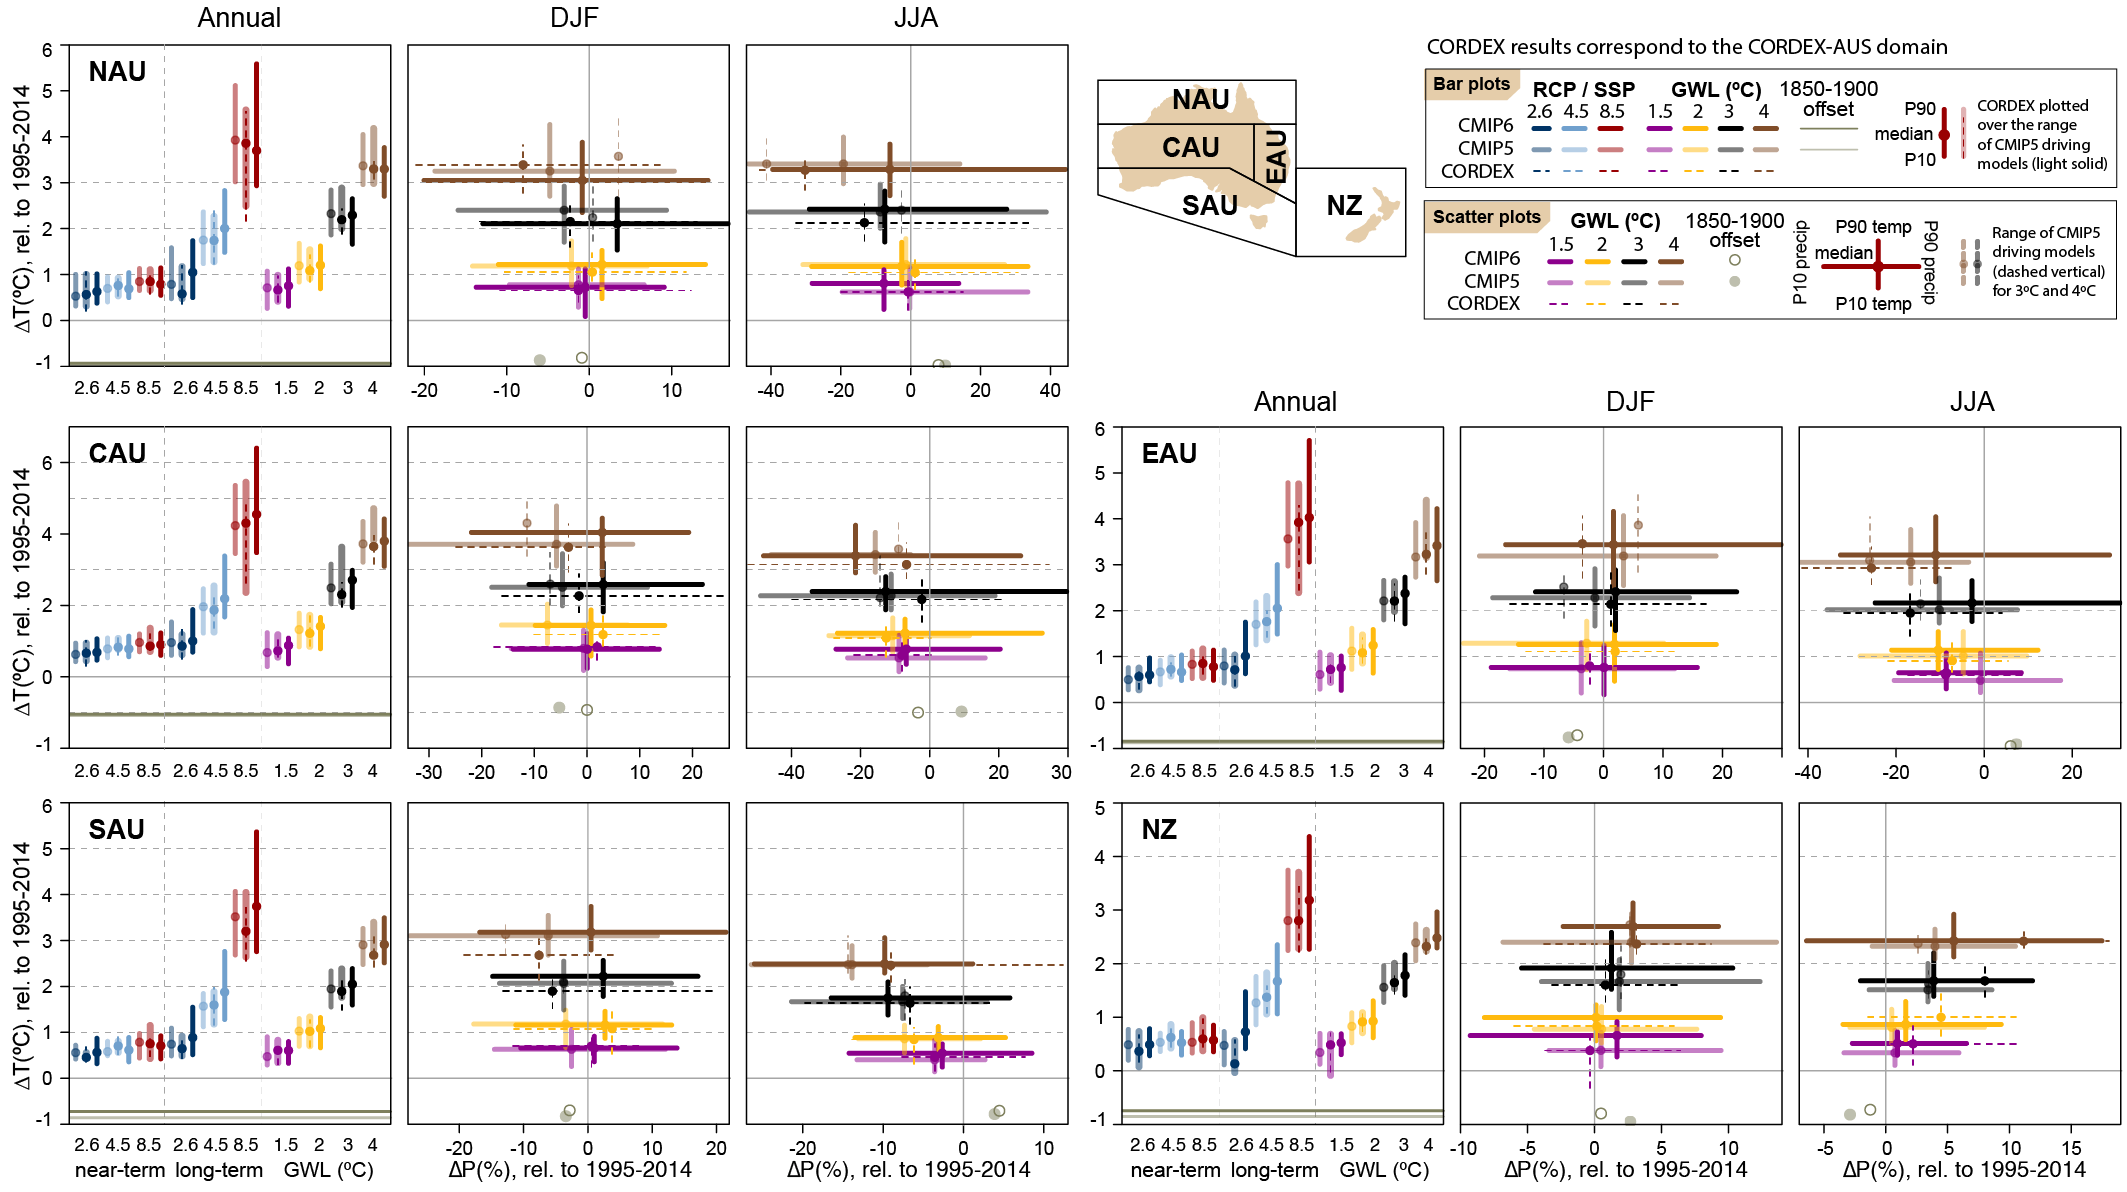
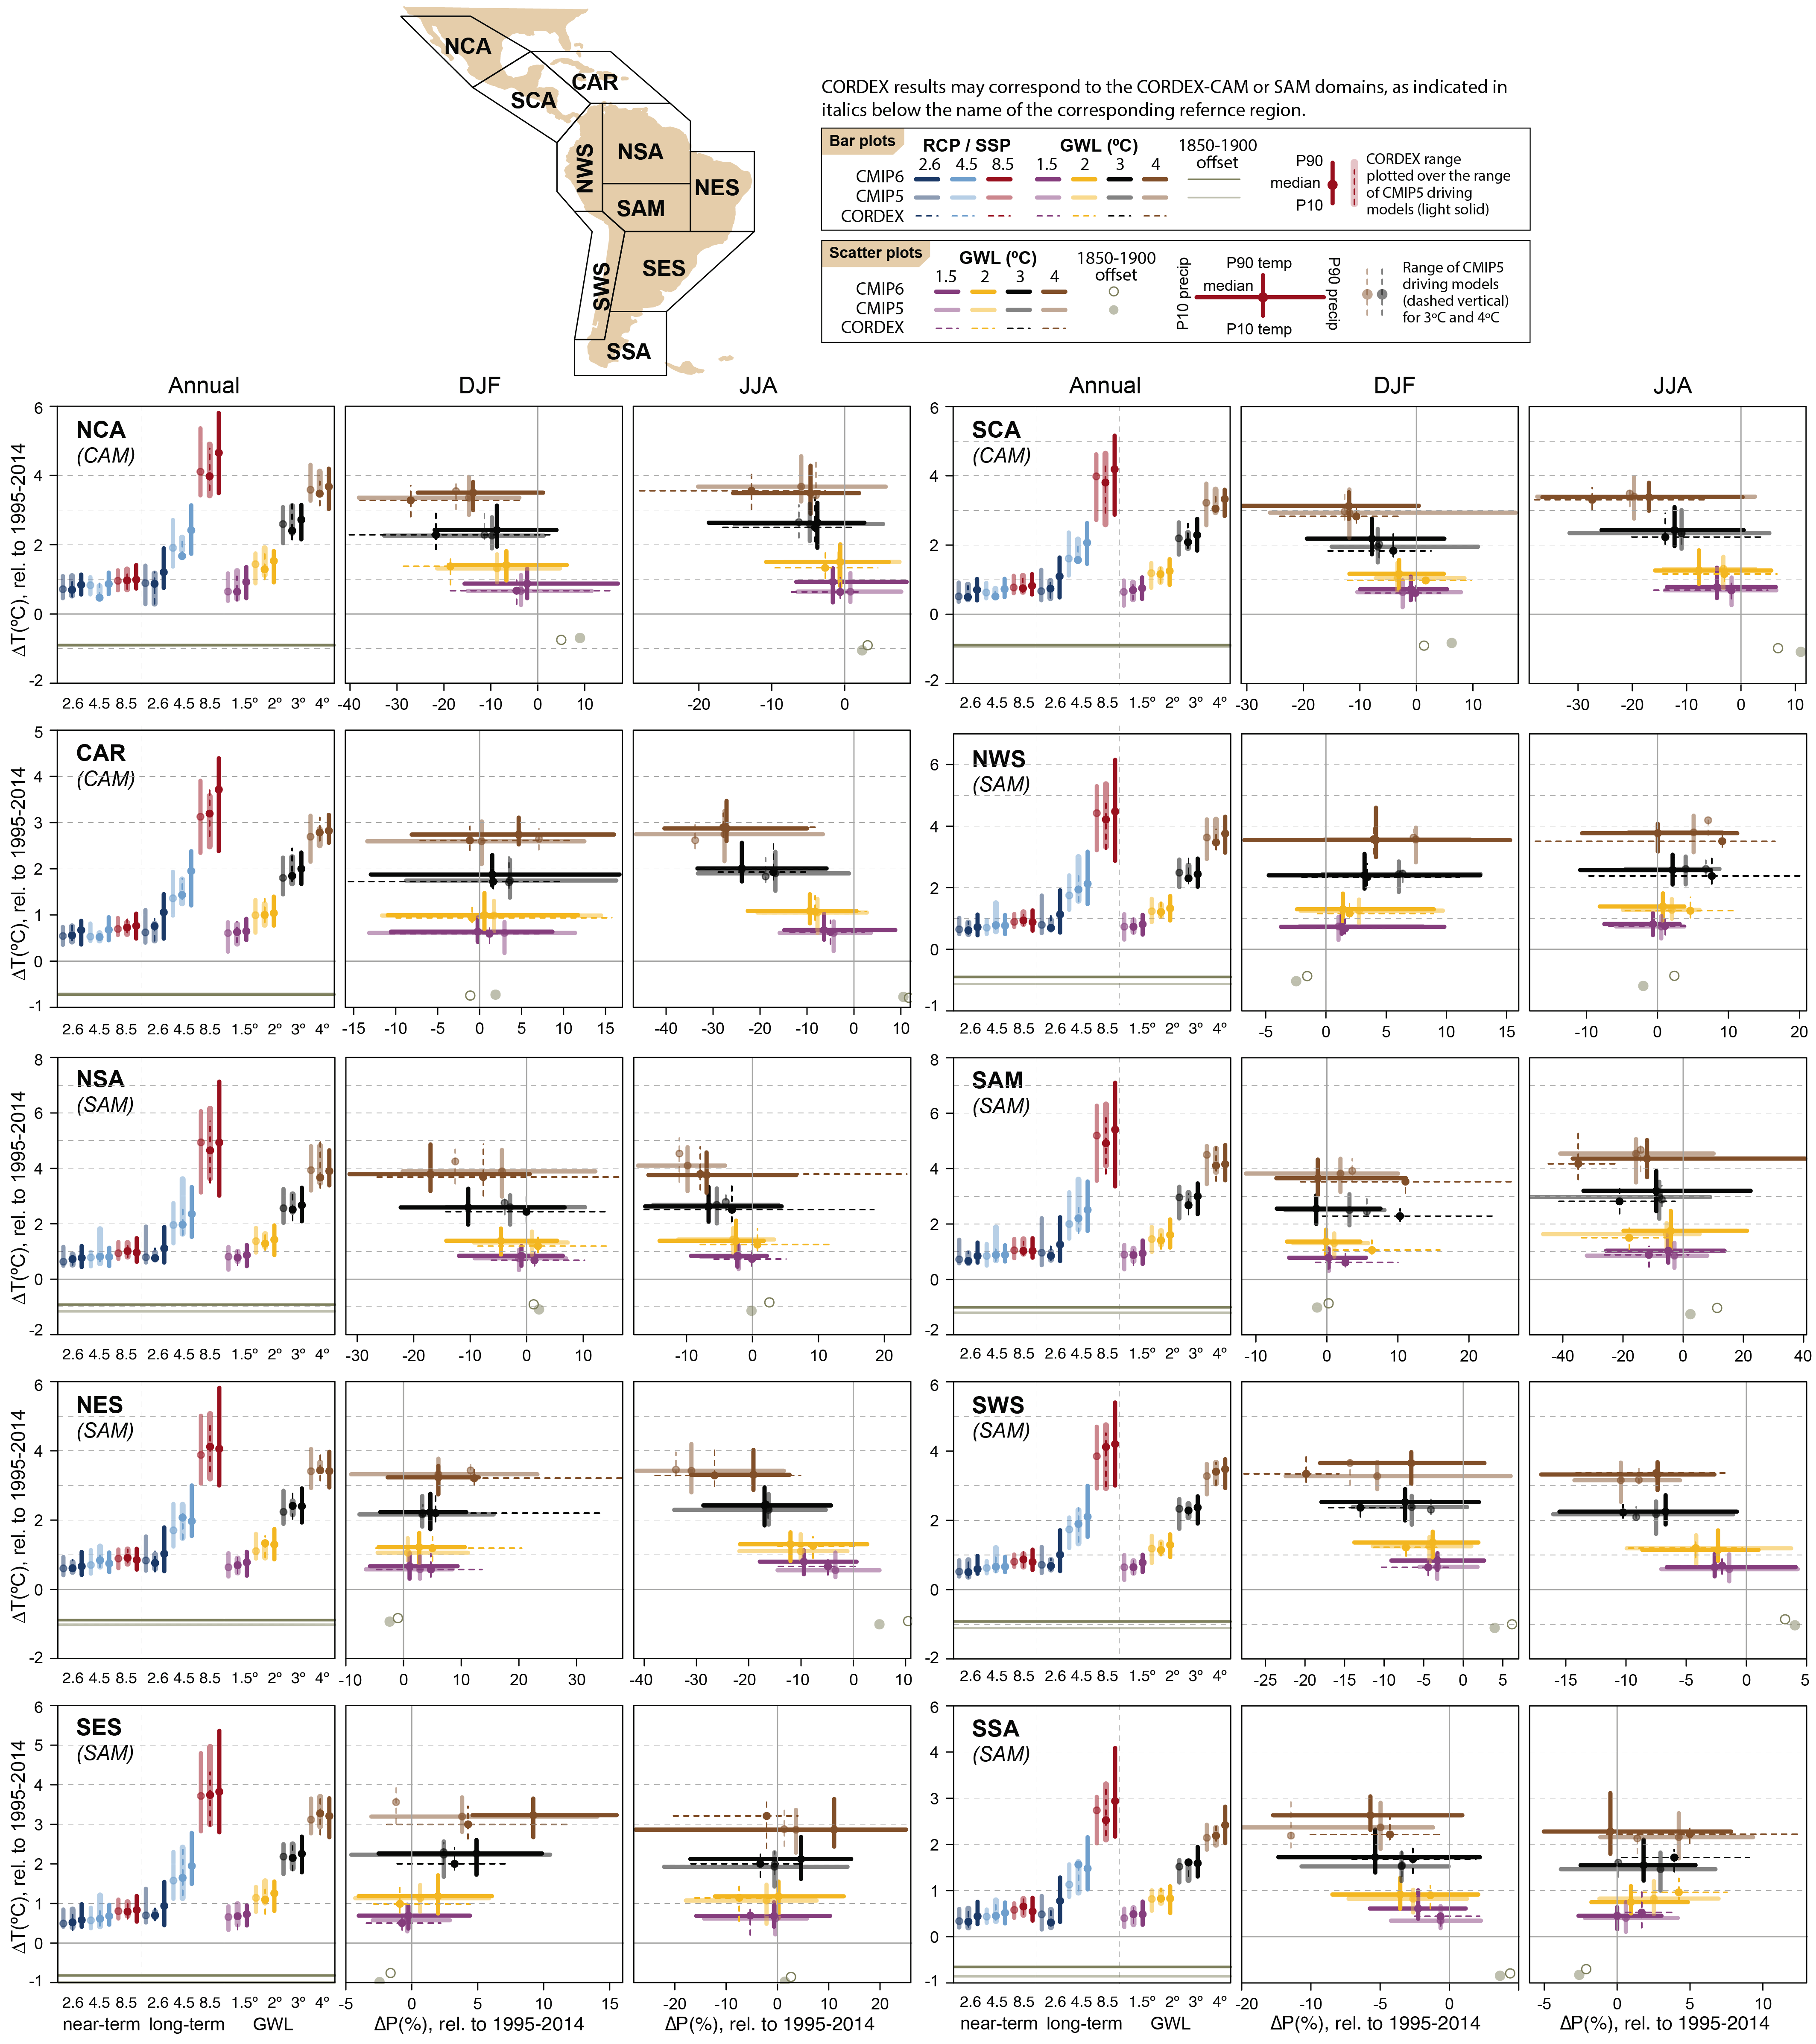
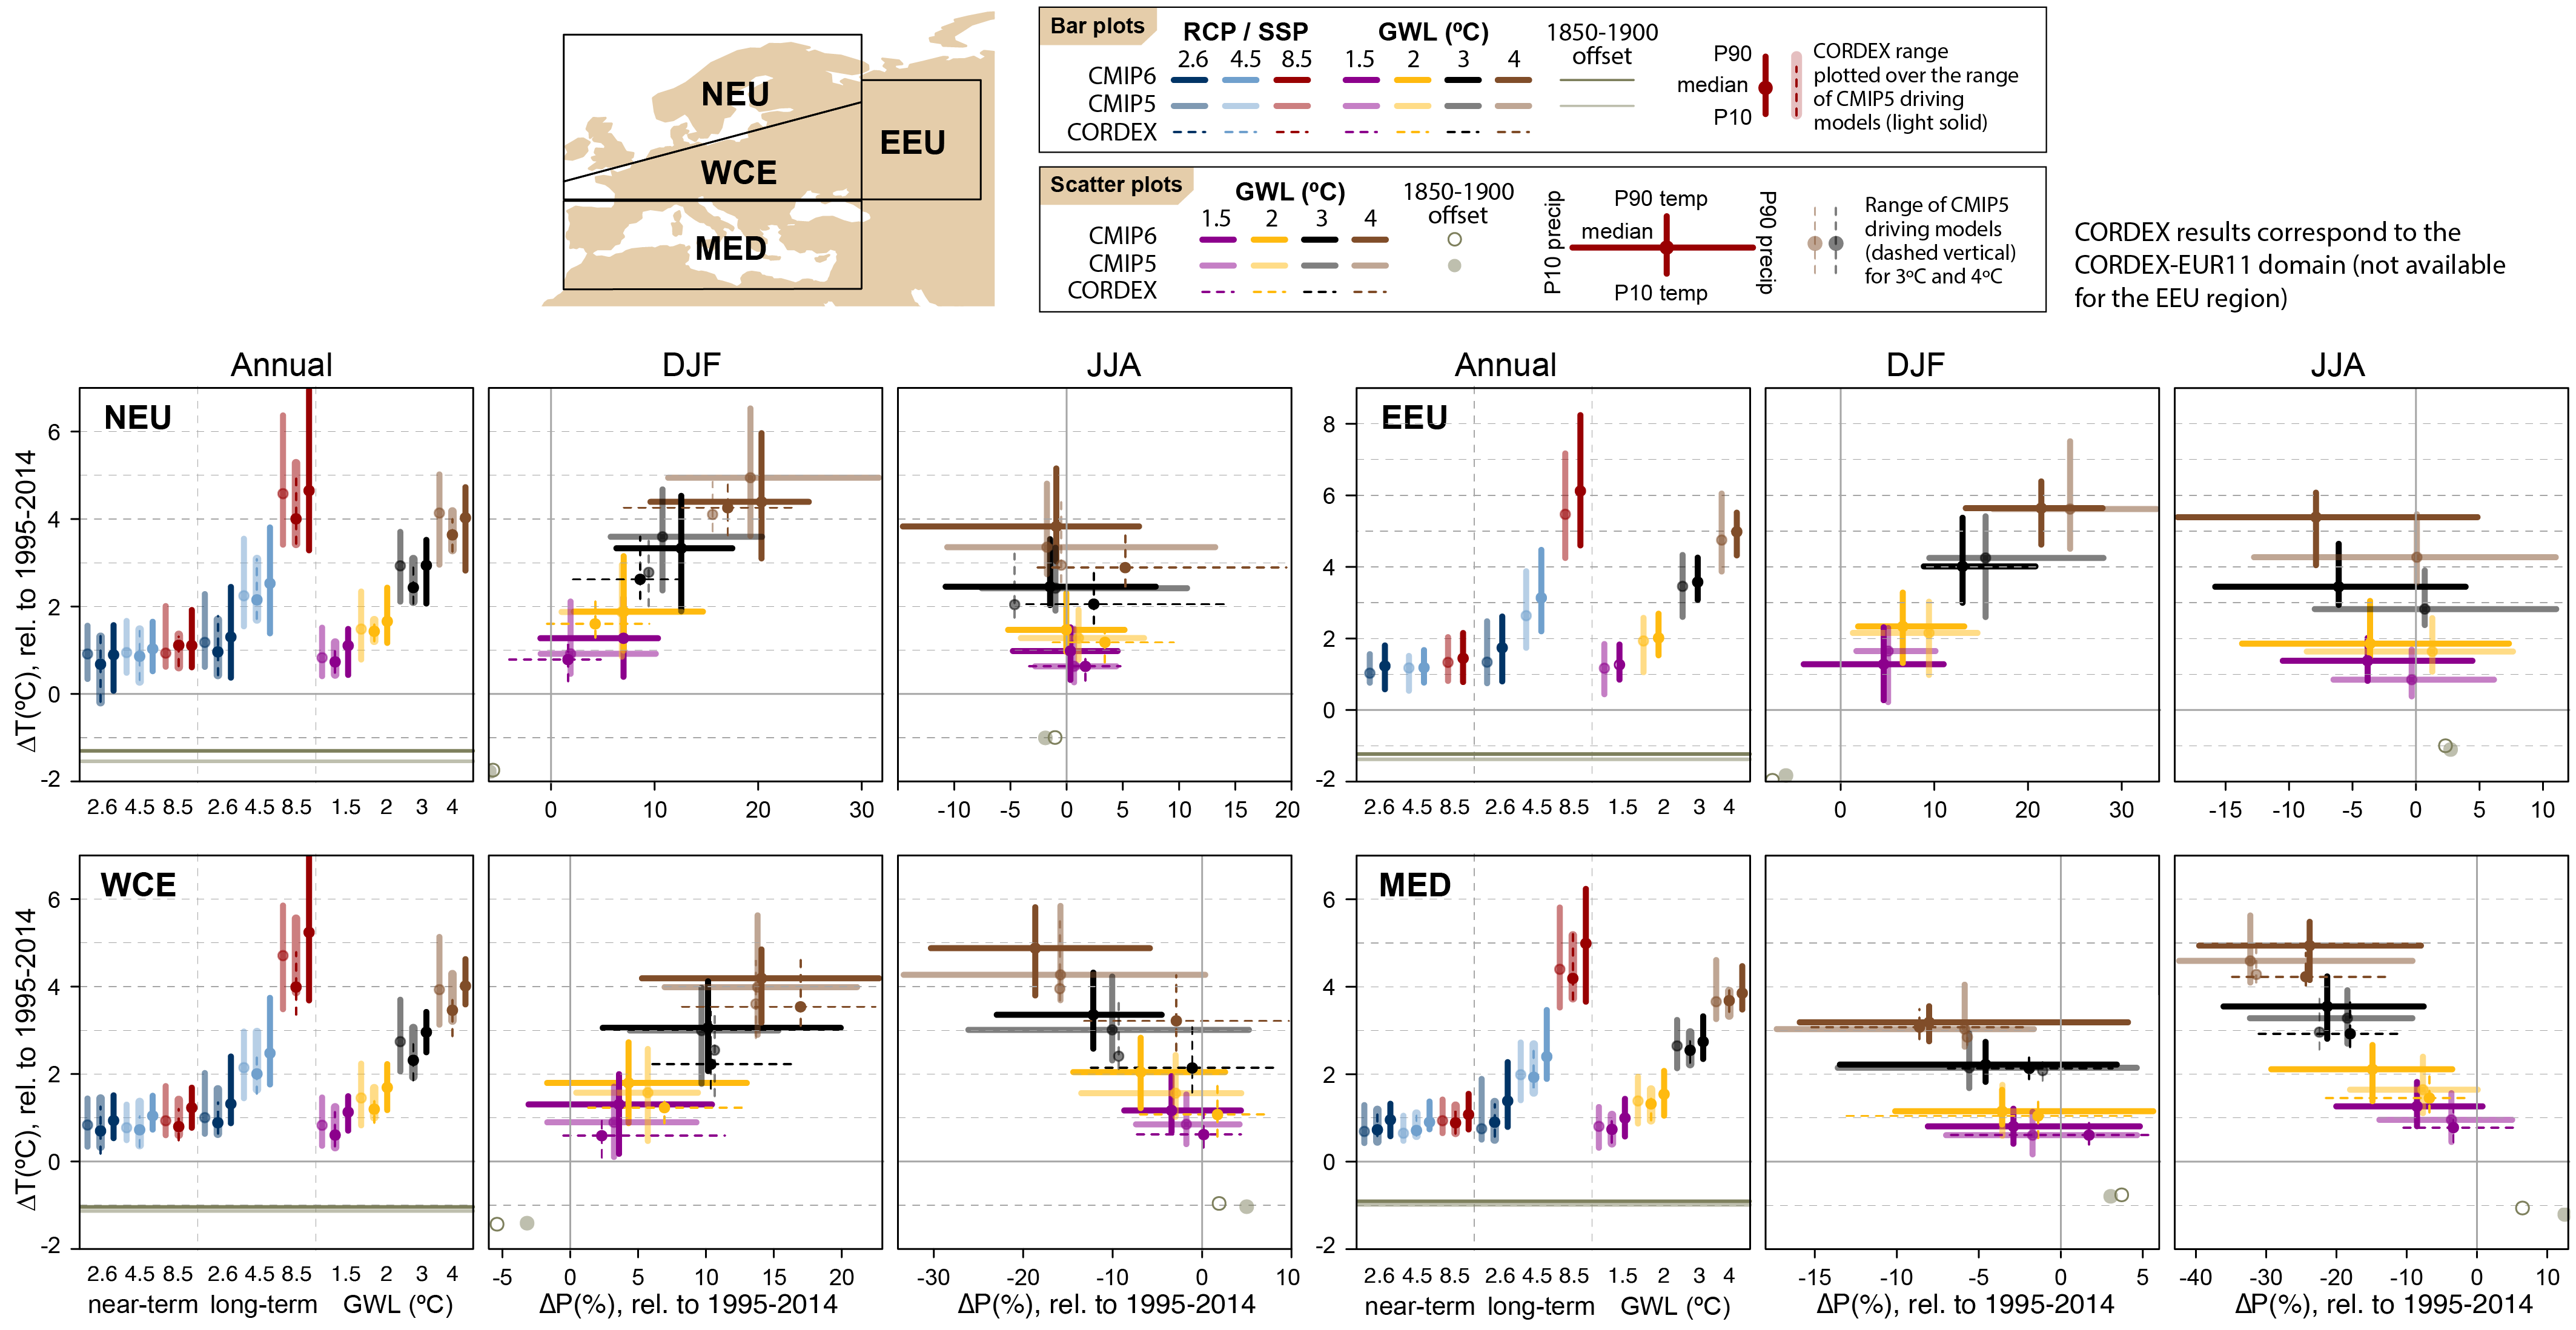
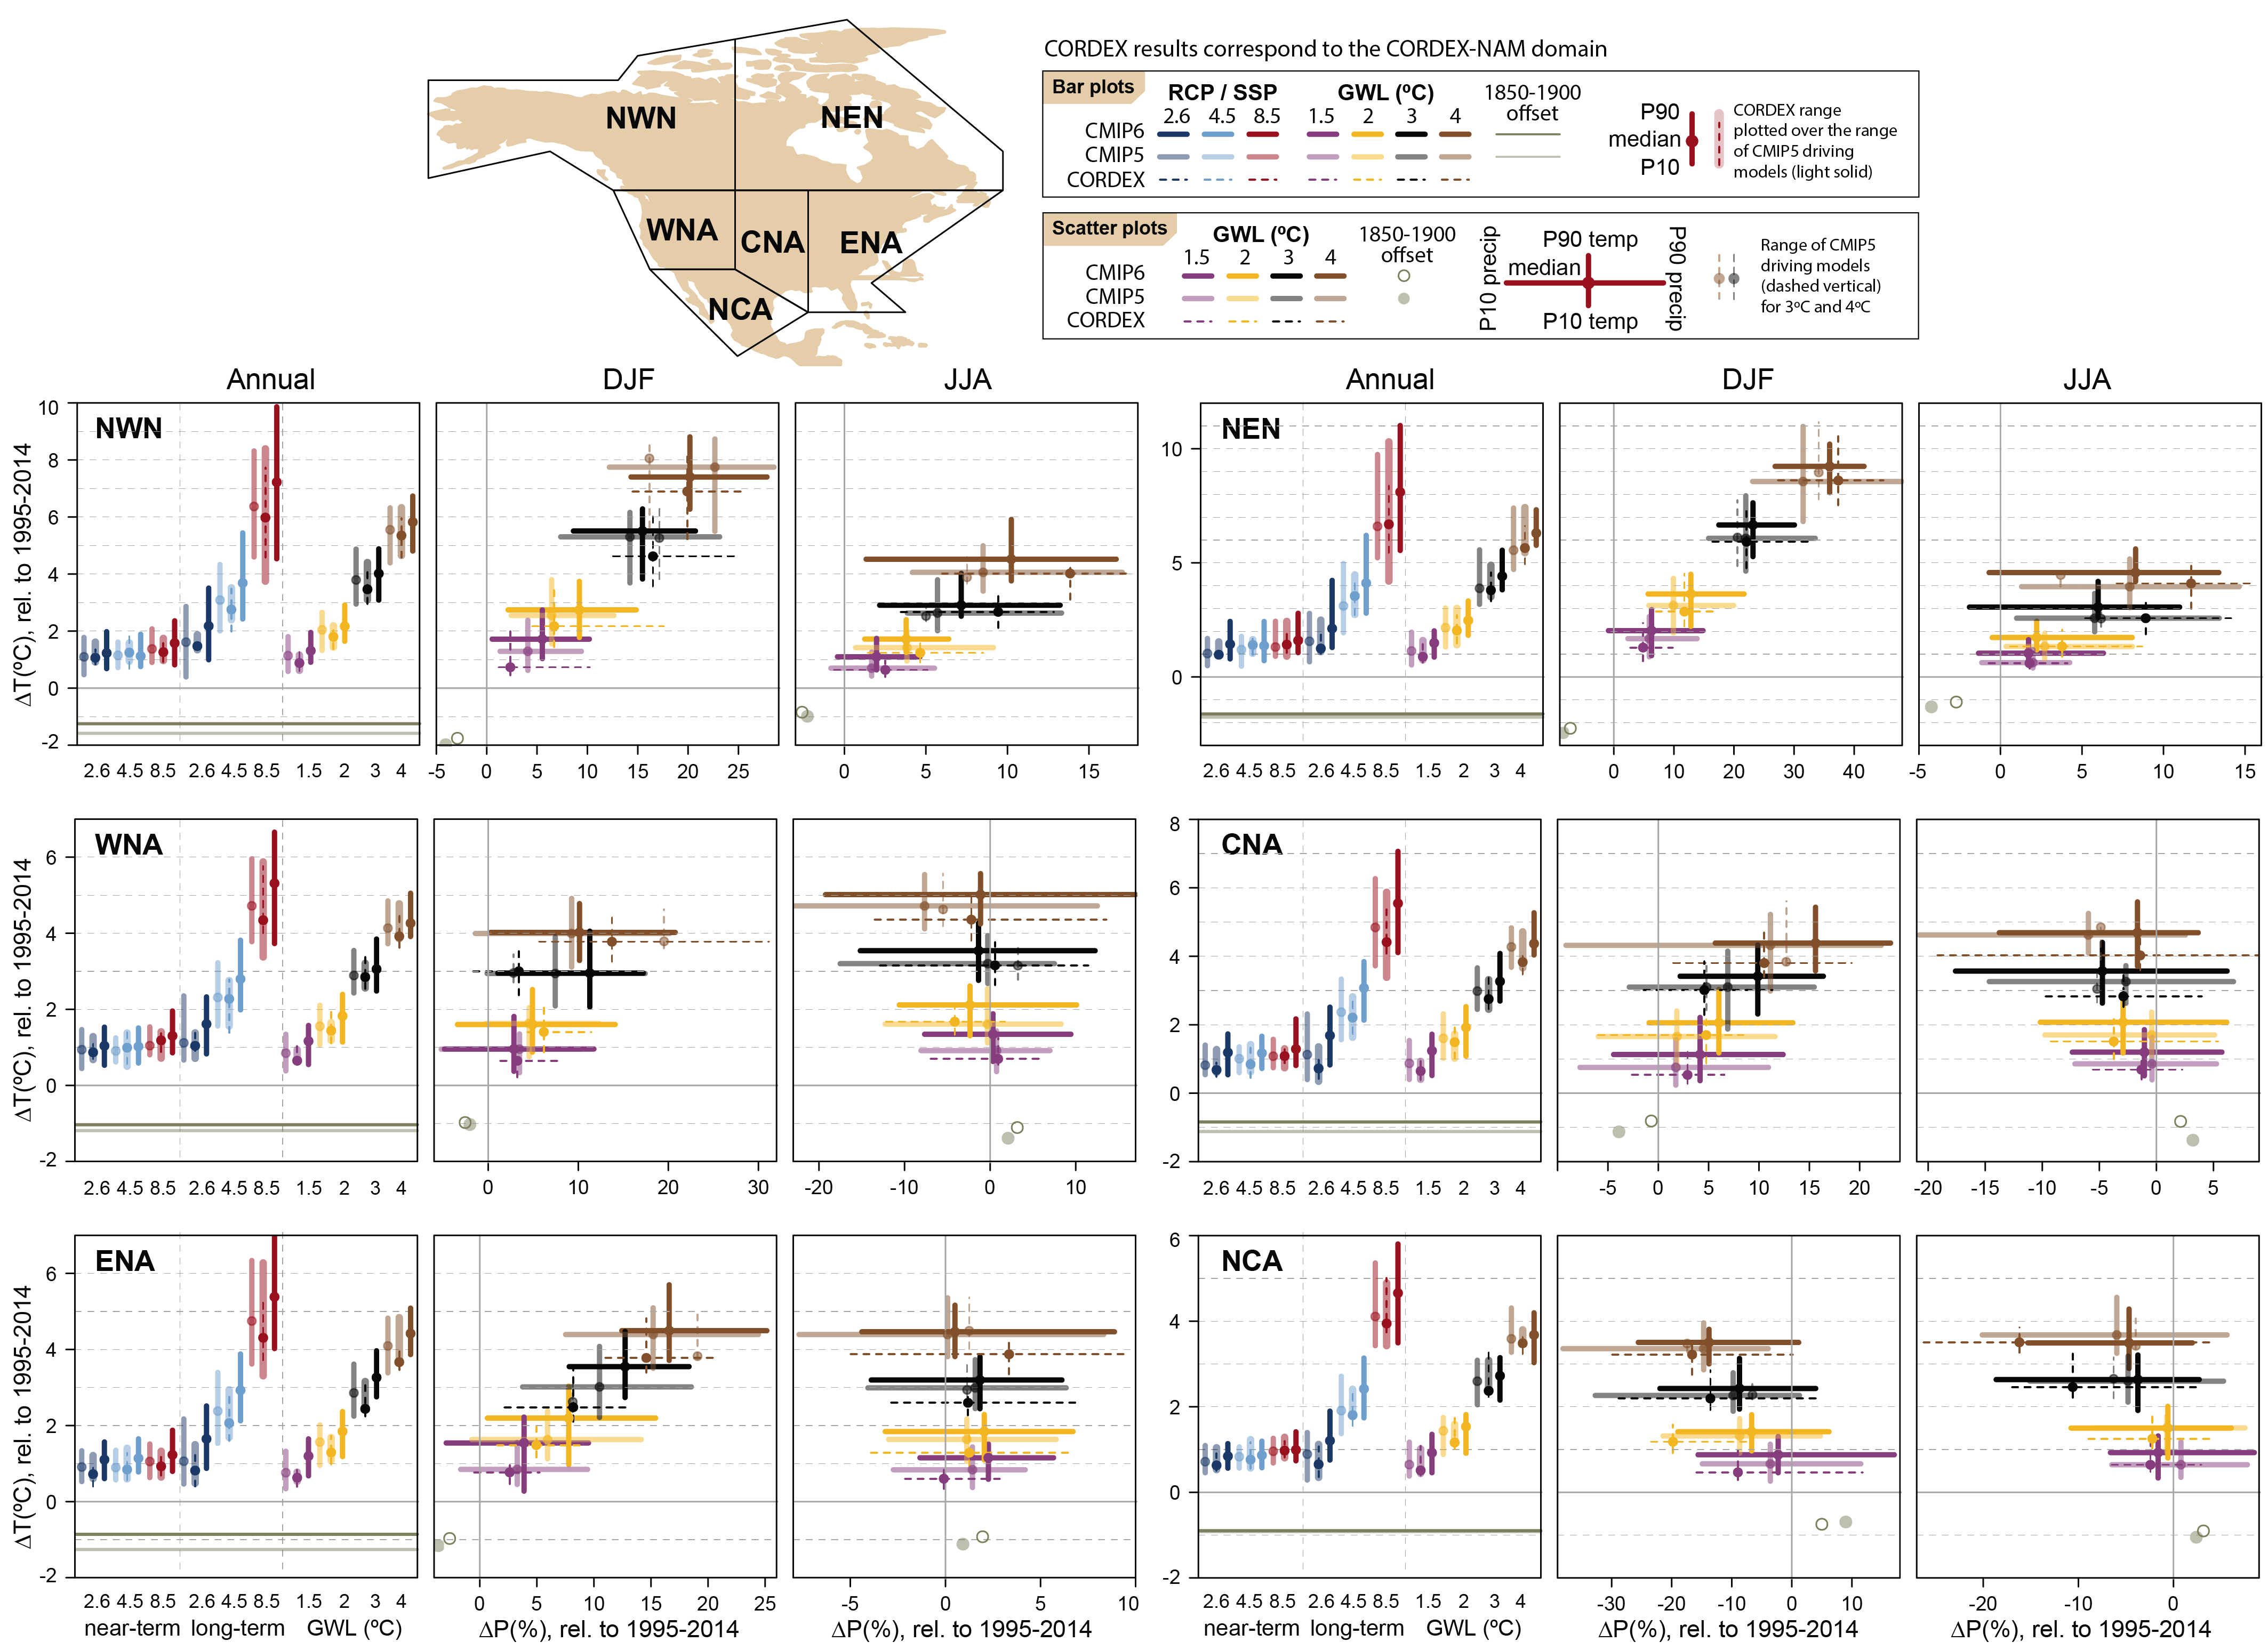
The observed warming trends are projected to continue over the 21st century (high confidence) and over most land regions at a rate higher than the global average. At a global warming level of 4°C (i.e., relative to an 1850–1900 baseline) it is likely that most land areas will experience a further warming (from a 1995–2014 baseline) of at least 3°C and in some areas significantly more, including increases of 4°C–6°C in the Sahara/Sahel; South West, Central and North Asia; Northern South America and Amazonia; Western and Central, and Eastern Europe; and Western, Central and Eastern North America; and up to 8°C or more in some Arctic regions. Across each of the continents, higher warming is likely to occur in northern Africa, the central interior of southern and Western Africa; in North Asia; in Central Australia; in Amazonia; in Northern Europe and northern North America (high confidence). Ranges of regional warming for global warming levels of 1.5°C, 2°C, 3°C and 4°C, and for other time periods and emissions scenarios are available in the Interactive Atlas from Coupled Model Intercomparison Project Phases 5 and 6 (CMIP5, CMIP6) and Coordinated Regional Climate Downscaling Experiment (CORDEX) projections. {Figure Atlas.12, Interactive Atlas, Atlas.4.4, Atlas.5.1.4, Atlas.5.2.4, Atlas.5.3.4, Atlas.5.4.4, Atlas.5.5.4, Atlas.6.4, Atlas.7.4, Atlas.8.4, Atlas.9.4, Atlas.10.4, Atlas.11.4}
For given global warming levels, model projections from CMIP6 show future regional warming and precipitation changes that are similar to those projected by CMIP5. However, the larger climate sensitivity in some CMIP6 models and differences in the model forcings lead to a wider range of and higher projected regional warming in CMIP6 compared to CMIP5 projections for given time periods and emissions scenarios. {Figure Atlas.1 3, Atlas.4.4, Atlas.5.1.4, Atlas.5.2.4, Atlas.5.3.4, Atlas.5.4.4, Atlas.5.5.4, Atlas.6.1.4, Atlas.6.2.4, Atlas.7.4, Atlas.8.4, Atlas.9.4, Atlas.10.4, Atlas.11.1.4, Atlas.11.2.4 }
Precipitation will change in most regions, either through changes in mean values or the characteristics of rainy seasons or daily precipitation statistics (high confidence). Regions where annual precipitation is likely to increase include the Ethiopian Highlands; East, South and North Asia; South-Eastern South America; Northern Europe; northern and Eastern North America and the polar regions. Regions where annual precipitation is likely to decrease include northern and south-western southern Africa, Indonesia, the northern Arabian Peninsula, south-western Australia, Central America, South-Western South America and southern Europe. Changes in monsoons are likely to result in increased precipitation in eastern and northern China and in South Asia in summer (high confidence). Precipitation intensity will increase in many areas, including in some where annual mean reductions are likely (e.g., southern Africa) (high confidence). Ranges of regional mean precipitation change for global warming levels of 1.5°C, 2°C, 3°C and 4°C, and for other time periods and emissions scenarios are available in the Interactive Atlas from CMIP5, CORDEX and CMIP6 projections. {Figure Atlas.1 3, Interactive Atlas, Atlas.4.4, Atlas.5.1.4, Atlas.5.2.4, Atlas.5.3.4, Atlas.5.4.4, Atlas.5.5.4, Atlas.6.1.4, Atlas.6.2.4, Atlas.7.4, Atlas.8.4, Atlas.9.4, Atlas.10.4, Atlas.11.1.4, Atlas.11.2.4 }
Cryosphere, Polar Regions and Small Islands
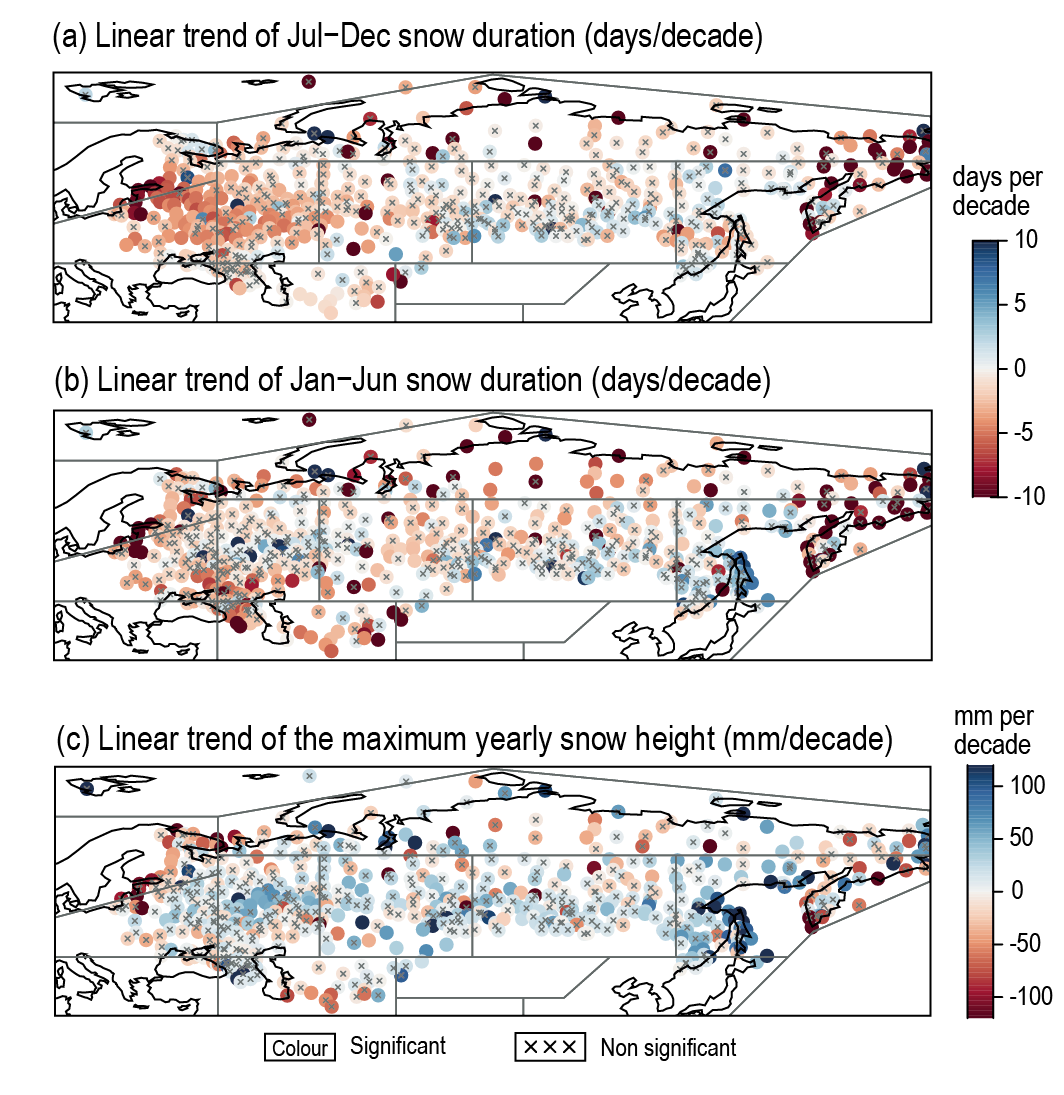
Many aspects of the cryosphere either have seen significant changes in the recent past or will see them during the 21st century (high confidence). Snow cover duration has very likely reduced over Siberia and Eastern and Northern Europe. Also, it is virtually certain that snow cover will experience a decline in these regions and over most of North America during the 21st century, in terms of water equivalent, extent and annual duration. Over the Hindu Kush Himalaya, glacier mass is likely to decrease considerably (nearly 50%) under the RCP4.5 and RCP8.5 scenarios. Snow cover has declined over Australia as has annual maximum snow mass over North America (medium confidence). Some high-latitude regions have experienced increases in winter snow (parts of North Asia, medium confidence) or will do so in the future (very likely in parts of northern North America) due to the effect of increased snowfall prevailing over warming-induced increased snowmelt. {2.3.2.2, 3.4.2,, Atlas.5.2.2, Atlas.5.3.4, Atlas.6.2, Atlas.8.2, Atlas.8.4, Atlas.9.2, Atlas.9.4 }
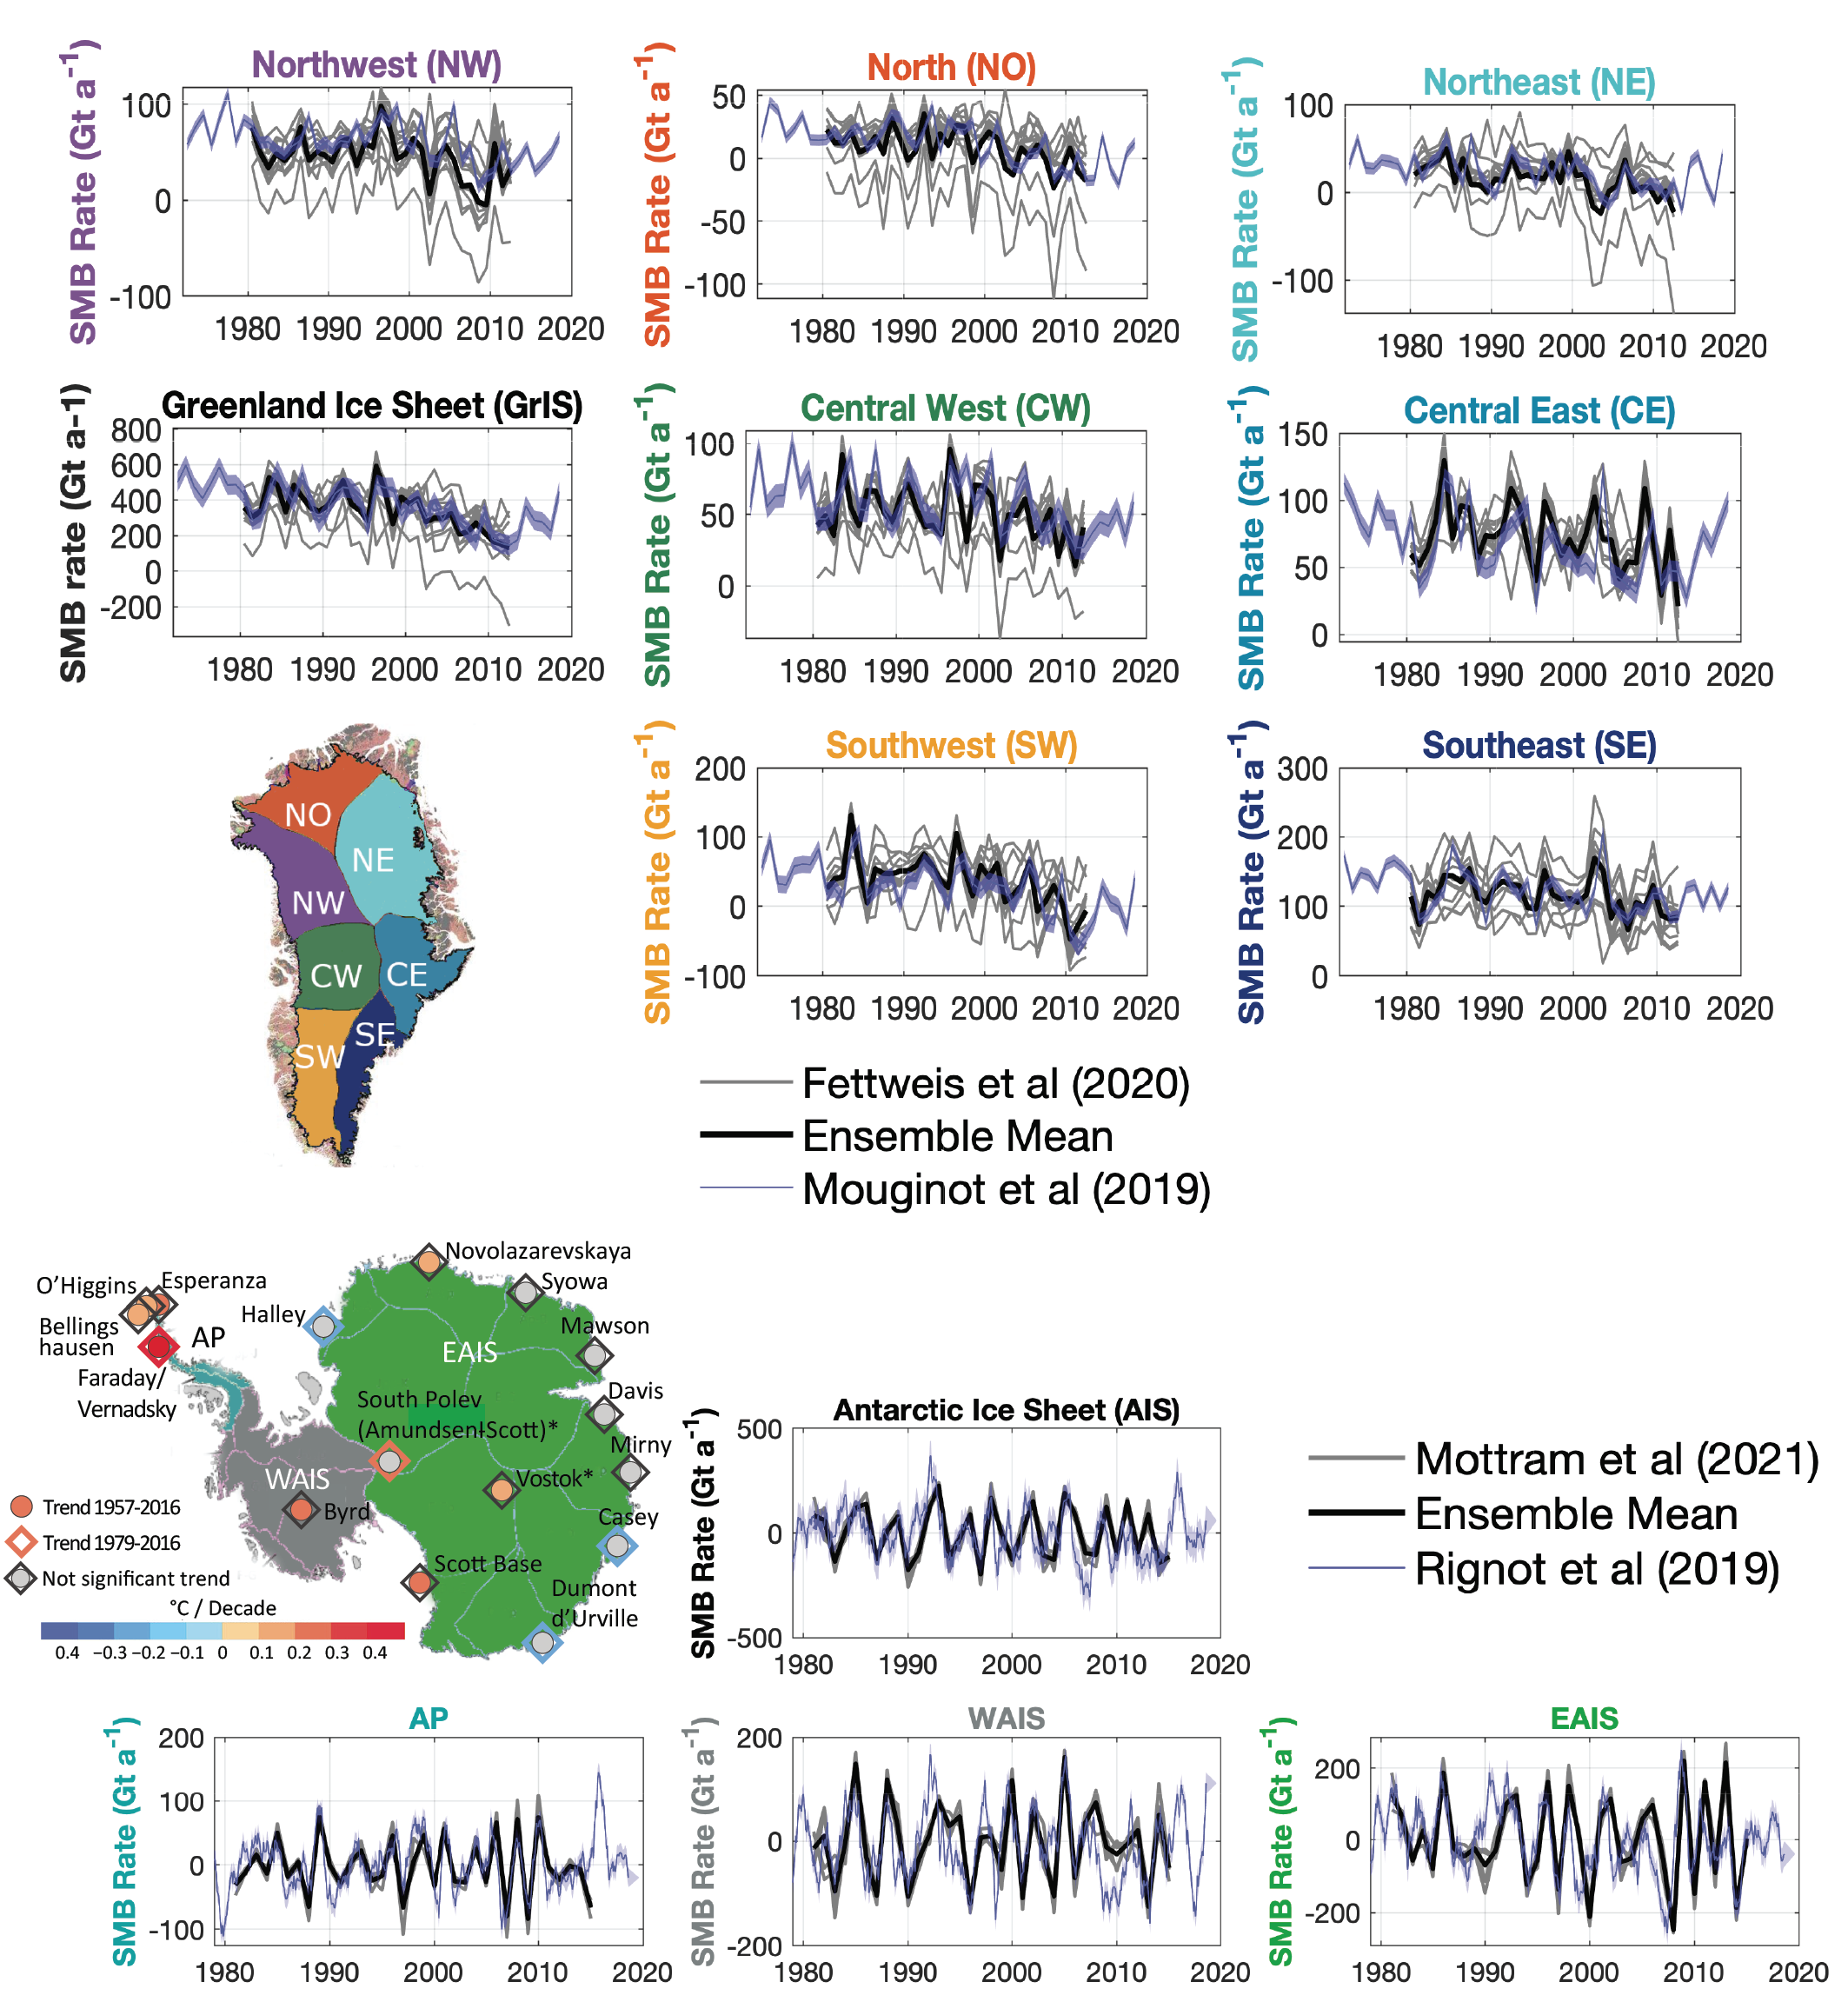
It is very likely that the Arctic has warmed at more than twice the global rate over the past 50 years and that the Antarctic Peninsula experienced a strong warming trend starting in 1950s. It is likely that Arctic annual precipitation has increased, with the highest increases during the cold season. Antarctic precipitation and surface mass balance showed a significant positive trend over the 20th century, while strong interannual variability masks any existing trend over recent decades1 (medium confidence). Significant warming trends are observed in other West Antarctic regions and at selected stations in East Antarctica since the 1950s (medium confidence). Under all assessed emissions scenarios, both polar regions are very likely to have higher annual mean surface air temperatures and more precipitation, with temperature increases higher than the global mean, most prominently in the Arctic. {Atlas.11.1.2, Atlas.11.1.4, Atlas.11.2.2, Atlas.11.2.4 }
It is very likely that most Small Islands have warmed over the period of instrumental records. Precipitation has likely decreased since the mid-20th century in some parts of the Pacific poleward of 20° latitude in both hemispheres and in the Caribbean in June–July–August. It is very likely that sea levels will continue to rise in Small Island regions and that this will result in increased coastal flooding. Observed temperature trends are generally in the range of 0.15°C–0.2°C per decade. Rainfall trends in most other Pacific Ocean and Indian Ocean Small Islands are mixed and largely non-significant. There is limited evidence and low agreement on the cause of the Caribbean drying trend, though it is likely that both this and the Pacific drying trends will continue in coming decades with drying also projected in the part of the Western Indian and Atlantic oceans. Small Island regions in the western and Equatorial Pacific Ocean, and in the northern Indian Ocean are likely to be wetter in the future. {Cross-Chapter Box Atlas.2, Atlas.10.2, Atlas.10.4 }
Model Evaluation, Technical Infrastructure and the Interactive Atlas
The regional performance of CMIP6 global climate models (GCMs) has improved overall compared to CMIP5 in simulating mean temperature and precipitation, though large errors still exist in some regions (high confidence). In particular, improvements have been seen over Africa which has belatedly become a focus for GCM model development . Other specific improvements include over East Asia for temperature and the winter monsoon, over parts of South Asia for the summer monsoon, over Australia (including influences of modes of variability), in simulation of Antarctic temperatures and Arctic sea ice. Notable errors include large cold biases in mountain ranges in South Asia, a significant wet bias over Central Asia, in the East Asia summer monsoon and in Antarctic precipitation. An in-depth evaluation of CMIP6 models is lacking for several regions (North and South East Asia, parts of West Central Asia, Central and South America), though CMIP5 models have been evaluated for many of these. {3.3.1, 3.3.2, Atlas.4.3, Atlas.5.1.3, Atlas.5.2.3, Atlas.5.3.3, Atlas.5.4.3, Atlas.5.5.3, Atlas.6.1.3, Atlas.6.2.3, Atlas.7.3, Atlas.8.3, Atlas.9.3, Atlas.10.3, Atlas.11.1.3, Atlas.11.2.3 }
Since AR5, the improvement in regional climate modelling and the growing availability of regional simulations through coordinated dynamical downscaling initiatives such as CORDEX, have advanced the understanding of regional climate variability, adding value to CMIP global models, particularly in complex topography zones, coastal areas and small islands, and in the representation of extremes (high confidence). In particular, regional climate models (RCMs) with polar-optimized physics are important for estimating the regional and local surface mass balance and are improved compared to reanalyses and GCMs when evaluated with observations (high confidence). There is still a lack of high-quality and high-resolution observational data to assess observational uncertainty in climate studies, and this compromises the ability to evaluate models (high confidence). {Atlas.4.3, Atlas.5.1.3, Atlas.5.2.3, Atlas.5.3.3, Atlas.5.4.3, Atlas.5.5.3, Atlas.6.1.3, Atlas.6.2.3, Atlas.7.3, Atlas.8.3, Atlas.9.3, Atlas.10.3, Atlas.11.1.3, Atlas.11.2.3 }
Significant improvements in technical infrastructure, open tools and methodologies for accessing and analysing observed and simulated climate data, and the progressive adoption of FAIR (findability, accessibility, interoperability and reusability) data principles have very likely broadened the ability to interact with these data for a wide range of activities, including fundamental climate research, providing inputs into assessments of impacts, building resilience and developing adaptations. Tools to analyse and assess climate information have improved to allow development of information that goes beyond averages (e.g., on future climate thresholds and extremes) and that is relevant for regional climate risk assessments. {Atlas.2.2, Atlas.2.3 }
The Interactive Atlas is a new WGI product developed to take advantage of the interactivity offered by web applications by allowing flexible and expanded exploration of some key products underpinning the assessment (including extreme indices and climatic impact-drivers). This provides a transparent interface for access to authoritative IPCC results, facilitating their use in applications and climate services. The Interactive Atlas implements FAIR principles and builds on open tools and, therefore, is an important step towards making IPCC results more reproducible and reusable. {Atlas.2, Interactive Atlas}
Atlas.1 Introduction
Atlas.1.1 Purpose
The Atlas is the final chapter of this Working Group I (WGI) Sixth Assessment Report (AR6) and comprises the Atlas Chapter and an online interactive tool, the Interactive Atlas. The Atlas assesses fundamental aspects of observed, attributed and projected changes in regional climate in coordination with other WGI chapters (Chapters 2, 3, 4, 6, 8, 9, 10, 11 and 12). In particular, it provides analyses and assessments of regional changes in mean climate (specifically surface temperature, precipitation and some cryospheric variables, such as snow cover and surface mass balance) and expands on and integrates results from other chapters across different spatial and temporal scales. The Atlas considers multiple lines of evidence including assessment of different global and regional observational datasets, attribution of observed trends and multiple model simulations from the Coupled Model Intercomparison Projects CMIP5 (K.E. Taylor et al., 2012 ) and CMIP6 (Eyring et al., 2016; O’Neill et al., 2016), and the Coordinated Regional Downscaling Experiment (CORDEX; Gutowski Jr. et al., 2016). The Atlas chapter also assesses model performance and summarizes cross-referenced findings from other chapters relevant for the different regions.
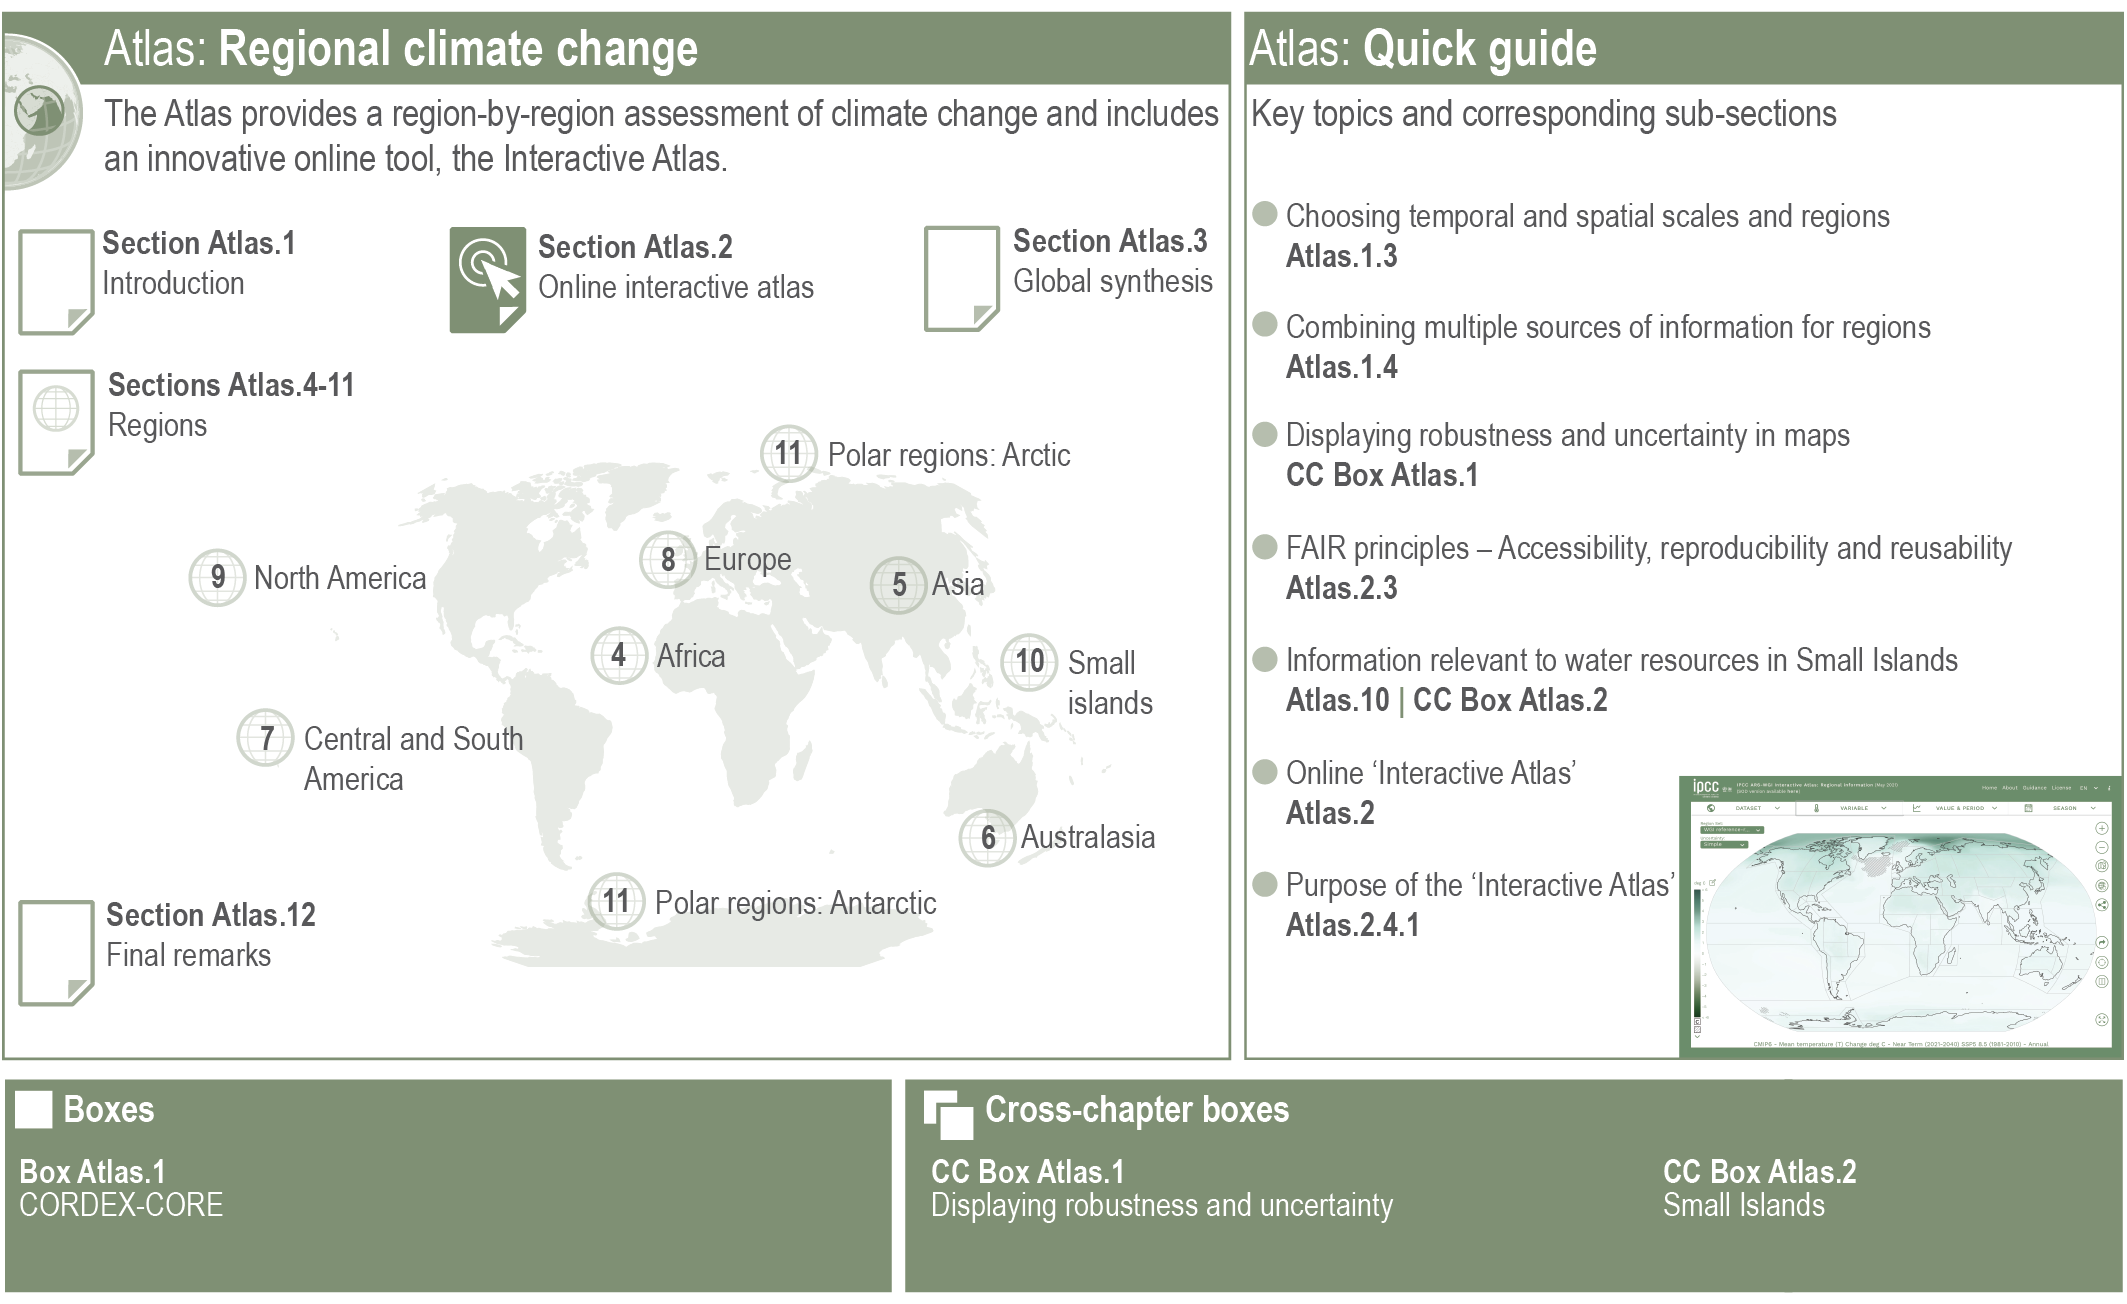
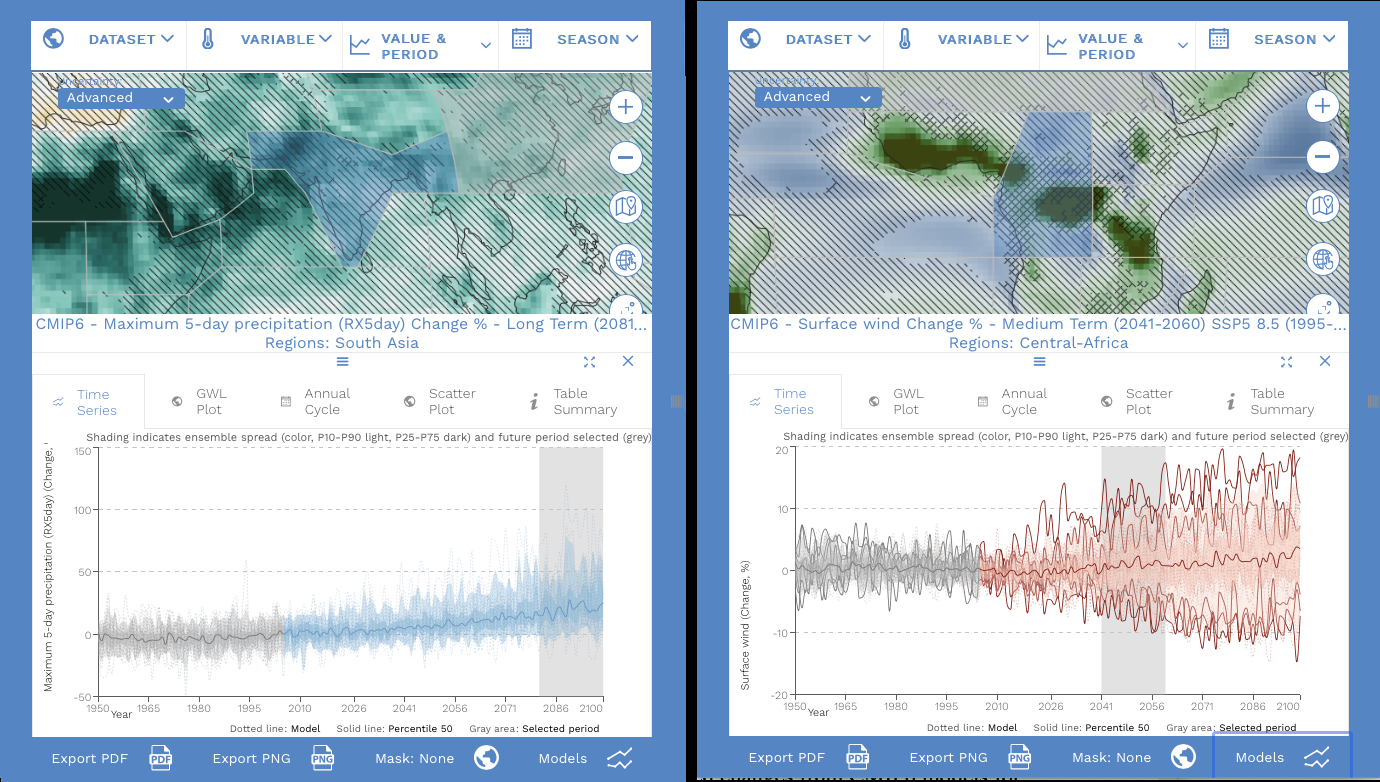
The Interactive Atlas is a novel product of this Report that allows for a flexible spatial and temporal analysis of the results presented in the Atlas and other chapters, the Technical Summary (TS) and the Summary for Policymakers (SPM), supporting and expanding on their assessments. The Interactive Atlas includes two components. The first component (Regional Information) includes information from global observational (and paleoclimate simulation) datasets assessed in Chapter 2 and projections of relevant extreme indices (used in Chapter 11) and climatic impact-drivers (CIDs, used in Chapter 12) allowing for a regional analysis of the results (Section Atlas.2.2). It provides information on CIDs relevant to sectoral and regional chapters of the Working Group II (WGII) report, being informed by and complementing the work of Chapter 12 in creating a bridge to WGII. The second component (Regional Synthesis) provides synthesis information about changes in CIDs in several categories such as heat and cold, wet and dry, or coastal and oceanic, supporting exploration of the regional assessment findings summarized in the TS and the SPM. An overview of the main components of the Atlas chapter is provided in Figure Atlas.1. The Interactive Atlas is described in Atlas.2 and is available online at interactive-atlas.ipcc.ch.
 Figure Atlas.1 | Visual guide to the Atlas chapter with (lower right) a screenshot from the online Interactive Atlas.
 Atlas.1.2 Context and Framing
Information on global and regional climate change in the form of maps, tables, graphs and infographics has always been a key output of IPCC reports. With the consensus that climate has changed and will continue to do so, policymakers are focusing more on understanding its implications, which often requires an increase in regional and temporal details of observed and future climate. The WGI contribution to AR5 included globally comprehensive coverage of land regions and some oceanic regions in the Atlas of Global and Regional Climate Projections (IPCC, 2013a), focusing on projected changes in temperature and precipitation. In the WGII contribution, Chapter 21, Regional Context (Hewitson et al., 2014) included continental-scale maps of observed and future temperature and precipitation changes, sub-continental changes in high percentiles of daily temperature and precipitation, and a table of changes in extremes over sub-continental regions (updating an assessment in the Special Report on Managing the Risks of Extreme Events and Disasters to Advance Climate Change Adaptation; SREX). However, there was only limited coordination between these two contributions despite the largely common data sources and their relevance across the two working groups and to wider communities of climate change-related policy and practice. This resulted in inefficiencies and the potential for confusing or inconsistent information. The Atlas, with its links with other WGI/II/III chapters, has been designed to help address this.
Given the aims of the Atlas, there are several important factors to consider. There is a clear requirement for climate change information over a wide range of ‘regions’, and classes thereof, and temporal scales. There is also often the need for integrated information relevant for policy, practice and awareness raising. However, most other chapters in WGI are disciplinary, focusing on specific processes in the climate system or on its past or future behaviour, and have limited space to be spatially and temporally comprehensive. The Atlas provides an opportunity to facilitate this integration and exploration of information.
Developing this information often requires a broad range of data sources (various observations, global and regionally downscaled baselines and projections) to be analysed and combined and, where appropriate, reconciled. This is a topic which is assessed from a methodological perspective in Chapter 10 using a limited set of examples (see also Cross-Chapter Box 10.3). The Atlas then builds on this work with a more comprehensive treatment of the available results, largely (but not exclusively) based on CMIP5, CMIP6 and CORDEX, to provide wider coverage and to further demonstrate techniques and issues. These multiple lines of evidence are integrated in the Interactive Atlas, a new AR6 WGI product described in Atlas.2 allowing for flexible spatial and temporal analysis of this information with a predefined granularity (e.g., flexible seasons, regions and baselines, and future periods of analysis including time slices and warming levels).
Generating information relevant to policy or practice requires understanding the context of the systems that they focus on. In addition to the hazards these systems face, their vulnerability and exposure, and the related socio-economic and other physical drivers, also need to be understood. To ensure this relevance, the Atlas is informed by the assessments in Chapter 12 and the regional and thematic chapters and cross-chapter papers of WGII. Therefore, it focuses on generating information on climatic impact-drivers and hazards applicable to assessing impacts on and risks to human and ecological systems whilst noting the potential relevance of these to related contexts such as the United Nations (UN) Sustainable Development Goals and the UN Sendai Framework for Disaster Risk Reduction.
Transparency and reproducibility are promoted in the Atlas chapter implementing FAIR principles for Findability, Accessibility, Interoperability, and Reusability of data (Wilkinson et al., 2016). More specifically, the Interactive Atlas provides full metadata of the displayed products (describing both the underlying datasets and the applied post-processing) and most of the figures included in the Atlas chapter can be reproduced using the scripts and data provided in the WGI-Atlas repository (see Iturbide et al., 2021 and https://github. com/IPCC-WG1/Atlas).
Atlas.1.3 Defining Temporal and Spatial Scales and Regions
Over the past decades scientists have engaged in a wide array of investigations aimed at quantifying and understanding the state of the components of the land surface-ocean-atmosphere system, the complex nature of their interactions and impacts over different temporal and spatial scales. As a result, a great deal has been learned about the importance of an appropriate choice of these scales when estimating changes due to internal climate variability, trends, characterization of the spatio-temporal variability, and quantifying the range of and establishing confidence in climate projections. It is therefore important to be able to explore a whole range of spatial and temporal scales and this section presents the basic definitions of those, and the domains of analysis, used by the Atlas accounting for potential synergies between WGI and WGII.
Atlas.1.3.1 Baselines and Temporal Scales of Analysis for Projections Across Scenarios
Chapter 1 has extensively explored this topic in Section 1.4.1 and Cross-Chapter Box 1.2. A summary of the main points relevant to the Atlas chapter and the Interactive Atlas are provided here.
There is no standard baseline in the literature although the World Meteorological Organization (WMO) recommends a 30-year baseline approach such as the climate-normal period 1981–2010. However, it retains the 1961–1990 period as the historical baseline for the sake of supporting long-term climate change assessments (WMO, 2017). Using the WMO standards also provides sample sizes relevant to calculating changes in statistics other than the mean. The AR6 WGI has established the 1995–2014 period as the recent-past baseline period – for similar reasons to the 1986–2005 period used in AR5 WGI (IPCC, 2013b) – since 2014 (2005) is the final year of the historical simulations of the models (more details in Cross-Chapter Box 1.2).
The choice of a baseline can significantly influence the analysis results for future changes in mean climate (Cross-Chapter Box 1.2; Hawkins and Sutton, 2016) as well as its variability and extremes. Thus, assessing the sensitivity of results to the baseline period is important. The Interactive Atlas (Atlas.2) allows users to explore and investigate a wide range of different baseline periods when analysing changes for future time slices or global warming levels:
- 1995–2014 (AR6 20-year baseline);
- 1986–2005 (AR5 20-year baseline);
- 1981–2010 (WMO 30-year climate normal);
- 1961–1990 (WMO 30-year long-term climate normal);
- 1850–1900 (baseline used in the calculation of global warming levels).
This promotes cross-Working Group consistency and facilitates comparability with previous reports and across datasets. For instance, the AR5 and long-term WMO baselines facilitate the intercomparison of CMIP5, CORDEX and CMIP6 projections since all have historical simulations in these periods. Using more recent baselines introduces discontinuity for the CMIP5 and CORDEX models, since historical simulations end in 2005. A pragmatic approximation to deal with this issue is to use scenario data to fill the missing segment, for example for 2006–2014 use the first years of RCP8.5-driven transient projections in which the emissions are close to those observed. This approach is used in the Atlas chapter and Chapter 12.
When assessing changes over the recent past, many studies analyse datasets using a range of climatologically significant periods (i.e., 30 years or more) with precise start and end dates depending on data availability and the year of the study. To account for this, when generating assessments from this literature the term ‘recent decades’ is used to refer to a period of approximately 30 to 40 years which ends within the period 2010–2020. An equivalent approximate description using specific years would be ‘since the 1980s’.
Regarding the future reference periods, the Interactive Atlas presents projected global and regional climate changes at near-, mid- and long-term periods, respectively 2021–2040, 2041–2060 and 2081–2100, for a range of emissions scenarios (Atlas.1.4.3 and Cross-Chapter Box 1.4).
Atlas.1.3.2 Global Warming Levels
Notingthe approach taken in the recent IPCC Special Report on Global Warming of 1.5°C (SR1.5) above 1850–1900 levels (IPCC, 2018b), the Atlas also presents global and regional climate change information at different global warming levels (GWLs, see Cross-Chapter Box 11.1). In particular, to provide policy-relevant climate information and represent the range of outcomes from the emissions scenario and time periods considered, GWLs of 1.5°C, 2°C, 3°C and 4°C are considered. The information is computed from all available scenarios (e.g., only 1.5°C and 2°C GWL information can be computed from projections under the SSP1-2.6 scenario). The Interactive Atlas allows comparison of timings for global warming across the different scenarios and of spatial patterns of change, for example information at 2°C GWL is calculated from SSP1-2.6, SSP2-4.5, SSP3-7.0 and SSP5-8.5 projections (Section 4.2.4).
To calculate GWL information for the datasets used in the Atlas (CMIP6 and CMIP5; see Atlas.1.4), this chapter adopted the procedure used in Cross-Chapter Box 11.1. A model future climate simulation reaches the defined GWL of 1.5°C, 2°C, 3°C or 4°C when its global near-surface air temperature change averaged over successive 20-year periods first attains that level of warming relative to its simulation of the 1851–1900 climate (1851–1900 defines the pre-industrial baseline period for calculating the required global surface temperature baseline, Cross-Chapter Box 1.2). Note that this process is different from the one used in the SR1.5 report which used 30-year future periods. If a projection stabilizes before reaching the required threshold it is unable to simulate climate at that GWL and is thus discarded. For CORDEX simulations, the periods of the driving GCM are used, as in Nikulin et al. (2018). Detailed reproducible information on the GWLs used in the Atlas is provided in the Atlas repository (Iturbide et al., 2021).
Climateinformation at many temporal scales and over a wide range of temporal averaging periods is required for the assessment of climate change and its implications. These range from annual to multi-decadal averages required to characterize low-frequency variability and trends in climate to hourly or instantaneous maximum or minimum values of impactful climate variables. In between, information on, for example, seasonal rainfall is important and implies the need to include averaging periods whose relevance are geographically dependent. As a result, the Atlas chapter presents results over a wide range of time scales, from daily to decadal, and averaging periods with the Interactive Atlas allowing a choice of user-defined seasons and a range of predefined daily to multi-day climate indices.
Atlas.1.3.3 Spatial Scales and Reference Regions
Many factors influence the spatial scales and regions over which climate information is required and can be reliably generated. Despite all efforts in researching, analysing and understanding climate and climate change, a key factor in determining spatial scales at which analysis can be undertaken is the availability and reliability of data, both observational and from model simulations. In addition, information is required over a wide range of spatial domains defined either from a climatological or geographical perspective (e.g., a region affected by monsoon rainfall or a river basin) or from a socio-economic or political perspective (e.g., least-developed countries or nation states). Chapter 1 provides an overview of these topics (Section 1.5.2). This subsection discusses some relevant issues, summarizes recent advances in defining domains and spatial scales used by AR6 analyses and how these can be explored with the Interactive Atlas.
Recent IPCC reports – AR5 Chapter 14 (Christensen et al., 2013) and SR1.5 Chapter 3 (Hoegh-Guldberg et al., 2018) – have summarized information on projected future climate changes over sub-continental regions defined in the SREX report (Seneviratne et al., 2012) and later extended in AR5 from the 26 regions in SREX to include the polar, Caribbean, two Indian Ocean, and three Pacific Ocean regions (hereafter known as AR5 WGI reference regions; Figure Atlas.2a). In recent literature, new sub-regions have been used, for example for North and South America, Africa and Central America, together with the new definition of reference oceanic regions. Iturbide et al. (2020) describes an updated version of the reference regions which is used in this report (hereafter known as AR6 WGI reference regions) and is shown in Figure Atlas.2b. The goal of these subsequent revisions was to ensure that they represented sub-continental areas of greater climatic coherency.
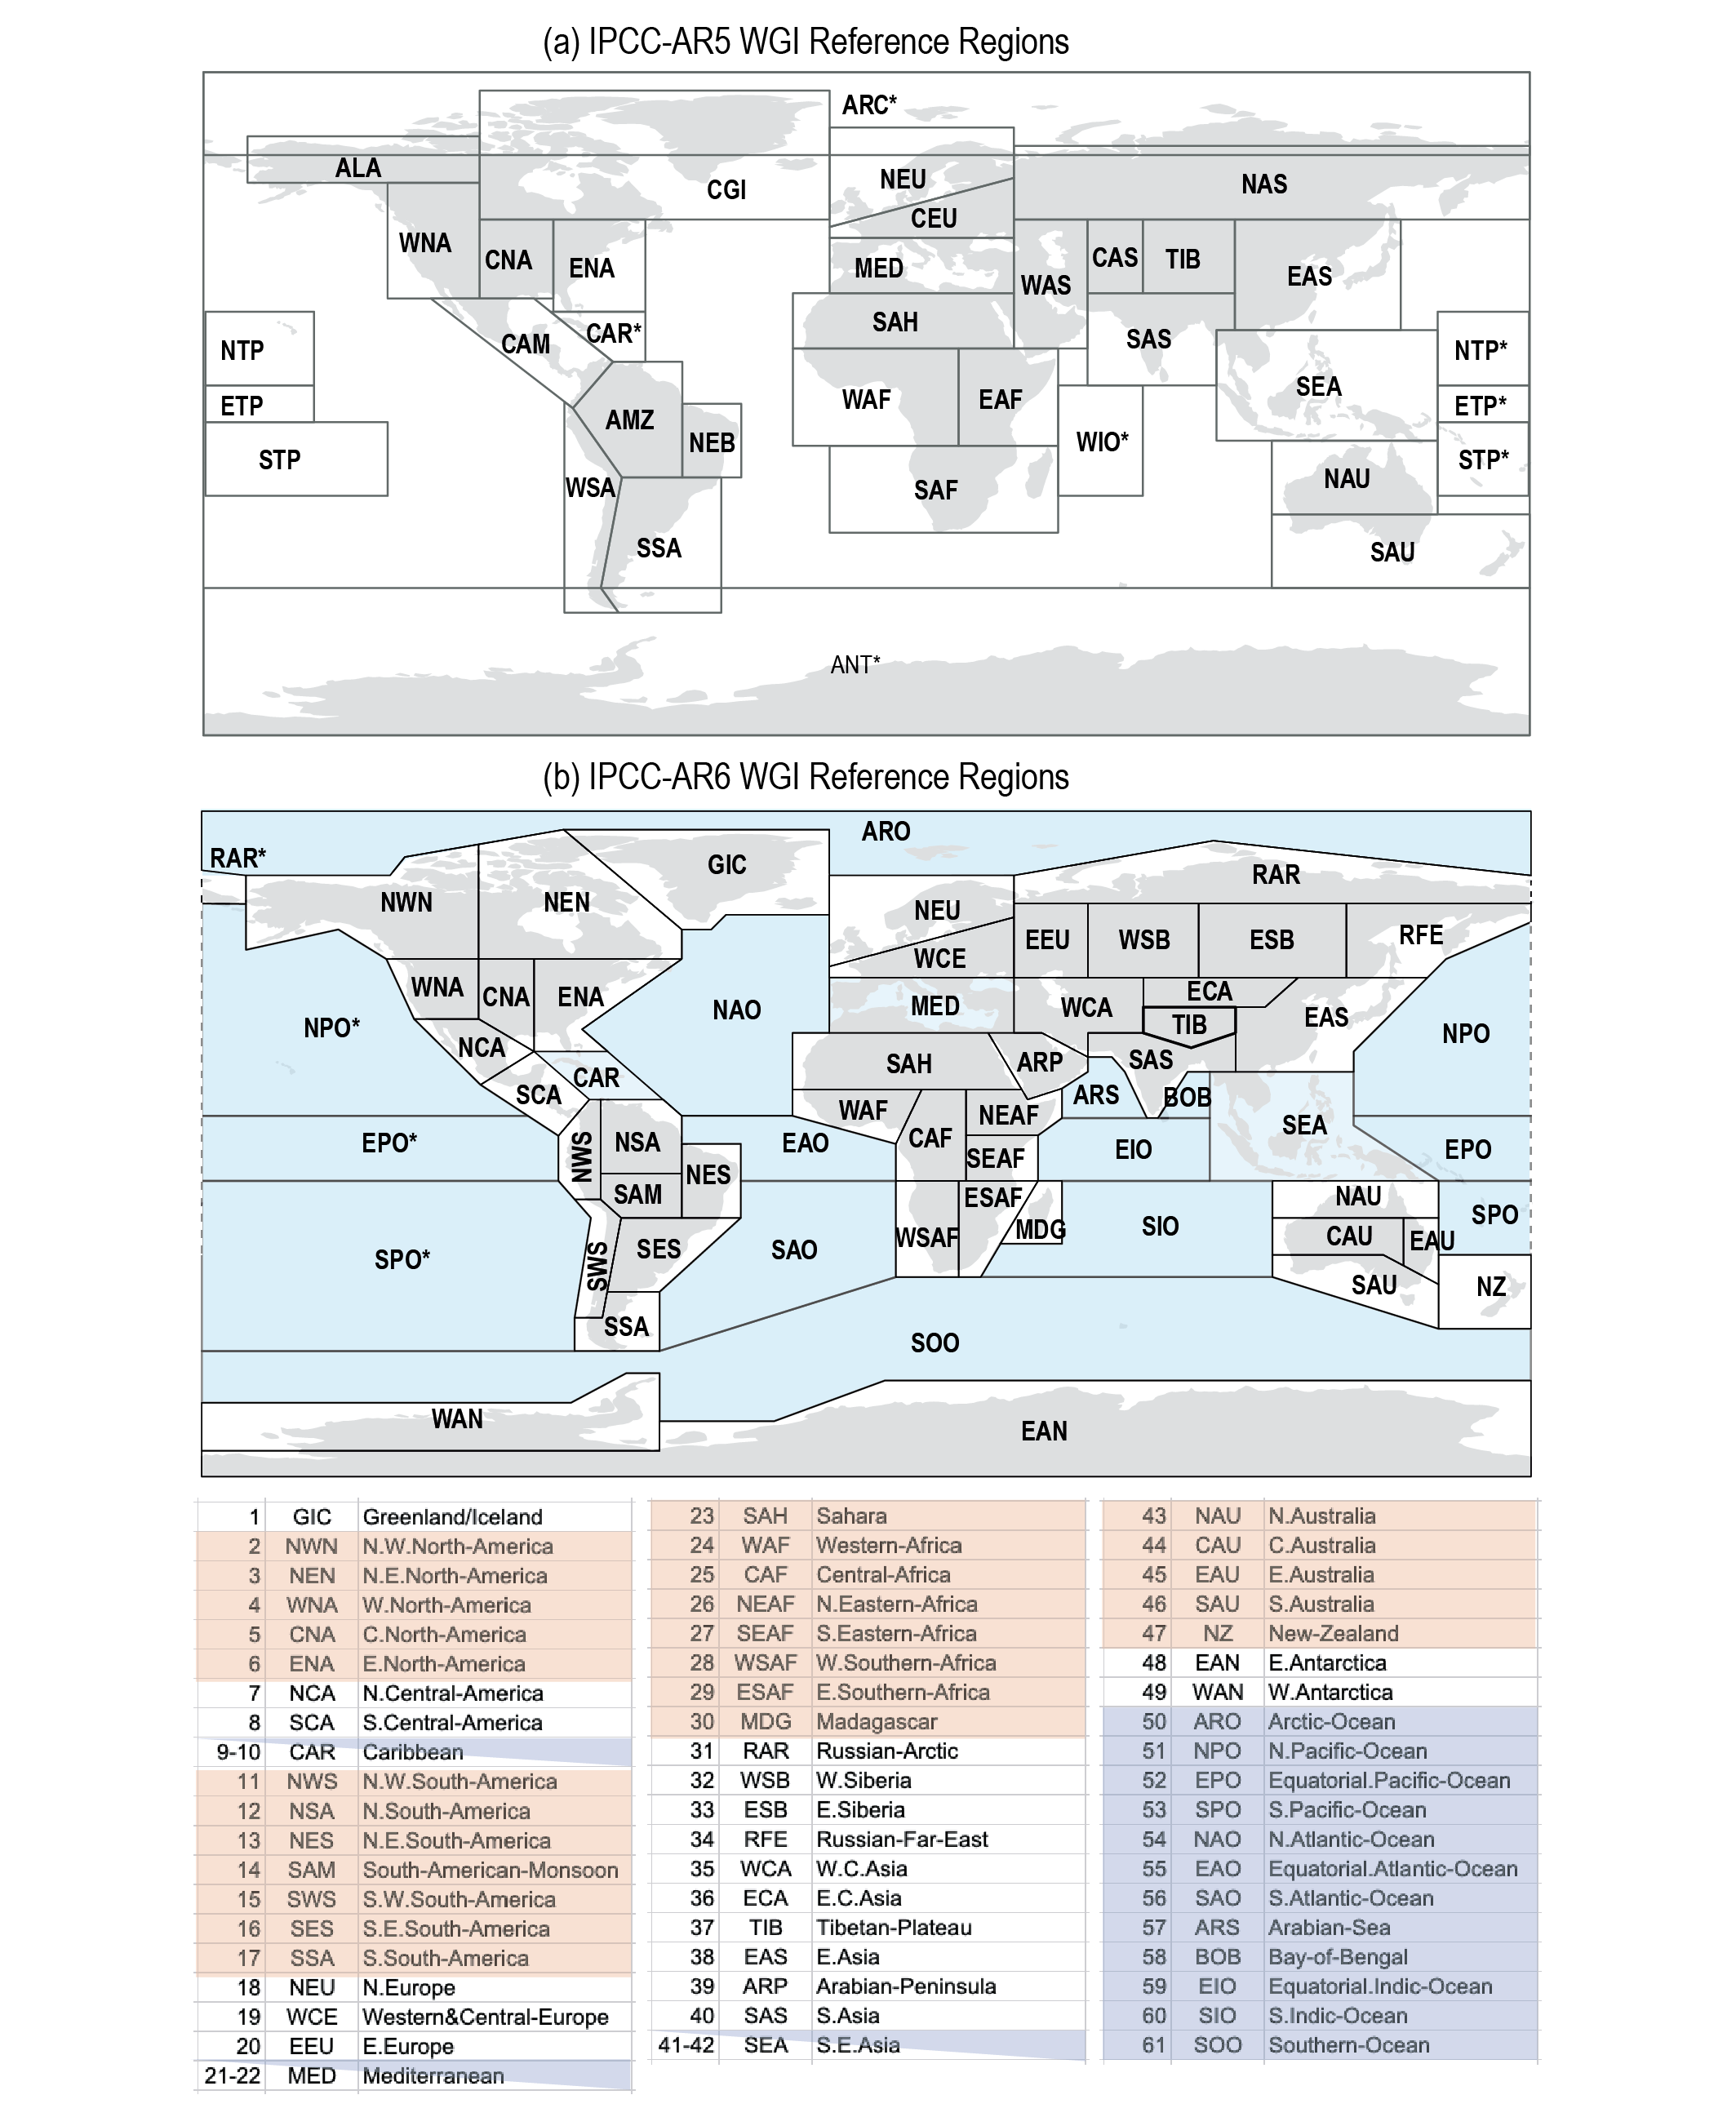 Figure Atlas.2 | WGI reference regions used in the (a) AR5 and (b) AR6 reports (Iturbide et al., 2020). Asterisks indicate regions that extend across both sides of the map. The latter includes both land and ocean regions and it is used as the standard for the regional analysis of atmospheric variables in the Atlas chapter and the Interactive Atlas. The codes used in the Interactive Atlas are included in the figure. The full description of the regions (grouped by continents) is as follows. North America: NWN (North-Western North America), NEN (North-Eastern North America), WNA (Western North America), CNA (Central North America), ENA (Eastern North America); Central America: NCA (Northern Central America), SCA (Southern Central America), CAR (Caribbean); South America: NWS (North-Western South America), NSA (Northern South America), NES (North-Eastern South America), SAM (South American Monsoon), SWS (South-Western South America), SES (South-Eastern South America), SSA (Southern South America); Europe: GIC (Greenland/Iceland), NEU (Northern Europe), WCE (Western and Central Europe), EEU (Eastern Europe), MED (Mediterranean); Africa: MED (Mediterranean), SAH (Sahara), WAF (Western Africa), CAF (Central Africa), NEAF (North Eastern Africa), SEAF (South Eastern Africa), WSAF (West Southern Africa), ESAF (East Southern Africa), MDG (Madagascar); Asia: RAR (Russian Arctic), WSB (West Siberia), ESB (East Siberia), RFE (Russian Far East), WCA (West Central Asia), ECA (East Central Asia), TIB (Tibetan Plateau), EAS (East Asia), ARP (Arabian Peninsula), SAS (South Asia), SEA (South East Asia); Australasia: NAU (Northern Australia), CAU (Central Australia), EAU (Eastern Australia), SAU (Southern Australia), NZ (New Zealand); Antarctica: WAN (Western Antarctica), EAS (Eastern Antarctica). The definition of the regions and companion notebooks and scripts are available at the Atlas repository (Iturbide et al., 2021). Figure from Iturbide et al. (2020).
The rationale followed for the definition of the reference regions was guided by two basic principles: 1) climatic consistency and better representation of regional climate features, and 2) representativeness of model results (i.e., sufficient number of model grid boxes). The finer resolution of CMIP6 models (as compared, on average, to CMIP5) yields better model representation of the reference regions allowing them to be revised for better climatic consistency (e.g., dividing heterogeneous regions) while preserving the model representation. Figure Atlas.3 illustrates this issue, displaying the number of grid boxes (over land for land regions) in the AR6 reference regions for two Interactive Atlas reference grids of horizontal resolutions of 1° and 2°, representative of the typical resolution of CMIP6 and CMIP5 models respectively. This figure shows that the new reference regions are well suited for the assessment of model results, with poorest model coverage for the New Zealand (NZ), Caribbean (CAR) and Madagascar (MAD) regions.
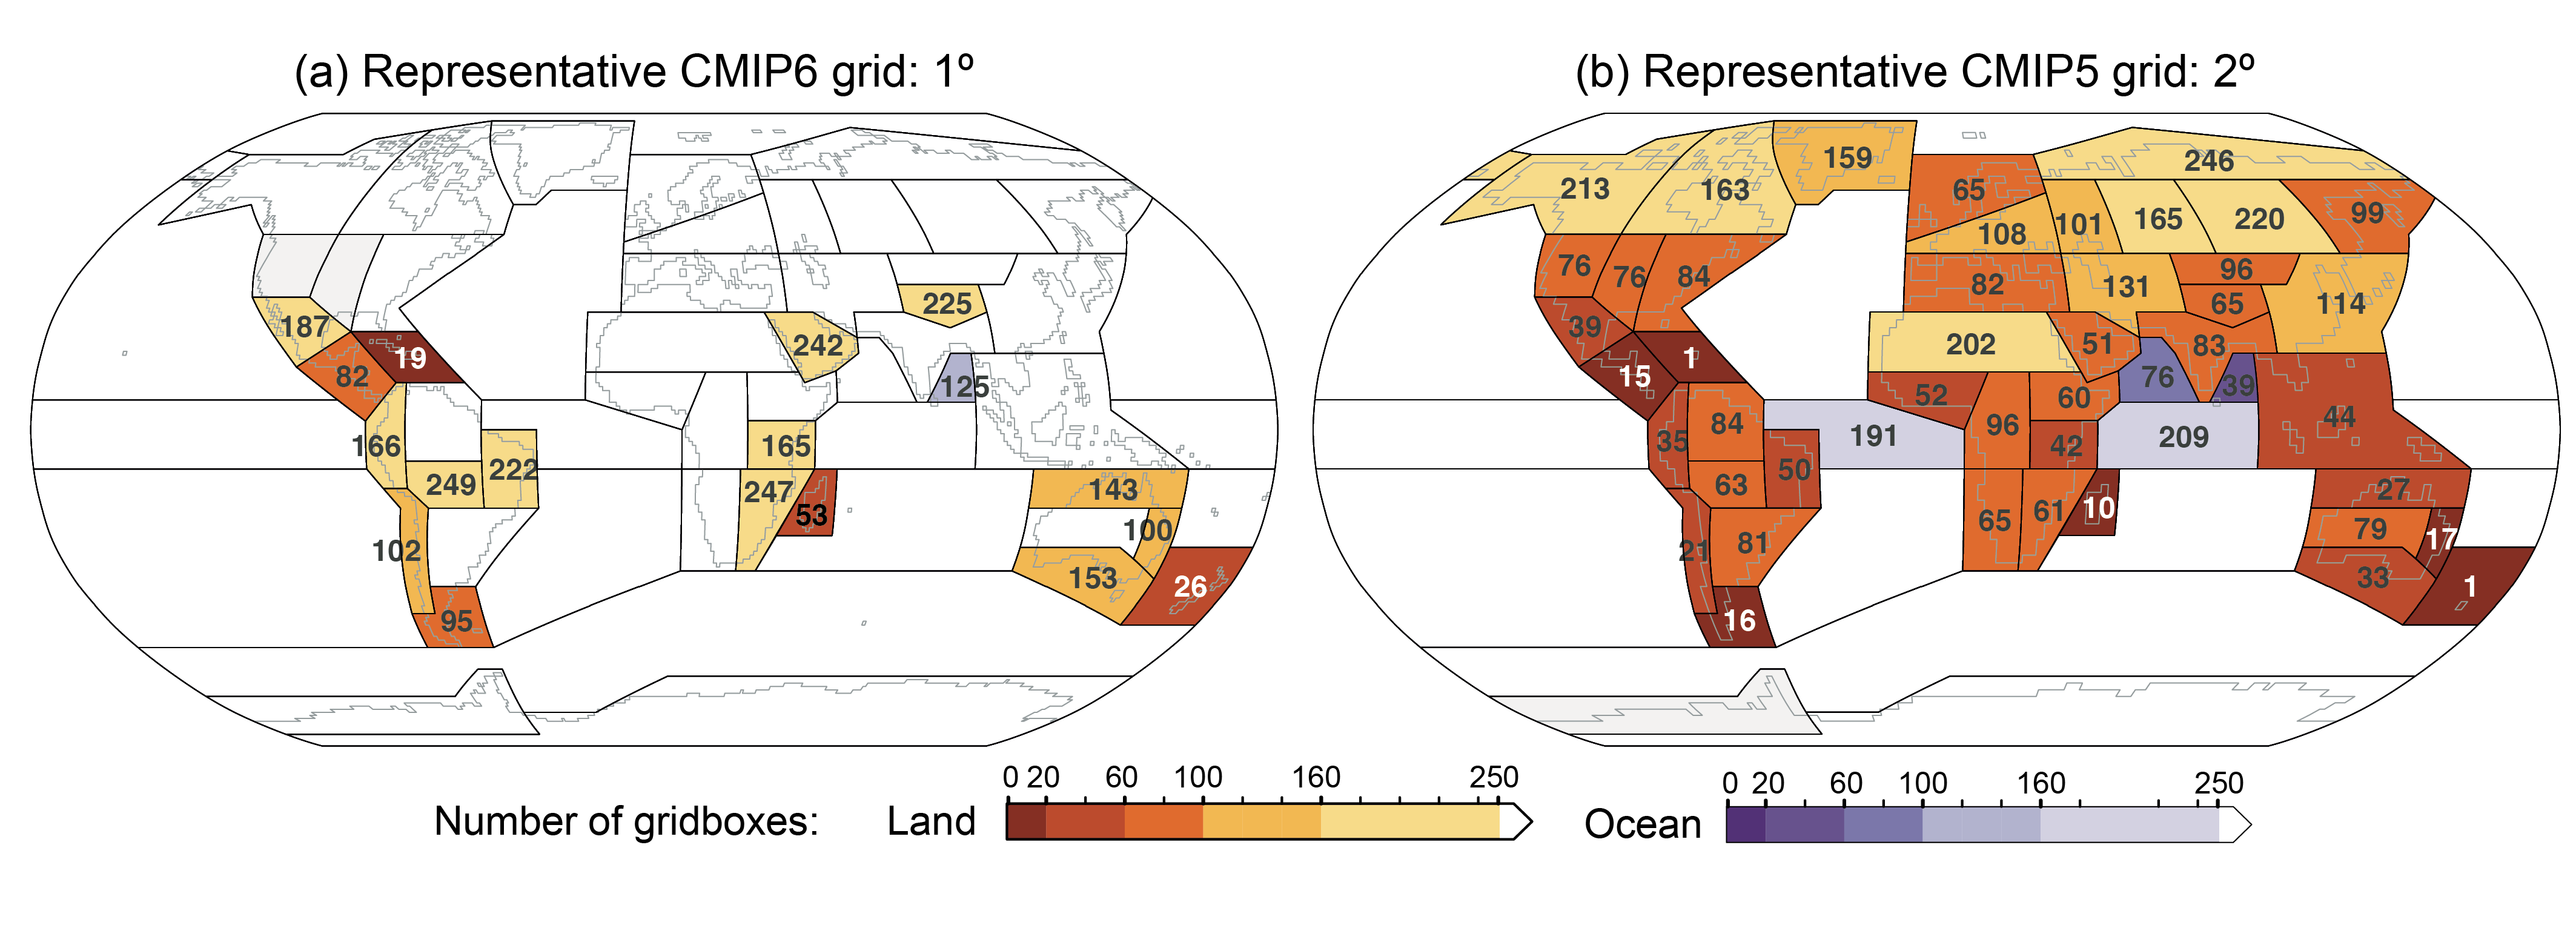 Figure Atlas.3 | Number of land grid boxes for each AR6 WGI reference region for the reference grids representative of (a) CMIP6 and (b) CMIP5, at 1° and 2° resolution respectively. Colour shading indicates regions with fewer than 250 grid boxes (the darkest shading is for regions with fewer than 20 grid boxes). The polygons show the AR6 WGI reference regions of Figure Atlas.2. Detailed information on the grids used is provided at the Atlas repository (Iturbide et al., 2021).
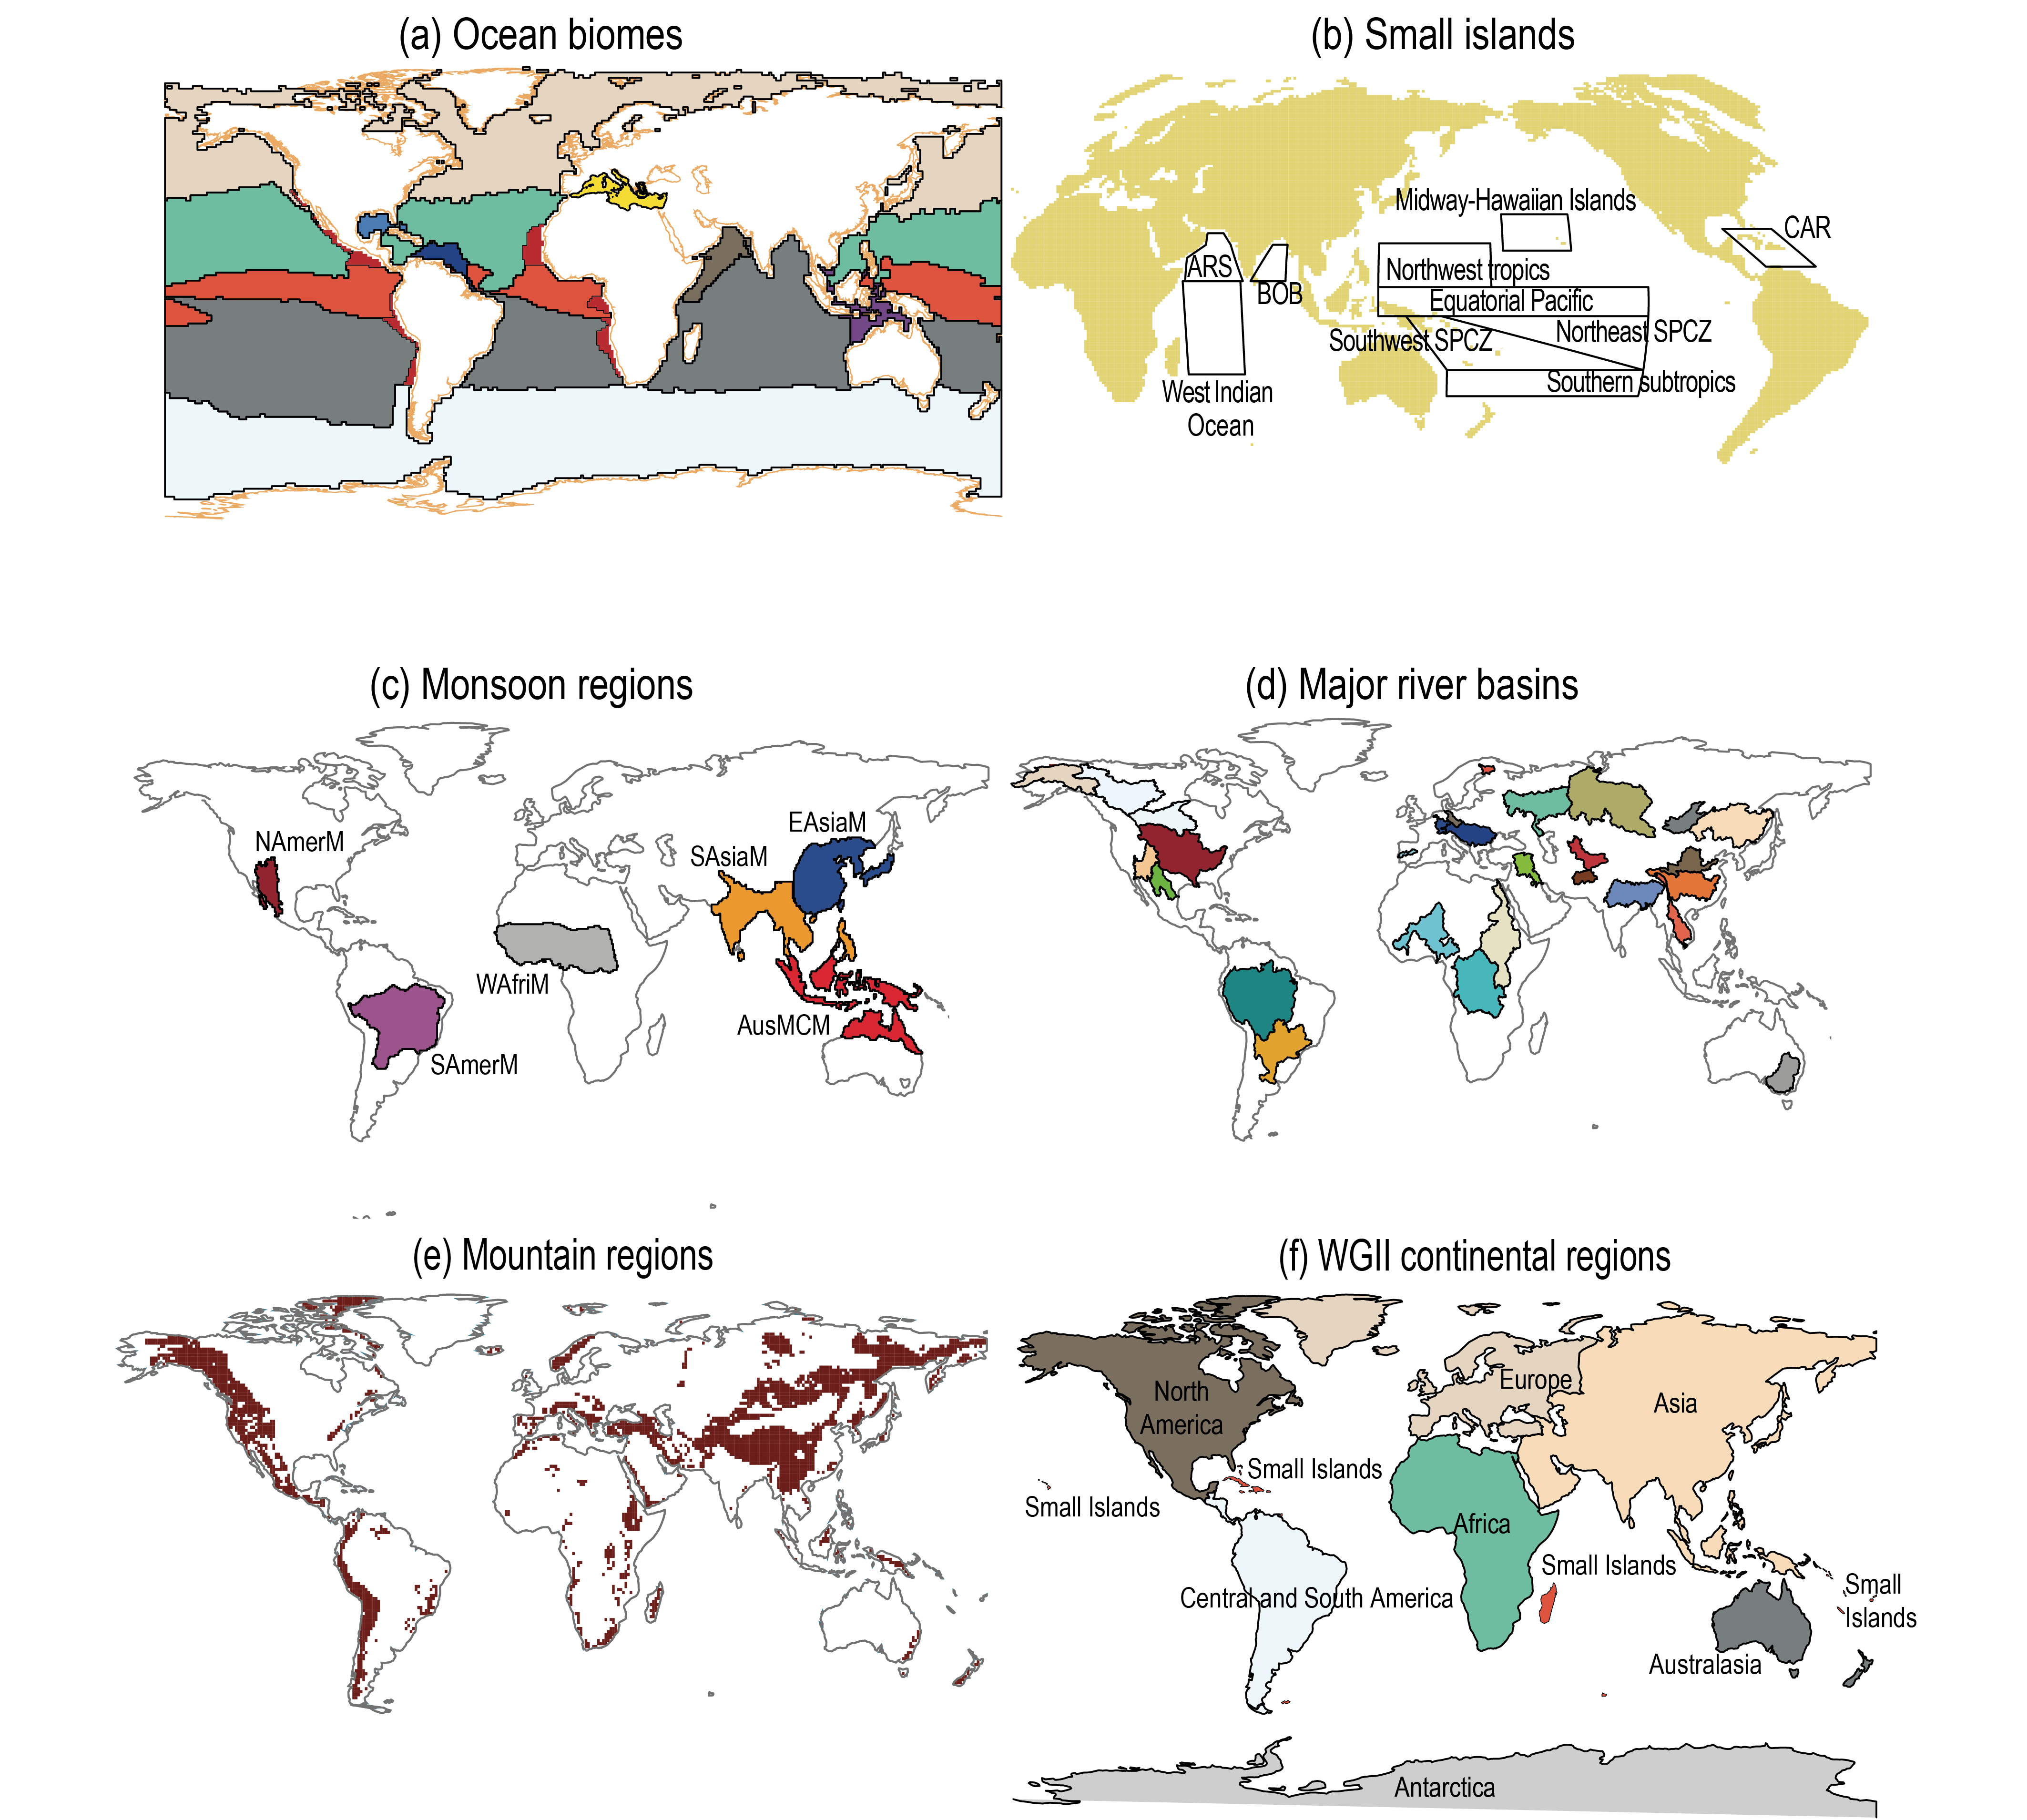
 The AR6 WGI (land and open ocean) reference regions are used in the Interactive Atlas as the default regionalization for atmospheric variables. However, these regions are not optimum for the analysis of oceanic variables since, for instance, the five upwelling regions (Canary, California, Peru, Benguela and Somali) are mostly included in ‘land’ regions. Therefore, the alternative set of oceanic regions defined by their biological activity (Figure Atlas.4) is used in the Interactive Atlas for the regional analysis of oceanic variables (see Fay and McKinley, 2014; Gregor et al., 2019). Due to the many potential definitions of the regions relevant for WGI and WGII, some additional typological and socio-economic regions have also been included in the Interactive Atlas.
 Figure Atlas.4 | Typological and socio-economic regions used in the Interactive Atlas. (a) Eleven ocean regions defined by their biological activity and used for the regional analysis of oceanic variables; (b) ocean regions for Small Islands, including the Caribbean (CAR) and the north Indian Ocean (ARS and BOB); (c) land monsoon regions of North America, South America, Africa, Asia and Australasia; (d) major river basins; (e) mountain regions; (f) WGII continental regions. These regions can be used alternatively to the reference regions for the regional analysis of climatic variables in the Interactive Atlas. The definition of the regions and companion notebooks and scripts are available at the Atlas repository (Iturbide et al., 2021).
 Atlas.1.3.4 Typological and Socio-economic Regions
In addition to contiguous spatial domains discussed in the previous section, some domains are defined by specific climatological, geographical, ecological or socio-economic properties where climate is an important determinant or influencer. In these cases the domains are subject to particular physical processes that are important for its climatology or that involve systems affected by the climate in a way that observations and climate model simulations can be used to understand. Many of these are the basis of the chapters and cross-chapter papers of the AR6 WGII report, namely river basins, biodiversity hotspots, tropical forests, cities, coastal settlements, deserts and semi-arid areas, the Mediterranean, mountains and polar regions. It is therefore important to generate climate information relevant to these typological domains and some examples of these used in the Interactive Atlas are shown in Figure Atlas.4.
Atlas.1.4 Combining Multiple Sources of Information for Regions
This section introduces the observational data sources and reanalyses that are used in the assessment of regional climate change and for evaluating and bias adjusting the results of models (more information on observational reference datasets is available in Annex I). It also introduces the different global and regional climate model outputs that are used for regional climate assessment considering both historical and future climate projections (Annex II). Many of these models are run as part of coordinated Model Intercomparison Projects (MIPs), including CMIP5, CMIP6 and CORDEX, described below. Combining information from these multiple data sources is a significant challenge (see Section 10.5 for an in-depth treatment of the problem) though if they can be used to generate robust information on regional climate change it can guide policy and support decisions responding to these changes. An important and necessary part of this process is to check for consistency amongst the data sources.
Atlas.1.4.1 Observations
There are various sources of observational information available for global and regional analysis. Observational uncertainty is a key factor when assessing and attributing historical trends, so assessment should build on integrated analyses from different datasets (disparity, inadequacy and contradictions in existing datasets are assessed in Section 10.2). The Atlas chapter can supplement and complement Chapter 10 by providing the opportunity to visualize and expand on its assessment. This includes displaying maps of density of stations’ observations (including those that are used in the different datasets) and assessing observational uncertainty by using multiple datasets.
Two of the most commonly used variables in climate studies are gridded surface air temperature and precipitation. There are many datasets available (Annex I) and Chapter 2 provides an assessment of key global datasets, including blended land-air and sea surface temperature datasets to assess global mean surface temperature (GMST). The Atlas separately analyses atmospheric and oceanic variables, and for the former a number of common global datasets supporting the assessment done in other chapters is used, including those selected in Chapter 2, but considering land-only information for the blended products. In particular, for air temperature the Atlas uses CRUTEM5 – the land component of the HadCRUT5 dataset – (Osborn et al., 2021), Berkeley Earth (Rohde and Hausfather, 2020) and the Climatic Research Unit CRU TS4 (version 4.04 used here; Harris et al., 2020). For precipitation the Atlas includes CRU TS4, the Global Precipitation Climatology Centre (GPCC, v2018 used here; Schneider et al., 2011), and Global Precipitation Climatology Project (GPCP; monthly version 2.3 used here; Adler et al., 2018). Although the ultimate source of these datasets is surface-station reported values (GPCP also includes satellite information), each has access to different numbers of stations and lengths of records and employs different ways of creating the gridded product and ensuring quality control. For oceanic variables, the most widely used sea surface temperature (SST) datasets are HadSST4 (Kennedy et al., 2019), which is the oceanic component of the HadCRUT5 dataset, ERSST (B. Huang et al., 2017 ), and KaplanSST (Kaplan et al., 1998).
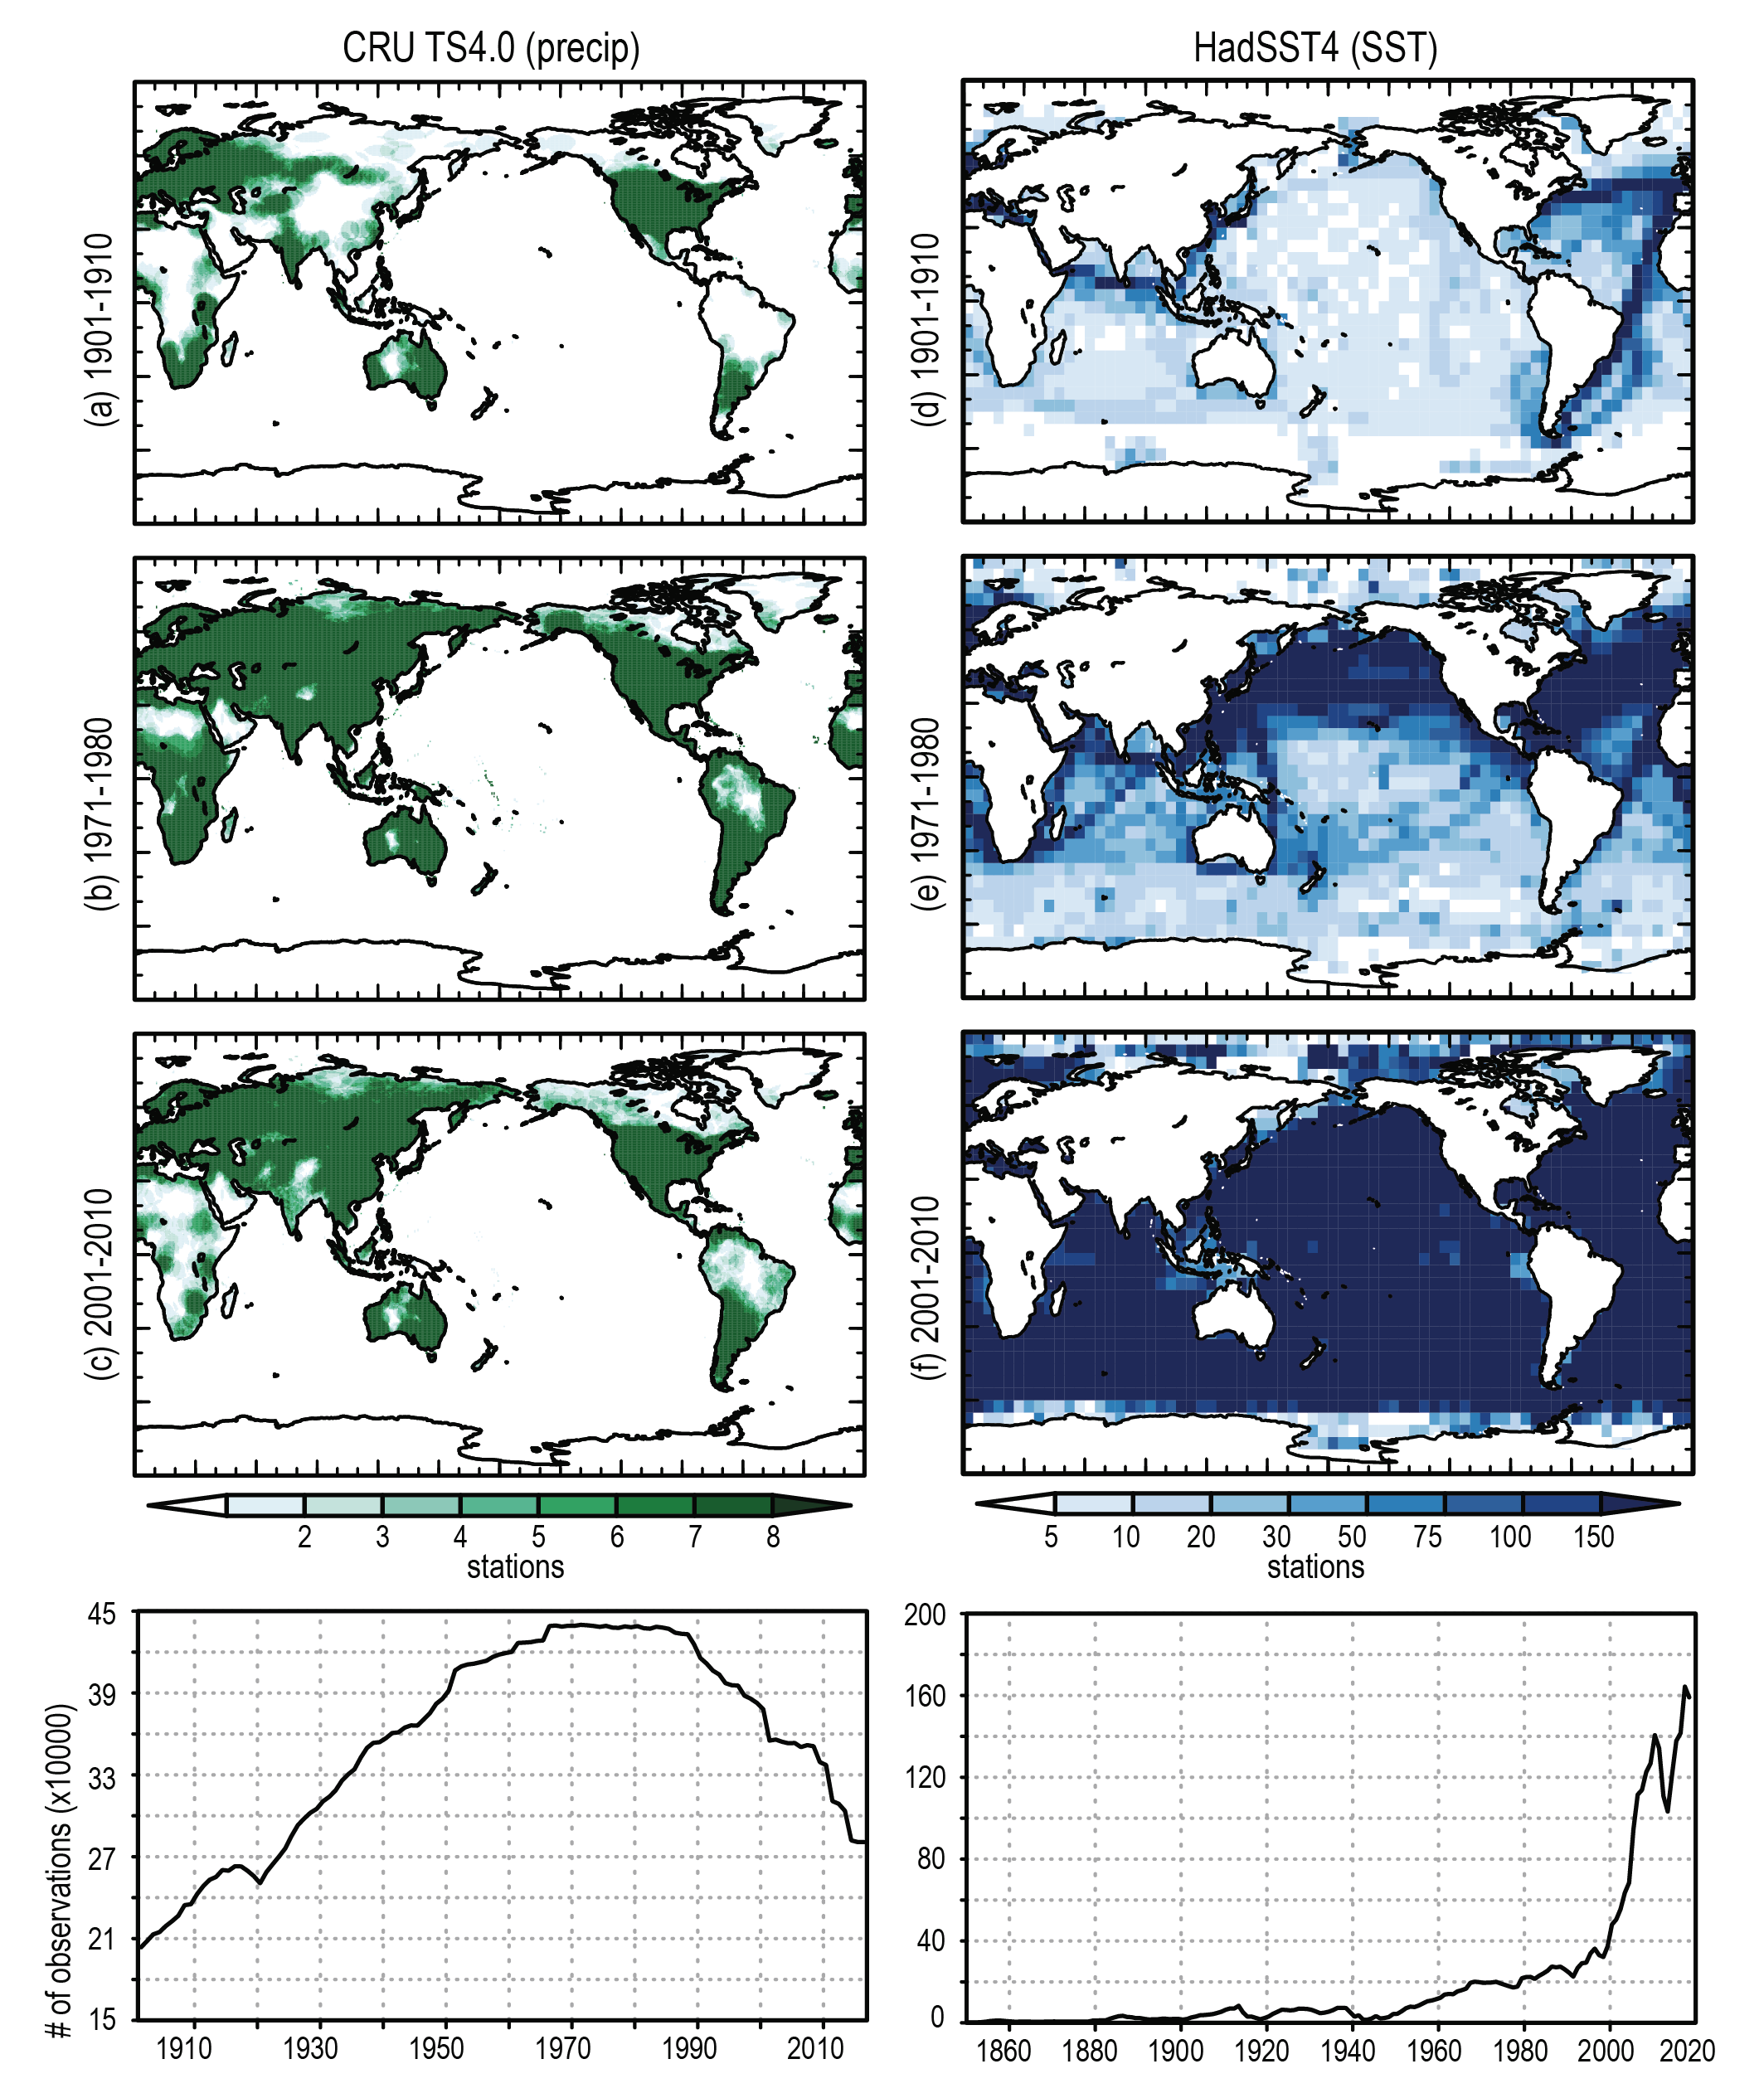
Figure Atlas.5 shows the spatial coverage of the total number of observation stations for different periods (1901–1910, 1971–1980, and 2001–2010) for two illustrative datasets: the CRU TS4 dataset for precipitation and the SST data in HadSST4. The former illustrates spatially the declining trend of station observation data used in the precipitation datasets for certain regions (South America and Africa) after the 1990s. This demonstrates the regional inhomogeneity and temporal change in station density, which is in part a consequence of many stations not reporting to the WMO networks and their data being held domestically or regionally. During early years (before 1950) a limited number of observations are available. This information is used in the Interactive Atlas to blank out regions not constrained with observations in those datasets providing station density information.
 Figure Atlas.5 | Number of stations per 0.5° × 0.5° gridcell reported over the periods of 1901–1910, 1971–1980, and 2001–2010 (rows 1–3), and the global total number of stations reported over the entire globe (bottom row) for precipitation in the CRU TS4 dataset (left) and the HadSST4 dataset (right). Further details on data sources and processing are available in the chapter data table (Table Atlas.SM.15).
 In addition to surface observations, satellites have been widely used to produce rainfall estimates. The advantage of satellite-based rainfall products is their global coverage including remote areas but there is significant uncertainty in these products over complex terrain (Rahmawati and Lubczynski, 2018; Satgé et al., 2019). Another recent development has been on gridded datasets for climate extremes based on surface stations, such as HadEX3 (Dunn et al., 2020), as described in Section 11.2.2.
There are some studies assessing observational datasets globally (Beck et al., 2017; Q. Sun et al., 2018 ) and regionally (Manzanas et al., 2014; Salio et al., 2015; Prakash, 2019), reporting large differences among them and stressing the importance of considering observational uncertainty in regional climate assessment studies. Uncertainty in observations is also a key limitation for the evaluation of climate models, particularly over regions with low station density (Kalognomou et al., 2013; Kotlarski et al., 2019). More detailed information on these issues is provided in Section 10.2.
For regional studies, observational datasets with global coverage are complemented by a range of regional observational analyses and gridded products, such as E-OBS (Cornes et al., 2018) over Europe, Daymet (Thornton et al., 2016) over North America, or APHRODITE (Yatagai et al., 2012) over Asia. These are highlighted in various other chapters and the Atlas expands on their treatment, complementing discussions on discrepancies/conflicts in observations presented in Chapter 10 and expanding on and replicating their results for other regions. In particular, the Interactive Atlas includes the global and regional observational products described here to assess observational uncertainty over the different regions analysed.
Atlas.1.4.2 Reanalysis
There are currently many atmospheric reanalysis datasets with different spatial resolution and assimilation algorithms (see Annex I and Section 1.5.2). There are also substantial differences among these datasets due to the types of observations assimilated into the reanalyses, the assimilation techniques that are used, and the resolution of the outputs, amongst other reasons. For example, 20CR (Slivinski et al., 2019) only assimilates surface pressure and sea surface temperature (SST) to achieve the longest record but at relatively low resolution, while ERA-20C (Poli et al., 2016) only assimilates surface pressure and surface marine winds. At the other extreme, very sophisticated assimilation systems using multiple surface, upper air and Earth observation data sources are employed, for example ERA5 (Hersbach et al., 2020) and JRA-55 (Harada et al., 2016), which also have much higher resolutions. Most reanalysis datasets cover the entire globe, but there are also high-resolution regional reanalysis datasets which provide further regional detail (Kaiser-Weiss et al., 2019).
The Atlas and Interactive Atlas use information from ERA5 and from the bias-adjusted version WFDE5 (Cucchi et al., 2020) which is combined with ERA5 information over the ocean and used as the Inter-Sectoral Impact Model Intercomparison Project (ISIMIP) observational reference dataset W5E5 (Lange, 2019b). This reference is also used in the Atlas for model evaluation (Atlas.1.4.4) and for bias-adjusting model outputs (Atlas.1.4.5).
Atlas.1.4.3 Global Model Data (CMIP5 and CMIP6)
The Atlaschapter (and the Interactive Atlas) uses global model simulations from both CMIP5 and CMIP6, mainly historical and future projections performed under ScenarioMIP (O’Neill et al., 2016). This facilitates backwards comparability and thus the detection of new salient features and findings from recent science and the latest CMIP6 ensemble. The selection of the models is based on availability of scenario data for the variables assessed in the Atlas chapter and for those included in the Interactive Atlas (Atlas.2.2). In particular, in order to harmonize the results obtained from the different scenarios as much as possible, only models providing data for the historical scenario and at least two emissions scenarios, RCP2.6, RCP4.5 and/or RCP8.5 (for CMIP5), and SSP1-2.6, SSP2-4.5, SSP3-7.0 and/or SSP5-8.5 (for CMIP6), were chosen, resulting in 29 and 35 models, respectively (see Cross-Chapter Box 1.4 for a description of the scenarios). In the Atlas chapter (similarly to the regional Chapters 11 and 12) a single simulation is taken from each model (see Atlas.12 for limitations of this choice). Since the RCP and SSP emissions scenarios are not directly comparable due to different regional forcing (Section 4.2.2), the Atlas includes GWLs as an alternative dimension of analysis (Cross-Chapter Box 11.1), which allows intercomparison of results from different scenarios as an alternative to the standard analysis based on time slices for particular scenarios (Atlas.1.3.1). This dimension allows for enhanced comparability of CMIP5 and CMIP6, since it constrains the regional patterns to the same global warming level for both datasets.
Building on this information, the Interactive Atlas displays a number of (mean and extreme) indices and climatic impact-drivers (CIDs), considering both atmospheric and oceanic variables (Atlas.2.2). Some of these indices have been selected in coordination with Chapters 11 and 12, in order to support and extend the assessment performed in these chapters (see Annex VI for details on the indices). In order to harmonize this information, the indices have been computed for each individual model on the original model grids and the results have been interpolated to a common 2° (for CMIP5) and 1° (CMIP6) horizontal resolution grids. In addition, for the sake of comparability with CMIP6 results (in particular when using baselines going beyond 2005), the historical period of the CMIP5 and CORDEX datasets has been extended to 2006–2014 using the first years of RCP8.5-driven transient projections (Atlas.1.3.1). Tables listing the CMIP5 and CMIP6 models used in the Atlas and in the Interactive Atlas for different scenarios and variables are included as Supplementary Material (Tables Atlas.SM.1 and Atlas.SM.2, respectively); moreover, full inventories including details on the specific Earth System Grid Federation (ESGF) versions are given in the Atlas GitHub repository (Iturbide et al., 2021).
Chapter 3 and Flato et al. (2013) describe the evaluation of CMIP6 and CMIP5 models, respectively, assessing surface variables and large-scale indicators. Section 10.3.3 assesses the general capability of GCMs to produce climate output for regions.
Information from the existing CMIP5 and CMIP6 datasets is supplemented with downscaled regional climate simulations from CORDEX. This facilitates an assessment of the effects from higher resolution, including whether this modifies the projected climate change signals compared to global models and adds any value, especially in terms of high-resolution features and extremes.
Atlas.1.4.4 Regional Model Data (CORDEX)
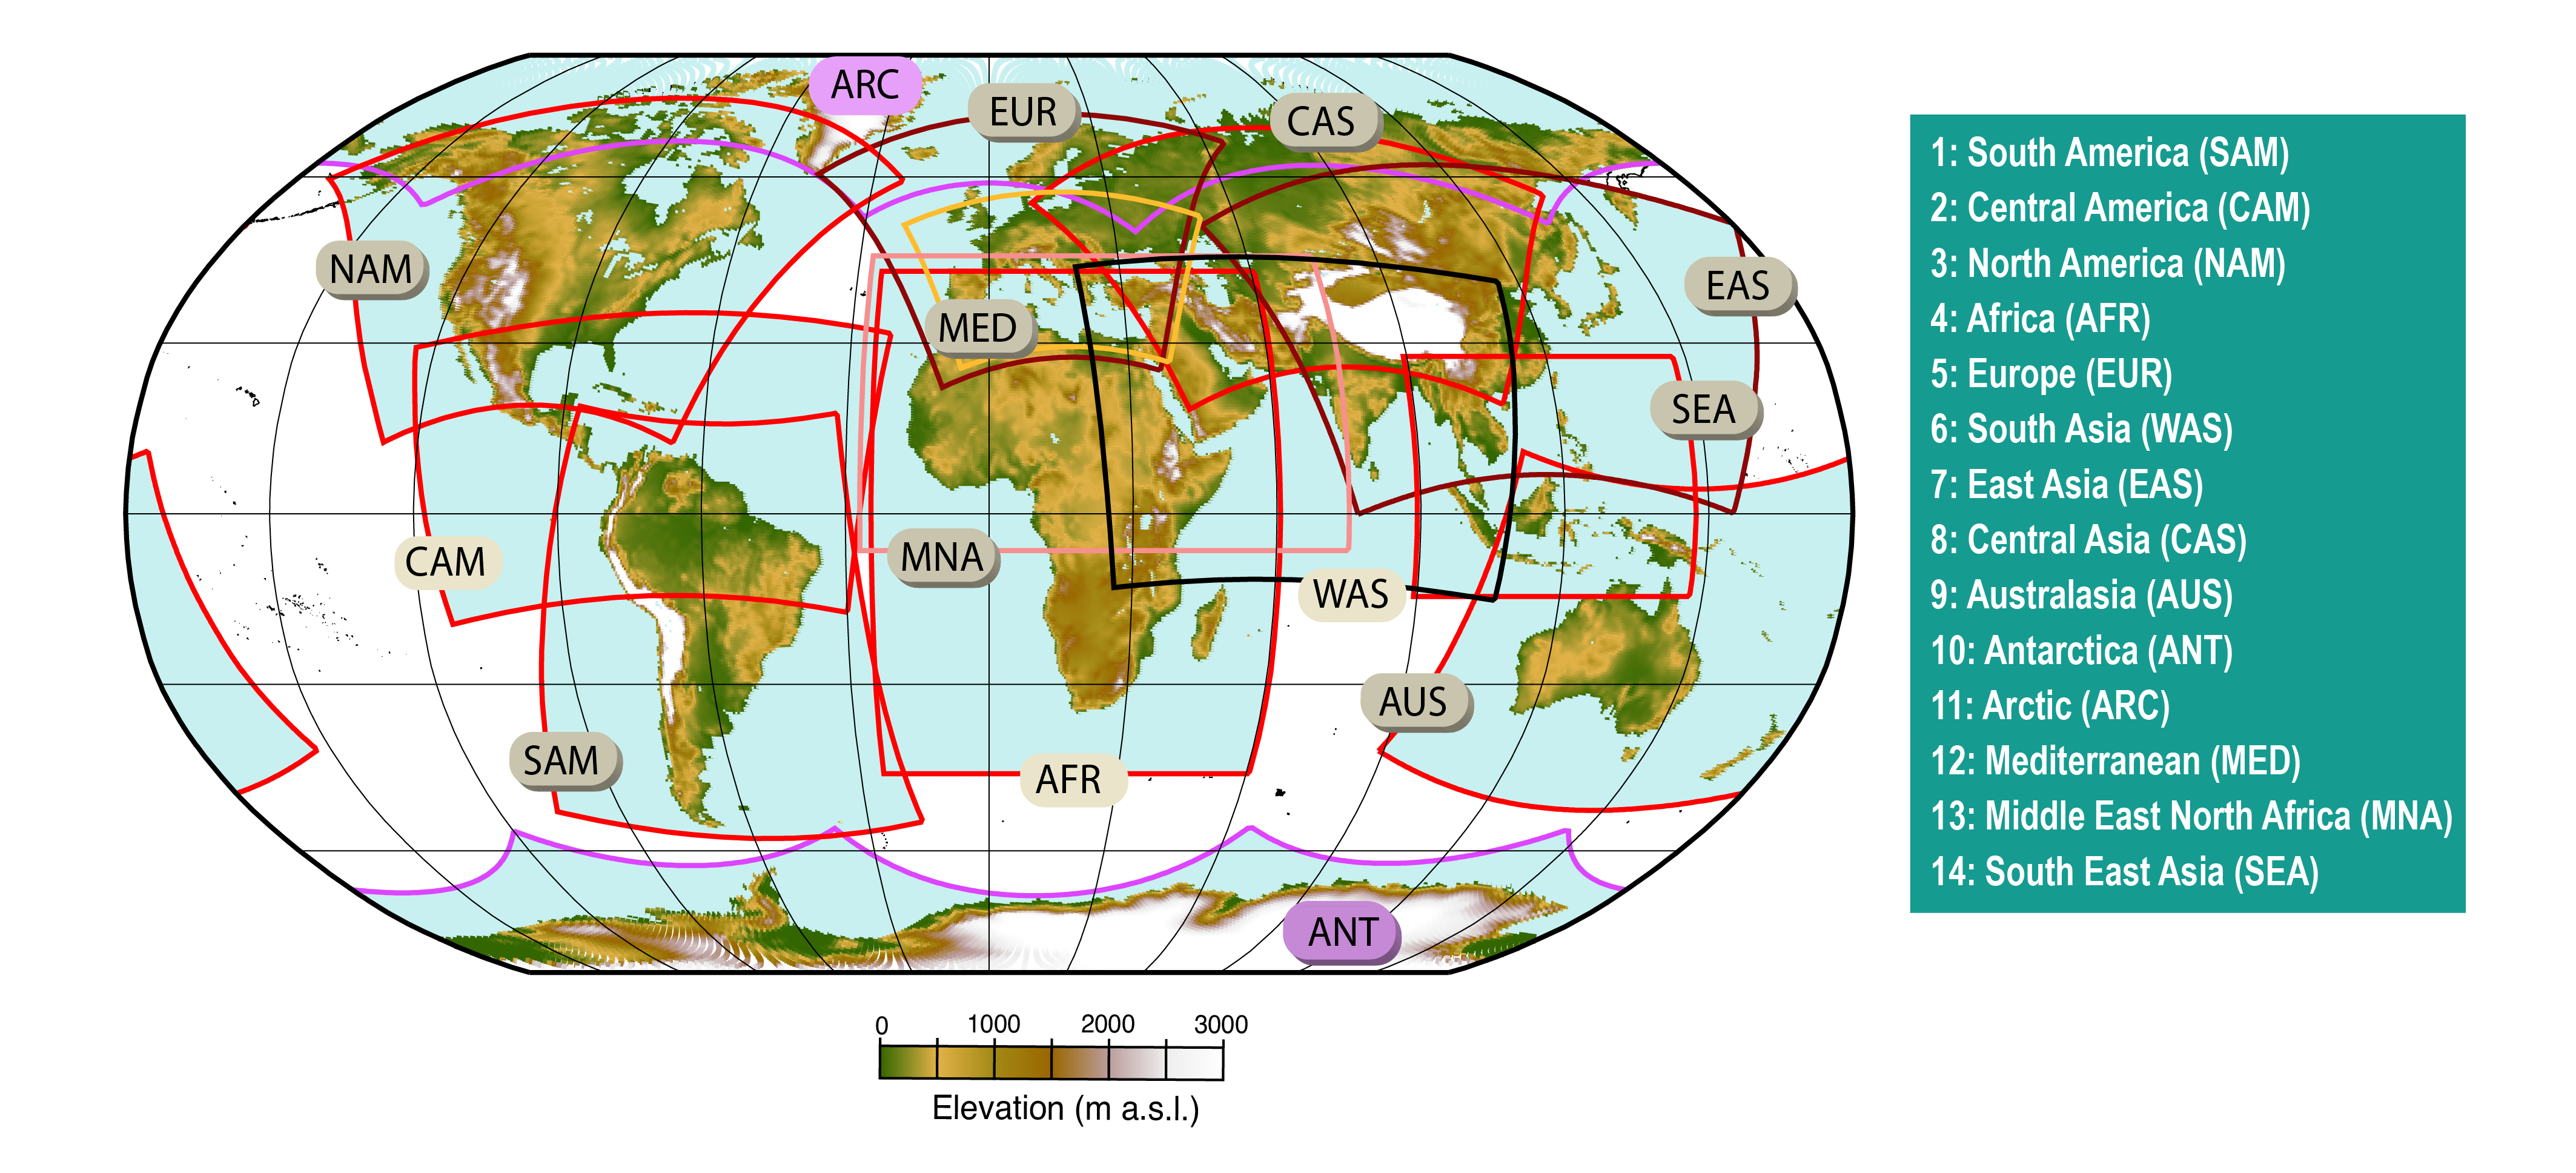
Global model data,as generated by the CMIP ensembles, although available globally, have spatial resolutions that are limited for reproducing certain processes and phenomena relevant for regional analysis (around 2° and 1° for CMIP5 and CMIP6, respectively). The Coordinated Regional Climate Downscaling Experiment (CORDEX; Gutowski Jr. et al., 2016) facilitates worldwide application of Regional Climate Models (RCMs, see Section 10.3.1.2), focusing on a number of regions (Figure Atlas.6) with a typical resolution of 0.44° (but also at 0.22° and 0.11° over some domains, such as Europe). However, only a few simulations are available for some domains (Annex II, Table AII.1), thus limiting the level of analysis and assessment that can be performed using CORDEX data in some regions. Moreover, there are regions where several domains overlap, thus providing additional lines of evidence. The use of multi-domain grand ensembles to work globally with CORDEX data have recently been proposed (Legasa et al., 2020; Spinoni et al., 2020). Ongoing efforts, such as the multi-domain CORDEX-CORE simulations are promoting more homogeneous coverage and thus more systematic treatment of CORDEX domains (Box Atlas.1).
 Figure Atlas.6 | CORDEX domains showing the curvilinear domainboundaries resulting from the original rotated domains. The topography corresponding to the standard CORDEX 0.44° resolution is shown to illustrate the orographic gradients over the different regions.
 A lot of progress has been made by the regional climate modelling community since AR5 (Table AII.1) to produce and make available evaluation (reanalysis-driven) simulations over the different CORDEX domains along with downscaled CMIP5 historical and future climate projection information under a range of emissions scenarios, mainly RCP2.6, RCP4.5 and RCP8.5 (Tables AII.3 and AII.4). However, these ensembles cover only a fraction of the uncertainty range spanned by the full CMIP5 ensemble in the different domains (e.g., Figures Atlas.16, Atlas.17, Atlas.21, Atlas.22, Atlas.24, Atlas.26, Atlas.28 and Atlas.29; Ito et al., 2020b). Therefore, comparison of CMIP5 and CORDEX results should be performed carefully, providing results not only for the full CMIP5 ensemble but also for the sub-ensemble formed by the driving models since results can diverge (Fernández et al., 2019; Iles et al., 2020).
The Atlas chapter and the Interactive Atlas use CORDEX information for the following 11 individual CORDEX domains (out of the 14 domains shown in Figure Atlas.6): North, Central and South America; Europe; Africa; South, East and South East Asia; Australasia; Arctic and Antarctica; in addition, oceanic information has been used from the Mediterranean domain, which provides simulations from coupled atmosphere–ocean regional climate models (RCMs). In order to harmonize the information across domains and to maximize the size of the resulting ensembles, all the available simulations for each individual CORDEX domain (including the standard 0.44° CORDEX and the 0.22° CORDEX-CORE) have been interpolated to a common regular 0.5°-resolution grid to provide a grand ensemble covering the historical and future emissions scenarios RCP2.6, RCP4.5 and RCP8.5, and also the reanalysis-driven simulations for evaluation purposes. In the case of the European domain, the dataset considered is the 0.11° simulations (CORDEX EUR-11, the same dataset as used in Chapter 12), which has been interpolated to a regular 0.25° resolution grid (the same used for the regional observations). In the case of the Mediterranean domain, oceanic information (sea surface temperature, SST) is interpolated to a regular 0.11° grid. In all cases, the indices are computed on the original grids and the interpolation process is applied to the resulting indices. Moreover, for the sake of comparability with CMIP6 results (in particular when using baseline periods beyond 2005), the historical period of the CORDEX datasets has been extended to 2006–2014 using the first years of RCP8.5-driven transient projections in which the emissions are close to those observed (see Atlas.1.3.1); note that this procedure is also applied to CMIP5 simulations.
For the different CORDEX domains, the full ensembles of models (GCM-RCM matrix) used in the Atlas for the different scenarios and variables are described in the Supplementary Material (Tables Atlas.SM.3–Atlas.SM.14) and in the Atlas repository (Iturbide et al., 2021), including full metadata relative to ESGF versions used and the periods with data available for the different simulations. In particular, the historical scenario information is only available from 1970 onwards for some models and therefore the common period 1970–2005 is used for historical CORDEX data in the Atlas. As a result, the WMO baseline period 1961–1990 is not available in the Interactive Atlas for CORDEX data.
Sections Atlas.4 to Atlas.11 assess research on CORDEX simulations over different regions, analysing past and present climate as well as future climate projections. They also focus on regional model evaluation in order to extend and complement the validation of global models in Chapter 3, considering the specific regional climate and relevant large-scale and regional phenomena, drivers and feedbacks (Section 10.3.3). Besides the literature assessment, some simple evaluation diagnostics have been computed for the simulations used in the Atlas chapter to provide some basic information on model performance across regions. In particular, biases for mean temperature and precipitation have been calculated for the 11 CORDEX domains analysed.
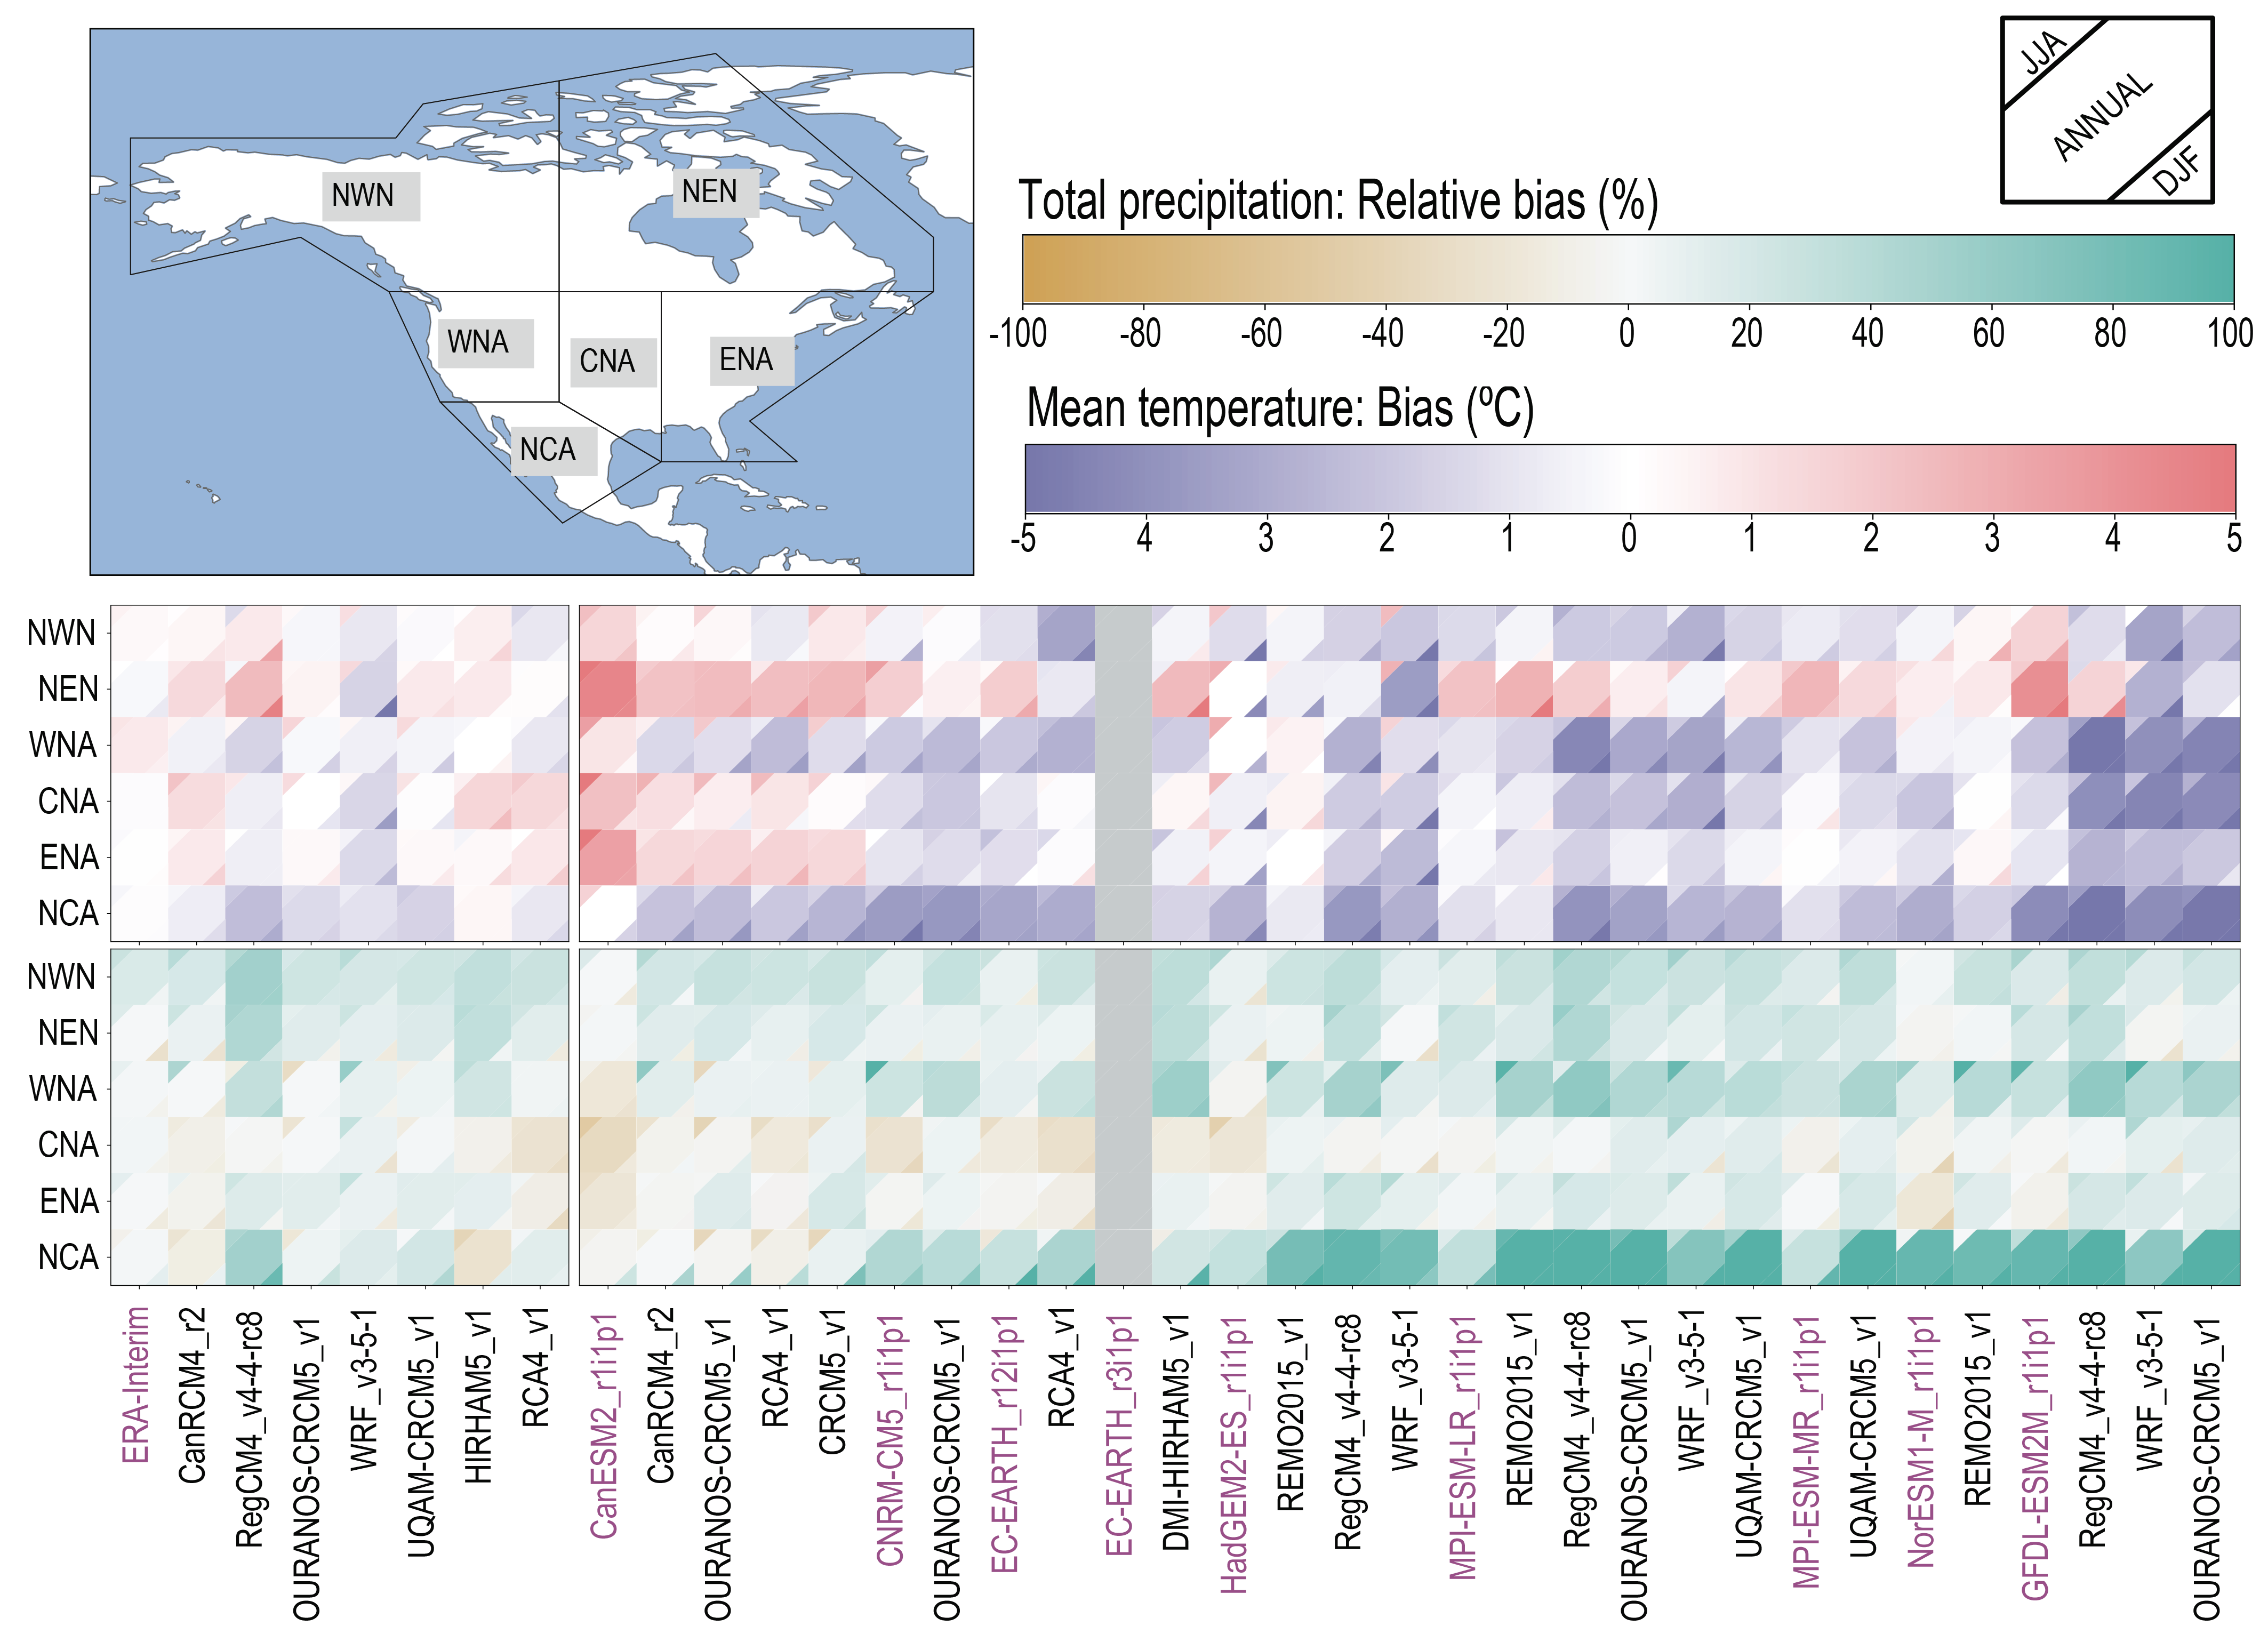
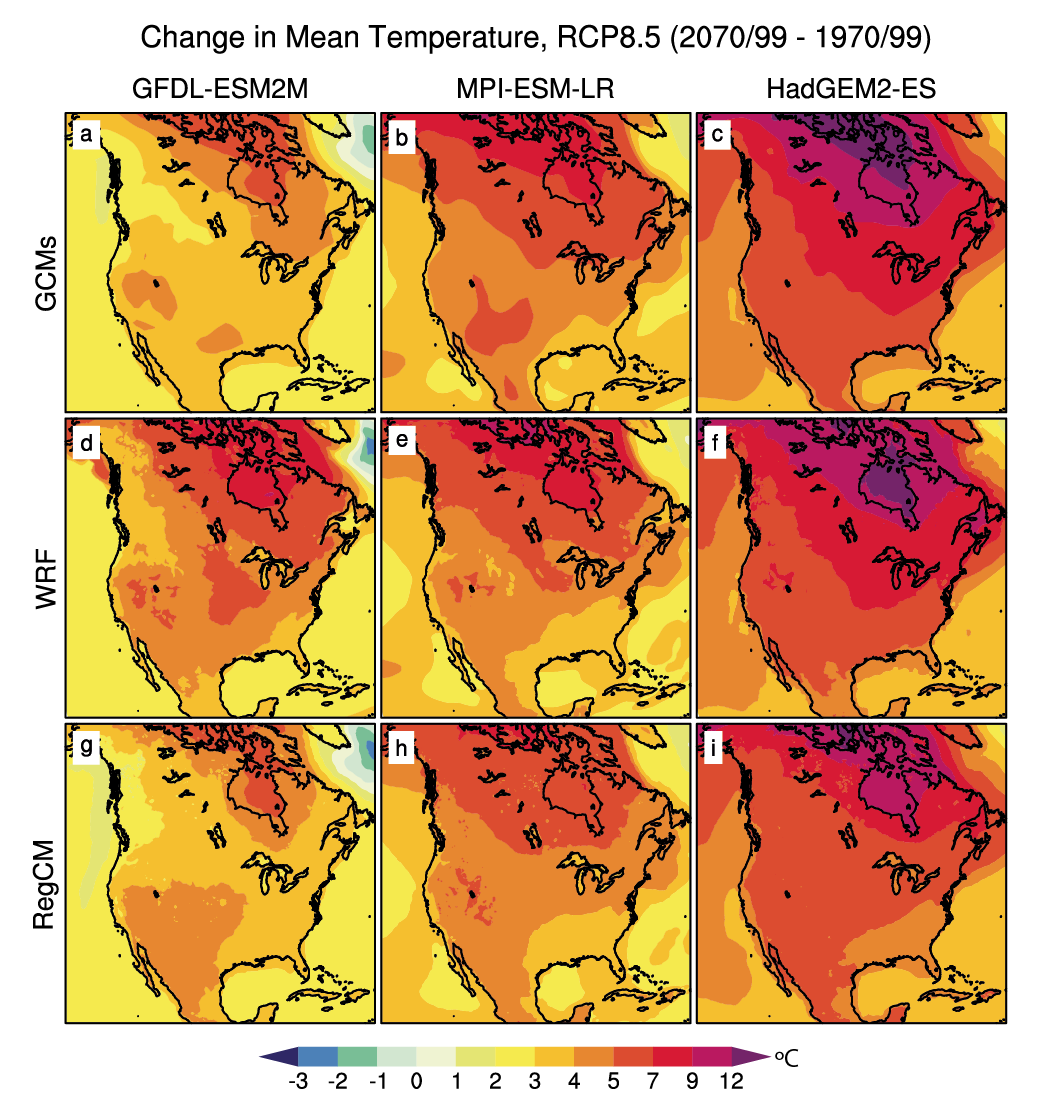
Figure Atlas.7 shows mean temperature and precipitation biases over the North American domain in RCM simulations driven by reanalysis and historical GCM simulations (Section 10.3.2.5). Annual and seasonal (December–January–February (DJF) and June–July–August (JJA)) biases are computed for both the RCMs and driving GCMs. Biases in the reanalysis-driven RCMs result from intrinsic model errors, with the results displayed being spatially aggregated for each reference region. This same analysis is performed for the GCM-driven RCM simulations over the historical period 1986–2005. This allows comparison of the intrinsic bias of the RCMs with the biases resulting when driven by the different GCMs and patterns of behaviour in the RCMs, for example intrinsic warm and dry biases in ENA and WNA respectively or reduced RCM warm biases compared to the CCCma GCM in NEN and ENA. Similar results for the other CORDEX domains are included as Supplementary Material (Figures Atlas.SM.1–Atlas.SM.10).
 Figure Atlas.7 | Evaluation of annual and seasonal air temperature and precipitation for the six North America sub-regions, NWN, NEN, WNA, CNA, ENA and NCA (land only) for CORDEX-NAM RCM simulations driven by reanalysis or historical GCMs. Seasons are June–July–August (JJA) and December–January–February (DJF). Rows represent sub-regions and columns correspond to the models. Magenta text indicates the driving historical CMIP5 GCMs (including ERA-Interim in the first set of slightly separated columns) and the black text to the right of the magenta text represents the driven RCMs. The colour matrices show the mean spatial biases; all biases have been computed for the period 1985–2005 relative to the observational reference (E5W5, see Atlas.1.4.2). Further details on data sources and processing are available in the chapter data table (Table Atlas.SM.15).
 Atlas.1.4.5 Bias Adjustment
Bias adjustment is often applied to data from climate model simulations to improve their applicability for assessing climate impacts and risk (e.g., in the Inter-Sectoral Impact Model Intercomparison Project, ISIMIP; Rosenzweig et al., 2017). Bias-adjustment approaches (Section 10.3.1.3) are particularly beneficial when threshold-based indices are used, but they can introduce other biases, in particular when applied directly to coarse-resolution GCMs (Cross-Chapter Box 10.2). Bias-adjustment techniques should be chosen carefully for a specific application. In the Atlas, bias adjustment is not applied systematically (in particular, it is not applied for the variables assessed in the Atlas chapter), and only some threshold-dependent extreme indices and climatic impact-drivers (CIDs) included in the Interactive Atlas are bias adjusted (in particular TX35 and TX40 in coordination with Chapter 12). To facilitate integration with WGII, the Atlas uses the same bias-adjustment method as in ISIMIP3 (Lange, 2019a) and the same observational reference (W5E5, see Atlas.1.4.2), upscaled to the same resolution as the model to avoid downscaling artefacts (Cross-Chapter Box 10.2). The ISIMIP3 bias-adjustment method is a trend-preserving approach that is recommended for general applications, as it reduces biases while preserving the original climate change signal (Casanueva et al., 2020). Following the recommendations given in Chapter 10, results in the Interactive Atlas are displayed for both the adjusted and the raw model output.
Box Atlas.1 | CORDEX-CORE
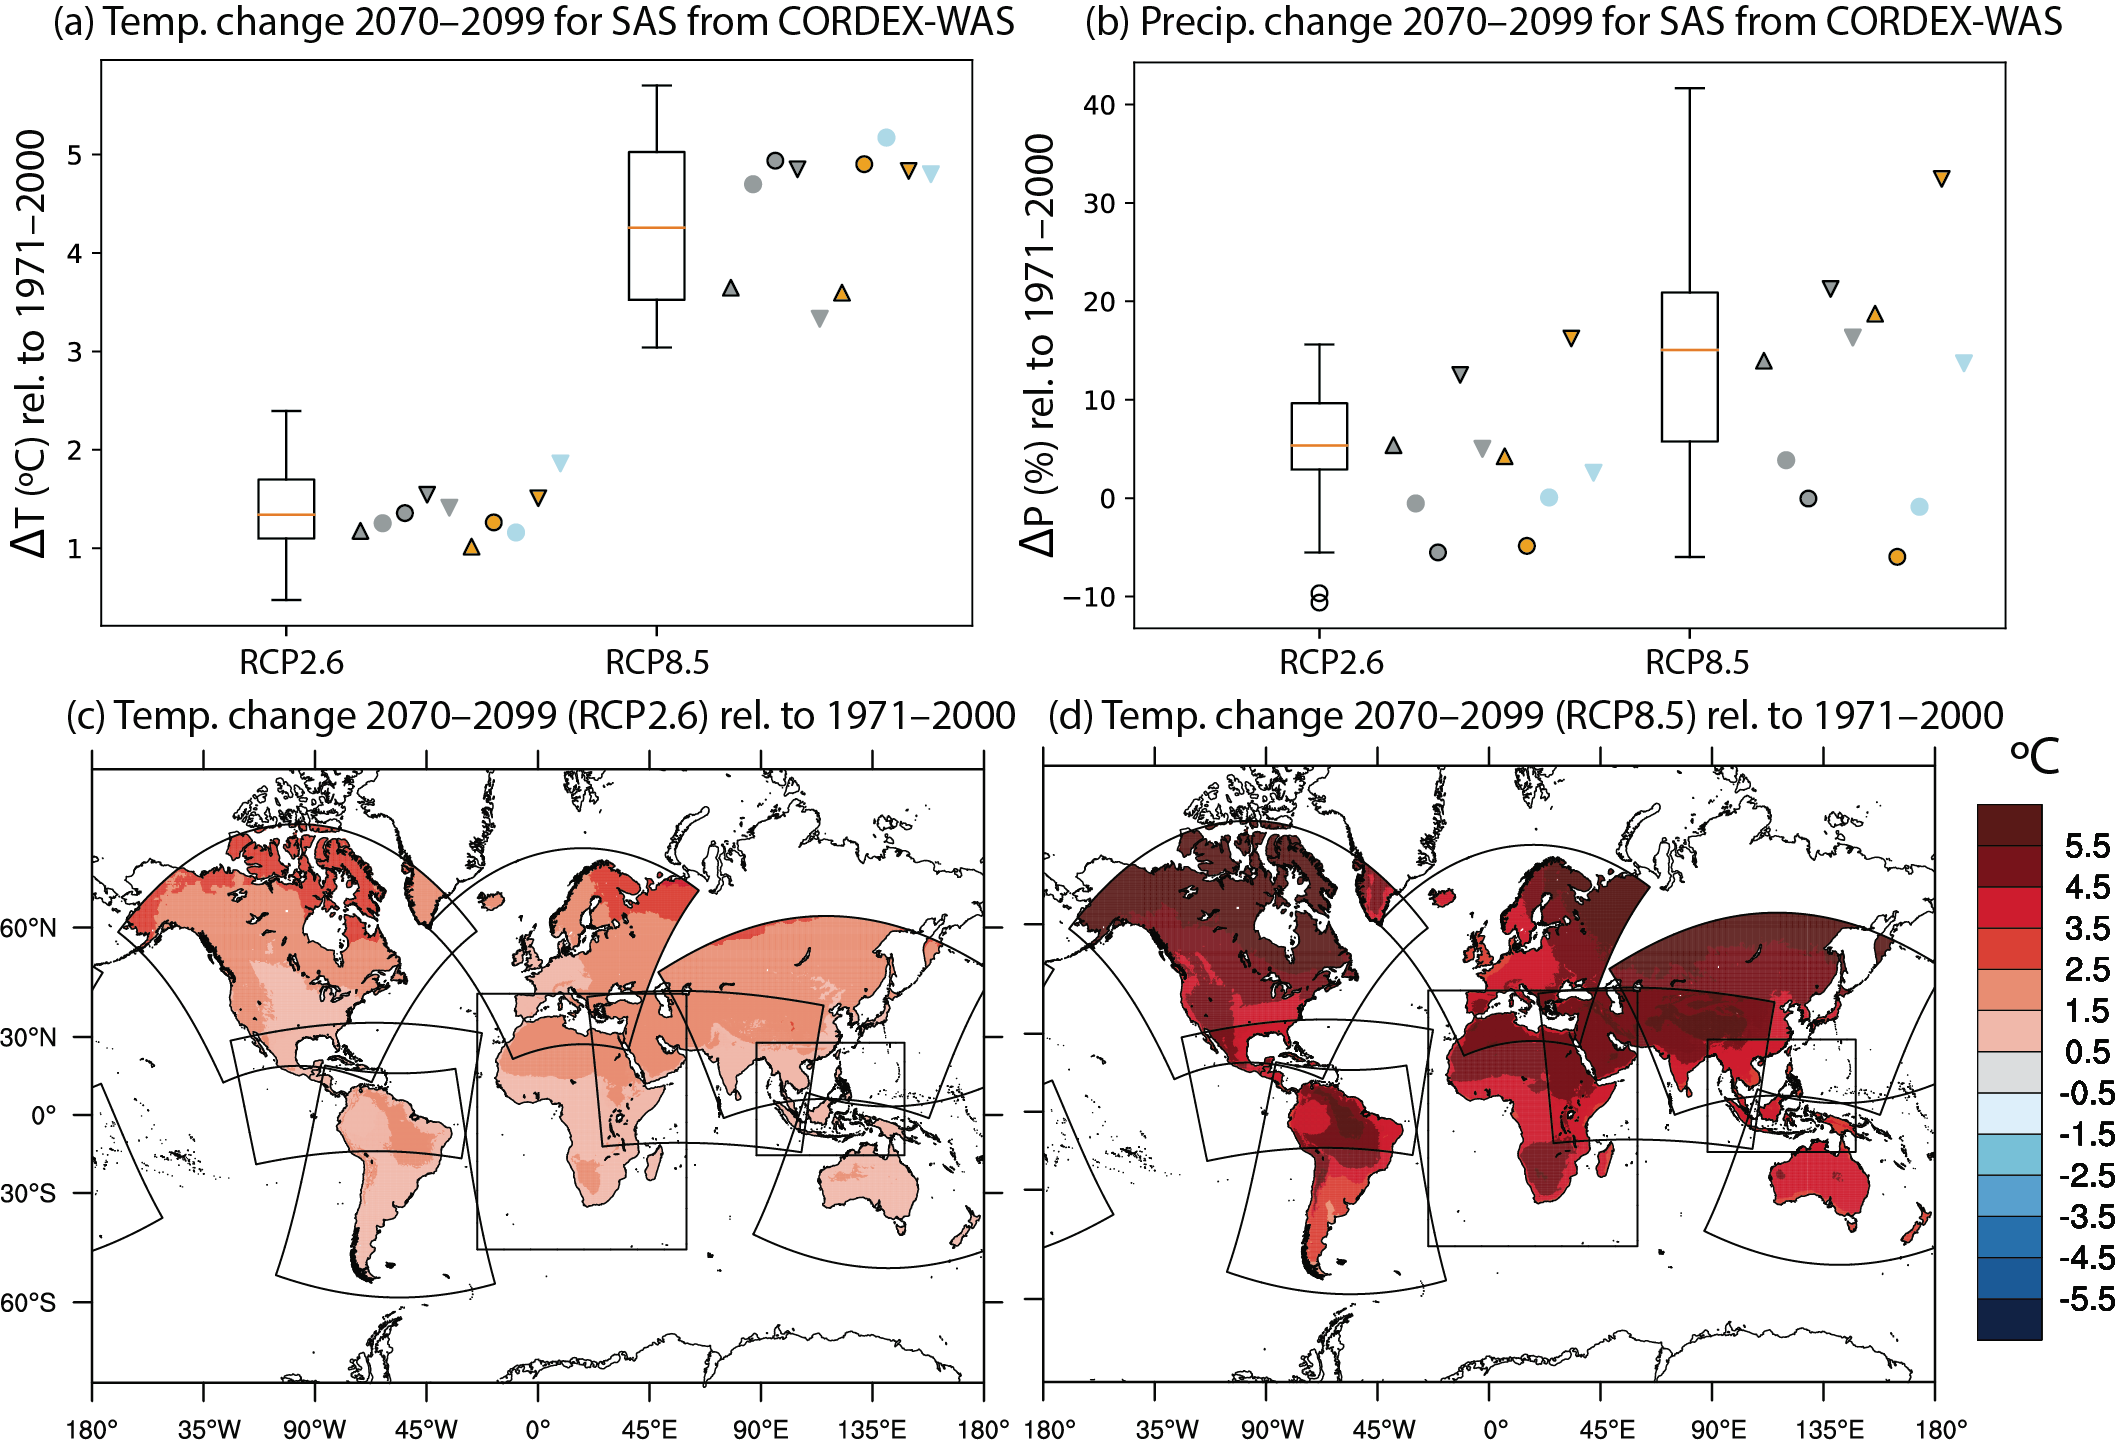
Box Atlas.1, Figure1 | Temperature and precipitation climate change signals at the end of the century (2070–2099). The top panels show climate change signals for (a) temperature and (b) precipitation for the entire CMIP5 ensemble (box-whisker plots) and the CORDEX-CORE driving GCMs (grey symbols) of the respective CORDEX-CORE results (non-grey symbols) in the South Asia (SAS) reference region. The shape of the grey symbols represents the climate sensitivity of the driving GCMs: triangles pointing upwards (low equilibrium), circles (medium equilibrium), triangles pointing downwards (high equilibrium). The corresponding RCM results are drawn using the same symbols, but in orange for REMO and in blue for RegCM. The bottom panels show the warming signal by 2070–2099 over the CORDEX regions for RCP2.6 (c) and RCP8.5 (d) (Figure from Teichmann et al., 2021).
Box Atlas.1
The main objective of CORDEX-CORE is to provide a global homogeneous foundation of high-resolution regional climate model (RCM) projections to improve understanding of local phenomena and facilitate impact and adaptation research worldwide (Gutowski Jr. et al., 2016). The experimental framework is designed to produce homogeneous regional projections for most inhabited land regions using nine CORDEX domains at 0.22° resolution (Figure Atlas.6): North, Central and South America (NAM, CAM, SAM); Europe (EUR); Africa (AFR); East, South and Southeast Asia (EAS, WAS, SEA); and Australasia (AUS). Due to computational requirements, three GCMs were selected to drive the simulations, HADGEM2-ES, MPI-ESM and NorESM, covering, respectively, the spread of high-, medium- and low-equilibrium climate sensitivities from the CMIP5 ensemble at a global scale (with MIROC5, EC-Earth and GFDL-ES2M as secondary GCMs), focusing on two scenarios RCP2.6 and RCP8.5 (see Box Atlas.1, Figure 1). Two RCMs have contributed so far to this initiative (REMO and RegCM4) constituting an initial homogeneous downscaled ensemble to analyse mean climate change signals and hazards (Coppola et al., 2021b; Teichmann et al., 2021), and there are ongoing efforts to extend the CORDEX-CORE ensemble with additional regional simulations (e.g., the COSMO-CLM community) to increase the ensemble size. CORDEX-CORE simulations are distributed as part of the information available for the different CORDEX domains at the Earth System Grid Federation (ESGF).
CORDEX-CORE spans the spread of the CMIP5 climate change signals for interquartile ranges of annual mean temperature and precipitation for most of the reference regions covered (Box Atlas.1, Figure 1; Teichmann et al., 2021). However, it is still a small ensemble and for other variables like extremes or climatic impact-drivers it has only been partially investigated in Coppola et al. (2021b) and needs further analysis.
Cross-Chapter Box Atlas.1 | Displaying Robustness and Uncertainty in Maps
Coordinators: José Manuel Gutiérrez (Spain), Erich Fischer (Switzerland)
Contributors: Alessandro Dosio (Italy), Melissa I. Gomis (France/Switzerland), Richard G. Jones (UK), Maialen Iturbide (Spain), Megan Kirchmeier-Young (Canada/USA), June-Yi Lee (Republic of Korea), Stéphane Sénési (France), Sonia I. Seneviratne (Switzerland), Peter W. Thorne (Ireland/UK), Xuebin Zhang (Canada)
Spatial information on observed and projected future climate changes has always been a key output of IPCC reports. This information is typically represented in the form of maps of historical trends (from observational datasets) and of projected changes for future reference periods and scenarios relative to baseline periods (from multi-model ensembles). These maps usually include information on the robustness or uncertainty of the results such as the significance of trends or the consistency of the change across models. Visualization of this information combines two aspects that are intertwined: the core methodology (measures and thresholds) and its visual implementation. For observed trends, robustness can be simply ascertained by using an appropriate statistical significance test. However, for multi-model mean changes, the consistency across models for the sign of change (model agreement) and the magnitude of change relative to unforced climate variability (signal-to-noise ratio) provide two complementary measures allowing for simple or more comprehensive approaches to represent robustness and uncertainty. While they can be visually represented in various ways with more or less complexity (Retchless and Brewer, 2016), the most common implementation for maps in the climate science community remains the overlay of symbols and/or masking of the primary variable. This Cross-Chapter Box reviews the approaches followed in previous IPCC reports and describes the methods used across this WGI report, presenting the rationale and discussing its relative merits and limitations.
The objectives in AR6 for representing robustness and uncertainty in maps are: 1) adopting a method that can be as coherent as possible across the different global/regional chapters while accommodating different needs, 2) being visually consistent across WGs, and 3) making the different layers of information on the maps as accessible as possible for the reader. As a result, a single approach is selected for observations and two alternative approaches (simple and advanced) are adopted for projected future changes. It is important to highlight that, as in previous reports, these approaches are implemented in maps at a grid-box level and, therefore, are not informative for larger spatial scales (e.g., over AR6 reference regions) where the aggregated signals are less affected by small-scale variability leading to an increase in robustness. This is particularly relevant for the AR6 regional assessments and approaches (e.g., for trend detection and attribution; Cross-Chapter Box 1.4, Section 11.2.4) which are performed for climatological regions and not at grid-box scale (Chapters 11 and 12, and Atlas). Both small and large scales are relevant (e.g., adaptation occurs at smaller scales but also at the level of countries, which are typically larger than a few grid boxes). They are both addressed in the Interactive Atlas, which implements the above approaches for representing robustness in maps at the grid-box level, but also enables the analysis of region-wide signals (e.g., AR6 WGI reference regions, monsoon regions, etc.), helping to isolate background changes happening at larger scales (Atlas.2.2).
Approaches used in previous reports
Recent IPCC reports adopted different approaches for mapping uncertainty/robustness, including their calculation method and/or their visual implementation. In AR5 WGI ‘+’ symbols were used to represent significant trends in observations at grid-box level. For future projections, different methods for mapping robustness were assessed (AR5 Box 12.1, Collins et al., 2013), while proposing as a reference an approach based on relating the multi-model mean climate change signal to internal variability, calculated as the standard deviation of non-overlapping 20-year means in the pre-industrial control runs. Regions where the multi-model mean change exceeded two standard deviations of the internal variability and where at least 90% of the models agreed on the sign of change were stippled (as an indication of a robust signal). Regions where the multi-model change was less than one standard deviation were hatched (small multi-model mean signal). However, this category did not distinguish areas with consistent small changes from areas of significant but opposing/divergent signals. In addition, the unstippled/unhatched areas were left undefined, since the categories were not mutually exclusive.
The AR5 WGII (Hewitson et al., 2014) used hatching to represent non-significant trends in observations. For future projections, an elaborated approach with four mutually exclusive and exhaustive categories was proposed (to avoid some of the limitations of the AR5 WGI approach): very strong agreement (same as in WGI); strong agreement; divergent change; and little or no change. These depended on the percentage of models showing change greater than the baseline variability and/or agreeing on sign of change (using a 66% agreement threshold). Leaving the robust regions uncovered minimized any interference with the perception of underlying colours that encoded the primary information of the figure.
The two special reports IPCC SR1.5 (Hoegh-Guldberg et al., 2018) and SROCC (IPCC, 2019a, c) adopted a simplified approach, using only model agreement (≥66% of models agree on sign of change) to characterize robustness. However, cross-hatching was used in SR1.5 to highlight robust areas where models agree, whereas the SROCC used hatching/shading to represent regions where models disagree. Similarly, stippling was used in SR1.5 to indicate regions with significant trends, whereas it was used in SROCC to represent regions where the trends were not significant.
Recent methodologies
Since AR5 there has been a growing interest for disentangling small consistent climate change signals from significant divergent opposite changes resulting in conflicting information (Tebaldi et al., 2011), and different statistical tests have been applied to assess the significance of signals working with the individual models forming the ensemble (Dosio and Fischer, 2018; Yang et al., 2018; Morim et al., 2019). Moreover, new approaches have been proposed to identify large changes of opposite sign that compensate in the mean (Zappa et al., 2021). Recent literature has also highlighted the respective risksof Type I vs Type II errors, which can be associated with the determination of robustness in analysed signals (Lloyd and Oreskes, 2018; Knutson et al., 2019). Type I errors are identifying signals when there are none, while Type II errors are concluding there is no signal when there is one. In the case of grid-box level analysis, the focus on small-scale features with inherently large signal-to-noise ratio may emphasize noise even though signals are
Cross-Chapter Box Atlas.1
present when aggregated at larger scale (Sections 11.2.4 and 11.2.5). Consequently, changes averaged over regions or a number of grid boxes emerge from internal variability at a lower level of warming than at the grid-box level (e.g., Cross-Chapter Box Atlas.1, Figure 2). Hence, focus on grid-box significance enhances the risk of Type II errors for overlooking signals significant at the level of AR6 regions. The significance of signals is also affected by the interdependence of single simulations considered in a given ensemble, for example when several come from the same modelling group and share parametrizations or model components (Knutti et al., 2013; Maher et al., 2021). The risk of Type II errors increases when a model ensemble includes several related simulations showing no signal.
The AR6 WGI approach
The AR6 WGI adapts the approaches applied in previous IPCC reports into a comprehensive framework based on the two general principles followed by AR5 WGII: 1) not obscuring (with stippling or hatching) the areas where relevant/robust information needs to be highlighted (since stippling and hatching obstruct the visualization of the colours, which can affect the perception/interpretation of the underlying data); 2) using mutually exclusive and exhaustive categories to avoid leaving areas undefined. The three adopted approaches (one for observations and two for model projections) are described in Cross-Chapter Box Atlas.1, Table 1. This framework integrates as much as possible the specificities of each WGI Chapter, proposing in some cases alternative thresholds.
Approach A is intended for observations and consists of two categories, one for areas with significant trends (colour, no overlay) and one for non-significant ones (coloured areas overlaid with ‘x’), typically using a two-sided test for a significance level of 0.1; Chapter 2 and Atlas trends have been calculated using ordinary least squares regression accounting for serial correlation (Santer et al., 2008).
Approach B is the simple alternative for model projections. It consists of two categories, one for model agreement (at least 80% of the models agree on the sign of change; colour, no overlay) and the other one for non-agreement (hatching). It is noted that model agreement is computed using ‘model democracy’ (i.e., without discarding/weighting models), since quantifying and accounting for model interdependence (shared building blocks) still remains challenging (Section 4.2.6). Different thresholds have been used in previous reports and in the literature. In CORDEX studies, 80% has been widely used (Dosio and Fischer, 2018; Kjellström et al., 2018; Nikulin et al., 2018; Yang et al.,2018; Akperov et al., 2019; Rana et al., 2020), partially due to the small ensemble sizes available in some cases; this also helps to reduce the impact of model interdependence in the final results. Although 90% (used in AR5 WGI) provides high confidence on the forced change, it is deemed too stringent for precipitation-like variables and regional assessments and was therefore not included (see Cross-Chapter Box Atlas.1, Figure 1). The 66% threshold, which has been used in previous reports (e.g., SR1.5 and SROCC) and in the literature, is not used to avoid communicating weak confidence. Cross-Chapter Box Atlas.1, Figure 1 illustrates the application of this approach.
Approach C is a more advanced alternative for model projections, extending the AR5 WGI and simplifying the AR5 WGII approaches (fewer categories). It consists of three categories: ‘robust change’, ‘conflicting change’, and ‘no change or no robust change’ (see the details in Cross-Chapter Box Atlas.1, Table 1). The first two categories can be interpreted as areas where the climate change signal likely emerges from internal variability (i.e., it exceeds the variability threshold in ≥66% of the models). The variability threshold is defined as
Cross-Chapter Box Atlas.1, Figure 1 illustrates the application of this method considering the effect of the baseline period (1850–1900 versus 1995–2014) and shows that it provides similar results to related approaches proposed in the literature (Zappa et al., 2021).
The two alternative approaches discussed above allow visualization of differentlevels of detail of information on the projected change and are intended for different communication purposes. Approach B just informs on the consistency of the sign of change independent
of its significance relative to internal variability, whereas approach C puts the projected changes into the context of internal variability and allows the highlighting of areas of conflicting signals. It is important to note that different approaches can be applied to the same variable between different chapters for different communication purposes. For example, in maps showing multi-model mean changes of precipitation, Chapter 4 adopts approach C but Chapter 8 applies approach B.
In terms of visual implementation, the approach follows recommendations resulting from conversations with IPCC national delegations: 1) having a consistent approach across WGs would aid consistency and reduce the risk of confusion; 2) defining ‘hatching’ as ‘diagonal lines’ in the caption would aid accessibility for non-expert audiences; 3) a clear and concise legend that explains what these patterns represent should be included directly in the figure; 4) information about model uncertainty should be overlaid such that it does not detract from the data underneath.
Since stippling is commonly used to represent statistical significance, diagonal lines were chosen to ‘obscure’ the problematic categories in the above approaches; it also facilitates the visualization of uncertainty in the Interactive Atlas when zooming in. To avoid confusion, methods or thresholds that were unrelated to the three approaches hereby presented were visualized with a different pattern (i.e., model improvement between low- and high-resolution simulations in Chapter 3; agreement between observation-based products in Chapter 5; correlation between two variables in Chapter 6).
Cross-Chapter Box Atlas.1, Table1 | Approaches for representing robustness (uncertainty) in maps of observed (approach A) and projected (approaches B and C) climate changes.
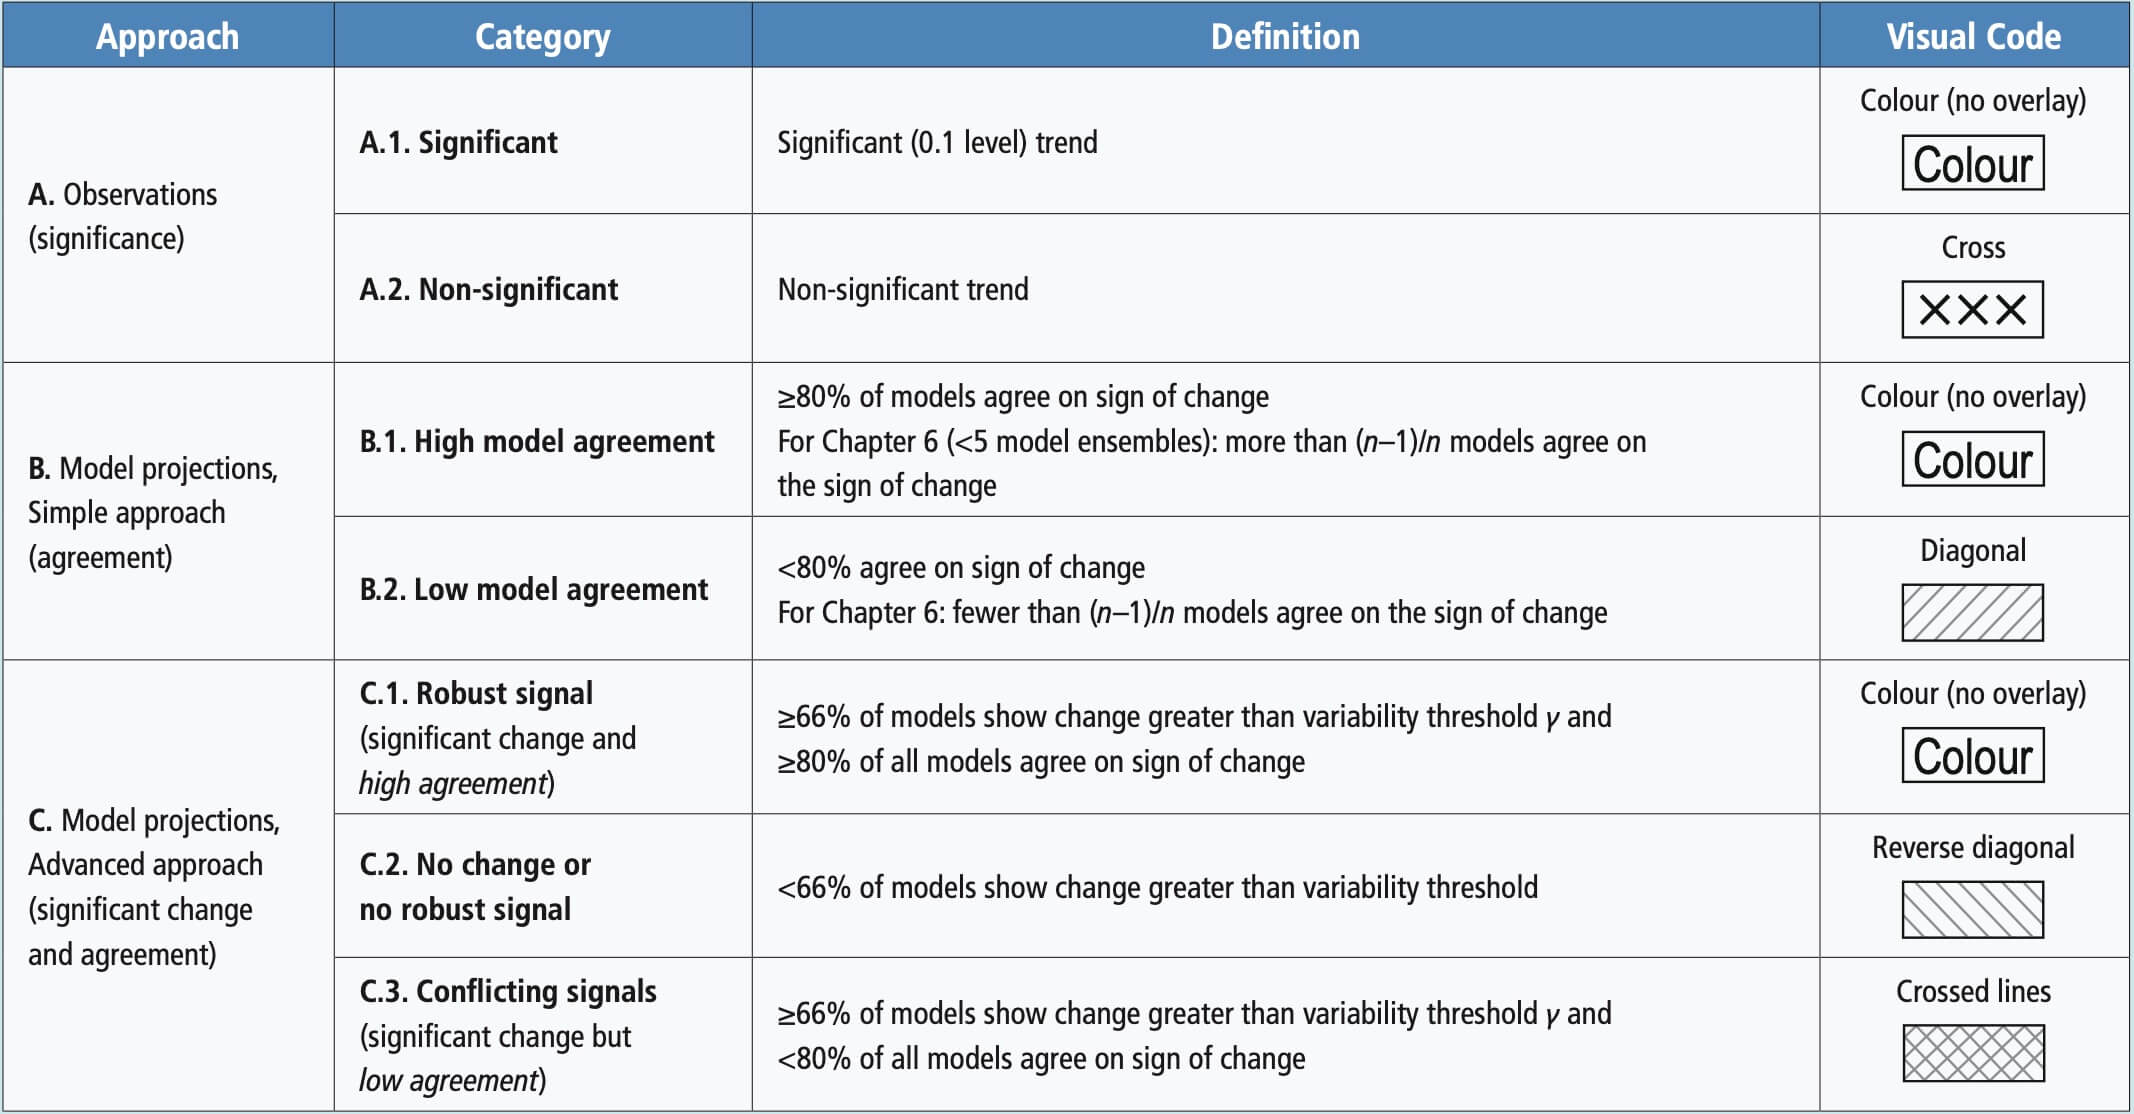
Uncertainty at the grid-box and regional scales: interpreting areas with diagonal lines
There is no one-size-fits-all method for representing robustness or uncertainty in future climate projections from a multi-model ensemble. One of the main challenges is the dependence of the significance on the spatial scale of interest: while a significant trend may not be detected at every location, a fraction of locations showing significant trends can be sufficient to indicate a significant change over a region, particularly for extremes (e.g., it is likely that annual maximum one-day precipitation has intensified over the land regions globally even though there are only about 10% of weather stations showing significant trends; Figure 11.13). The approach adopted in WGI works at a grid-box level and, therefore, is not informative for assessing climate change signals over larger spatial scales. For instance, an assessment of the amount of warming required for a robust climate change signal to emerge can strongly depend on the considered spatial scale. A robust change in the precipitation extremes averaged over a region or a number of grid boxes emerge at a lower level of warming than at the grid-box level because of larger variability at the smaller scale (Cross-Chapter Box Atlas.1, Figure 2).
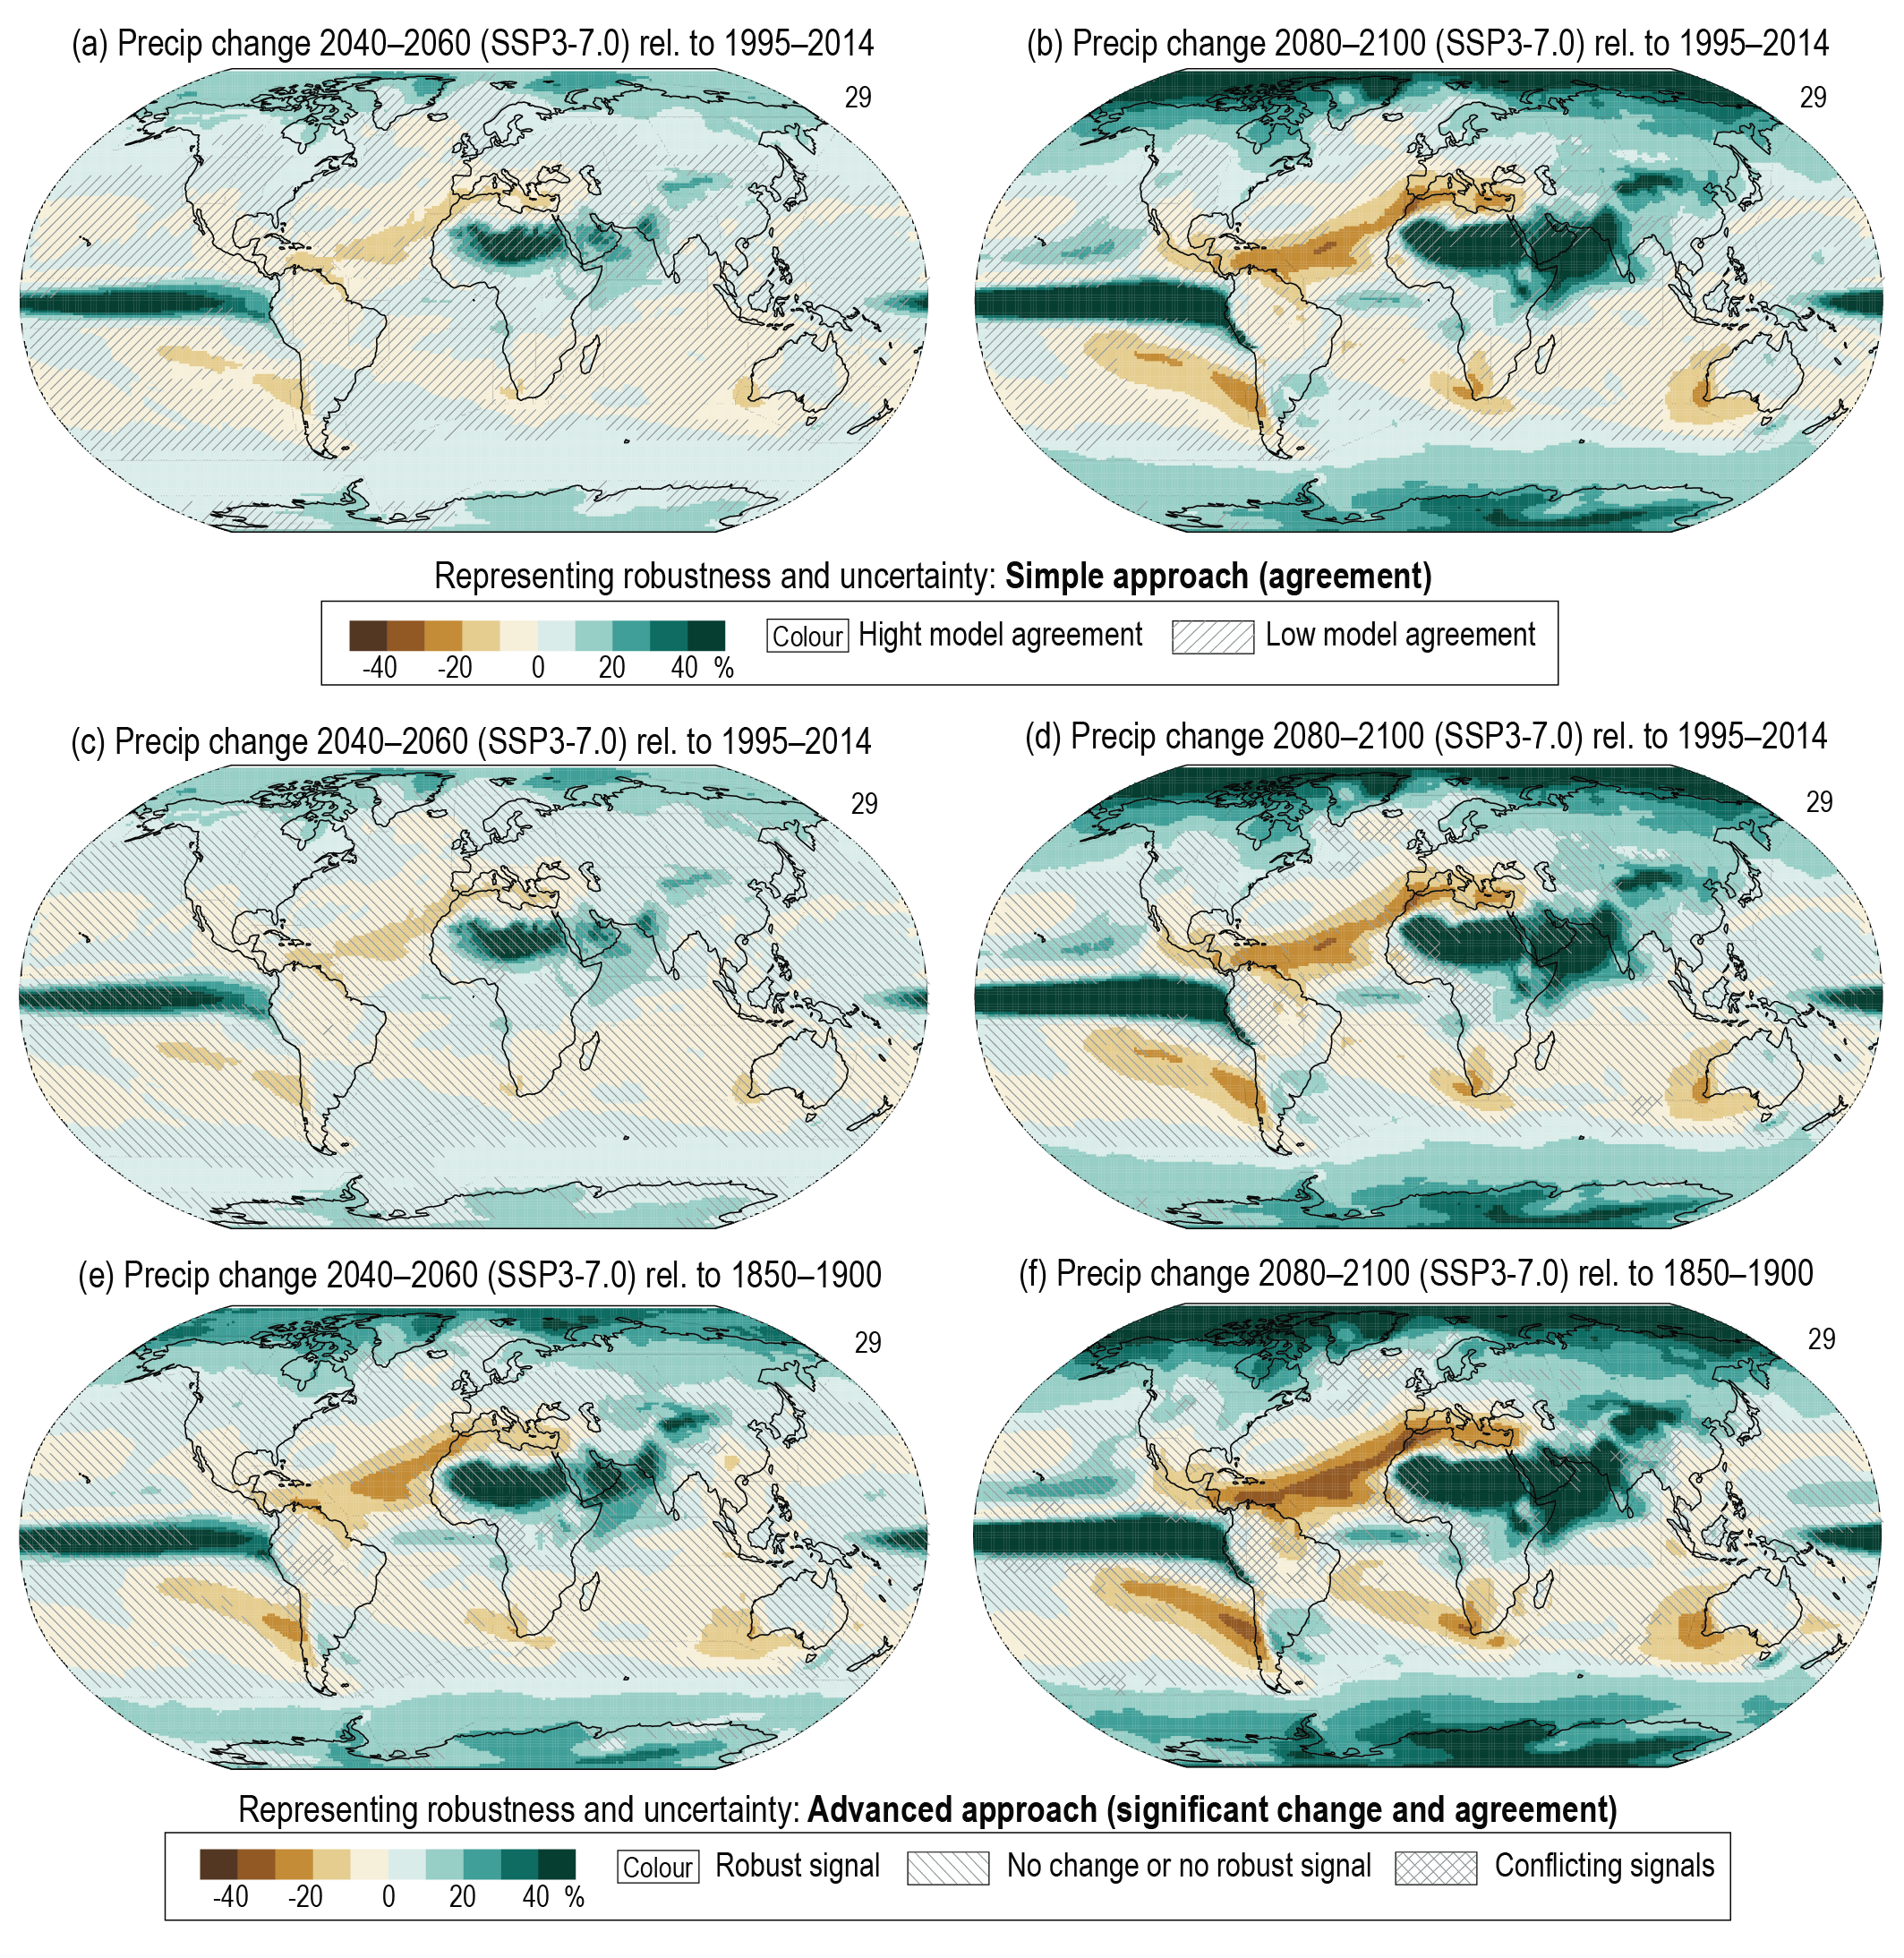
Cross-Chapter Box Atlas.1, Figure1 | Illustration of the simple, (a) and (b), and advanced, (c–f), approaches (B and C in Cross-Chapter Box Atlas.1, Table 1) for uncertainty representation in maps of future projections. Annual multi-model mean projected precipitation change (%) from CMIP6 for the period 2040–2060 (left) and 2080–2100 (right) relative to the baseline periods 1995–2014 (a–d) and 1850–1900 (e and f) under a high-emissions (SSP3-7.0) future. Diagonal and crossed lines follow the indications in Cross-Chapter Box Atlas.1, Table 1. Further details on data sources and processing are available in the chapter data table (Table Atlas.SM.15).
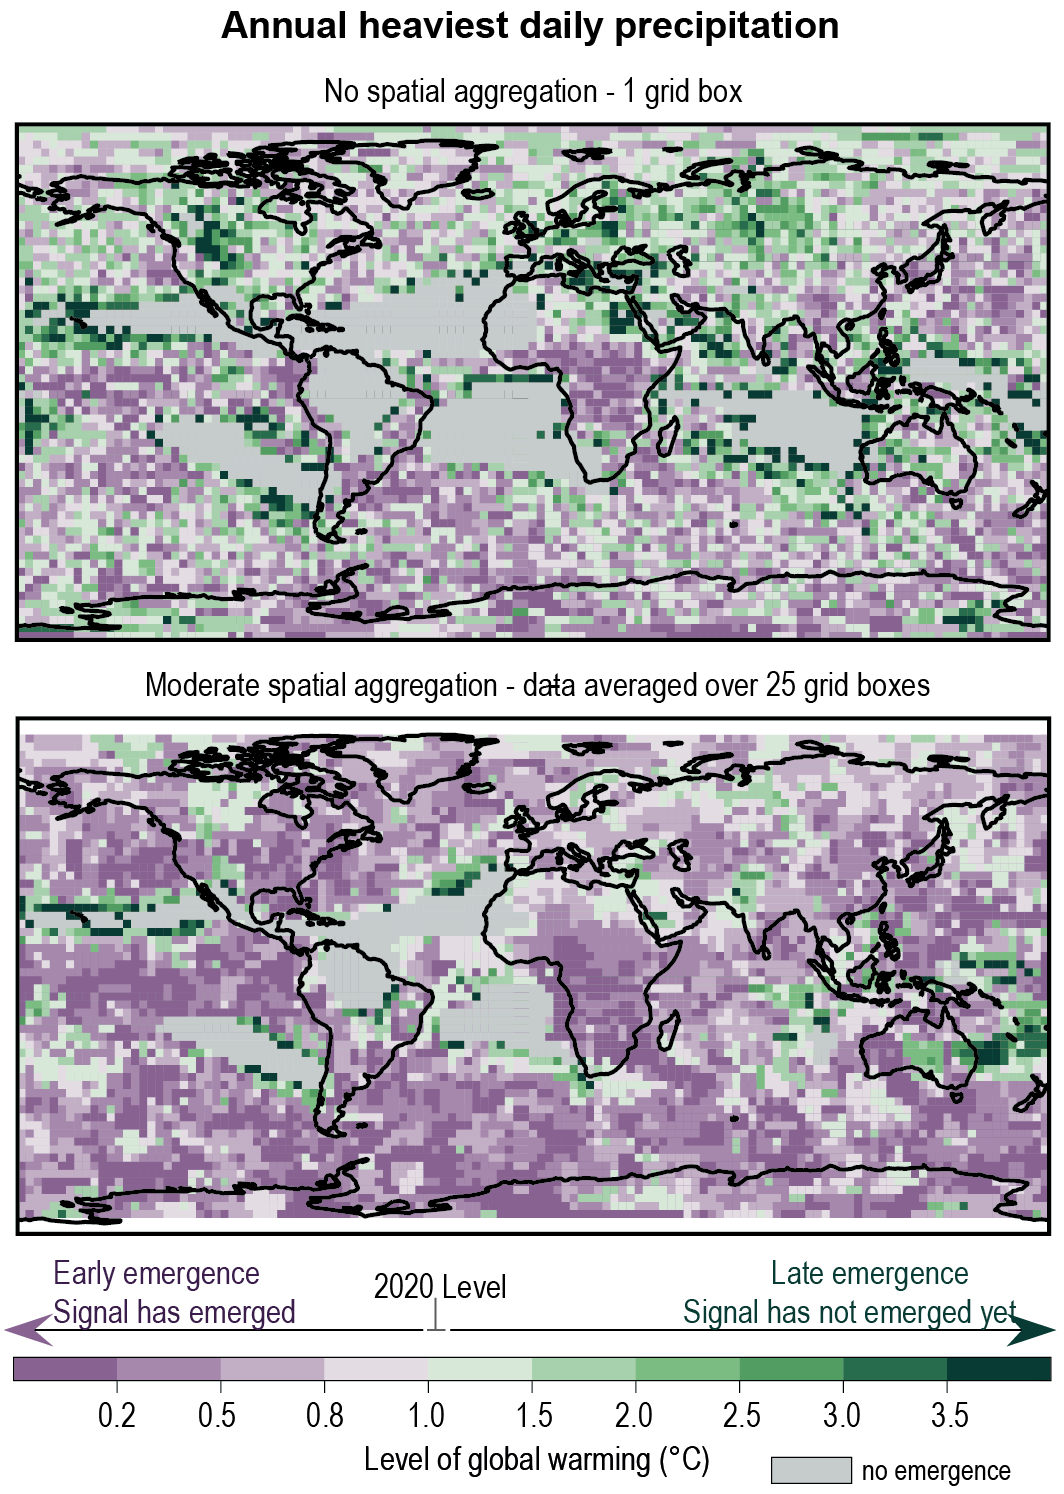
Cross-Chapter Box Atlas.1, Figure 2 | Climate change signals are more separable from noise at larger spatial scales. The figure shows the global warming level associated with the emergence of a significant increase in the probability, due to anthropogenic forcing, in the 1-in-20-year daily precipitation event. It uses a 500-year sample from the CanESM2 large ensemble simulations. The left panel uses data analysed over a single grid box, with no spatial aggregation, while the right box uses data averaged over 25 grid boxes to represent the regional scale, with moderate spatial aggregation. Aggregation over 25 grid boxes reduces natural variability, resulting in a smaller warming required for a clear separation between the signal and noise (after Kirchmeier‐Young et al., 2019).
Atlas.2 The Online ‘Interactive Atlas’
The WGI Interactive Atlas is a new AR6 product developed as part of the Atlas in consultation with other chapters to facilitate flexible synthesis information for regions, and to support the Technical Summary (TS) and the Summary for Policymakers (SPM), as well as the handshake with WGII. It includes multiple lines of evidence to support the assessment of observed and projected climate change by offering information for regions using both time slices across scenarios and GWLs. Coordination has been established with other chapters (particularly the regional chapters), adopting their methodological recommendations (Chapter 10) and using common datasets and agreed extreme indices and climatic impact-drivers (CIDs) to support and expand their assessment (Chapters 11 and 12).
The Interactive Atlas includes two components. The first component (Regional Information) allows for flexible spatial and temporal analysis (Atlas.1.3) with a predefined granularity (predefined climatological and typological regions, and user-defined seasons) through a wide range of maps, graphs and tables generated in an interactive manner building on a collection of global and regional observational datasets and climate projections (including CMIP5, CMIP6 and CORDEX; Atlas.1.4). In particular, the Interactive Atlas provides trends and changes for observations and projections in the form of interactive maps for predefined historical and future periods of analysis, the former including the recent past and paleoclimate (Cross-Chapter Box 2.1) and the latter including future time slices (near, medium and long term) across scenarios (RCPs and SSPs; see Cross-Chapter Box 1.4) and GWLs (1.5°C, 2°C, 3°C and 4°C; see Cross-Chapter Box 11.1). It also provides regional information (aggregated spatial values) for a number of predefined (reference and typological) regions in the form of time series, annual cycle plots, scatter plots (e.g., temperature versus precipitation), table summaries, and ensemble and seasonal stripe plots. This allows for a comprehensive analysis (and intercomparison, particularly using GWLs as a dimension of integration) of the different datasets at a global and regional scale.
The second component of the Interactive Atlas (Regional Synthesis) provides synthesis information about changes in CIDs in several categories such as heat and cold, wet and dry, or coastal and oceanic, supporting exploration of the regional assessment findings summarised in the TS and the SPM.
The Interactive Atlas can be consulted online at http://interactive-atlas.ipcc.ch. Figure Atlas.8 illustrates the main functionalities available: the controls at the top of the window allow the interactive selection of the dataset, variable, period (reference and baseline) and season which define a particular product of interest (e.g., annual temperature change from CMIP6 for a global warming level of 2°C under SSP3-7.0 relative to 1850–1900 in this illustrative case). Regionally aggregated information can be obtained interactively by clicking on one or several sub-regions on the map and by selecting one of the several options available for visuals (time series, annual cycle plots, scatter and stripe plots) and tables.
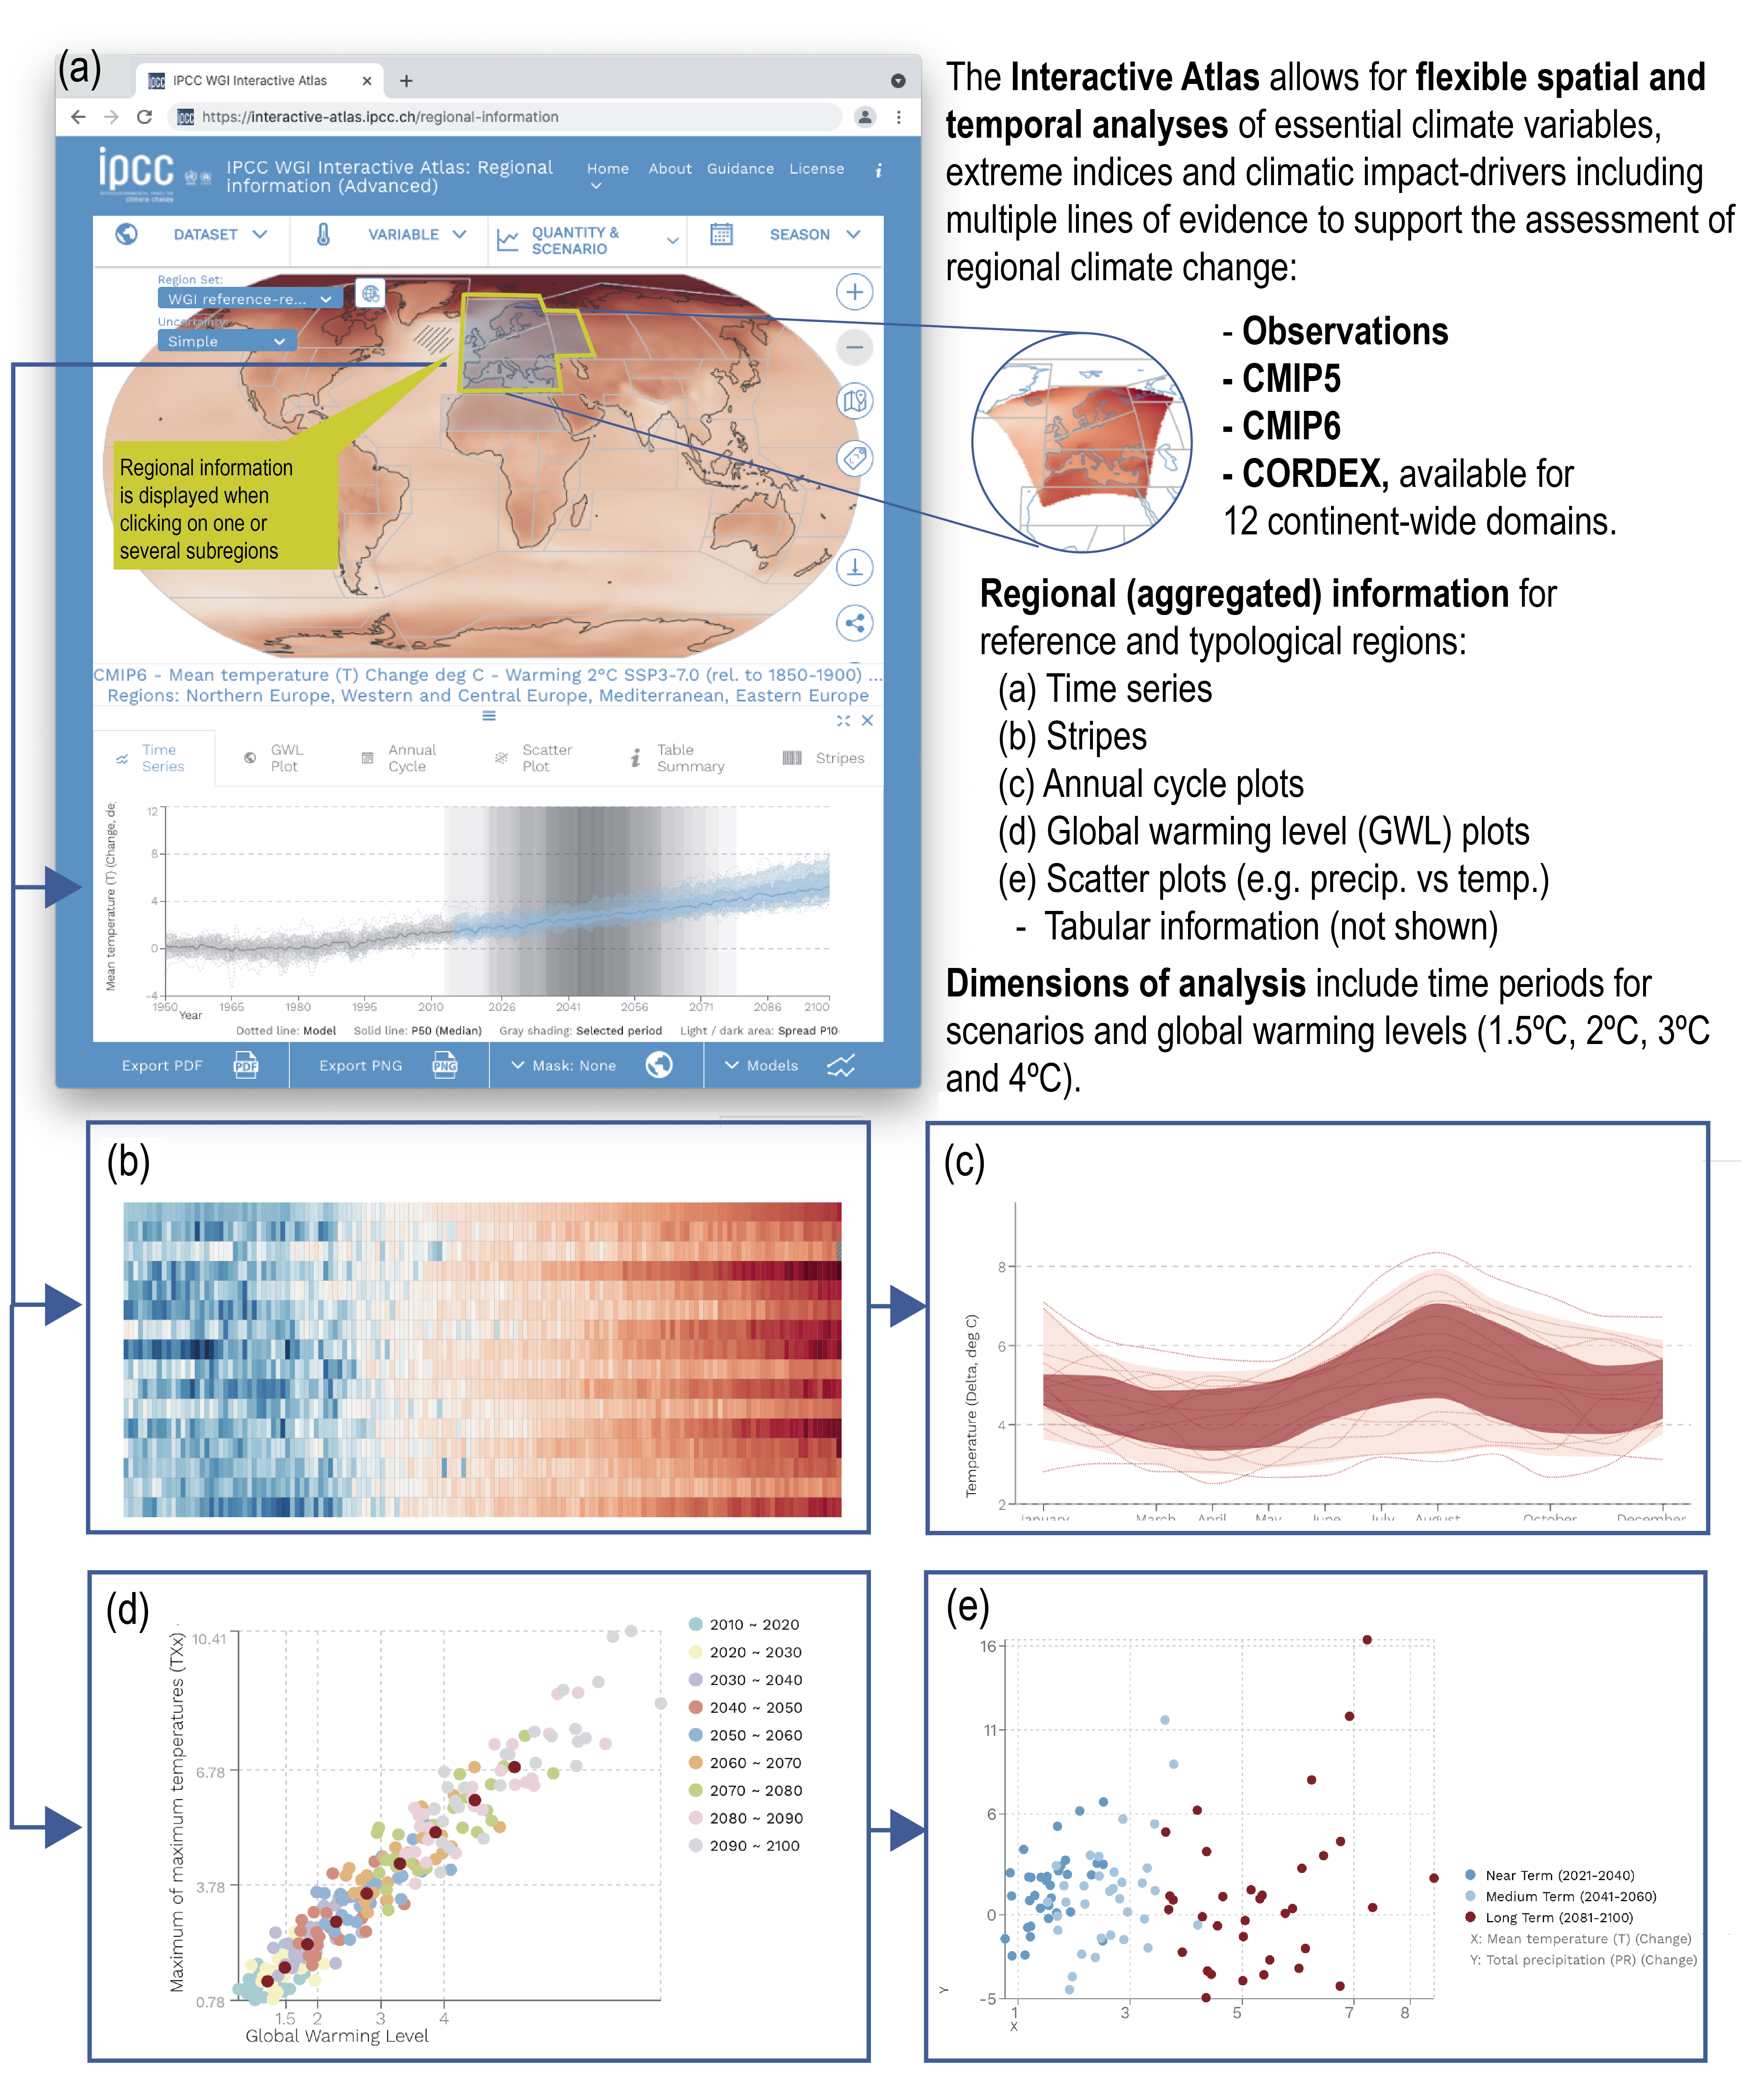 Figure Atlas.8| Screenshots from the Interactive Atlas (regional information). (a) The main interface includes a global map and controls to define a particular choice of dataset, variable, period (reference and baseline), and season (in this example, annual temperature change from CMIP6 for a global warming level of 2°C under SSP3-7.0 relative to 1850–1900). (b–e) Various visuals for the regionally averaged information for the selected reference regions.
 A major goal during the development of the Interactive Atlas has been ensuring transparency and reproducibility of results, and promoting open science and Findability, Accessibility, Interoperability, and Reuse (FAIR) principles (Wilkinson et al., 2016) described in Atlas.2.3. As a result, full metadata are provided in the Interactive Atlas for each of the products, and the scripts used to generate the intermediated products (e.g., extreme indices and CIDs) and figures are available online in a public repository (Iturbide et al., 2021), which also includes simple notebooks illustrating key parts of the code suitable for reusability. These scripts are based on the climate4R open-source framework (Iturbide et al., 2019) and full metadata have been generated for all final products using the METACLIP framework (Bedia et al., 2019), which builds on standards and describes provenance of the datasets as well as the post-processing workflow.
Atlas.2.1 Why an Online Interactive Atlas in AR6?
The idea of an online interactive Atlas was first discussed in the IPCC Expert Meeting on Assessing Climate Information for the Regions (IPCC, 2018a). The meeting stressed the need for the AR6 regional Atlas to go beyond the AR5 experience in supporting and expanding the assessment of key variables/indices and datasets conducted in all chapters, ensuring traceability, and facilitating the ‘handshake’ between WGI and WGII. One of the main limitations of previous products, including the AR5 WGI Atlas (IPCC, 2013a), is their static nature with inherent limited options and flexibility to provide comprehensive regional climate information for different regions and applications. For instance, the use of standard seasons limits the assessment in many cases, such as regions affected by monsoons or seasonal rainband migrations or other phenomena-driven seasons. The limited number of variables which can be treated on a printed Atlas also prevents the inclusion of relevant extreme indices and CIDs. The development of an online Interactive Atlas for AR6 was proposed as a solution to overcome these obstacles, facilitating the flexible exploration of key variables/indices and datasets assessed in all chapters through a wide range of maps, graphs and tables generated in an interactive manner, and thus also providing support to the TS and SPM. One of the main concerns raised by this new online interactive product was the potential danger of having an unmanageable number of final products impossible to assess following the IPCC review process. This was addressed by designing the Interactive Atlas with limited and predefined functionality and granularity, thus facilitating the review process and including use of open-source tools and code for traceability and reproducibility of results.
Atlas.2.2 Description of the Interactive Atlas: Functionalities and Datasets
The Interactive Atlas builds on the work done in the context of the Spanish National Adaptation Plan (PNACC – AdapteCCa; http://escenarios.adaptecca.es) to develop an interactive online application centralizing and providing key regional climate change information to assist the Spanish climate change impact and adaptation community. The functionalities included in the AR6 WGI Interactive Atlas are an evolution of those implemented in AdapteCCa and have been adapted and extended to cope with the particular requirements of the datasets and functionalities it includes. In particular, the Interactive Atlas allows analysis of global and regional information on past trends and future climate changes through a wide range of maps, graphs and tables generated in an interactive manner, and building on six basic products (Figure Atlas.8):
- Global maps of ensemble mean values averaged over time slices across scenarios and GWLs, with robustness represented using the approaches described in Cross-Chapter Box Atlas.1.
- Temporal series, displaying all individual ensemble members and the multi-model median, with robustness represented as ranges across the ensemble (25th–75th and 10th–90th percentile ranges). The selected reference period of analysis is also displayed as context information, either a time slice (near, mid- or long term) or a GWL (defined for a given model as the first 20-year period where its average surface temperature change first reaches the GWL relative to its 1850–1900 temperature).
- Annual cycle plots representing individual models, the multi-model median and ranges across the ensemble.
- Stripe and seasonal stripe plots, providing visual information on changes across the ensemble (different models in rows with the multi-model median on the top) and across seasons (months in rows, using the signal from the multi-model mean), respectively.
- Two-variable scatter plots (e.g., temperature versus precipitation) and GWL plots representing regional/global changes of a particular variable versus global mean warming.
- Tables with summary information.
The first of these products provides spatial information about the ensemble mean, while the latter five convey (spatially) aggregated information of the multi-model ensemble for particular region(s) selected by the user from a number of predefined alternatives (see Atlas.1.3.3 and Atlas.1.3.4 for reference and typological regions, respectively).
The Interactive Atlas includes both atmospheric (daily mean, minimum and maximum temperatures, precipitation, snowfall and wind) and oceanic (sea surface temperature, pH, sea ice, and sea level rise) essential variables assessed in the Atlas chapter and Chapters 4, 8 and 9, as well as some derived extreme indices used in Chapter 11 and a selection of CIDs used in Chapter 12 (see Annex VI):
- Maximum of maximum temperatures (TXx) – see Chapter 11.
- Minimum of minimum temperatures (TNn) – see Chapter 11.
- Maximum 1-day precipitation (Rx1day) – see Chapter 11.
- Maximum 5-day precipitation (Rx5day) – see Chapter 11.
- Consecutive dry days (CDD) – see Chapter 11.
- Standardized Precipitation Index (SPI-6) – see Chapters 11 and 12.
- Frost days (FD), both raw and bias adjusted – see Chapters 11 and 12.
- Heating degree days (HD) – see Chapter 12.
- Cooling degree days (CD) – see Chapter 12.
- Days with maximum temperature above 35°C (TX35), both raw and bias adjusted – see Chapter 12.
- Days with maximum temperature above 40°C (TX40), both raw and bias adjusted – see Chapter 12.
The essential variables are computed for observations and reanalysis datasets as described in Atlas.1.4.1 and Atlas.1.4.2 (note that the Atlas does not include observational datasets for extremes). Trend analyses are available for two alternative baseline periods (1961–2015 and 1980–2015, selected according to data availability). This expands the information available in Chapter 2 for global observational datasets, including new periods of analysis and new regional observational datasets which provide further insight into observational uncertainty. The Interactive Atlas also includes paleoclimate information from the Paleoclimate Model Intercomparison Projects PMIP3/4 for temperature and precipitation for the Last Glacial Maximum, Last Interglacial, mid-Holocene and mid-Pliocene periods (see Cross-Chapter Box 2.1).
Both essential variables and indices/CIDs are computed for CMIP5, CMIP6 and CORDEX model projections (Atlas.1.4.3 and Atlas.1.4.4). The calculations are performed on the original model grids and results are interpolated to the reference regular grids at horizontal resolutions of 2° (CMIP5), 1° (CMIP6) and 0.5° (CORDEX) (Iturbide et al., 2021). Information is available for the historical, SSP1-2.6, SSP2-4.5, SSP3-7.0 and SSP5-8.5 scenarios for CMIP6, and historical, RCP2.6, RCP4.5 and RCP8.5 for CMIP5 and CORDEX, as documented in the supplementary material Tables Atlas.SM.1–2 (for CMIP5/CMIP6) and Tables Atlas.SM.3–14 (for the different CORDEX domains). All products (maps, graphs and tables) are available for different reference periods of analysis, either time slices (2021–2040, 2041–2060 and 2081–2100 for near-, mid- and long-term future periods, respectively; see Atlas.1.3.1), or GWLs (1.5°C, 2°C, 3°C or 4°C; see Atlas.1.3.2), with changes relative to a number of alternative baselines (including 1850–1900 pre-industrial, and 1995–2014 recent past; see Atlas.1.3.1). Note that instead of blending the information from the different scenarios, the Interactive Atlas allows comparison of the GWL spatial patterns and timings across the different scenarios (Cross-Chapter Box 11.1).
Some of the above indices (in particular, TX35 and TX40) are highly sensitive to model biases and the application of bias-adjustment techniques is recommended to alleviate this problem (see Cross-Chapter Box 10.2). Bias adjustment is performed as explained in Atlas.1.4.5.
The Interactive Atlas implements the approaches for representing robustness in maps at the grid-box level described in Cross-Chapter Box Atlas.1. These approaches are not necessarily informative for assessing trends and climate change signals over larger spatial scales where signals are less affected by small-scale variability leading to an increase in robustness. For regional analysis, the Interactive Atlas allows the analysis of aggregated region-wide signals and assessing their robustness at a regional scale, thus complementing the previous approach for grid-box robustness representation. For example, Figure Atlas.9 shows large hatched areas for maximum five-day precipitation in the South Asia region. When aggregated spatially, the region exhibits a robust wetting signal, with most ensemble members agreeing on the sign. This highlights that signals may not have emerged at the station or grid-box scale but have clearly at aggregated scales, particularly for variables with high variability (e.g., extreme precipitation or cold extremes; see Cross-Chapter Box Atlas.1).
 Figure Atlas.9 | Analysing robustness and uncertainty in climate change signals across spatial scales using the Interactive Atlas. The left panel shows projected annual relative changes for maximum five-day precipitation from CMIP6 for 2081–2100 relative to a 1995-2014 baseline under the SSP3-7.0 scenario, through a map of the ensemble-mean changes (panel top) and information on the regional aggregated signal over the South Asia reference region as a time series (panel bottom). This shows non-robust changes (diagonal lines) at the grid-box level (due to the large local variability), but a robust aggregated signal over the region. The right panel shows projected surface wind-speed changes from CMIP6 models for 2041–2060 relative to a 1995–2014 baseline under the SSP5-8.5 scenario, again with the ensemble-mean changes in the map (panel top) and a regionally aggregated time series over Central Africa for each model (panel bottom). This shows conflicting changes (crossed lines) at the grid-box level due to signals of opposite sign in the individual models displayed in the time series.
 The advanced approach for representing robustness includes a new category for identifying conflicting signals, where models are projecting significant changes but of opposite signs. This is demonstrated in Figure Atlas.9 which shows a region of central Africa where models have significant changes in surface winds with some projecting increases and others decreases. This is clearly demonstrated in the time series below the map which shows these wind-speed changes aggregated over the CAF reference region for each of the CMIP6 models and the opposing signals in many of these.
Atlas.2.3 Accessibility, Reproducibility and Reusability (FAIR Principles)
The accessibility and reproducibility of scientific results have become a major concern in all scientific disciplines (Baker, 2016). During the design and development of the Interactive Atlas, special attention was paid to these issues in order to ensure the transparency of the products feeding into the Interactive Atlas (which are all publicly available). Accessibility is implemented in collaboration with the IPCC Data Distribution Centre (DDC), since all products underpinning the Interactive Atlas, including the intermediate products required for the indices and CIDs (monthly aggregated data), are curated and distributed by the IPCC-DDC and include full provenance information as part of their metadata. Atlas products are generated using the open-source climate4R framework (Iturbide et al., 2019) for data processing (e.g., regridding, aggregation, index calculation, bias adjustment), evaluation and quality control (when applicable). Full metadata are generated for all final products using the METACLIP framework (Bedia et al., 2019), based on the Resource Description Framework (RDF) standard to describe the datasets and data-processing workflow.
In summary, a number of actions have been conducted in order to implement open access, reproducibility and reusability of results, including:
- Use of standards and open-source tools.
- Open access to raw data and derived Atlas products via the IPCC-DDC.
- Provision of full provenance metadata describing the product generation workflow.
- Access to code through an online repository (Iturbide et al., 2021), including the scripts needed for calculating the intermediate datasets and for reproducing some of the figures of the Atlas chapter.
- Provision of annotated (Jupyter) notebooks describing key elements of the code to provide guidance and facilitate reusability.
All final products visualized in the Interactive Atlas can be exported in a variety of formats, including PNG and PDF for bitmap and vector information, respectively. Moreover, in the case of the global maps, the final data underlying these products can be downloaded in NetCDF and GIS format (GeoTIFF), thus facilitating reusability of the information. Note that the images are final IPCC products (covered by the IPCC terms of use), whereas the underlying data are distributed by the IPCC-DDC under a more flexible license which facilitates reusability. Moreover, a comprehensive provenance metadata description has been generated, including all details needed for reproducibility, from the data sources to the different post-processes applied to obtain the final product. In these cases, there is also the possibility to download a PNG file augmented with attached metadata information (in JSON format). This metadata information (including the source code generating the product) can be accessed and interpreted automatically using specific JSON software/libraries. However, for the sake of simplicity, a human-readable version of the metadata is accessible directly from the Interactive Atlas, describing the key information along the workflow.
Provenance is defined as a ‘record that describes the people, institutions, entities, and activities involved in producing, influencing, or delivering a piece of data or a thing’. This information can be used to form assessments about their quality, reliability or trustworthiness. In the context of the outcomes of the Interactive Atlas, having an effective way of dealing with data provenance is a necessary condition to ensure not only the reproducibility of results, but also to build trust on the information provided. However, the relative complexity of the data and the post-processing workflows involved may prevent a proper communication of data provenance with full details for reproducibility. Therefore, a special effort was made in order to build a comprehensive provenance metadata model for the Interactive Atlas products.
Provenance frameworks are typically based on RDF (Resource Description Framework), a family of World Wide Web Consortium (W3C) specifications originally designed as a metadata model (Candan et al., 2001). It is an abstract model that has become a general method for conceptual description of information for the Web, using a variety of syntax notations and serialization formats. METACLIP (Bedia et al., 2019) exploits RDF through specific vocabularies, written in the Web Ontology Language (OWL), describing different aspects involved in climate product generation, from the data source to the post-processing workflow, extending international standard vocabularies such as PROV-O (Moreau et al., 2015). The METACLIP vocabularies are publicly available in the METACLIP repository (Bedia and Martin, 2021).
METACLIP emphasizes the delivery of ‘final products’ (understood as any piece of information that is stored in a file, such as a plot or a map) with a full semantic description of its origin and meaning attached. METACLIP ensures ‘machine readability’ through reuse of well-defined, standard metadata vocabularies, providing semantic interoperability and the possibility of developing database engines supporting advanced provenance analytics. Therefore, this framework has been adopted to generate provenance information and attach it as metadata to the products generated by the Interactive Atlas. A specific vocabulary (‘ipcc_terms’) is created alongside the inclusion of new products in the Interactive Atlas and uses the controlled vocabularies existing from CMIP and CORDEX experiments. As an example, Figure Atlas.10 shows the semantic vocabularies needed to encode the information of the typical workflow for computing (from bias-adjusted data) any of the climate indices (extreme or CIDs) included in the Interactive Atlas.
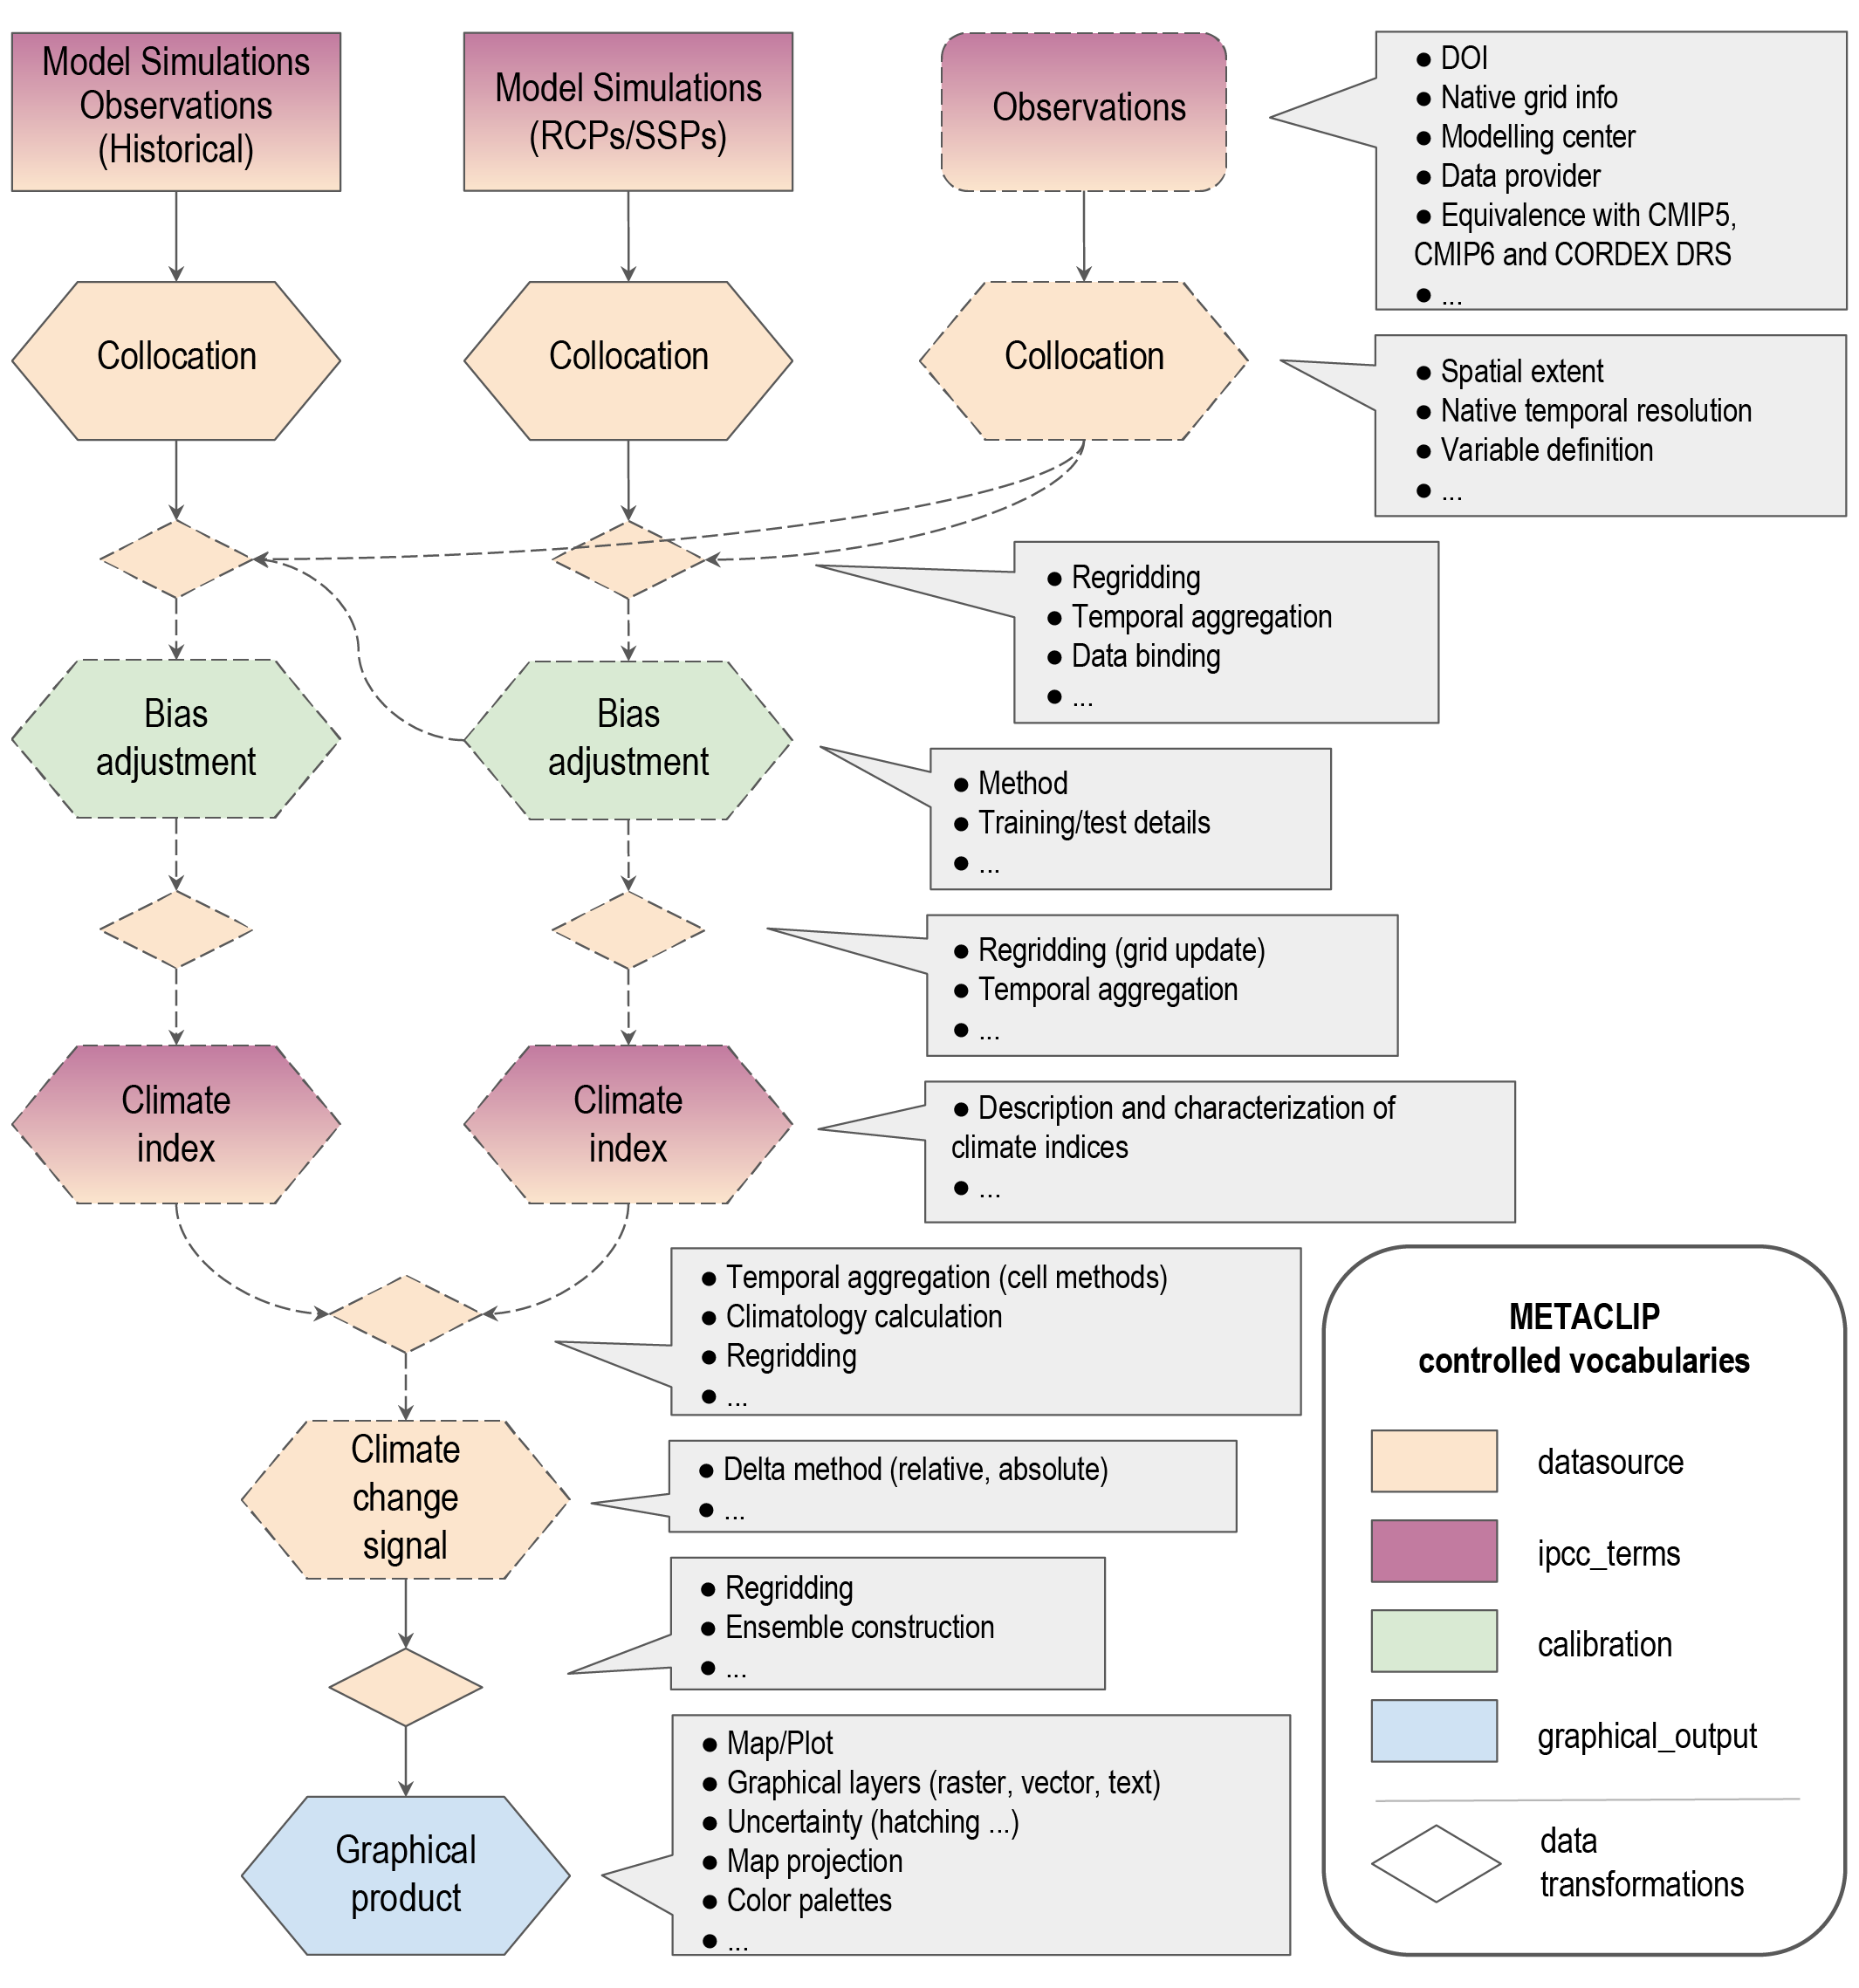 Figure Atlas.10 | Schematic representation of theInteractive Atlas workflow, from database description, subsetting and data transformation to final graphical product generation (maps and plots). Product-dependent workflow steps are depicted with dashed borders. METACLIP specifically considers the different intermediate steps consisting of various data transformations, bias adjustment, climate index calculation and graphical product generation, providing a semantic description of each stage and the different elements involved. The different controlled vocabularies describing each stage are indicated by the colours, with gradients indicating several vocabularies involved, usually meaning that specific individual instances are defined in ‘ipcc_terms’ extending generic classes of ‘datasource’. These two vocabularies, dealing with the primary data sources have specific annotation properties linking their own features with the CMIP5, CMIP6 and CORDEX Data Reference Syntax, taking as reference their respective controlled vocabularies. All products generated by the Interactive Atlas provide a METACLIP provenance description, including a persistent link to a reproducible source code under version control.
 Atlas.2.4 Guidance for Users
Atlas.2.4.1 Purpose of the Interactive Atlas
The primary purpose of the IPCC is to provide a policy-relevant, non-prescriptive assessment of the state of knowledge on climate change and its impacts. This purpose is different from the provision of information targeted to implement climate policies, which is the focus of climate services and national climate change assessment communities. IPCC assessments are based on quantitative observational and model-generated data that are also used in many activities supporting the development of climate policies. However, the functionality of the Interactive Atlas is primarily aimed at supporting the knowledge assessment.
Much of the assessment in this report is based on multiple lines of evidence (Cross-Chapter Box 10.3). The Interactive Atlas facilitates combining multiple observational and model-generated datasets and spatial and temporal analyses that combine to support statements on the characteristics of the climate system. The use of predefined spatial and temporal aggregations imposes constraints on the ability to make specific or tailored assessments but does provide essential background and uncertainty information to generate broad findings and provide confidence statements on these. Also, the inclusion of a selection of extremes and climatic impact-drivers (CIDs) is a new element in the Interactive Atlas and facilitates broader application, including the handshake with WGII. Below, some guidelines on the use, interpretation and limitations of the Interactive Atlas are given.
Atlas.2.4.2 Guidelines for the Interactive Atlas
Atlas.2.4.2.1 Quantitative Support for Assessments
Many assessment statements make use of evidence derived from observed changes, model projections, and process-oriented attribution of changes to human interventions. The Interactive Atlas shows a small subset of available observations that document climate change, namely surface air temperature and total precipitation (and thus not including observations of other atmospheric and Earth system components used as part of the evidence base for the report). Only datasets that have (near) global or large regional gridded spatial coverage and go back multiple decades are used. For each variable multiple datasets are included, but some of these have overlapping native ground-station observations and so are not independent (Atlas.1.4.1). The datasets show patterns of substantial spatial and temporal variability, and the empirical evidence of a non-stationary climatology needs to be filtered from this information. Issues with quality, representativity and mutual consistency lead to constraints on their use for attribution of causes of trends (see Section 10.4.1.2 for examples). The practice of attributing trends and extreme events to human causes gives confidence that these trends are expected to continue in the (near) future, provided the human drivers of climate change remain unchanged. However, large internal variability at decadal time scales can be misinterpreted as an anthropogenic influence on the likelihood of extreme events, and in that case extrapolation of trends cannot be expected to be a reliable predictor for the future (Schiermeier, 2018).
The Interactive Atlas gives access to a specific set of climate variables from a large number of climate model simulations, particularly the (global) CMIP5, CMIP6 and (regional) CORDEX archives. The global model outputs generally give a relatively coarse picture of climate change, which is an important line of evidence for the detection and attribution of climate change, but is rarely directly applicable for local climate change assessment or support of policy design (van den Hurk et al., 2018). To provide additional detail, downscaling global projections with regional climate models (RCMs) or statistical downscaling can be undertaken but also adds a source of uncertainty as it involves additional modelling (Section 10.3).
The information displayed in the Interactive Atlas allows a number of sources of uncertainty to be quantified. ‘Observational uncertainty’ is represented by the use of multiple (albeit often not completely independent) observational datasets. ‘Uncertainty due to internal variability’ cannot be quantified directly since multiple realizations from historic and future projections are not accessible (the Interactive Atlas uses a single realization of each model). The use of a large collection of model systems allows for an elaborate quantification of ‘model uncertainty’. In addition, a comparison of CMIP5 and CMIP6 supports evidence of progress in model quality since AR5, while the evaluation of the added value of RCMs reveals model uncertainty related to spatial resolution (Section 10.3). Finally, the assessment of ‘scenario uncertainty’ is supported by the inclusion of multiple emissions scenarios for both CMIP5, CORDEX and CMIP6.
The communication of uncertainty has a profound influence on the perception of information that is exchanged during the communication process. An assessment of uncertainty communication and the barriers to climate information construction is given in Section 10.5.4.
Atlas.2.4.2.2 Insights From Physical Understanding
The detailed technical findings in IPCC reports also serve as an important benchmark resource for the research community. The Interactive Atlas complements the IPCC assessment report as a repository of scientific information on global and regional climate and its representation in coordinated model ensemble experiments. Regional climate is governed by a mixture of drivers, such as circulation patterns, seasonal monsoons, annual cycles of snow and regional land–atmosphere feedbacks. Global warming may affect regional climate characteristics by altering the dynamics of their drivers. The Interactive Atlas allows the comparison of different levels of global warming on specific regional climate features but is not designed for advanced analysis of the relationship between drivers and regional climate characteristics. For this, tailored analysis protocols need to be applied, such as the aggregation of climate change information from ensembles of regional climate projections, and stratification according to drivers of regional climate such as patterns of atmospheric circulation (Lenderink et al., 2014). The analysis of complex regional climate characteristics resulting from compound drivers also require additional expert knowledge and data processing (Thompson et al., 2016). Section 12.6.2 assesses various categories of climate services, including tailored analysis of regional climate processes.
Atlas.2.4.2.3 Construction of Storylines
Communicating the full extent of available information on future climate for a region, including a quantification of uncertainties, can act as a barrier to the uptake and use of such information (Lemos et al., 2012; Daron et al., 2018). To address the need to simplify and increase the relevance of information for specific contexts, recent studies have adopted narrative and storyline approaches (see Sections 1.4.4 and 10.5.3 for definitions and further discussion on these concepts; Hazeleger et al., 2015; Shepherd et al., 2018). The use of region-specific climate storylines, including a role for local mechanisms, drivers and societal impacts generally requires detailed information that is typically not provided by the Interactive Atlas. However, background information and basic (scenario) assumptions can be derived from the Interactive Atlas which can be considered to provide an expert knowledge base from which to build targeted storylines and climate information.
Atlas.2.4.2.4 Visual Information
The visual communication of climate information can take many forms. Besides the standard visual products typically used for communicating global and regional climate information to practitioners (e.g., maps, time series or scatter plots), the Interactive Atlas incorporates new visuals, for example, ‘stripes’ (RMetS, 2019), facilitating the communication of key messages (e.g., warming and consistency across models) to a less technical audience. The various tabular and graphical representation alternatives included as options in the Interactive Atlas (Figure Atlas.8) facilitate exploring the information interactively from different perspectives and in different levels of detail, thus favouring communication with the large and diverse audience of IPCC products.
To support the use of visuals provided in the Interactive Atlas for application to different audiences, new insights since AR5 have emerged from a range of scientific disciplines, including the cognitive and psychological sciences (Harold et al., 2016). Studies have used interviews and online surveys to assess interpretations of visuals used to communicate climate information and uncertainties (Daron et al., 2015; Lorenz et al., 2015; McMahon et al., 2015; Retchless and Brewer, 2016). They commonly find wide-ranging interpretations and varied understandings of climate information amongst respondents due to the choice of visuals. In addition, Taylor et al. (2015) found that preferences for a particular visualization approach do not always align with the approaches that achieve greatest accuracy in interpretation. Choosing appropriate visuals for a particular purpose and audience can be informed by testing and evaluation with target groups.
Atlas.2.4.2.5 Dedicated Climate Change Assessment Programmes
Communication aimed at informing the general public about assessed scientific findings on climate change have a different purpose and format than if intended to inform a specific target audience to support adaptation or mitigation policies (Whetton et al., 2016). The growing societal engagement with climate change means IPCC reports are increasingly used directly by businesses, the financial sector, health practitioners, civil society, the media, and educators at all levels. The IPCC reports could effectively be considered a tiered set of products with information relevant to a range of audiences.
The Interactive Atlas does provide access to a collection of observational and modelling datasets, presented in a form that supports the distillation of information on observed and projected climate trends at the regional scale. Access to the repository of underlying datasets enables further processing for particular purposes. As noted above, it is not the intention nor the ambition of this IPCC assessment and the Interactive Atlas component to provide a climate service for supporting targeted policies. For this an increasing number of dedicated climate change assessment programmes have been carried out, aiming at mapping climate change information relevant for adaptation and mitigation decision support.
For instance, EEA (2018) provides an overview of European national climate change scenario programmes. Most of these use CMIP5 (or earlier) global climate change ensembles driven by an agreed set of greenhouse gas (GHG) emissions scenarios, followed by downscaling using RCMs and/or statistical methods, in order to generate regionally representative hydro-meteorological indicators of climate change. In some cases, output of selected downscaled global and regional models is provided to users (Whetton et al., 2012; Daron et al., 2018). Uptake by users is strongly dependent on providing justification of the selection or for the downscaling procedure and if further steps are needed to tailor the information to local scales (Lemos et al., 2012). More comprehensive programmes provide probabilistic climate information by careful analysis and interpretation of ensembles of model outputs (Lowe et al., 2018). The information is generally tailored to professional practitioners with expertise to interpret and process this probabilistic data. This top-down probabilistic information chain is not always able to highlight the essential climate change information for users, and alternative bottom-up approaches are encouraged (Frigg et al., 2013). Section 12.6.2 assesses climate services including the national climate assessments and user uptake.
Atlas.3 Global Synthesis
Most other chapters in WGI assess past or future behaviour of specific aspects of the global climate system and this section introduces some of the key results, specifically from Chapters 2, 4 and 9. This provides a global overview on observations and information from the CMIP5 and CMIP6 ensembles to underpin the regional assessments in the rest of the Atlas Chapter and the results displayed in the Interactive Atlas. Thus, its aim is not to generate an assessment of regional climate change directly but to provide the global context for this information derived later in the Atlas. Atlas.3.1 considers global atmospheric and land surface information with global ocean information in Atlas.3.2.
Atlas.3.1 Global Atmosphere and Land Surface
The principal atmospheric quantities of interest for understanding how climate change may impact human and ecological systems, as well as being key global indicators of change, are surface air temperature and precipitation. They are therefore a significant focus of the regional climate assessments in the following regional sections of the chapter (Atlas.4 to Atlas.11) and of the Interactive Atlas. Changes in these variables over land during the recent past (1961–2015) are shown in Figure Atlas.11 using results from two global datasets (assessed in Chapter 2) to illustrate both where there is robust information on observed trends and observational uncertainty.
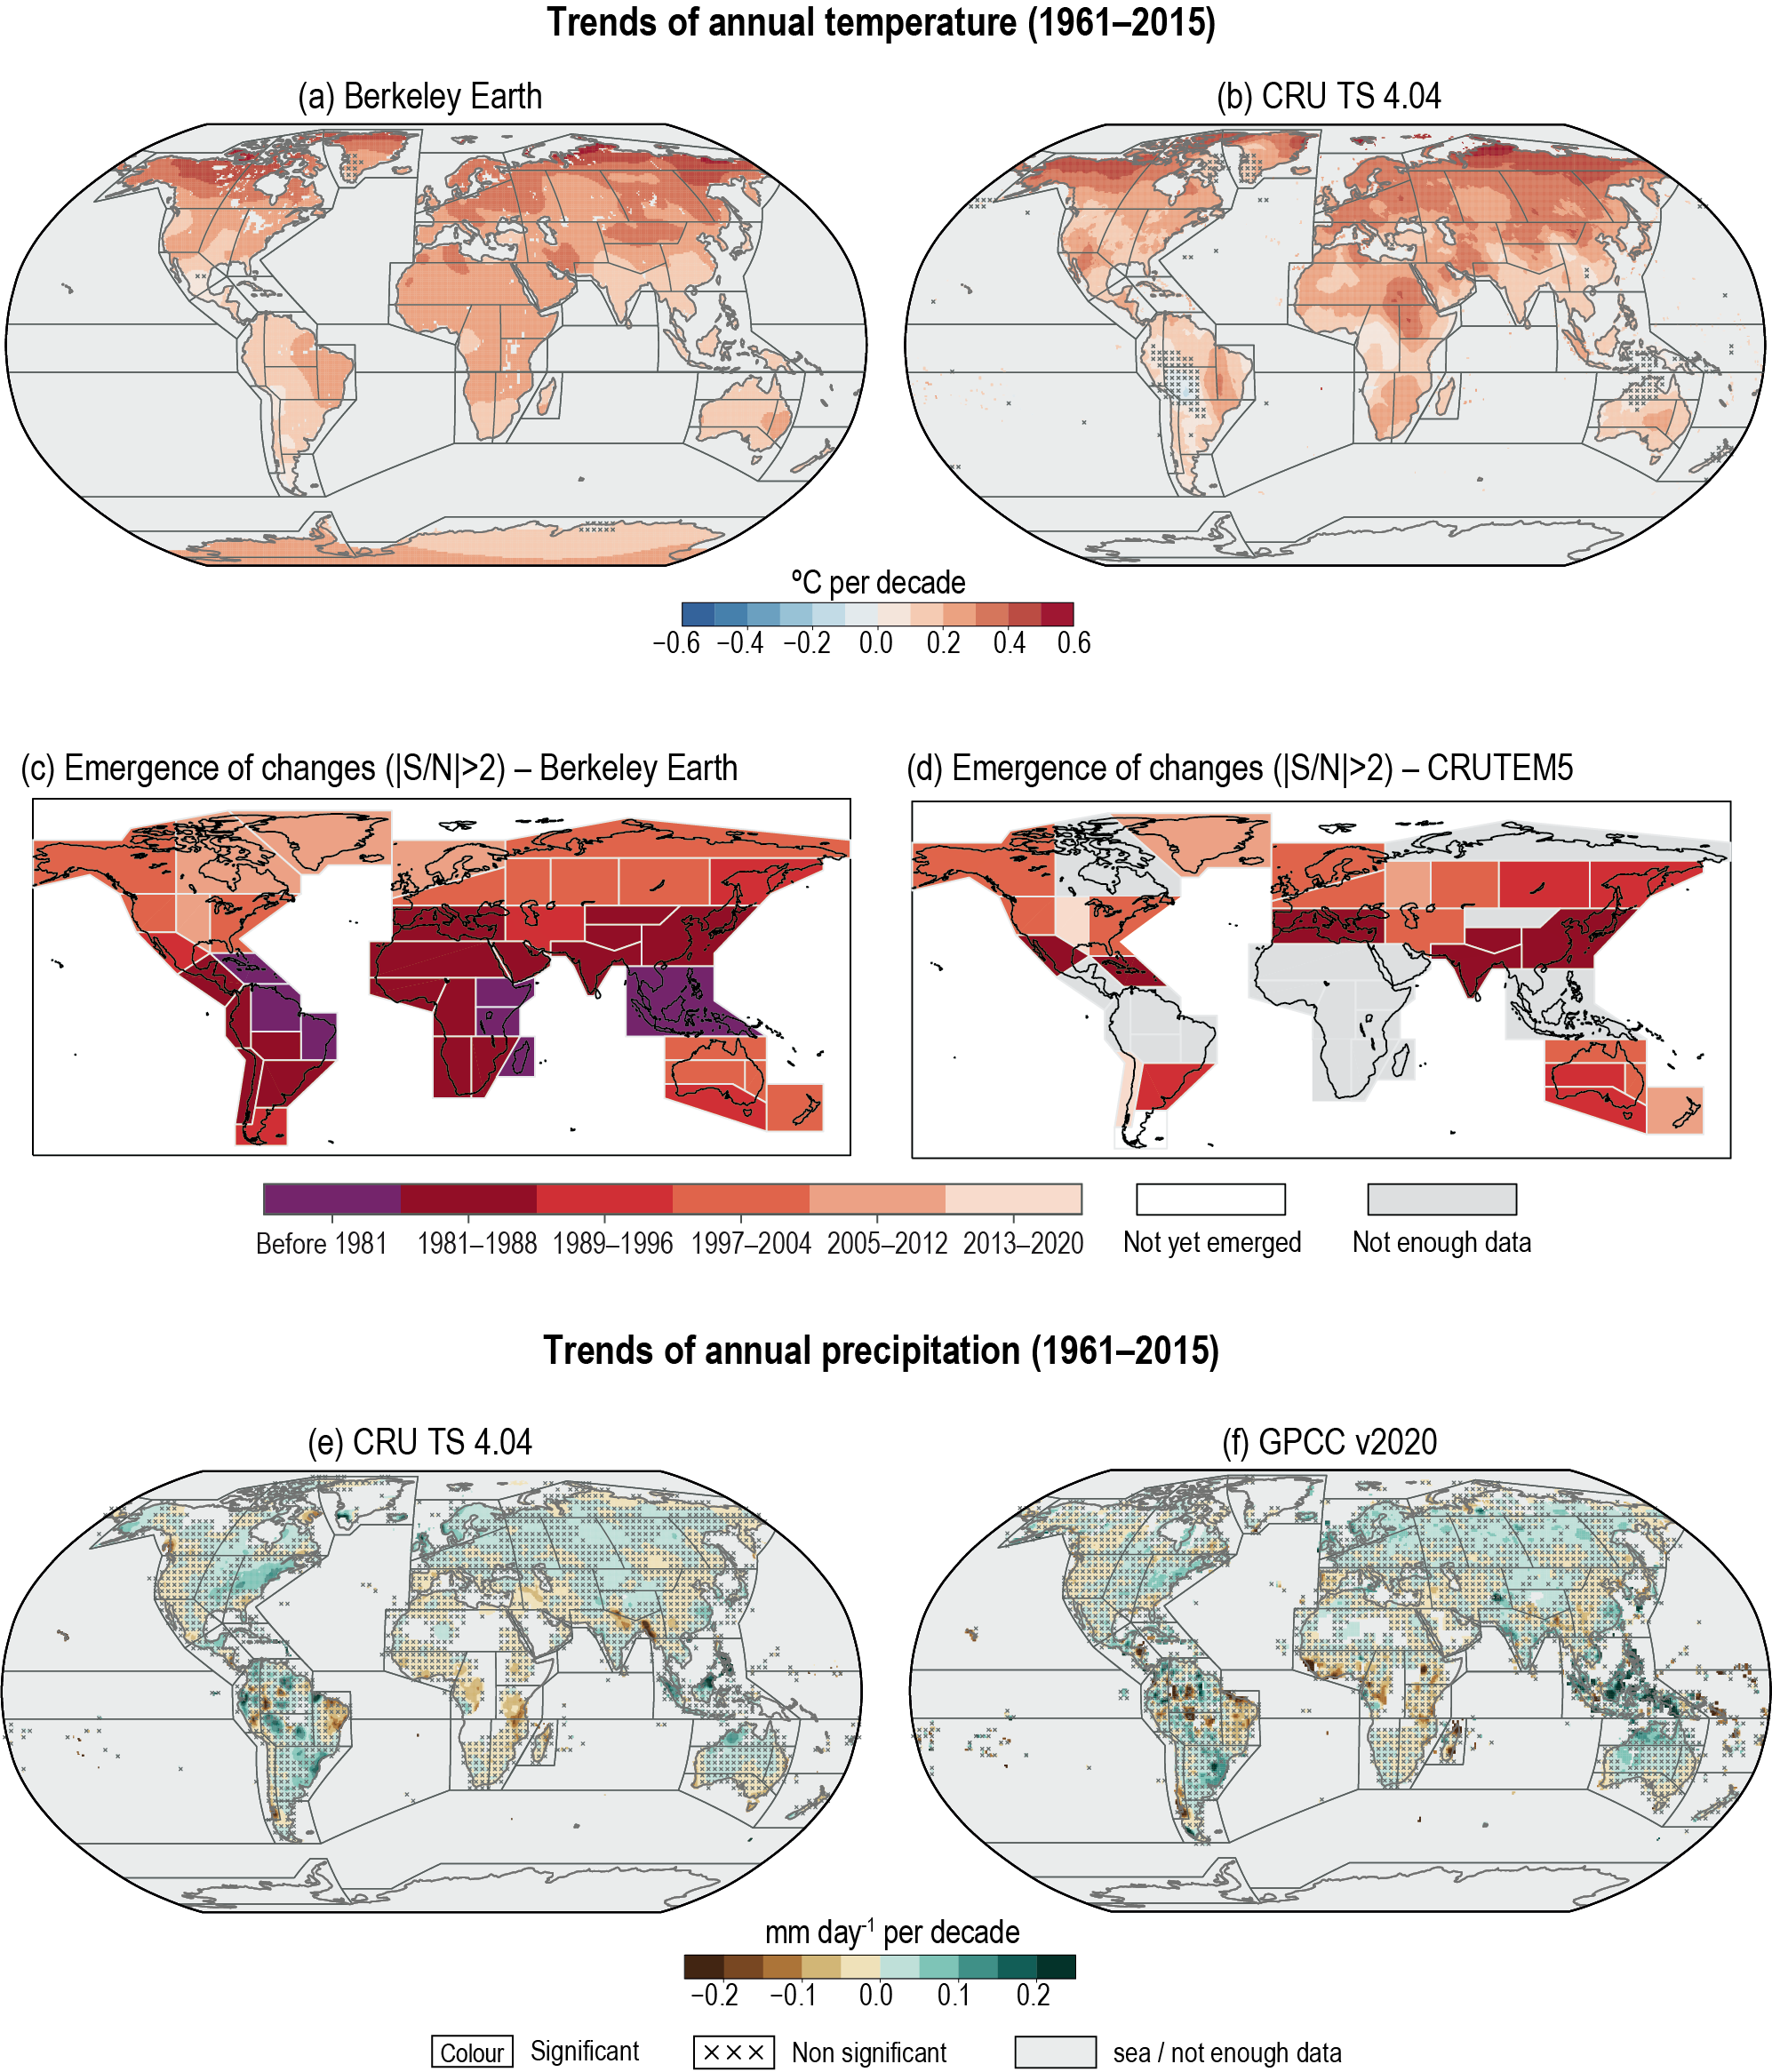 Figure Atlas.11 | Observed linear trends of signals in annual meansurface air temperature (a, b) and precipitation (e, f) in the Berkeley Earth, CRU TS and GPCC datasets (see Atlas.1 for dataset details). Trends are calculated for the common 1961–2015 period and are expressed as °C per decade for temperature and relative change (with respect to the climatological mean) per decade for precipitation. Crosses indicate regions where trends are not significant (at a 0.1 significance level) and the black lines mark out the reference regions defined in Atlas.1. Panels (c) and (d) display the period in which the signals of temperature change in data aggregated over the reference regions emerged from the noise of annual variability in the respective aggregated data. Emergence time is calculated for (c) Berkeley Earth (as used in (a)) and CRUTEM5. Regions in the CRUTEM5 map are shaded grey when data are available over less than 50% of the land area of the region. Further details on data sources and processing are available in the chapter data table (Table Atlas.SM.15).
 For temperature, a clear signal of warming is seen over most land areas with an amplification at high latitudes, though all continents apart from Africa also have regions where trends are not significant. Significant changes in annual mean precipitation are seen over much more limited areas though with consistent increasing trends over some northern high-latitude regions and decreasing trends over smaller regions in tropical Africa, the Americas and South West Asia. The information conveyed in Figure Atlas.11 on both consensus in the signal of change and on observational uncertainty is used in this chapter as a line of evidence to assess historical observed trends.
As an alternative way of viewing and summarizing information in the observational data, the panels (c) and (d) in Figure Atlas.11 show the time at which any significant temperature trends from the Berkeley Earth and CRUTEM5 datasets, averaged over the reference regions, emerged from interannual variability – with a signal-to-noise ratio greater than two (Hawkins et al., 2020). In the former, a regionally averaged warming signal has emerged over all of the land reference regions. In the latter, emergence times are only calculated for those regions which have data available in more than 50% of the land area (unlike Berkeley Earth, CRUTEM does not include spatial interpolation, see Section 2.3.1.1.3) and these are similar for all but one of the regions indicating that observational uncertainty does not change the main conclusion of widespread emergence of surface temperature signals over land regions.
As described earlier, information on projected future changes is required both at different time periods in the future under a range of emissions scenarios but also for different global warming levels. Figure Atlas.12 shows the global surface air temperature (GSAT) change projection calculated from the CMIP6 ensemble mean for the middle of the century under the SSP1-2.6 and SSP3-7.0 emissions scenarios compared to the end-of-century warming under SSP3-7.0 and for a global warming level of 2°C. The patterns of changes are similar to the observed warming and there is a high level of consistency with CMIP5 in terms of both patterns and magnitude of change (Interactive Atlas). However, for the long-term future, warming in the CMIP6 ensemble is generally higher, reflecting the increase in the top end of the range of climate sensitivities amongst the CMIP6 GCMs (Figure Atlas.1 3).
 Figure Atlas.12 | Global temperature changes projected for mid-century under SSP1-2.6 (a) and SSP3-7.0 (c) compared with a 2°C global warming level (b) and the end of the century under SSP3-7.0 (d) from the CMIP6 ensemble. Note that the future period warmings are calculated against a baseline period of 1995–2014 whereas the global mean warming level is defined with respect to the baseline period of 1851–1900 used to define global warming levels. The other three SSP-based maps would show greater warmings with respect to this earlier baseline. Further details on data sources and processing are available in the chapter data table (Table Atlas.SM.15).
 Figure Atlas.12 demonstrates how temperature is projected to increase for all regions, and at a greater rate than the global average over many land regions, and with significant amplification in the Arctic. It also shows the higher mid-century warming and significantly higher end-of-century warming under the high-emissions SSP3-7.0 scenario compared to the low-emissions SSP1-2.6 scenario. Conversely, comparing the projected 2°C global warming level change with that projected additional warming compared to the recent past under the SSP1-2.6 scenario, demonstrates the much smaller additional warming projected under this low-emissions scenario. Finally, the maps display the CMIP6 ensemble mean projection, but it is important to explore the full range of outcomes from the ensemble, for example when undertaking a comprehensive risk assessment in which temperature is an important hazard. This can be explored regionally in the Interactive Atlas (Atlas.2) by viewing the time series of changes for all of the models within the ensemble over the AR6 WGI reference regions (Figure Atlas.2).
Changes in annual mean precipitation present a more complex picture with regions of decrease as well as increase, and areas where there is model disagreement on the sign of the change, even when the signal is strong in the long-term future period as shown in Cross-Chapter Box Atlas.1, Figure 1. However, as with the temperature changes, there is a high level of consistency in the patterns and magnitude of the precipitation changes, with changes in some areas being larger in the long-term future period. Considering changes over land, Cross-Chapter Box Atlas.1, Figure 1 also shows that at lower warming levels there are many regions, especially in the Southern Hemisphere, where there is no robust signal of change from the models.
In addition to displaying results from global model ensembles as maps of projected changes and their robustness or as time series of the projected temporal evolution of the median and range of a climate statistic, it is often useful to generate area-averaged summaries of these statistics under different future emissions scenarios or at specific global warming levels. This is demonstrated in Figure Atlas.1 3 and forms the basis of a common set of analyses, which are presented for the reference regions in the regional assessments in Atlas.4 to Atlas.11. It shows the range of projected changes compared to the 1850–1900 and recent past 1995–2014 baseline periods for the CMIP5 and CMIP6 ensembles. The first four panels show: annual mean changes in temperature globally and over land only for various global warming levels and emissions scenarios and time periods (left pair), and then again globally and for global land, changes in precipitation and temperature at the same global warming levels (right pair). The second four panels provide the same temperature and precipitation information globally and for global land only in the December–February and July–August seasons. These results demonstrate the consensus between the two ensembles for increased warming over land areas and increases in global precipitation at all warming levels, and that global land precipitation increases more. They also show the increased precipitation response in December–January–February (DJF), reflecting the large precipitation increases in the Northern Hemisphere higher latitudes in winter. Finally, they demonstrate the greater warming projected by the CMIP6 ensemble, as an average over the ensemble and the upper end of the range. See Chapter 4 for an in-depth assessment of these results.
 Figure Atlas.13 | Changes in annual mean surface air temperature and precipitation averaged over the global land–sea (left) and global land areas (right) in each horizontal pair of panels. The top-left two panels show the median (dots) and 10th–90th percentile range across each model ensemble for temperature change, for two datasets (CMIP5 and CMIP6) and two scenarios (SSP1-2.6/RCP2.6 and SSP5-8.5/RCP8.5). The first 12 bars represent the projected changes over three time periods (near-term 2021–2040, mid-term 2041–2060 and long-term 2081–2100) compared to the baseline period of 1995–2014, and the remaining four bars represent the additional warming projected relative to the same baseline to reach four global warming levels (GWLs; 1.5°C, 2°C, 3°C and 4°C). The top-right two panels show scatter diagrams of temperature against precipitation changes, displaying the median (dots) and 10th–90th percentile ranges for the same four GWLs, again representing the additional changes for the global temperature to reach the respective GWL from the baseline period of 1995–2014. In all panels the dark (light) grey lines or dots represent the CMIP6 (CMIP5) simulated changes in temperature and precipitation between the 1850–1900 baseline used for calculating GWLs and the recent-past baseline of 1995–2014 used to calculate the changes in the bar diagrams and scatter plots. Changes are absolute for temperature and relative for precipitation. The script used to generate this figure is available online (Iturbide et al., 2021) and similar results can be generated in the Interactive Atlas for flexibly defined seasonal periods. Further details on data sources and processing are available in the chapter data table (Table Atlas.SM.15).
 Global warming leads to systematic changes in regional climate variability via various mechanisms such as thermodynamic responses via altered lapse rates (Kröner et al., 2017; Brogli et al., 2019) and land–atmosphere feedbacks (Boé and Terray, 2014). These can modify temporal and spatial variability of temperature and precipitation, including an altered seasonal and diurnal cycle and return frequency of extremes. Regional influences from and feedbacks with sea surface, clouds, radiation and other processes also modulate the regional response to enhanced warming, both locally and, via teleconnections, remotely.
Given their potential to influence extremes in temperature, precipitation and other climatic impact-drivers and hazards, and thus risks to human and ecological systems, it is important to understand these links for developing adaptations in response to clear anthropogenic influences on individual hazards. This will also support the related fields of disaster risk reduction and global sustainable development efforts (Steptoe et al., 2018). They demonstrated that 15 regional hazards shared connections via the El Niño–Southern Oscillation (ENSO), with the Indian Ocean Dipole, North Atlantic Oscillation and the Southern Annular Mode (see Annex IV) being secondary sources of significant regional interconnectivity (Figure Atlas.1 4). Understanding these connections and quantifying the concurrence of resulting hazards can support adaptation planning as well as multi-hazard resilience and disaster risk reduction goals.
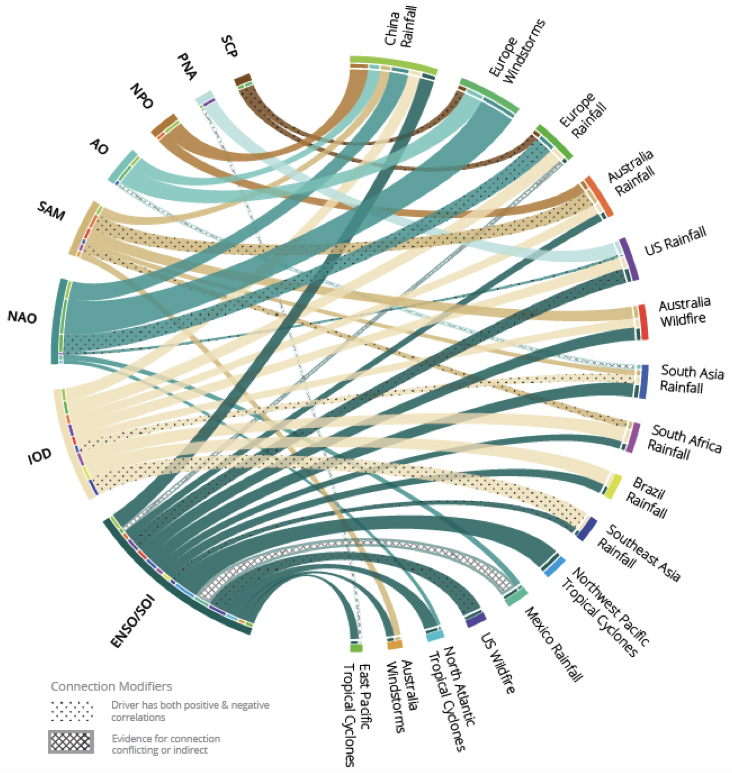 Figure Atlas.14 | Influence of major modes of variability (see Annex IV) on regional extreme events relevant to assessing multi-hazard resilience. Ribbon colours define the driver from which they originate and their width is proportional to the correlation. Crossed lines represent where there is conflicting evidence for a correlation or where the driver is not directly related to the hazard; dots represent drivers that have both a positive and negative correlation with the hazard. Figure is copied from Steptoe et al. (2018) /CCBY4.0.
 The main modes of variability influencing global and regional climate are comprehensively described in Annex IV. In the context of the assessment in the Atlas chapter, they are important because of their influence on the variability of temperature (Part A) and precipitation (Part B) in regions around the world. This is quantified in Table Atlas.1, which lists the fraction of interannual variance in seasonal mean temperature and precipitation explained by variability in these modes. The table provides information on the influence of the teleconnections for selected seasons for the interannual to decadal modes and at an annual scale for the multi-decadal modes. The columns related to the interannual to decadal modes focus on the seasons where these connections are strongest but each mode of variability will often have influences in other seasons (for more details see Annex IV). The table shows that for many regions, seasonal temperature and precipitation is substantially modulated by these modes of variability – all regions feel some influence, and variability in ocean basins often has influence in multiple remote regions.
Table Atlas.1 | Regional mapping of the teleconnections associated with the main modes of variability (Annex IV). Fraction of surface air temperature and precipitation variance explained at interannual time scale by each mode of variability (columns) for each AR6 region (rows) based on the coefficient of determination R2. Units are in percent and non-significant values based on t-statistics at the 95% level of confidence are indicated by a white cell with a diagonal line. Grey cells represent regions where there is insufficient data to calculate any teleconnection. HadCRUT (HAD), GISTEMP (GIS), Berkeley Earth (BE), and CRU-TS (CRU) observed datasets are used to assess the strength of the teleconnection for surface air temperature, and GPCC and CRU-TS are used for precipitation. The colour scale given on label bars shown at the bottom quantifies the values of the explained variance and also stands for the sign of the teleconnection for the positive phase of the mode. All data are linearly detrended prior to the computation of the regression. Note that results are sensitive to the choice of the detrending function (linear, loess filter, 3-order polynomial function) but by a few percent at most, which is well below the range of the observational uncertainty assessed here through the use of several observational products. NAM: Northern Annular Mode; SAM: Southern Annular Mode; ENSO: El Niño–Southern Oscillation; IOB: Indian Ocean basin; IOD: Indian Ocean Dipole; AZM: Atlantic Zonal Mode; AMM: Atlantic Meridional Mode; PDV: Pacific Decadal Variability; AMV: Atlantic Multi-decadal Variability; DJF: December–January–February; MAM: March–April–May; SON: September–October–November; JJA: June–July–August.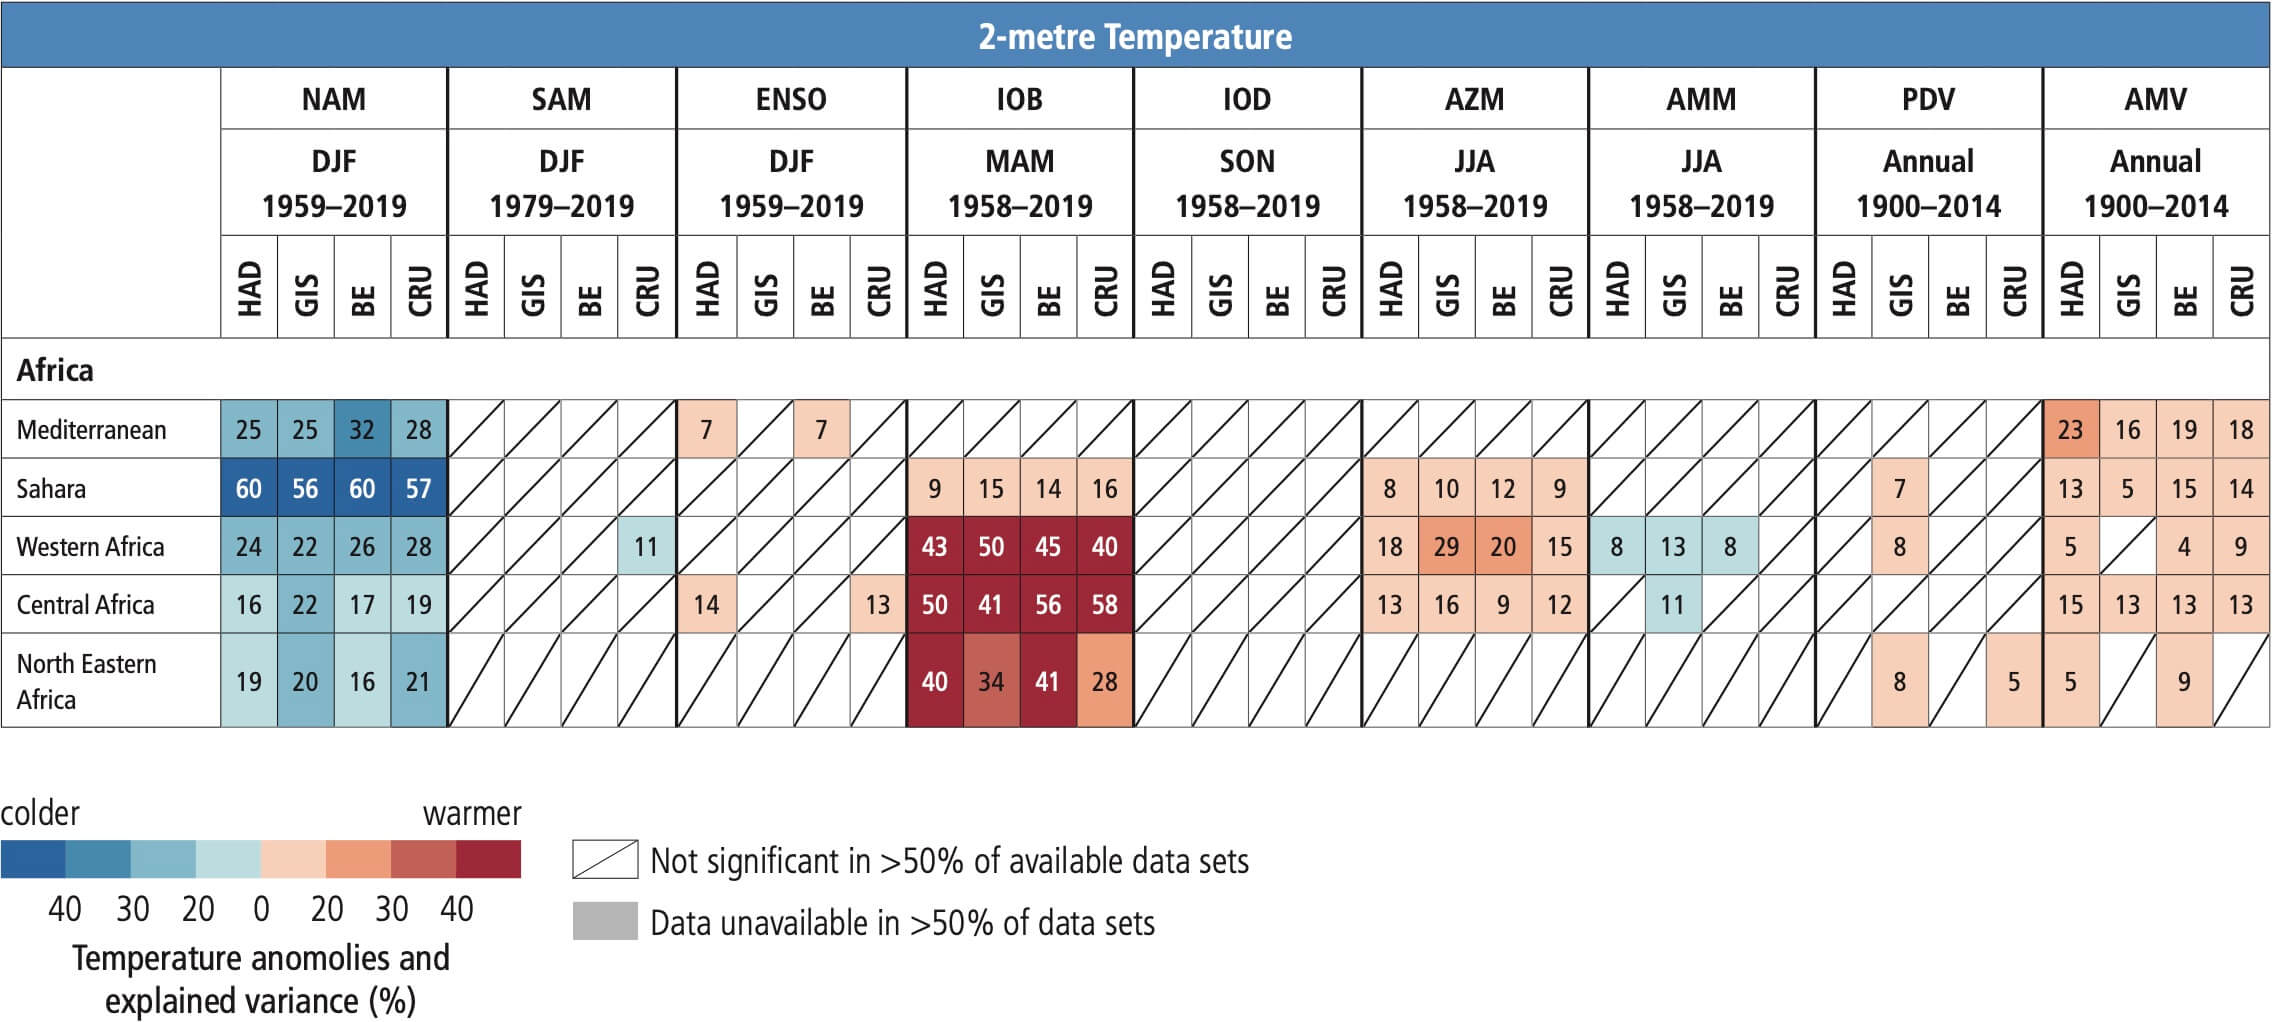
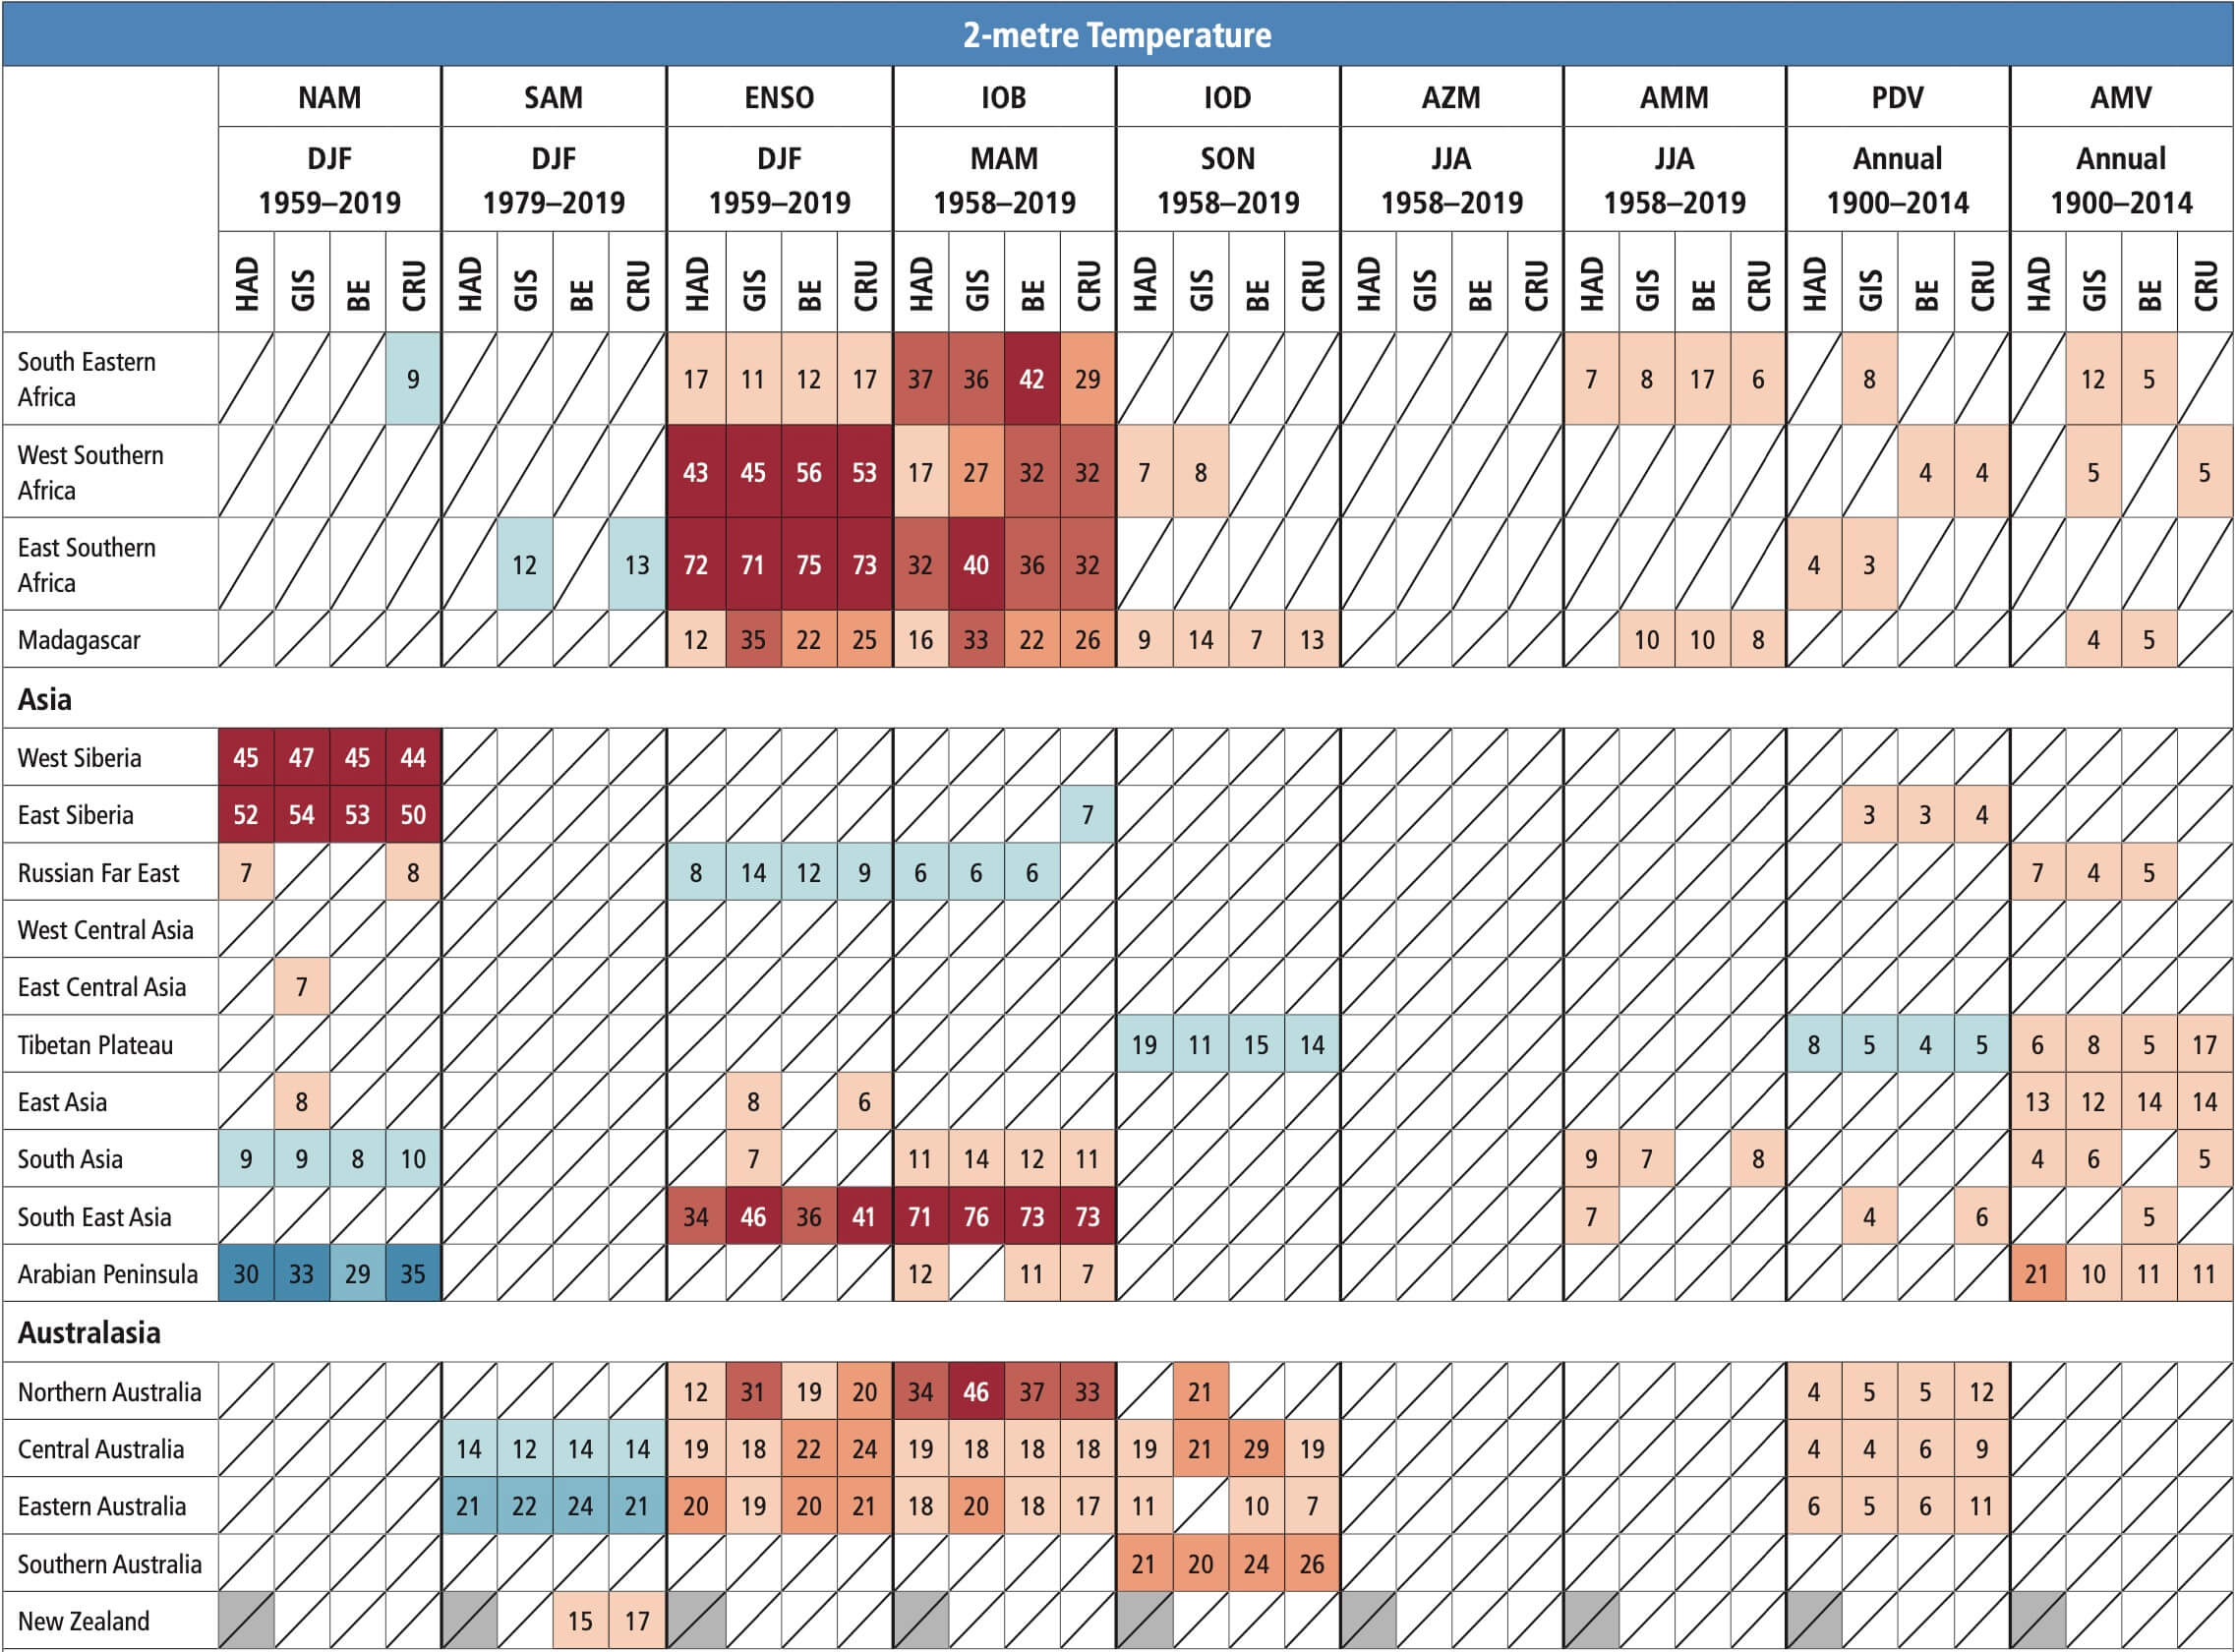
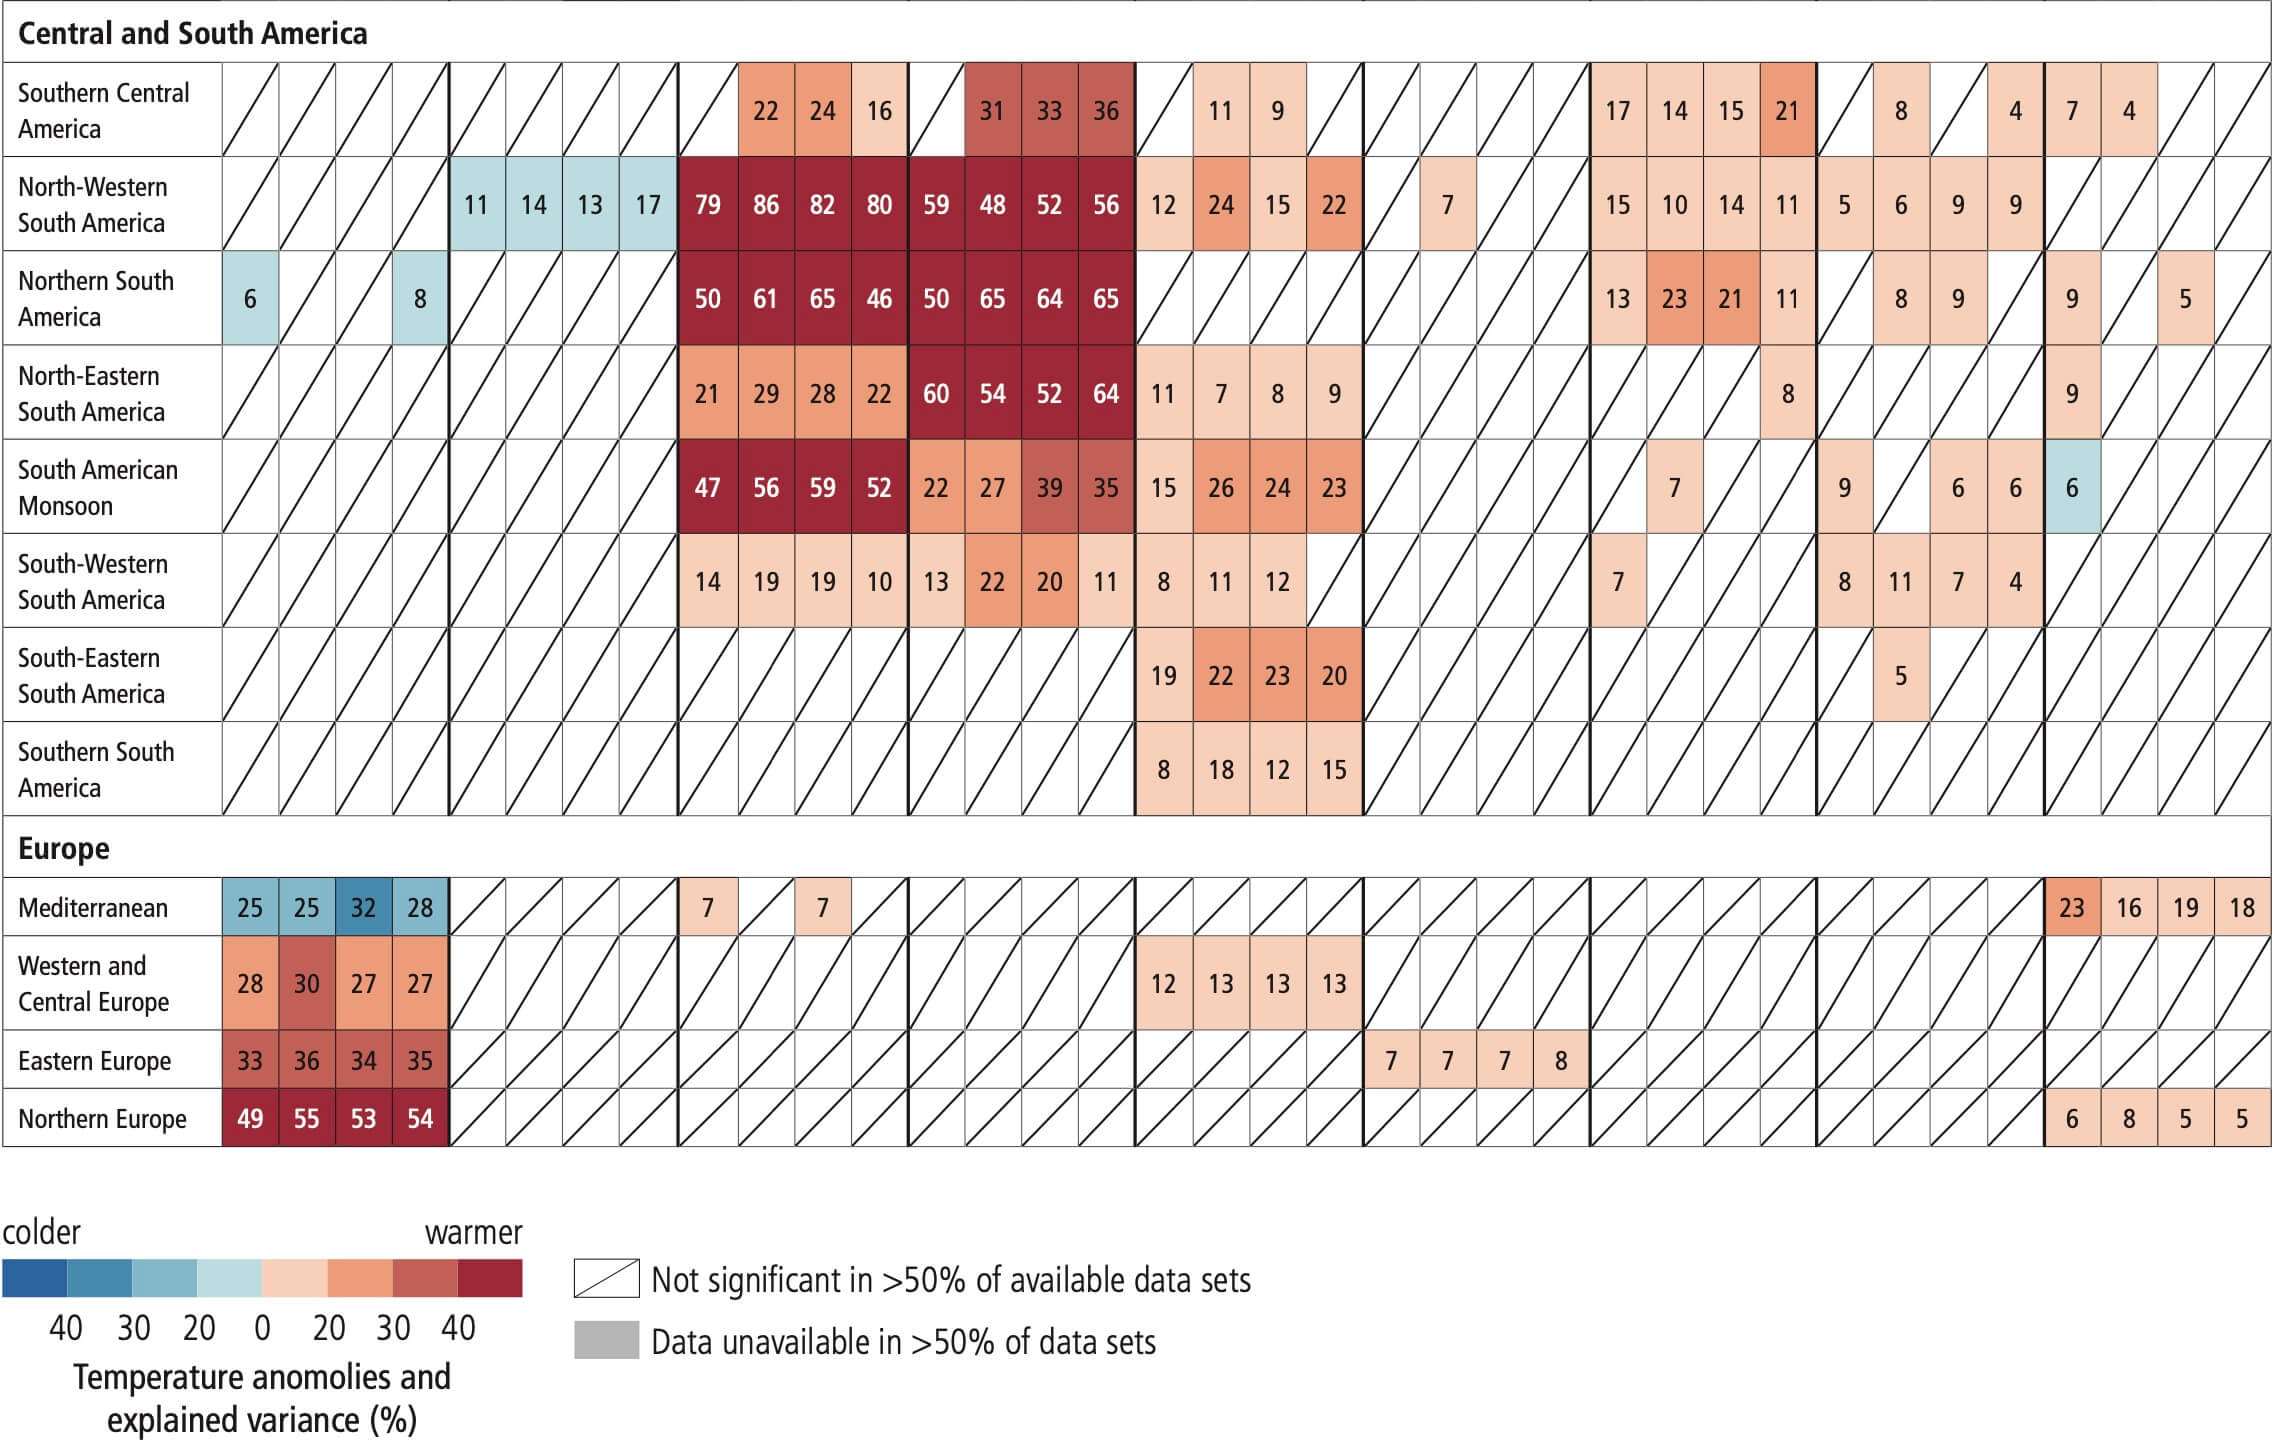
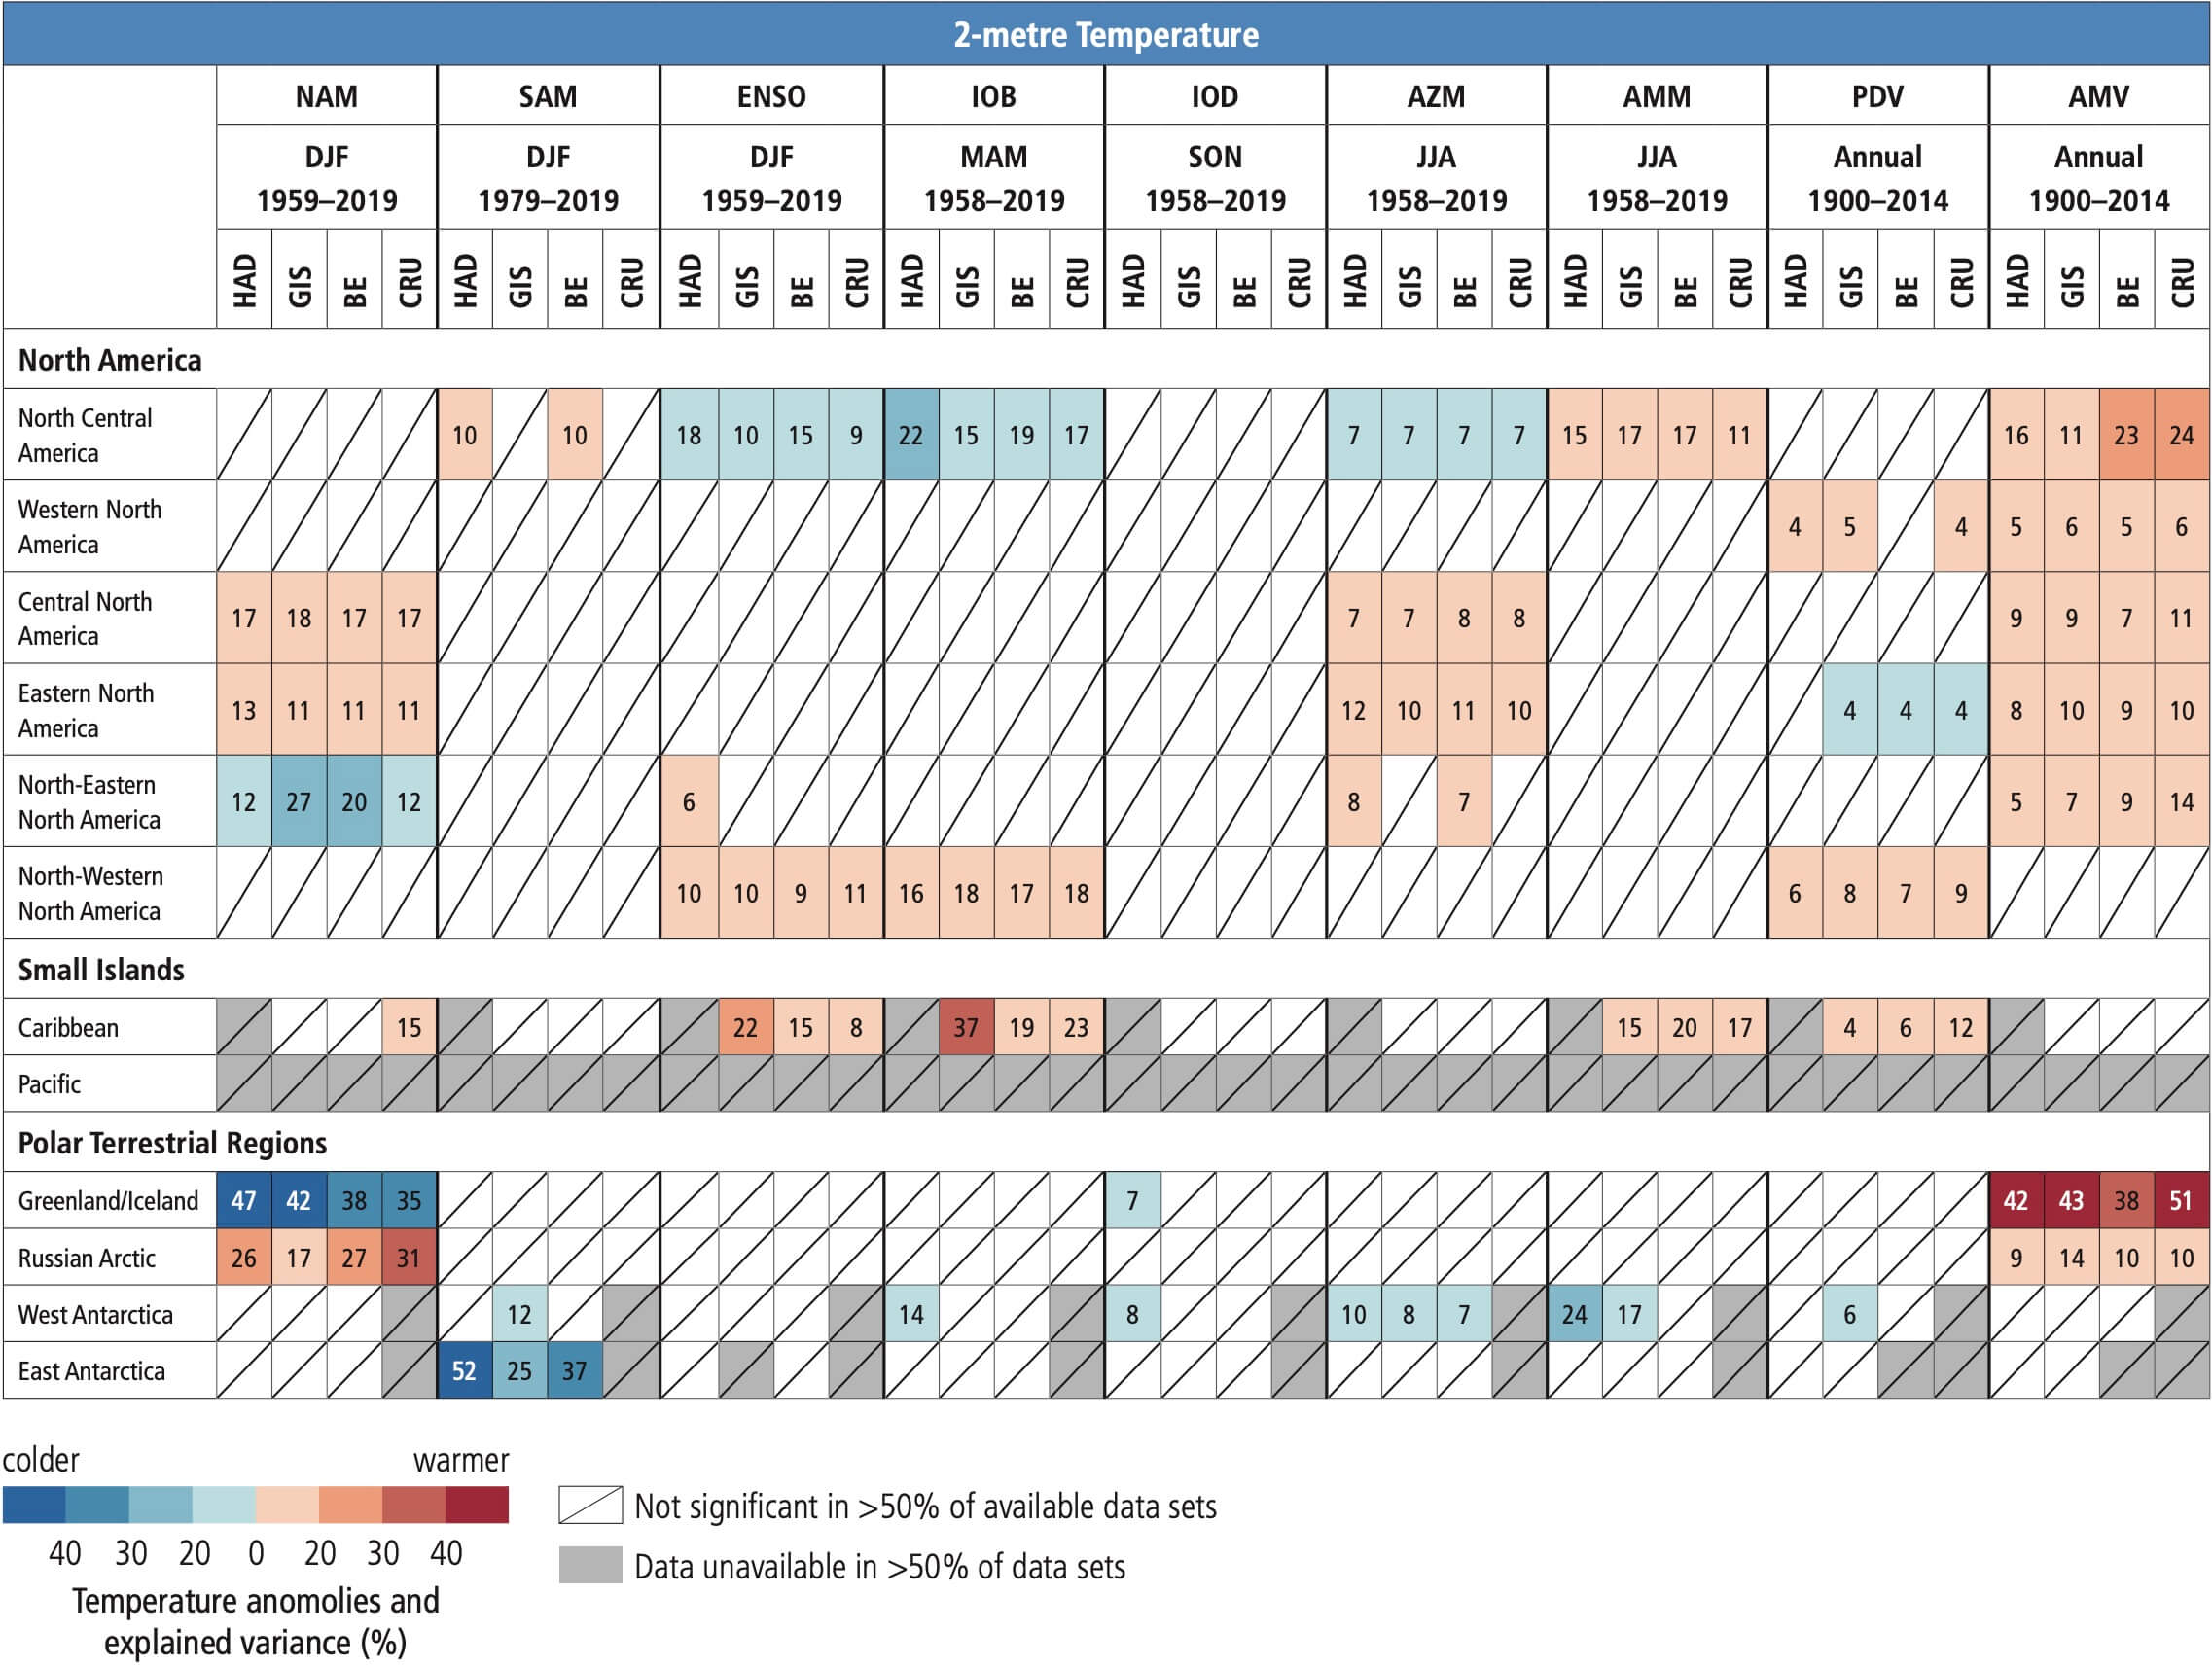
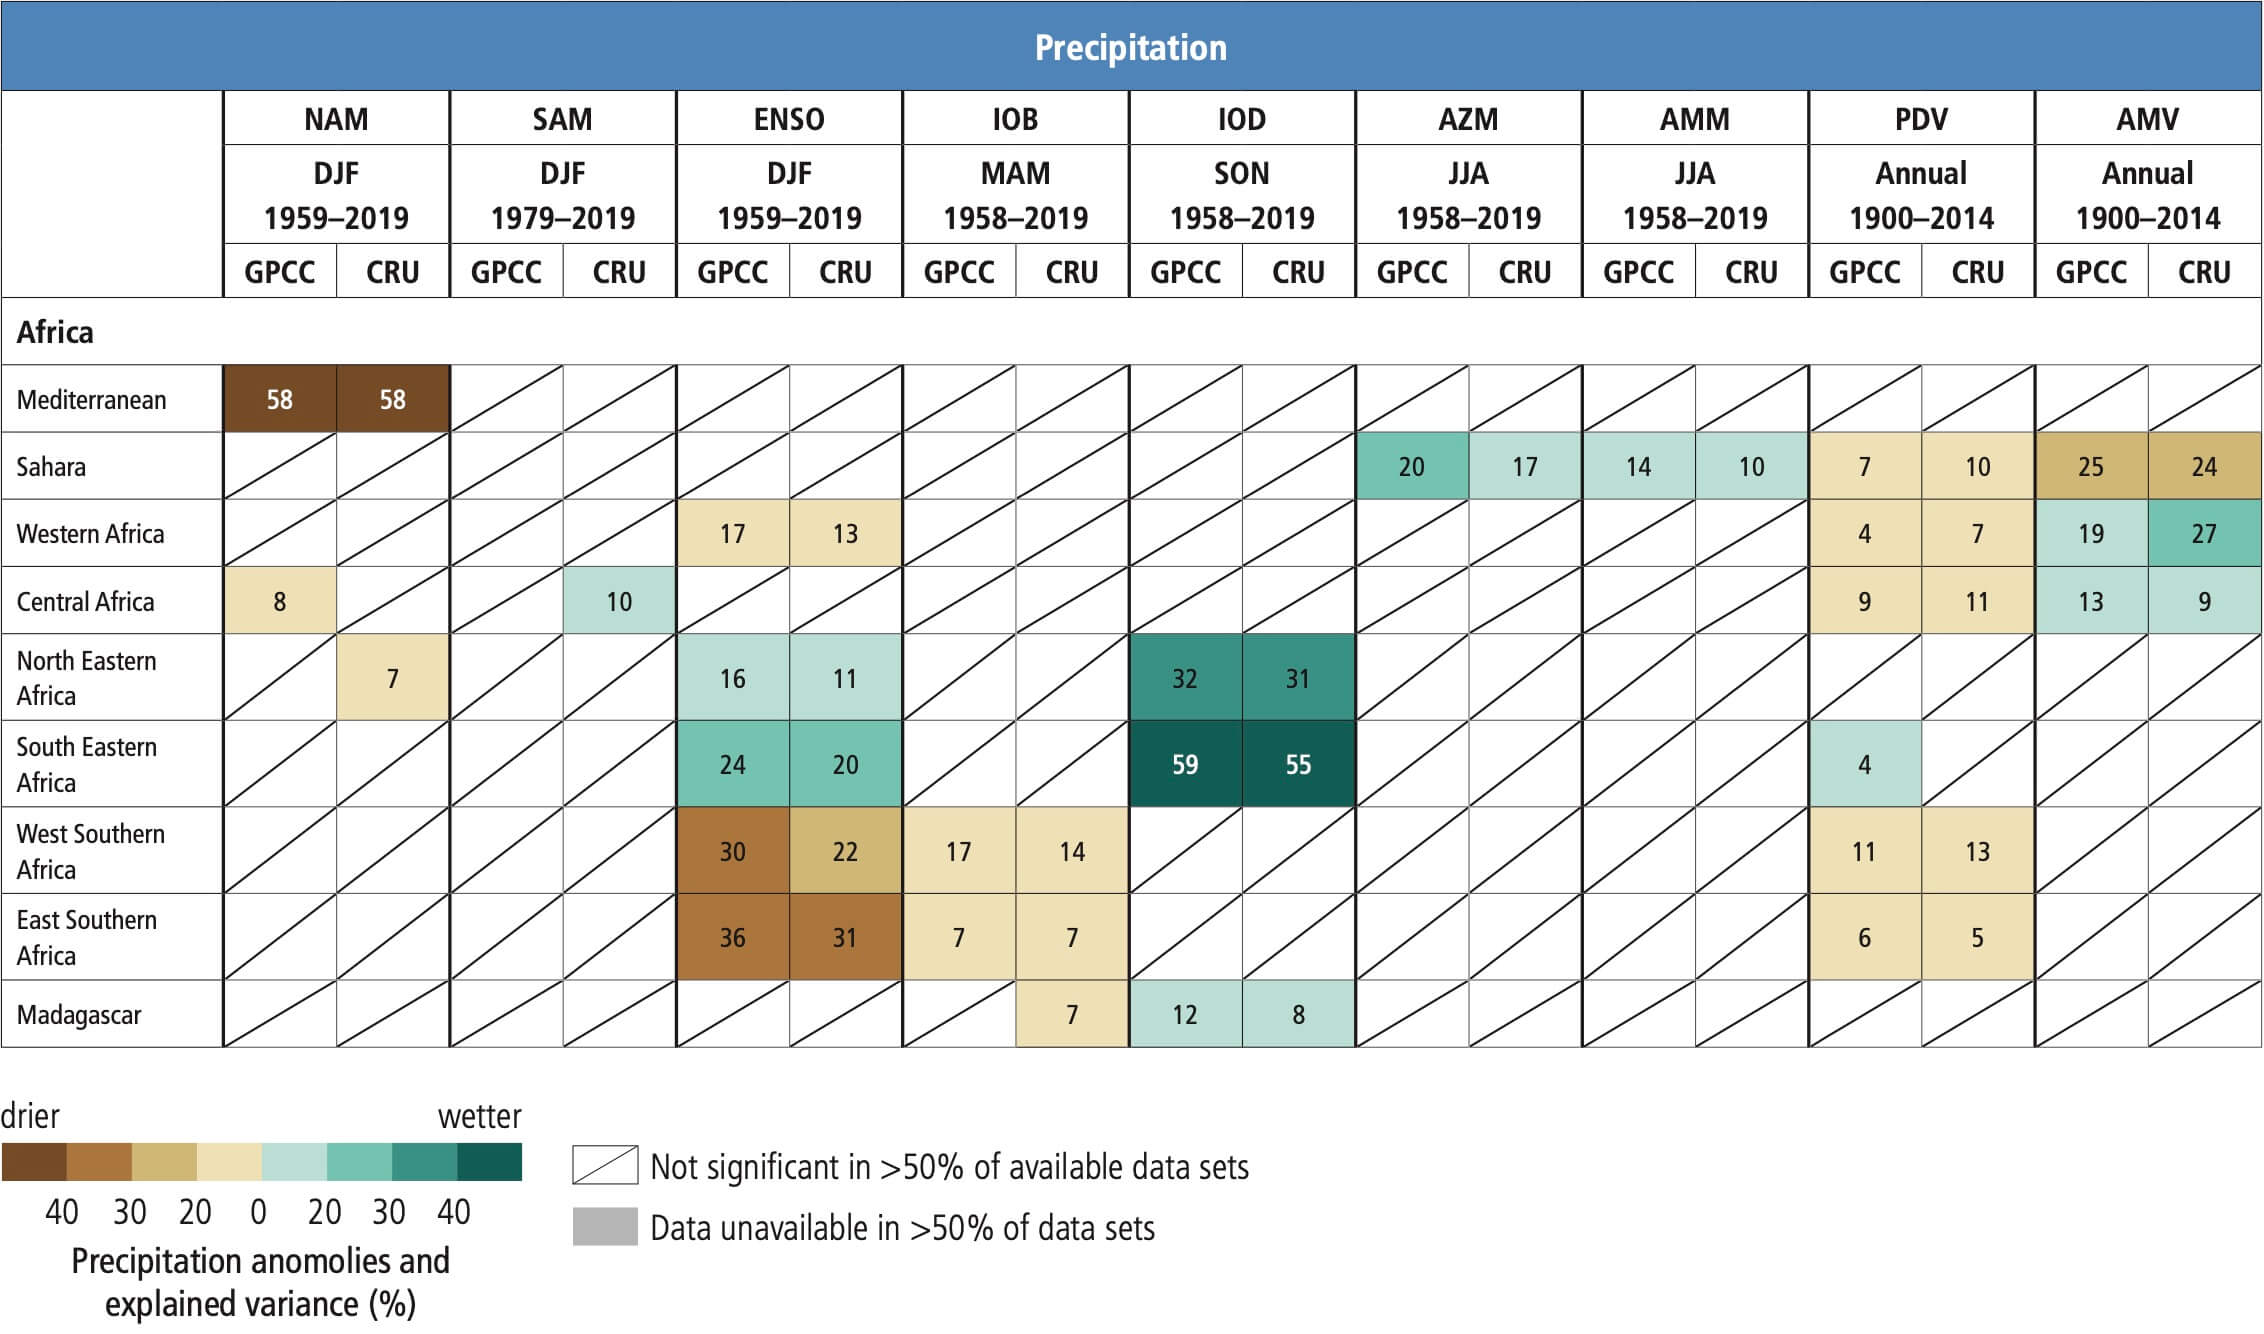
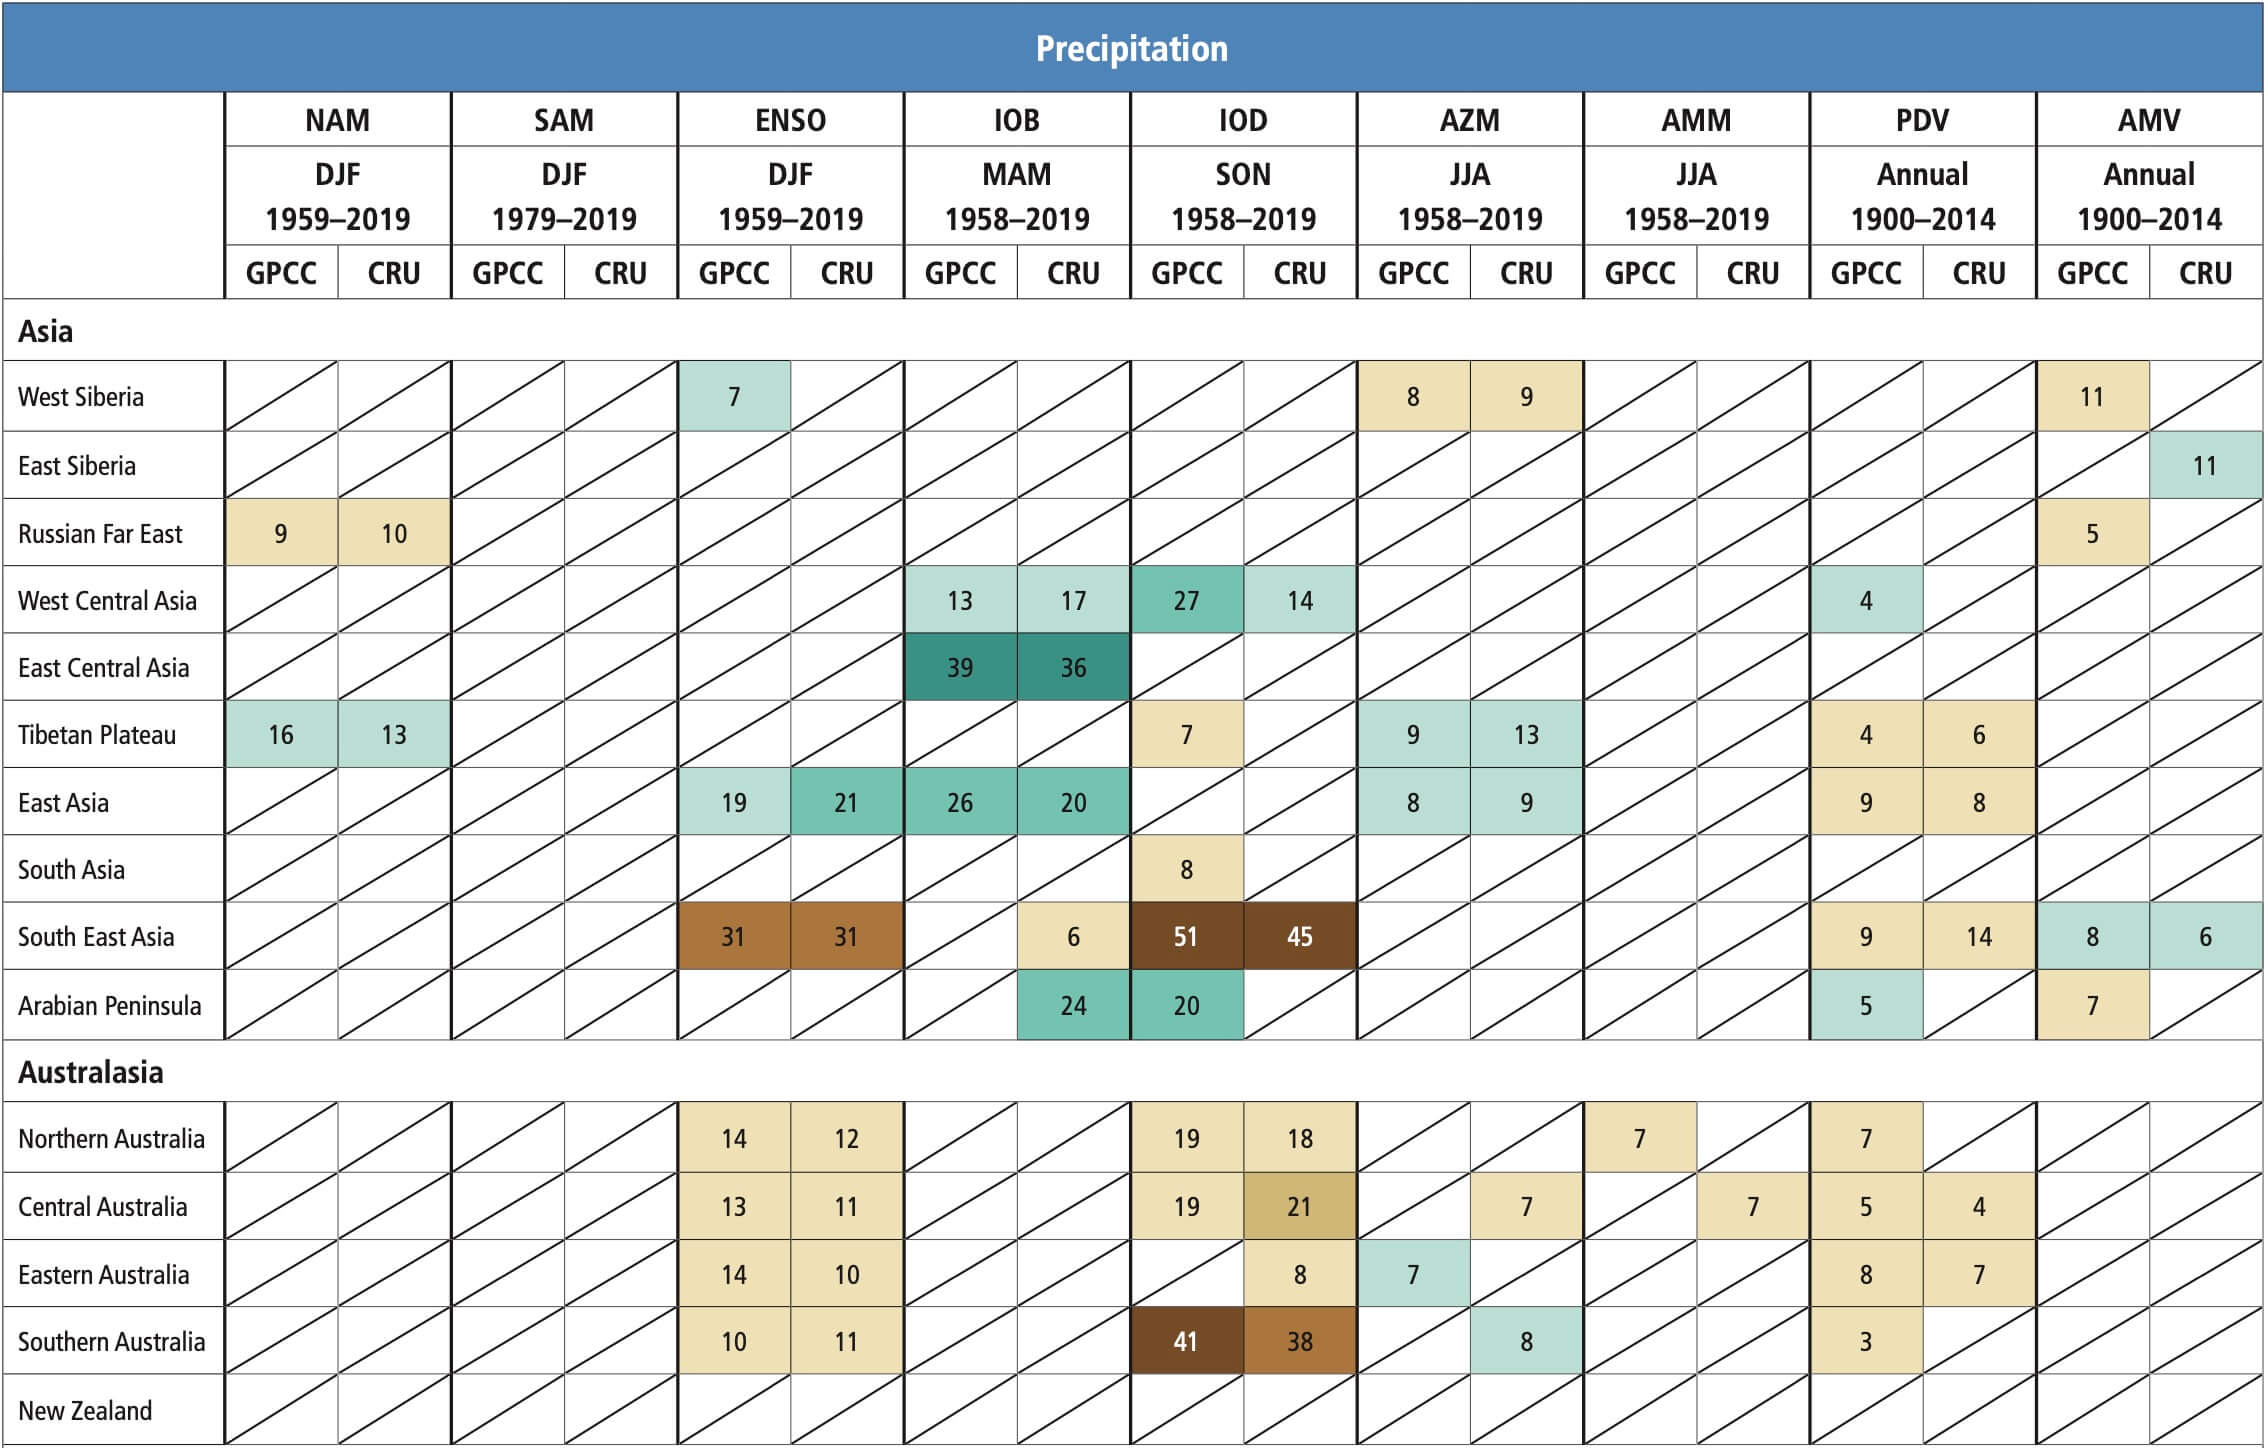
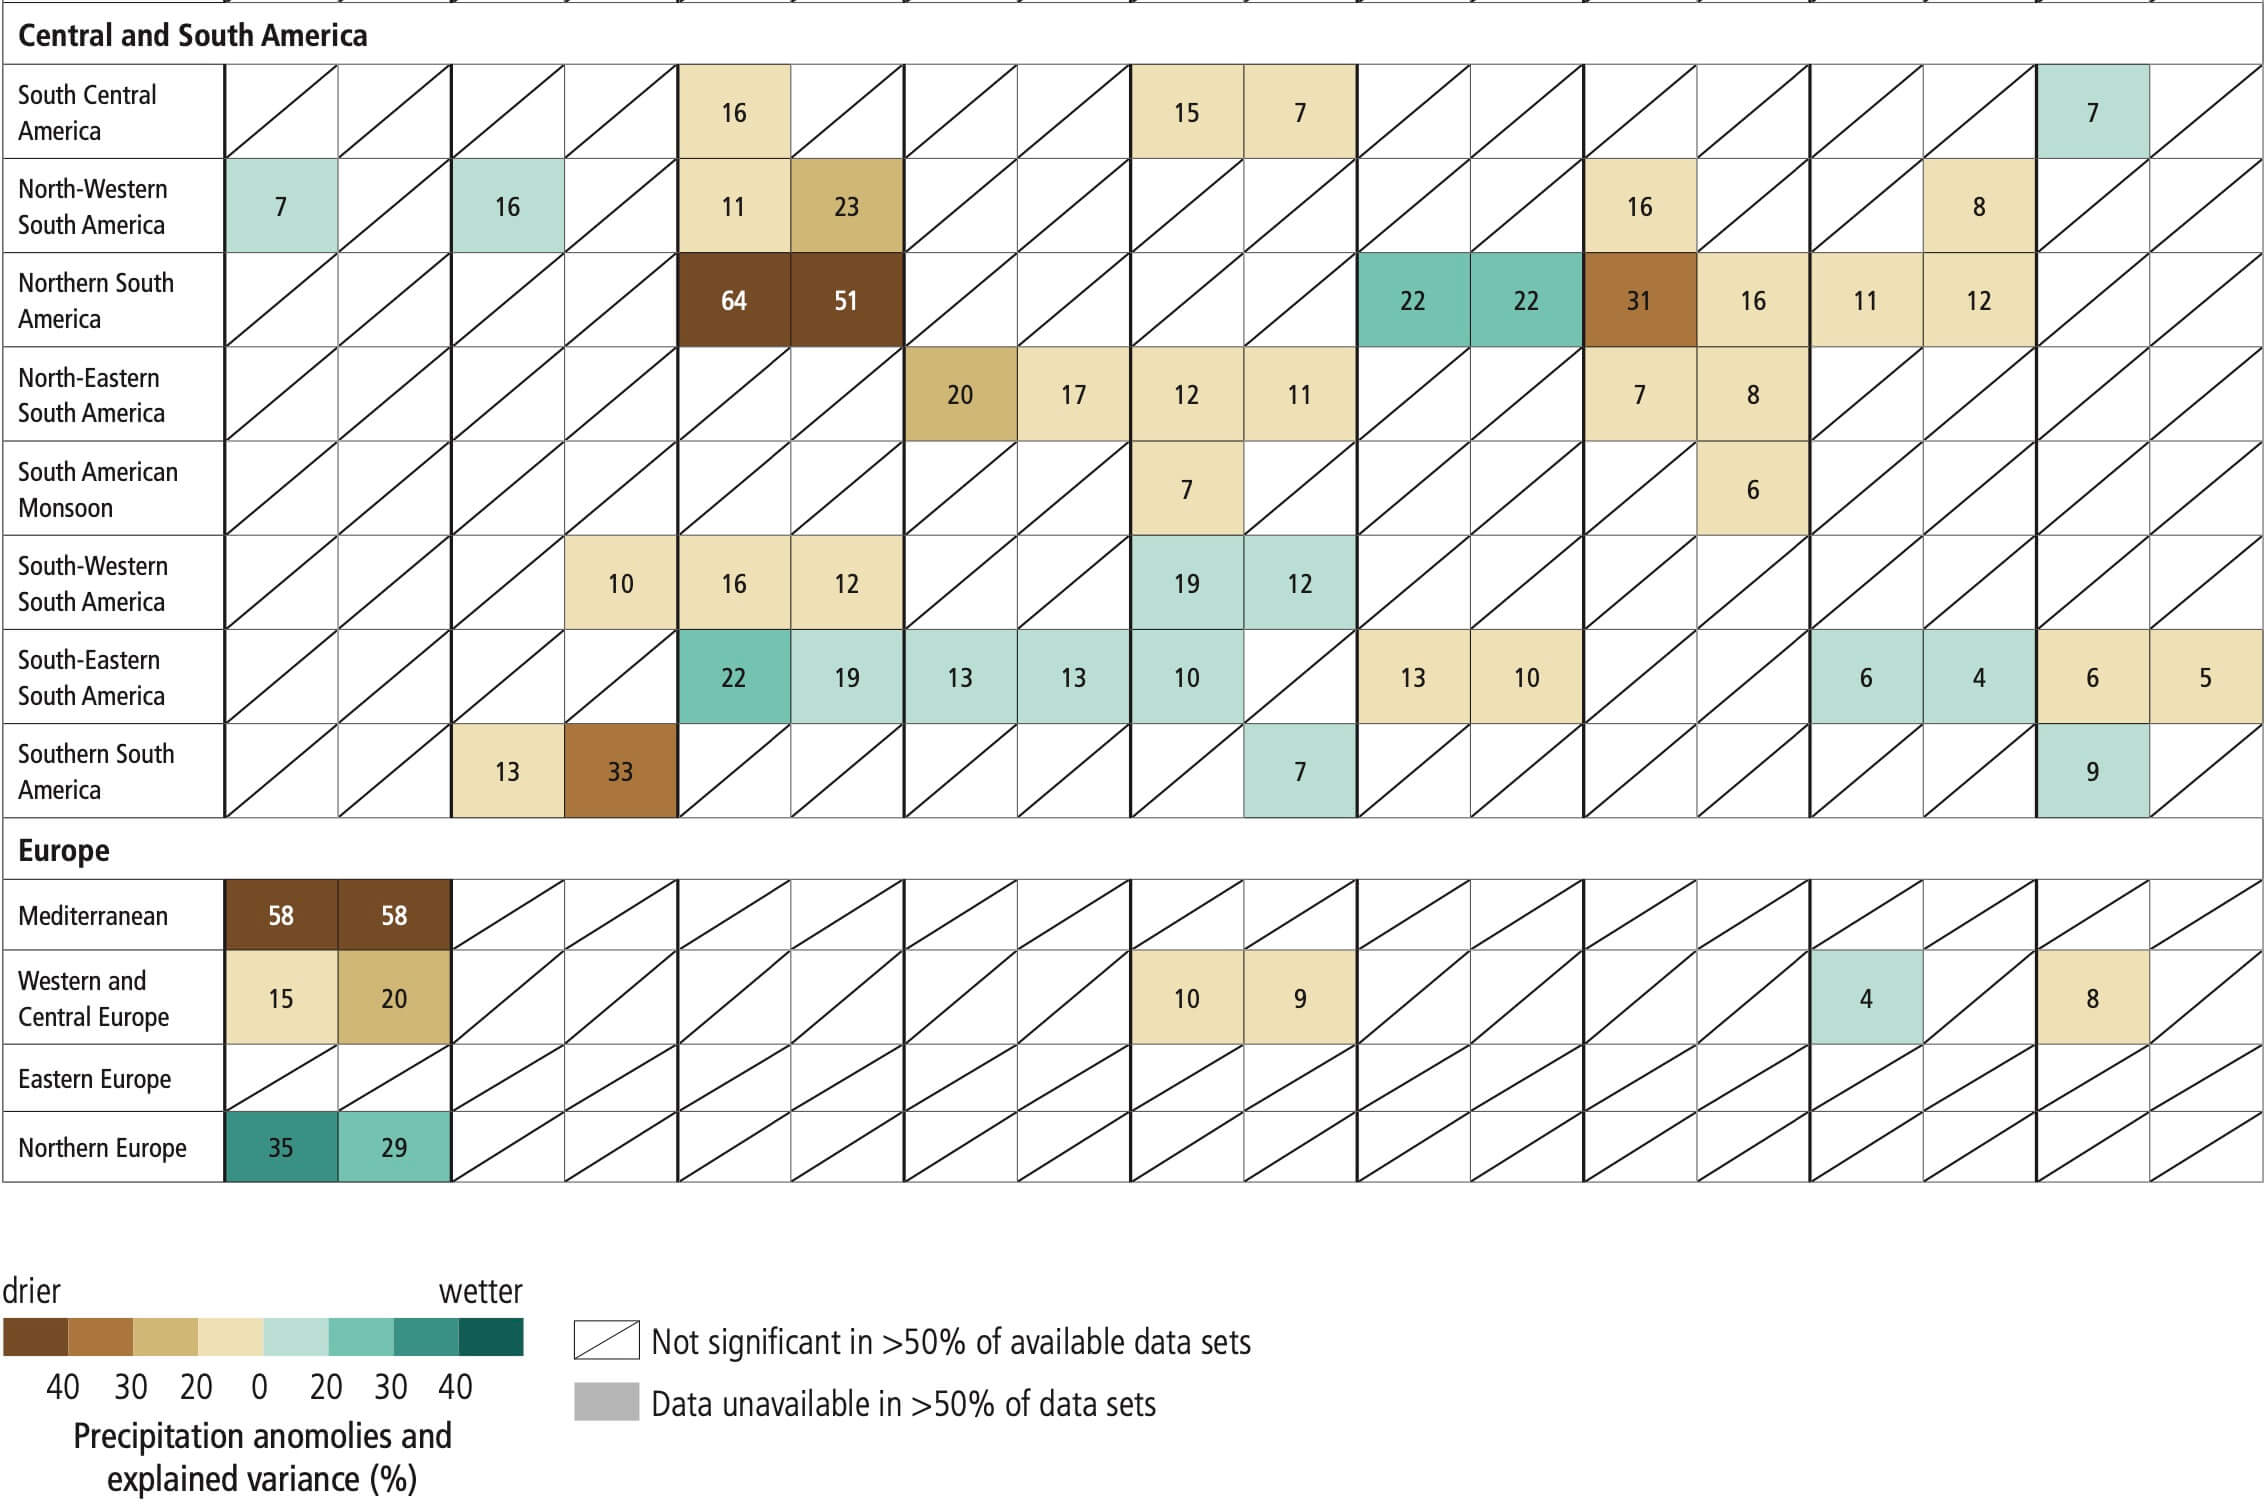
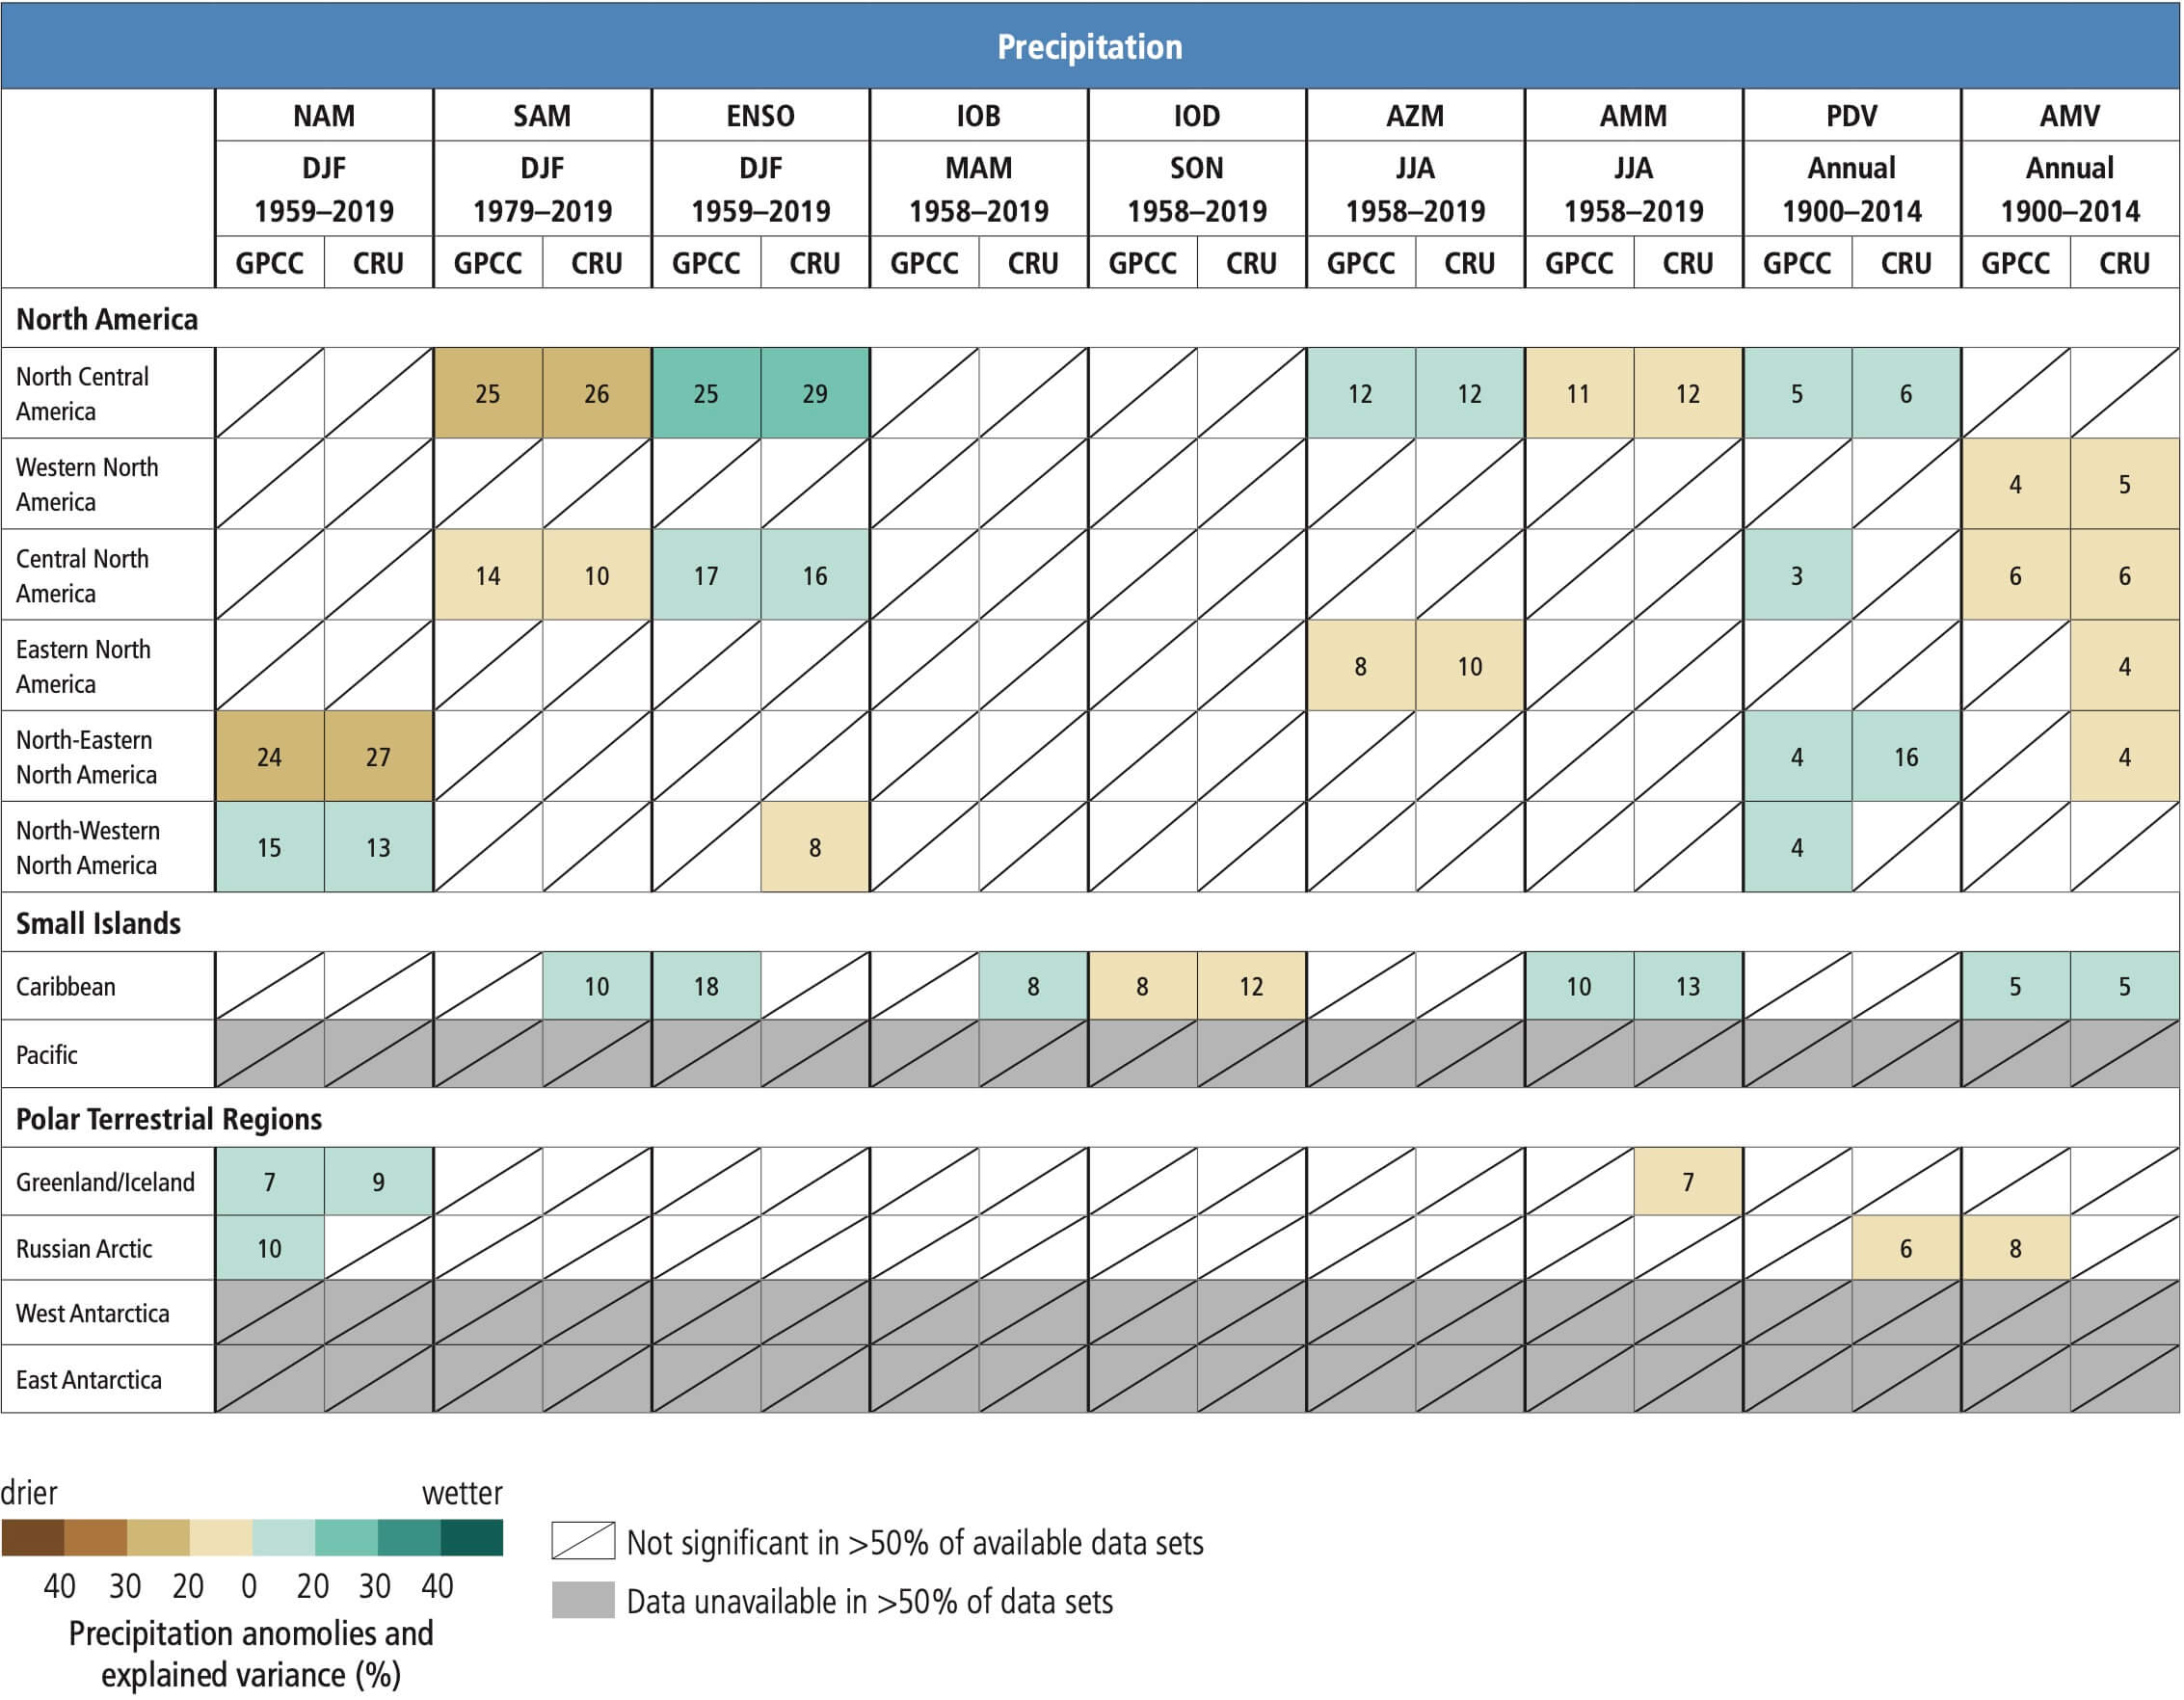
Atlas.3.2 Global Ocean
As with the atmosphere, there are several key ocean-related quantities which are relevant for understanding how climate change may impact human and ecological systems and/or key global indicators of change. These include ocean surface temperature and heat content, sea surface height, sea ice cover and thickness, and certain chemical properties such as ocean acidity and oxygen concentration. For example, there is growing awareness of the threat presented by ocean acidification to ecosystem services and its socio-economic consequences are becoming increasingly apparent and quantifiable (Hurd et al., 2018), and SR1.5 (IPCC, 2018c) noted a significant impact of low levels of global warming on the state of the global oceanic ecosystems and food security. For instance, 70–90% of coral reefs are projected to decline at a warming level of 1.5°C, with larger losses at 2°C.
Thus, because of their importance to coastal populations and infrastructure and ocean ecosystems, the Interactive Atlas focuses on change in sea-surface temperature, sea level and pH. Figure Atlas.1 5 shows projected changes to sea surface temperature (SST) and sea level at the end of the century under SSP1-2.6 and SSP5-8.5 emissions, demonstrating the much larger changes seen with the higher-emissions scenario. The projected changes in sea level show the significantly greater increases, of up to 1 m locally, under a high-emissions future. Regional details of these projected changes under a range of emissions scenarios and time periods can be explored in the Interactive Atlas. An in-depth assessment of these changes is presented in Section 5.3 and Chapter 9.
 Figure Atlas.15 | Projected changes in sea surface temperature (a.b), sea level rise (c,d) for 2081–2100 under SSP1-2.6 (a,c) and SSP5-8.5 (b,d) emissions scenarios compared to a 1995–2014 baseline period from the CMIP6 ensemble. For sea surface temperature, diagonal lines indicate regions where 80% of the models do not agree on the sign of the projected changes. Further details on data sources and processing are available in the chapter data table (Table Atlas.SM.15).
 Atlas.4 Africa
The assessment in this section focuses on changes in average temperature and precipitation (rainfall and snow), including the most recent years of observations, updates to observed datasets, the consideration of recent studies using CMIP5 and those using CMIP6 and CORDEX simulations. Assessment of changes in extremes is in Chapter 11 (Tables 11.4–11.6) and climatic impact-drivers in Chapter 12 (Tables 12.1–12.12).
Atlas.4.1 Key Features of the Regional Climate and Findings from Previous IPCC Assessments
Atlas.4.1.1 Key Features of the Regional Climate
Africa has many varied climates which can be categorized as dry regime in the Saharan region, tropical humid regime in West and East Africa except for parts of the Greater Horn of Africa (alpine) and the Sahel (semi‐arid), and a dry/wet season regime in the northern and southern African region including the Namib and Kalahari deserts; each climate region has its local variations resulting in very high spatial and temporal variations (Peel et al., 2007). Based on the varied climates, nine sub-regions are defined for Africa (Figure Atlas.1 6): the Mediterranean region (MED) including North Africa, Sahara including parts of the Sahel (SAH), West Africa (WAF), Central Africa (CAF), North Eastern Africa (NEAF), South Eastern Africa (SEAF), West Southern Africa (WSAF), East Southern Africa (ESAF) and Madagascar (MDG).
The climatic features that characterize the intra-seasonal and interannual variability of Africa are mainly the Madden–Julian Oscillation (MJO), which is confined to the deep tropics during boreal winter, Pacific Decadal Variability (PDV), and the shift of the Atlantic Inter-tropical Convergence Zone in response to changes in the meridional SST gradient. A positive phase of PDV weakens African monsoons (Figure AIV.8d; Meehl and Hu, 2006), and MJO phase 4 suppresses convection over equatorial Africa (Figure AIV.10a; see Annex IV). Other features influence specific sub-regions. For instance, El Niño events increase precipitation in eastern Africa and decrease precipitation in southern Africa. Over southern Africa there is a strong link between ENSO and droughts (Meque and Abiodun, 2015). The positive phase of the Indian Ocean Dipole (IOD) increases rainfall in eastern tropical Africa in boreal autumn to early winter (Figure AIV.5d), while the negative phase induces the reduction in rainfall. The West African Monsoon is influenced by Atlantic Zonal Mode (AZM) with decreased rainfall over the Sahel and increased rainfall over Guinea (Losada et al., 2010). Positive Atlantic Multi-decadal Variability (AMV) influences positive anomalies all year round over a broad Mediterranean region, including North Africa.
Atlas.4.1.2 Findings From Previous IPCC Assessments
The most recent IPCC reports, AR5 and SR1.5 (Christensen et al., 2013; Hoegh-Guldberg et al., 2018), state that over most parts of Africa, minimum temperatures have warmed more rapidly than maximum temperatures during the last 50 to 100 years (medium confidence). In the same period, minimum and maximum temperatures have increased by more than 0.5°C relative to 1850–1900 (high confidence). While the quality of ground observational temperature measurements tends to be high compared to that of measurements for other climate variables, Africa remains an under-represented region as reported in SR1.5 (Hoegh-Guldberg et al., 2018; IPCC, 2018c). Based on the Coupled Model Intercomparison Project Phase 5 (CMIP5) ensemble and reported in IPCC AR5 and SR1.5, surface air temperatures in Africa are projected to rise faster than the global average increase and are likely to increase by more than 2°C and up to 6°C by the end of the century, relative to the late 20th century, if global warming reaches 2°C (Bindoff et al., 2013; Niang et al., 2014; Hoegh-Guldberg et al., 2018). The higher temperature magnitudes are projected during boreal summer. Southern Africa is likely to exceed the global mean land surface temperature increase in all seasons by the end of the century. Temperature projections for East Africa indicate considerable warming under RCP8.5 where average warming across all models is approximately 4°C by the end of the century. According to SROCC, eastern Africa like other regions with smaller glaciers is projected to lose more than 80% of its glaciers by 2100 under RCP8.5 (medium confidence) (Hock et al., 2019b).
West Africa has also experienced an overall reduction of rainfall over the 20th century, with a recovery towards the last 20 years of the century (Christensen et al., 2013). Over the last three decades rainfall has decreased over East Africa, especially between March and May/June. Projected rainfall changes over Africa in the mid- and late 21st century is uncertain. In regions of high or complex topography such as the Ethiopian Highlands, downscaled projections indicate likely increases in rainfall and extreme rainfall by the end of the 21st century. However, North Africa and the south-western parts of South Africa are likely to have a reduction in precipitation.
The consequence of increased temperature and evapotranspiration, and decreased precipitation amount, in interaction with climate variability and human activities, have contributed to desertification in dryland areas in sub-Saharan Africa (medium confidence) as reported in SRCCL (Mirzabaev et al., 2019).
Atlas.4.2 Assessment and Synthesis of Observations, Trends and Attribution
Figure Atlas.11 shows observed trends in annual mean surface temperature and indicates it has been rising rapidly over Africa from 1961 to 2015 and with significant increases in all regions of 0.1°C–0.2°C per decade and higher over some northern, eastern and south-western regions (high confidence) (see also Interactive Atlas). This is confirmed by an independent analysis performed for a longer period (1961–2018) over areas where long-term homogeneous temperature time series are available (Engelbrecht et al., 2015). More specifically over the Horn of East Africa, the long-term mean annual temperature change between 1930 and 2014 showed two distinct but contrary trends: significant decreases between 1930 and 1969 and increases from 1970 to 2014 (Ghebrezgabher et al., 2016). North Africa has an overall warming in observed seasonal temperature (Barkhordarian et al., 2012; Lelieveld et al., 2016) with positive trends in annual minimum and maximum temperatures (Vizy and Cook, 2012). Temperatures over West Africa have increased over the last 50 years (Mouhamed et al., 2013; Niang et al., 2014) with a spatially variable warming reaching 0.5°C per decade from 1983 to 2010 (Sylla et al., 2016). West Africa has also experienced a decrease in the number of cool nights, as well as more frequent warm days and warm spells (Mouhamed et al., 2013; Ringard et al., 2016). Similarly, East Africa has experienced a significant increase in temperature since the beginning of the early 1980s (Anyah and Qiu, 2012) with an increase in seasonal mean temperature. Over South Africa, positive trends were found in the annual mean, maximum and minimum temperatures for 1960–2003 in all seasons, except for the central interior (Kruger and Shongwe, 2004; Zhou et al., 2010; Collins, 2011; Kruger and Sekele, 2013; MacKellar et al., 2014), where minimum temperatures have decreased significantly (MacKellar et al., 2014). Within inland southern Africa, minimum temperatures have increased more rapidly than maximum temperatures (New et al., 2006).
Most areas lack enough observational data to draw conclusions about trends in annual precipitation over the past century. In addition, many regions of Africa have discrepancies between different observed precipitation datasets (Sylla et al., 2013; Panitz et al., 2014). A statistically significant (95% confidence level) decrease in rainfall and the number of rainy days is reported in autumn over the eastern, central and north-eastern parts of South Africa in spring and summer during 1960–2010 (MacKellar et al., 2014; Kruger and Nxumalo, 2017). Central Africa has experienced a significant decrease in total precipitation, which is likely associated with a significant decrease of the length of the maximum number of consecutive wet days (Aguilar et al., 2009). Furthermore, rainfall decreased significantly in the Horn of Africa (Tierney et al., 2015) with the largest reductions during the long rains season from March to May (Lyon and DeWitt, 2012; Viste et al., 2013; Rowell et al., 2015). Over mountainous areas significant increases are found in the number of rain days around the southern Drakensberg in spring and summer during the period 1960–2010 (MacKellar et al., 2014). Similarly, southern West Africa is observed to have had more intense rainfall from 1950 to 2014 during the second rainy season of September to November (Nkrumah et al., 2019). The Sahel region also had more intense rainfall throughout the rainy season (Panthou et al., 2014, 2018a, b; Sanogo et al., 2015; Gaetani et al., 2017; Taylor et al., 2017; Biasutti, 2019) during the period 1980–2010. Southern African rainfall shows a significant downtrend of –0.013 mm day–1year–1in recent decades and –0.003 mm day–1year–1for longer periods during 1900–2010 (low confidence) (Jury, 2013).
Temperature increases over Africa in the 20th century can be attributed to the strong evidence of a continent-wide anthropogenic signal in the warming (Figure 3.9; Hoerling et al., 2006; Min and Hense, 2007; Stott et al., 2010, 2011; Niang et al., 2014). More specifically over West Africa, the clear emergence of temperature change (Figure Atlas.11) is due to the relatively small natural climate variability in the region which generates narrow climate bounds that can be easily surpassed by relatively small climate changes (Niang et al., 2014). Warming over North Africa is largely due to anthropogenic climate forcing (Knippertz et al., 2003; Barkhordarian et al., 2012; Diffenbaugh et al., 2017).
The drying observed over the Sahel in the 1960s to 1970s has been attributed to warming of the South Atlantic SST and southern African drying as a response to Indian Ocean warming (Hoerling et al., 2006; Dai, 2011). Enhanced rainfall intensity since the mid-1980s over the Sahel (Maidment et al., 2015; Sanogo et al., 2015) is associated with increased greenhouse gases suggesting an anthropogenic influence (medium confidence) (Biasutti, 2019). In the last decade, the changes in the timing of onset and cessation of rainfall over Africa have been linked to changes in the progression of the tropical rainband and the Saharan heat low (Dunning et al., 2018; Wainwright et al., 2019). Moreover, later onset and earlier cessation of eastern Africa rainfall is associated with a delayed and then faster movement of the tropical rainband northwards during the boreal spring and northward shift of the Saharan heat low (Wainwright et al., 2019), driven by anthropogenic carbon emissions and changing aerosol forcings (medium confidence). Over East Africa, the drying trend is associated with an anthropogenic-forced relatively rapid warming of Indian Ocean SSTs (Williams and Funk, 2011; Hoell et al., 2017); a shift to warmer SSTs over the western tropical Pacific and cooler SSTs over the central and eastern tropical Pacific (Lyon and DeWitt, 2012); multi-decadal variability of SSTs in the tropical Pacific, with cooling in the east and warming in the west (Lyon, 2014); and the strengthening of the 200-mb easterlies (Liebmann et al., 2017). However, decadal natural variability from SST variations over the Pacific Ocean has also been associated with the drying trend of East Africa (Wang et al., 2014; Hoell et al., 2017) with an anthropogenic-forced rapid warming of Indian Ocean SSTs (medium confidence).
Atlas.4.3 Assessment of Model Performance
Model development has advanced in the world, but Africa still lags as a focus and in its contribution (James et al., 2018). None of the current generation of global climate models (GCMs) was developed in Africa (Watterson et al., 2014), and the relevant processes in the continent have not been the priority for model development but treated in a one-size-fit-all approach (James et al., 2018) except for a few studies that focused on convective-permitting climate projections (Stratton et al., 2018; Kendon et al., 2019). However, there are growing efforts to boost African climate science by running and evaluating climate models over Africa (Endris et al., 2013; Kalognomou et al., 2013; Gbobaniyi et al., 2014; Engelbrecht et al., 2015; Klutse et al., 2016; Gibba et al., 2019).
The CMIP project previously did not result in improved performance for Africa (Flato et al., 2013; Rowell, 2013; Whittleston et al., 2017) and culling ensembles based on existing metrics for Africa fails to reduce the range of uncertainty in precipitation projections (Roehrig et al., 2013; Yang et al., 2015; Rowell et al., 2016), but biases over Africa are lower in CMIP6 compared to CMIP5 (Almazroui et al., 2020c). Nonetheless, the CMIP5 ensemble has been evaluated over Africa to advance its application for climate research (Biasutti, 2013; Rowell, 2013; Dike et al., 2015; McSweeney and Jones, 2016; Onyutha et al., 2016; Wainwright et al., 2019) as has, more recently, the CMIP6 ensemble (Almazroui et al., 2020c).
Coordinated Regional Downscaling Experiment (CORDEX) regional climate models have been widely evaluated over Africa. They capture the occurrence of the West African Monsoon jump and the timing and amplitude of the mean annual cycle of precipitation and temperature over the homogeneous sub-regions of West Africa (Gbobaniyi et al., 2014), simulate eastern Africa rainfall adequately (Endris et al., 2013), and over southern Africa capture the observed climatological spatial patterns of extreme precipitation (Pinto et al., 2016). They also effectively simulate the phasing and amplitude of monthly rainfall evolution and the spatial progression of the wet season onset over southern Africa (Shongwe et al., 2015). However, discrepancies and biases in present-day rainfall are reported over Uganda from the RCM-simulated rainfall compared to three gridded observational datasets (Kisembe et al., 2019). Specifically, they reported that the CORDEX models underestimate the annual rainfall in Uganda and struggle to reproduce the variability of the long and short rainy seasons.
Atlas.4.4 Assessment and Synthesis of Projections
Research over Africa has improved since AR5, and although SR1.5 (de Coninck et al., 2018) has synthesized new information for the continent, there is still not enough literature on specific areas for assessment. CMIP5 and CMIP6 projections (Figure Atlas.1 6) are for continued warming, with median projected regional warming for 2080–2100 compared to 1995–2014 of between 1°C and 2°C under SSP1-2.6/RCP2.6 emissions and exceeding 4°C and in some regions 5°C under SSP5-8.5/RCP8.5 emissions. The central interiors of southern and northern Africa are likely to warm faster than equatorial and tropical regions (Interactive Atlas). Projections from CMIP5 show that East Africa is likely to warm by 1.7°C–2.8°C and 2.2°C–5.4°C under the RCP4.5 and RCP8.5 scenarios respectively in the period 2071–2100 relative to 1961–1990 (Ongoma et al., 2018). Over southern Africa, areas in the south-western region of the sub-continent, covering South Africa and parts of Namibia and Botswana, are projected to experience the largest increase in temperature, which are expected to be greater than the global mean warming (Maúre et al., 2018). A large ensemble of CORDEX Africa simulations have been used to project the impact of 1.5°C and 2°C GWLs (Klutse et al., 2018; Lennard et al., 2018; Maúre et al., 2018; Mba et al., 2018; Nikulin et al., 2018; Osima et al., 2018). While a few studies addressed the whole African continent (Lennard et al., 2018; Nikulin et al., 2018), some focused on specific regions of Africa (Diedhiou et al., 2018; Klutse et al., 2018; Kumi and Abiodun, 2018; Maúre et al., 2018; Mba et al., 2018). CORDEX simulations project robust warming over Africa in excess of the global mean (Lennard et al., 2018; Nikulin et al., 2018), and over West Africa the magnitude of regional warming reaches the 2080–2100 global warming level one to two decades earlier (Mora et al., 2013; Niang et al., 2014; Sylla et al., 2016; Klutse et al., 2018). Temperature increases projected under RCP8.5 over Sudan and northern Ethiopia imply that the Greater Horn of Africa would warm faster than the global mean relative to 1971–2000 (Osima et al., 2018). Over North Africa, summer mean temperatures from CORDEX, CMIP5 (RCP8.5) and CMIP6 (SSP5-8.5) are projected to increase beyond 6°C by the end of the century with respect to the period 1970–2000 (Schilling et al., 2012; Ozturk et al., 2018; Almazroui et al., 2020c), see also the Interactive Atlas. Note that results for the CORDEX-AFR over the Mediterranean (MED) are consistent with those reported from the CORDEX-EUR dataset (Figure Atlas.24; Section Atlas.1.3), in agreement with Legasa et al. (2020).
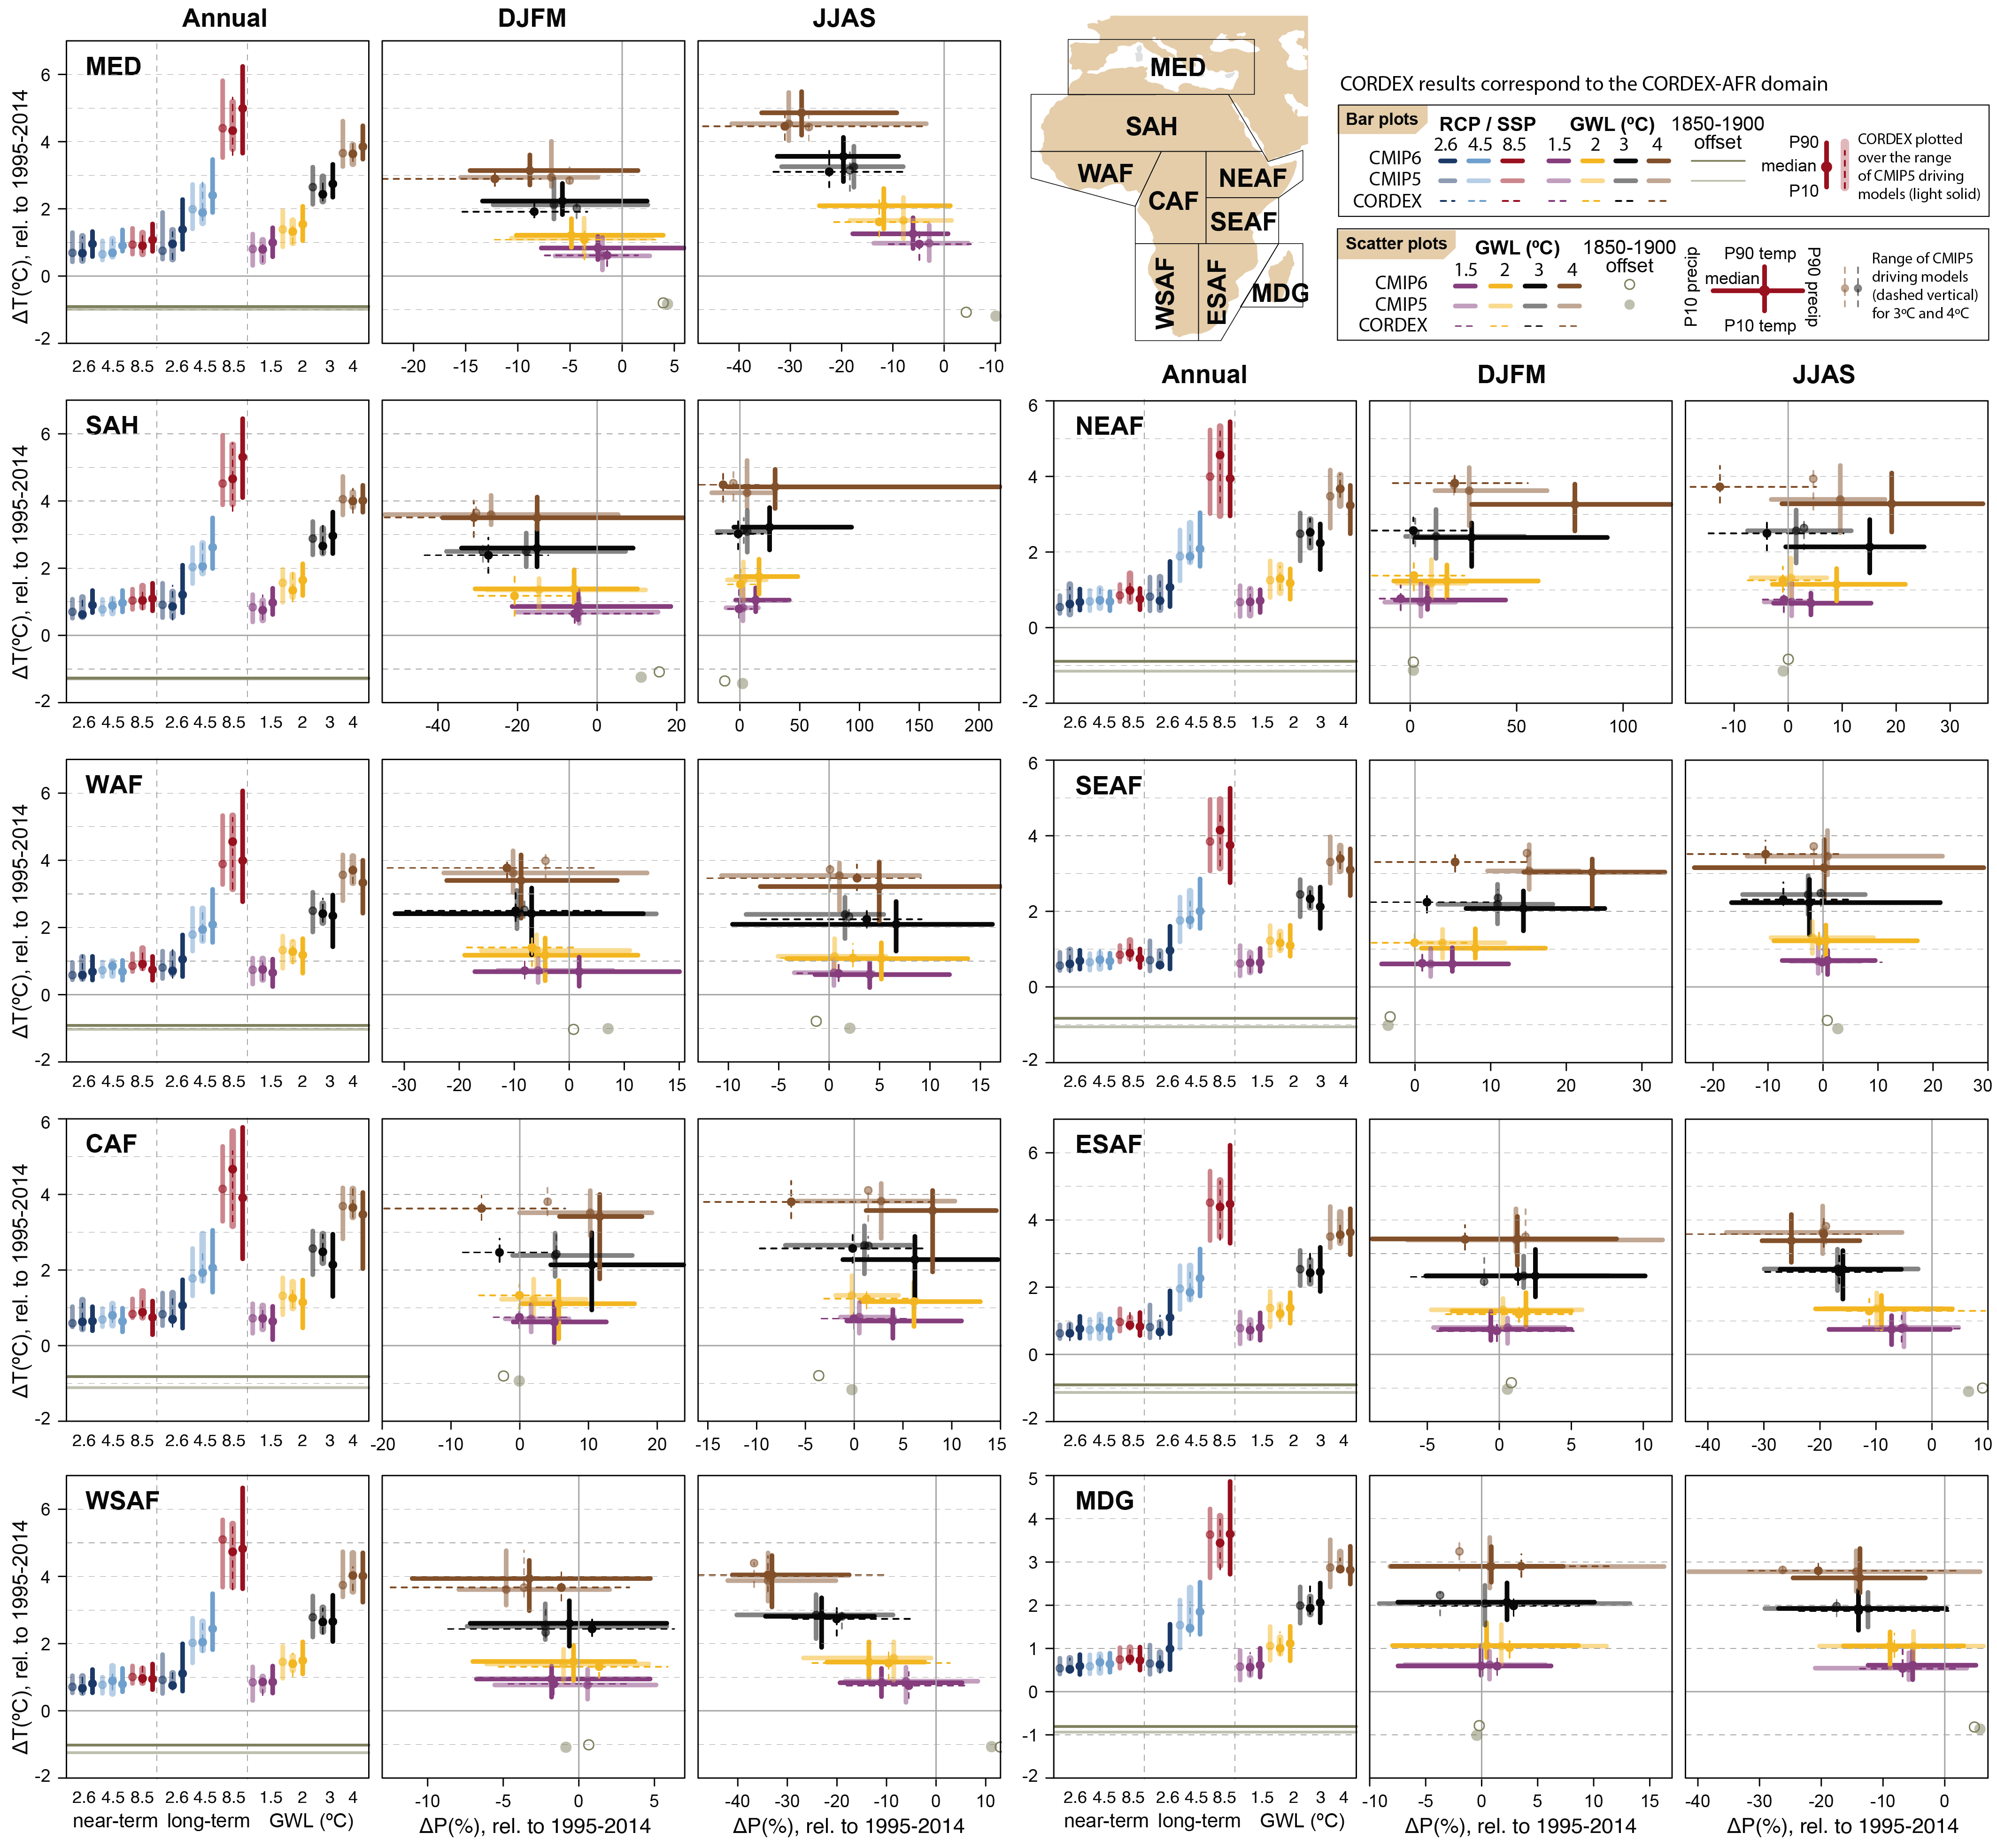 Figure Atlas.16 | Regional changes over land in annual mean surface air temperature and precipitation relative to the 1995–2014 baseline for the reference regions in Africa (warming since the 1850–1900 pre-industrial baseline is also provided as an offset). Bar plots in the left panel of each region triplet show the median (dots) and 10th–90th percentile range (bars) across each model ensemble for annual mean temperature changes for four datasets (CMIP5 in intermediate colours; a subset of CMIP5 used to drive CORDEX in light colours; CORDEX overlying the CMIP5 subset with dashed bars; and CMIP6 in solid colours); the first six groups of bars represent the regional warming over two time periods (near-term 2021–2040 and long-term 2081–2100) for three scenarios (SSP1-2.6/RCP2.6, SSP2-4.5/RCP4.5 and SSP5-8.5/RCP8.5), and the remaining bars correspond to four global warming levels (GWLs: 1.5°C, 2°C, 3°C and 4°C). The scatter diagrams of temperature against precipitation changes display the median (dots) and 10th–90th percentile ranges for the above four warming levels for December–January–February–March (DJFM; middle panel) and June–July–August–September (JJAS; right panel), respectively; for the CMIP5 subset only the percentile range of temperature is shown, and only for 3°C and 4°C GWLs. Changes are absolute for temperature (in °C) and relative (as %) for precipitation. See Atlas.1.3 for more details on reference regions (Iturbide et al., 2020) and Atlas.1.4 for details on model data selection and processing. The script used to generate this figure is available online (Iturbide et al., 2021) and similar results can be generated in the Interactive Atlas for flexibly defined seasonal periods. Further details on data sources and processing are available in the chapter data table (Table Atlas.SM.15).
 Projected rainfall changes over Africa in the mid- and late 21st century are uncertain in many regions, highly variable spatially and with differing levels of model agreements (Figure Atlas.1 6) though with robust projections of decreases in MED and WSAF and increases in NEAF and SEAF by 2080–2100 under high emissions (Interactive Atlas). Some uncertainties are reported over parts of Africa from CORDEX projections (Dosio and Panitz, 2016; Endris et al., 2016; Klutse et al., 2018). For example, large uncertainties are associated with projections at 1.5°C and 2°C of global warming over Central Africa (Mba et al., 2018) and over the Sahel (Gbobaniyi et al., 2014; Sylla et al., 2016). Over southern Africa, enhanced warming is projected to result in a reduction in mean rainfall across the region (Maúre et al., 2018), and in particular over the Limpopo basin and smaller areas of the Zambezi basin in Zambia, and also in parts of the Western Cape in South Africa, under a global warming of 2°C. The projections of reduced precipitation in summer rainfall regions of southern Africa are associated with delayed wet season onset in spring (Dunning et al., 2018) due to a northward shift and delayed breakdown of the Congo Air Boundary (Howard and Washington, 2020). However, projected rainfall intensity over southern Africa is likely to increase and be magnified under RCP8.5 compared with RCP4.5 for the period 2069–2098 relative to the reference period 1976–2005 (Pinto et al., 2018). For West Africa, rainfall projection is uncertain because of the contrasting signals from models (Dosio et al., 2019). Nonetheless, West Africa river basin-scale irrigation potential would decline under 2°C of global warming even for areas where water availability increases (Sylla et al., 2018). The western and eastern Sahel are projected as hotspots for delayed rainfall onset dates of about four days and six days causing reduced length of rainy season in the 1.5°C–2°C warmer climates under RCP4.5 and RCP8.5 scenarios (Kumi and Abiodun, 2018). Projected delay in rainfall cessation dates and a longer length of rainy season over the western part of the Guinea coast is likely under the same scenarios (Figure Atlas.1 6; Sellami et al., 2016; Kumi and Abiodun, 2018). There is a tendency towards an increase in annual mean precipitation over central Sahel and eastern Africa (Interactive Atlas, Figure Atlas.1 6, (Nikulin et al., 2018), especially over the Ethiopian Highlands with up to 0.5 mm day–1 (Osima et al., 2018).
Atlas.4.5 Summary
The rate of surface temperature increase has generally been more rapid in Africa than the global average and by at least 0.1°C–0.2°C during 1961–2015 (high confidence). Minimum temperatures have increased more rapidly than maximum temperatures over inland southern Africa (medium confidence). Since 1970, mean temperature over East Africa has shown an increasing trend but showed a decreasing trend in the previous 40 years (medium confidence).
The Horn of Africa has experienced significantly decreased rainfall during the long rains season from March to May (high confidence) and drying trends in this and other parts of Africa are attributable to oceanic influences (high confidence), resulting from both internal variability and anthropogenic causes. Drying over the Sahel in the last century was attributed to an increase in the South Atlantic SST and more recently over southern African as a response to anthropogenic-forced Indian Ocean warming. Drying over East Africa is associated with decadal natural variability in SSTs over the Pacific Ocean. The enhanced rainfall intensity over the Sahel in the last two decades is associated with increased greenhouse gases indicating an anthropogenic influence (medium confidence).
Relative to the late 20th century, annual mean temperature over Africa is projected to rise faster than the global average (very high confidence) with the increase likely to exceed 4°C by the end of the century under RCP8.5 emissions. The central interiors of southern and northern Africa are likely to warm faster than equatorial and tropical regions (high confidence).
There are contrasting signals in the projections of rainfall over some parts of Africa until the end of the 21st century (high confidence) though changes in any given region are generally projected with medium confidence. In regions of high or complex topography such as the Ethiopian Highlands, downscaled projections indicate increases in rainfall by the end of the 21st century. However, northern Africa and the south-western parts of South Africa are likely to have a reduction in precipitation under higher warming levels (high confidence). Over Western Africa, rainfall is projected to decrease in the western Sahel sub-region (medium confidence) and increase in the central Sahel sub-region (low confidence) and along the Guinea coast sub-region (medium confidence). Rainfall amounts are projected to increase over Eastern Africa (medium confidence). Southern Africa is projected to have a reduction in annual mean rainfall but increases in rainfall intensity by 2100 (medium confidence).
Atlas.5 Asia
The assessment in this section focuses on changes in average temperature and precipitation (rainfall and snow), including the most recent years of observations, updates to observed datasets, the consideration of recent studies using CMIP5 and those using CMIP6 and CORDEX simulations. Assessment of changes in extremes is in Chapter 11 (Tables 11.7–11.9) and climatic impact-drivers in Chapter 12 (Table 12.4). It covers most Asian territories of the region (Figure Atlas.1 7) with the exception of the Russian Arctic (RAR), which is assessed as part of the Arctic in Section 11.2. These include West and East Siberia (WSB, ESB) and the Russian Far East (RFE) in the north; West and East Central Asia (WCA, ECA), the Tibetan Plateau (TIB) and East Asia (EAS); and the Arabian Peninsula (ARP), South and South East Asia (SAS, SEA) in the south. Figure Atlas.1 7 supports the assessment of regional mean changes in annual mean surface air temperature and precipitation over Asia. Due to the high climatological and geographical heterogeneity of Asia, the assessment is performed over five sub-continental areas: East Asia (EAS and ECA), North Asia (WSB, ESB and RFE), South Asia (SAS), South East Asia (SEA) and South West Asia (ARP and WCA) with the Tibetan Plateau (TIB) being relevant and thus referred to in both the East and South Asia assessments. Note also TIB forms a major part of the Hindu Kush Himalaya region, which is assessed in Cross-Chapter Box 10.4, and relevant findings are summarized and cross-referenced in the East and South Asia sections below.
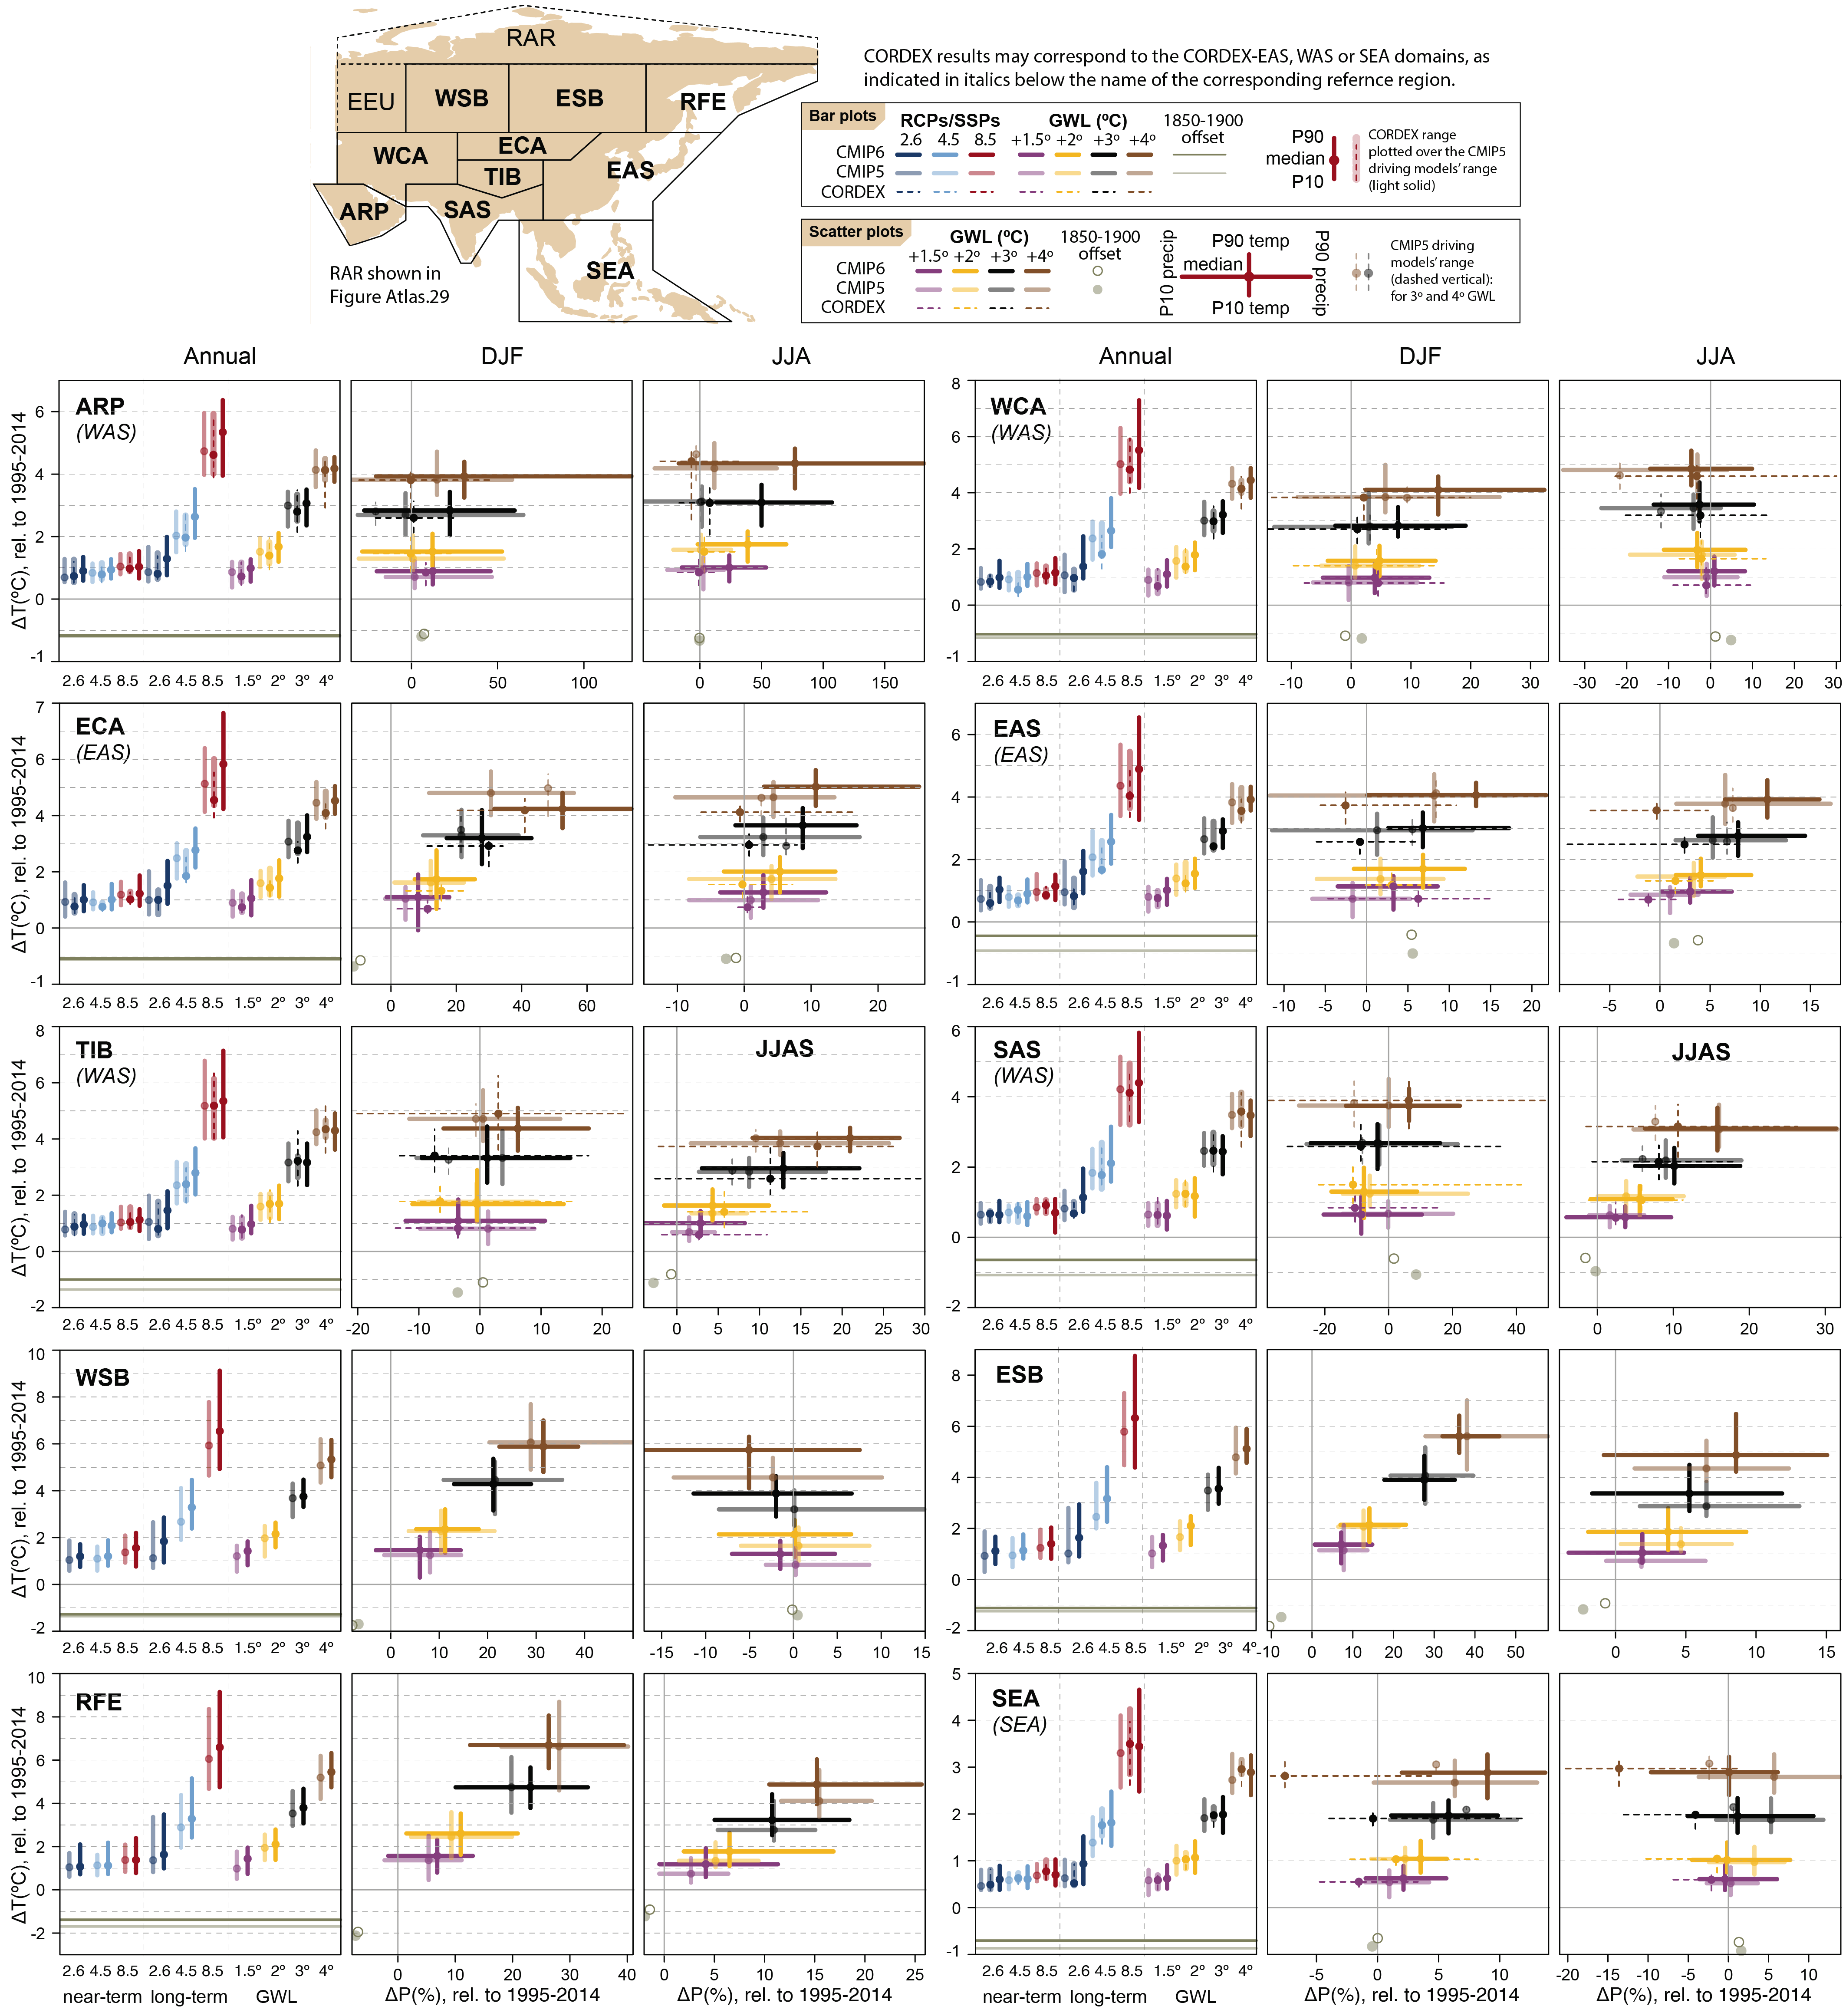 Figure Atlas.17 | Regional changes over land in annual mean surface air temperature and precipitation relative to the 1995–2014 baseline for the reference regions in Asia (warming since the 1850–1900 pre-industrial baseline is also provided as an offset). Bar plots in the left panel of each region triplet show the median (dots) and 10th–90th percentile range (bars) across each model ensemble for annual mean temperature changes for four datasets (CMIP5 in intermediate colours; a subset of CMIP5 used to drive CORDEX in light colours; CORDEX overlying the CMIP5 subset with dashed bars; and CMIP6 in solid colours); the first six groups of bars represent the regional warming over two time periods (near-term 2021–2040 and long-term 2081–2100) for three scenarios (SSP1-2.6/RCP2.6, SSP2-4.5/RCP4.5 and SSP5-8.5/RCP8.5), and the remaining bars correspond to four global warming levels (GWLs: 1.5°C, 2°C, 3°C and 4°C). The scatter diagrams of temperature against precipitation changes display the median (dots) and 10th–90th percentile ranges for the above four warming levels for December–January–February (DJF; middle panel) and June–July–August (JJA; right panel), respectively; for the CMIP5 subset only the percentile range of temperature is shown, and only for 3°C and 4°C GWLs. Changes are absolute for temperature (in °C) and relative (as %) for precipitation. See Atlas.1.3 for more details on reference regions (Iturbide et al., 2020) and Atlas.1.4 for details on model data selection and processing. The script used to generate this figure is available online (Iturbide et al., 2021) and similar results can be generated in the Interactive Atlas for flexibly defined seasonal periods. Further details on data sources and processing are available in the chapter data table (Table Atlas.SM.15).
 Atlas.5.1 East Asia
Atlas.5.1.1 Key Features of the Regional Climate and Findings From Previous IPCC Assessments
Atlas.5.1.1.1 Key Features of the Regional Climate
The climatic regions defined for East Asia include central and eastern China, Japan and the Korea Peninsula (regions ECA and EAS in Figure Atlas.1 7). East Asia is significantly influenced by monsoon systems (Section 8.3.2.4.2). The seasonal advance or retreat of the East Asian summer monsoon (EASM) rainband is crucial to local climate. The East Asian winter monsoon (EAWM) has significant influence on the weather and climate over East Asia and plays an important role in regulating winter temperatures including strong cold events and snowstorms (Wang and Chen, 2014; Wang and Lu, 2016). The East Asian monsoons exhibit considerable variability on a wide range of time scales, including notable interannual variabilities that includes an effect of the El Niño–Southern Oscillation (ENSO; Wang et al., 2000) and the Indian Ocean Dipole (IOD; Takaya et al., 2020), and significant inter-decadal variabilities in the 20th century resulted from the effect of Pacific Decadal Variability (PDV; Zhou et al., 2009), see also Annex IV and Table Atlas.1. The thermal conditions of both the Tibetan Plateau and related ocean regions play key roles in modulating the intensity of the monsoon circulation. The East Asian monsoons are mainly driven by land–sea thermal contrast and, thus, are deeply affected by global climate change (Ding et al., 2014; Gong et al., 2018).
Atlas.5.1.1.2 Findings From Previous IPCC Assessments
The findings of the IPCC AR5 (Christensen et al., 2013) stated that the EASM and EAWM circulations have experienced an inter-decadal scale weakening since the 1970s, leading to a warmer climate in winter and enhanced mean precipitation along the Yangtze River Valley (30°N) but deficient mean precipitation in northern China in summer. Since the middle of the 20th century, it is likely that there has been an increasing trend in winter temperatures across much of Asia (Christensen et al., 2013). The numbers of cold days and nights have decreased and the numbers of warm days and nights have increased over Asia (Hartmann et al., 2013). It is likely that there are decreasing numbers of snowfall events where increased winter temperatures have been observed (Hartmann et al., 2013). The SRCCL reports a land-use-change-induced cooling as large as –1.5°C in eastern China between 1871 and 2007 (Hartmann et al., 2013). The summer rainfall amount over East Asia shows no clear trend during the 20th century.
The IPCC AR5 (Christensen et al., 2013) reports a significant increase in mean temperatures in south-eastern China, associated with a decrease in the number of frost days under the SRES A2 emissions scenario. The CMIP5 model projections indicate an increase of temperature in both boreal winter and summer over East Asia for RCP4.5. Based on CMIP5 model projections, there is medium confidence in an intensified EASM and increased summer precipitation over East Asia. More than 85% of CMIP5 models show an increase in mean precipitation of the EASM, while more than 95% of models project an increase in heavy precipitation events (Christensen et al., 2013).The SROCC states that future projections of annual precipitation indicate increases of the order of 5–20% over the 21st century in many mountain regions, including the Himalaya and East Asia (Hock et al., 2019b). The SR1.5 reports that statistically significant changes in heavy precipitation between 1.5°C and 2°C of global warming are found in East Asia (Hoegh-Guldberg et al., 2018).
Atlas.5.1.2 Assessment and Synthesis of Observations, Trends and Attribution
Summer (June–August) mean temperature in eastern China has increased by 0.82°C since reliable observations were established in the 1950s (Sun et al., 2014). Based on historical meteorological observations, the best estimate of the linear trend of annual mean surface air temperature (SAT) for China with 95% uncertainty ranges is 0.38°C ± 0.05°C per decade for 1979–2015 (Li et al., 2017). From 1960 to 2010, theincreasing trend of temperature was about 0.34°C per decade in the arid region of north-west China, higher than the average over China (B. Li et al., 2012 ; Xu et al., 2015). Over South Korea, warming is 1.4–2.6 times larger than global trends. The increase is 1.90°C during 1912–2014 and 0.99°C during 1973–2014 (Park et al., 2017) with a 25–45% urbanization contribution. The annual temperature increased in large cities at a rate of 0.29°C ± 0.08°C per decade compared with 0.11°C ± 0.08°C per decade in other stations in South Korea from 1960 to 2010 (H.-S. Kim et al., 2016 ). A relatively high increase in annual mean temperature at the rate of 3.0°C per century was detected in the Tokyo metropolitan area for the period 1901–2015 (Matsumoto et al., 2017). Trends of annual temperature for the period of 1961–2015 are shown in Figure Atlas.11. Most areas of East Asia have significant warming trends exceeding 0.1°C per decade, and the strongestwarming (0.3°C–0.4°C per decade) occurs in northern China.
Observational studies indicated significant decadal variations in the EAWM (Wang and Lu, 2016; He et al., 2017). It weakened significantly around the late 1980s, being relatively strong during 1976–1987 and weaker during 1988–2001. The EAWM has recovered in intensity after 2004 and caused frequent and prevalent severe cold spells, as well as a number of unusually harsh cold winters in many parts of East Asia during the period 2004–2012 (Wang and Chen, 2014; Kug et al., 2015; Ge et al., 2016; Gong et al., 2018). Negative zonal mean winter SAT anomalies were observed over the whole of East Asia from 1980 to 1988, with positive anomalies observed over high and low latitudes from 1988 to 2010 (Miao and Wang, 2020).
Precipitation trends over East Asia show considerable regional differences (medium confidence). Mean precipitation has shown negligible sensitivity to the warming trend with consequently limited overall trends in China though summer rainfall daily frequency and intensity show respectively decreasing and increasing trends from 1961 to 2014 (Zhou and Wang, 2017). The summer precipitation trends over eastern China display a dipole pattern, characterized by positive anomalies in central-eastern China along the Yangtze River Valley and negative anomalies in north China since the 1950s (Section 8.3.2.4.2). This pattern has changed with the enhanced rainfall in the Huaihe River Valley and decreased in the regions south of the middle and lower reaches of the Yangtze River Valley since the 2000s (Liu et al., 2012; Zhao et al., 2015). The climate in north-west China changed from ‘warm–dry’ to ‘warm–wet’ condition in the mid-1980s (Peng and Zhou, 2017; Wang et al., 2020), with an increased rate of annual precipitation of about 3.7% per decade from 1961 to 2015 (P. Wu et al., 2019 ) and 11.2 mm per decade between 1960 and 2011 in northern Xinjiang (Xu et al., 2015). Mean rainfall and the number of rainy days during the Meiyu-Baiu-Changma period from June to September have increased during 1973–2015 in Korea (Lee et al., 2017). The precipitation trend has caused a large increase in summer precipitation at a rate of 40.6 ± 4.3 mm per decade, resulting in an increase of annual precipitation of 27.7 ± 5.5 mm per decade in South Korea from 1960 to 2010 (H.-S. Kim et al., 2016 ). Precipitation amounts exhibited a slight decrease at both the annual and seasonal scales in Japan for the period 1901–2012 (Duan et al., 2015).
Agriculture intensification through oasis expansion in Xinjiang region has increased summer precipitation in the Tian Shan mountains (high confidence from medium evidence with high agreement) (Zhang et al., 2009, 2019b; Deng et al., 2015; Guo and Li, 2015; Yao et al., 2016; Xu et al., 2018; Cai et al., 2019). However, there is very low confidence of the effect of oasis expansion on the temperature warming trend (Han and Yang, 2013; Li et al., 2013; Yuan et al., 2017).
In the context of climate warming, intense snowfalls have hit China frequently in recent winters and have caused severe damages to the sustainability of society (Sun et al., 2019). Observations generally show a decrease in the frequency and an increase in the mean intensity of snowfalls in north-western, north-eastern and south-eastern China and the eastern Tibetan Plateau since the 1960s (Zhou et al., 2018), but the results may depend on the objective criteria for identifying winter snowfall (J. Luo et al., 2020 ).
Atlas.5.1.3 Assessment of Model Performance
Current climate models perform poorly insimulating the mean precipitation in East Asia, including the phase of the northward progression of the seasonal rainband (M. Zhang et al., 2018 ). Although there has been an improvement in the simulation of mean states, interannual variability and past climate changes in the progression from CMIP3 to CMIP5, some previously documented biases (such as the ridge position of the western North Pacific Subtropical High and the associated rainfall bias) are still evident in CMIP5 models (Sperber et al., 2013; Zhou et al., 2017). Most models capture the main characteristics of the winter mean circulation over East Asia reasonably well, but they still suffer from difficulty in predicting the interannual variability of the EAWM (Shin and Moon, 2018). Models have improved from CMIP5 to CMIP6 for climatological temperature and EAWM (D. Jiang et al., 2020 ). Some CMIP6 models also show improvements in simulating the annual mean and interannual variation of precipitation (Sellar et al., 2019; Tatebe et al., 2019; T. Wu et al., 2019 ). The performance of models is sensitive to cumulus convection schemes and horizontal resolution (Haarsma et al., 2016; Wu et al., 2017; Kusunoki, 2018b). High-resolution atmospheric global climate models (AGCM) successfully reproduce the intensity and the spatial pattern of the EASM rainfall (Li et al., 2015; Yao et al., 2017; Ito et al., 2020a) and improve the simulation of the diurnal cycle of precipitation rates and the probability density distributions of daily precipitation over Korea, Japan and northern China (Lin et al., 2019), but increasing horizontal resolution (at the typical scales used in GCMs) is not always a panacea for solving model biases (Roberts et al., 2018).
Recent studies using CORDEX-EA models with resolution of about 12–25 km showed that the RCMs produce relatively more detailed regional features of the temperature distribution compared with the driving GCMs (Tang et al., 2016). Over China, RCMs provide more spatial details and in general reduce the biases of their driving GCMs, in particular in DJF (December–January–February) and over areas with complex topography (Wu and Gao, 2020). However, RCMs also show biases in simulating East Asian precipitation and its variability (Park et al., 2016; Zhou et al., 2016; Zou and Zhou, 2016), and do not always show added value compared to the driving GCMs (Li et al., 2018b). For example, by comparing inter-GCM and inter-RCM differences around the Japan archipelago, it was found that RCM generate relatively large differences in precipitation (Suzuki-Parker et al., 2018). The RCM multi-model ensemble produces superior simulation compared to that of a single model (Jin et al., 2016; D.-L. Guo et al., 2018 ). A comparative study of RCMs at different spatial resolutions showed that with coarse resolution they present some limitations and high-resolution RCMs offer added value for several evaluation metrics (Park et al., 2020).
Atlas.5.1.4 Assessment and Synthesis of Projections
The development of climate models provides a solid basis for projection of future monsoon changes under different global warming scenarios. Coupled model simulations indicate that East Asia and the Tibetan Plateau will likely experience higher warming than the global mean conditions across all global warming levels (Figure Atlas.1 7) and with the projected warming greater in ECA and TIB than EAS. Also, in the CMIP6 ensemble, the multi-model mean and 90th percentile warming for a given period and emissions scenario are consistently greater than in the CMIP5 ensemble. Larger warming magnitudes are projected to occur in the southern, north-western, and north-eastern regions of China, parts of Mongolia, the Korean Peninsula, and Japan than in other regions (Li et al., 2018a). Projections indicate winter increases in SAT over the East Asian continent and in precipitation over the northern East Asian continent with 1.5°C and 2.0°C global warming under the RCP4.5 and RCP8.5 scenarios (Miao et al., 2020).
Projected annual precipitation changes in the CMIP5 and CMIP6 ensembles are positive for all warming levels in ECA and TIB and for the higher warming levels in EAS. Changes in precipitation per degree Celsius global warming are larger in DJF than in JJA in ECA but show smaller seasonal difference in EAS (Figure Atlas.1 7). The EASM precipitation is projected to increase but with a complex spatial structure (Kitoh, 2017; Moon and Ha, 2017). Simulations from CMIP5 models show that compared with the current summer climate, both SAT and precipitation increase significantly over the East Asian continent during the 1.5°C warming period (L. Chen et al., 2019 ) and that the main mode of EASM precipitation changes from tripolar to dipolar (Wang et al., 2018). The increase in precipitable water in the wet EASM region is only slightly greater than the global average but the increase in precipitation is much greater (Z. Li et al., 2019 ). The monsoon circulation in the lower troposphere is projected to strengthen due to the enhanced thermal forcing by the Tibetan Plateau (He et al., 2019; He and Zhou, 2020), which causes the increased summer precipitation over the East Asian continent. Precipitation over eastern China increases for almost all months under global warming in projections from GCMs with different horizontal resolutions (Kusunoki, 2018a). Also, under RCP scenarios, in the 21st century, mean precipitation is projected to increase (Kim et al., 2020), especially in the late afternoons (Oh and Suh, 2018), over the Korean Peninsula due to global warming and associated changes in EASM. Increase in JJA mean precipitation is projected in northern East Asia consistently among the CMIP models, while northward migration of early summer East Asian rainbands such as the Meiyu-Baiu-Changma is delayed along with that of the mid-latitude westerly jet in the future (Horinouchi et al., 2019). However, the geographical distribution of precipitation change tends to depend more on the cumulus convection scheme (Ose, 2017) and horizontal resolution of models rather than on SST distributions. Under the RCP4.5 and the RCP8.5 scenarios, the interannual variability in EASM rainfall is projected by the multi-model ensemble mean to increase in the 21st century (Ren et al., 2017). Further studies show a projected increase in heavy rainfall together with increases in rainfall intensity (Endo et al., 2017). Multi-model intercomparison indicates significant uncertainties in future projections of climate change in East Asia, although precipitation increases consistently across models (Zhou et al., 2017). Simulations under the RCP4.5 scenario project that the number of snow days will be reduced by the end of the 21st century relative to 1986–2005, primarily owing to the decline of light snowfall events. The total amount is projected to increase in north-western China but decrease in the other sub-regions (Zhou et al., 2018).
The increasing temperature trends under RCP scenarios were consistently reproduced in projections using CORDEX-EA models (Y. Kim et al., 2016 ) as reported in AR5 using GCMs. However, changes in annual and seasonal mean precipitation exhibit significant inter-RCM differences with larger magnitudes and variability than in the GCMs (Ham et al., 2016; Ozturk et al., 2017; H. Sun et al., 2018 ; D. Zhang et al., 2018 ). RCM simulations project that the Meiyu-Baiu-Changma heavy rainfall will significantly increase in northern Japan at the end of the 21st century under the RCP8.5 scenario (Osakada and Nakakita, 2018), but projected precipitation amount and the number of precipitation days in summer around and over Japan differ as a result of RCM uncertainty (Suzuki-Parker et al., 2018). Annual total snowfall is projected to decrease in most parts of Japan except for Japan’s northern island under RCP2.6 (Kawase et al., 2021).
Projejctions based on statistical downscaling of 37 CMIP5 GCMs for Xinjiang, China, show pronounced temperature increases of 0.27°C to 0.51°C per decade from 2021 to 2060 while precipitation changes were projected to be between –1.7% to 6.8% per decade and varying seasonally and spatially (Luo et al., 2018). A decrease of precipitation was projected in the western region of Xinjiang during summer. More extreme rainfall events were projected to occur during summer and autumn.
Atlas.5.1.5 Summary
In East Asia annual mean temperature has been increasing since the 1950s (high confidence). The linear trend of annual mean surface air temperature likely exceeded 0.1°C per decade over most of East Asia from 1961 to 2015. Trends of annual precipitation show considerable regional differences with areas of both increases and decreases (medium confidence), and with increases over north-west China and South Korea (high confidence). Agricultural intensification through oasis expansion in Xinjiang region has increased summer precipitation in the Tian Shan mountains (high confidence).
GCMs still show poor performance in simulating the mean rainfall and its variability over East Asia, especially over regions characterized by complex topography. The CMIP6 models have improved from CMIP5 for climatological temperature and winter monsoon but show little improvements for the summer monsoon. The RCMs produce relatively more detailed regional features, but do not always produce superior simulations compared with the driving GCMs.
The annual mean surface temperature over East Asia and the Tibetan Plateau will very likely increase under all emissions scenarios and GWLs. Larger warming magnitudes will likely occur in the northern part of EAS and in ECA and TIB. Precipitation is likely to increase over land in most of EAS at the end of the 21st century under higher-emissions scenarios (SSP3-7.0, RCP8.5 and SSP5-8.5) and global warming levels, and in ECA and TIB under all emissions scenarios and global warming levels. Summer precipitation increase is likely to occur in East Asia, corresponding to the strengthened summer monsoon circulation.
Atlas.5.2 North Asia
Atlas.5.2.1 Key Features of the Regional Climate and Findings From Previous IPCC Assessments
Atlas.5.2.1.1 Key Features of the Regional Climate
North Asia extends from the Ural Mountains in the west to the Pacific Ocean in the east and from the Russian Arctic in the north to West and East Central Asia and East Asia in the south. Its most recognizable features are boreal forests and permafrost. In AR6 North Asia is divided into three reference regions (Figure Atlas.1 7): West Siberia (WSB) with a continental climate, warm summers and cold winters, many waterlogged areas and several natural zones due to a large extent from south to north and heterogeneity in regional climates; East Siberia (ESB) which is mainly highland with extensive permafrost and a more severe continental climate characterized by harsh, long winters and short, hot summers, and by less precipitation and snow cover than in neighbouring regions; and the Russian Far East (RFE) with a monsoon-influenced climate, cold winters and wet summers in the south, and cold winters and cool summers almost without precipitation in the north. WSB and ESB are mainly influenced by NAO and NAM (Annex IV.2.1) and the Arctic Oscillation (AO) with associated atmospheric blocking by the Siberian High (SH) that exhibits a pronounced decadal-to-multi-decadal variability (see also Table Atlas.1). RFE is under the influence of the ENSO (Annex IV.2.3) and the PDV (Annex IV.2.6) that mostly affect rainfall variability.
Atlas.5.2.1.2 Findings From Previous IPCC Assessments
In the previous IPCC assessment cycles, the three sub-regions comprising North Asia in this section, along with Eastern Europe and the Asian Arctic, were considered as either Northern Eurasia or Russia in AR4 and AR5. The AR5 WGI stated that for North and Central Asia CMIP5 models had difficulty in representing climatological means of both temperature and precipitation, which is partly related to the scarceness of observational data in northern parts of the region and to issues related to the estimation of biases with coarse-resolution models (Christensen et al., 2013). In CMIP5 projections under different RCP scenarios, North Asian temperatures increase more in winter (DJF) than summer (JJA; Seneviratne et al., 2012). With most models projecting increased precipitation significantly above the 20-year natural variability, it was concluded that precipitation in North Asia will very likely increase (Christensen et al., 2013).
The SRCCL identified aridification of the climate in southern East Siberia between 1976 and 2016 as causing an extension of the steppes polewards whilst climate change also extended the vegetation season, increasing forest productivity in most of boreal Siberia, but increasing risk of wildfire and tree mortality (Mirzabaev et al., 2019). The SROCC noted the warming climate has caused permafrost thaw and loss of ground ice, and thus land subsidence and collapse, disturbing ecosystems and human infrastructure. Permafrost stability, hydrology and vegetation were also impacted by recent extensive fires burning into the organic soil layer (Meredith et al., 2019). The SR1.5 noted that future, higher levels of warming lead to greater impacts in key systems such as the Siberian ecosystems, identified as one of the threatened systems (‘Reason for Concern 1 – RFC1’; Hoegh-Guldberg et al., 2018) with impacts at 2°C expected to be greater than those at 1.5°C (medium confidence).
Atlas.5.2.2 Assessment and Synthesis of Observations, Trends and Attribution
Increases in surface air temperature (SAT) have been observed since the mid-1970s over the whole of North Asia (Frolov et al., 2014), and particularly over the north-eastern part (Figure Atlas.11; Gruza et al., 2015). Trends of annual SAT in the northern part of the region during the last decades were very likely twice as strong as the global average (Figure Atlas.11; Frolov et al., 2014; Mokhov, 2015; Sherstyukov, 2016) with trends in RFE of 0.8°C–1.2°C per decade for the 1976–2014 period and more intense warming strengthening from south to north observed in spring in ESB (Frolov et al., 2014; Ippolitov et al., 2014; Kokorev and Sherstiukov, 2015).
Recent strong warming in polar regions (Section Atlas.11.2) was accompanied by cooling in winter in mid-latitude regions particularly in the southern part of WSB and ESB (Cohen et al., 2014; Ippolitov et al., 2014; Gruza et al., 2015; Kharyutkina et al., 2016; Overland et al., 2016; Perevedentsev et al., 2017; Wegmann et al., 2018). These temperature decreases were strongly correlated with significant warming over the Barents-Kara Sea (greater than 2.5°C per decade during 2003–2017) and sea ice loss, suggesting a causal link (Outten and Esau, 2012; Semenov et al., 2012; Overland et al., 2016; Semenov, 2016; Wegmann et al., 2018; Meleshko et al., 2019; Susskind et al., 2019), though recent studies (Blackport et al., 2019; Clark and Lee, 2019) have shown that both phenomena result from mid-latitude circulation variability (see also Cross-Chapter Box 10.1). In addition, significant warming in the last decade has halved the cooling trend in southern WSB from –0.6°C per decade during 1976–2012 to –0.3°C per decade during 1976–2018 (high confidence) (Frolov et al., 2014; Roshydromet, 2019).
Annual precipitation totals very likely increased over North Asia in the last half century along with more heavy and less light precipitation, more freezing rain and less freezing drizzle (Figure Atlas.11 and the Interactive Atlas; Wen et al., 2014; Groisman et al., 2016; Ye et al., 2017; Chernokulsky et al., 2019). The highest increase was observed over regions of Siberia and RFE with estimated trends of 10–25 mm per decade for the 1976–2014 period (Kokorev and Sherstiukov, 2015) or 5% per decade for the 1976–2018 period (Roshydromet, 2019). Increases over southern RFE are the largest (over 50 mm per decade) and are mostly due to positive changes in convective precipitation intensity in the region in the summer season (JJA) during 1966–2016 (medium confidence) (Chernokulsky et al., 2019). A decreasing trend was observed in central WSB, northern ESB, the Baikal and Transbaikal regions, the Amur River region, and Primorie territories of RFE (the Kamchatka and Chukchi peninsulas) with up to –20 mm per decade for the 1976–2014 period (Kokorev and Sherstiukov, 2015) or 15–20% per decade for the 1976–2018 period (Roshydromet, 2019). Overall, solid precipitation predominantly decreased in North Asia and very likely caused both less snow cover extent (SCE) and snow water equivalent (SWE), attributable to the anthropogenic influence with high confidence (Sections 2.3.2.2 and 3.4.2).
Snow characteristics depend on both temperature and precipitation, and observed trends over North Asia show large spatial heterogeneity and interannual variability (Figure Atlas.1 8) leading to medium confidence that maximum snow depth has increased over Siberia, the Okhotsk Sea coast and in southern RFE since the 1960s (Callaghan et al., 2011; Loginov et al., 2014), with trends during 1976–2016 of 1.8 cm (in WBS), 1.1 cm (in ESB), and 4.6 cm (in RFE) per decade (Bulygina et al., 2017). Snow cover duration increased in Yakutia, Sakhalin Island and some other coastal areas of the Pacific Ocean in RFE during 1980–2009 (Callaghan et al., 2011), and decreased in WSB and ESB (Bulygina et al., 2017; Roshydromet, 2019). However, Gorbatenko et al. (2019) reported that in south-eastern WSB maximal snow depth has increased by 5–20 cm and duration of steady snow cover by between 4 and 10 days during 1989–2016 (Figure Atlas.1 8).
 Figure Atlas.18 | Linear trends for the 1980–2015 period based on station data from the World Data Centre of the Russian Institute for Hydrometeorological Information (RIHMI-WDC; Bulygina et al., 2014). (a) Snow-season duration from 1 July to 31 December (days per decade); (b) snow-season duration from 1 January to 30 June (days per decade); (c) maximum annual height of snow cover (mm per decade). Trends have been calculated using ordinary least squares regression and the crosses indicate non-significant trend values (at the 0.1 level) following the method of Santer et al. (2008) to account for serial correlation. Further details on data sources and processing are available in the chapter data table (Table Atlas.SM.15).
 Atlas.5.2.3 Assessment of Model Performance
Temperature trends and means derived from reanalysis datasets (JRA-25 and MERRA) correctly represented temperature variability shown in observational data over the Asian territory of Russia for the 1976–2010 period (Loginov et al., 2014). Assessment of CRU TS 3.22, CRUTEMP4, ERA-Interim and NCEP2 datasets against station data over North Asia for annual and seasonal air temperature has shown that the ERA-Interim reanalysis outperforms others for the 1981–2005 period (Kokorev and Sherstiukov, 2015). The latter reanalysis also underestimates summer precipitation and shows large wet biases over north-east Asia during spring and underestimates mean seasonal temperature over north-east Asia in spring (MAM), autumn (SON), and winter (DJF), but overestimates it in summer (JJA) compared with the CRU dataset (medium confidence) (Ozturk et al., 2017; Top et al., 2021).
GCMs capture the main synoptic processes affecting North Asia and the CMIP5 ensemble simulates the temporal evolution of the magnitude and position of the Siberian High (SH) over the period 1872–2005 (Fei and Yong-Qi, 2015). CMIP5 models simulate a weakened intensity of the winter SH and a strengthened interannual variability compared to observations (Fei and Yong-Qi, 2015). The characteristics of blocking events over the region (number, duration, intensity and frequency) were reasonably well reproduced by GCMs (Mokhov et al., 2014), and most overestimate the annual mean temperature over northern Eurasia (Interactive Atlas). Biases in simulated annual surface air temperature simulation primarily come from the winter (DJF) season and are relatively smaller in other seasons (Miao et al., 2014; Peng et al., 2019). Most GCMs capture the main decadal SAT trend (Miao et al., 2014), though CMIP5 GCMs fail to capture the decreasing temperature trend over East Siberia (Fei and Yong-Qi, 2015). Possible causes of GCMs’ inability to represent the recent slowdown of warming is further discussed in Cross-Chapter Box 3.1. For CMIP5, models with higher resolution do not always perform better than those with lower resolutions (medium confidence) (Miao et al., 2014).
Sixteen CMIP5 model simulations of SAT variability over Eurasia were evaluated against CRU observations for permafrost sub-regions (Peng et al., 2019), showing a warm bias in north-west Eurasia, capturing the climate warming over the 20th century and its acceleration during the late 20th century. CMIP5 GCMs generally underestimate daily temperature range compared with observations over north-eastern Russia (Sillmann et al., 2013; Lindvall and Svensson, 2015). Currently there is no literature on the CMIP6 ensemble over the region though a few single-model studies are available (Voldoire et al., 2019; T. Wu et al., 2019 ).
There is very limited use of RCMs for North Asia. CORDEX-CAS covers North Asia, except parts of RFE, and ARCTIC-CORDEX covers the northern regions (Figure Atlas.6). For CORDEX-CAS three RCMs (REMO, ALARO-0 and CLMcom) have been used and have warm biases for maximum temperatures, cold biases for minimum temperatures and a wet bias in the north during the winter (Top et al., 2021). Rain gauges, however, are known to have problems in terms of measuring properly solid precipitation (e.g., due to drifting snow) which can greatly affect the accuracy of precipitation observations over North Asia (Harris et al., 2014).
Atlas.5.2.4 Assessment and Synthesis of Projections
CMIP5 and CMIP6 projections are consistent in the direction and ranges of surface temperature change which are higher than the global average and with ensemble-mean warming of around 6°C for the 4°C GWL. Projected precipitation changes are also consistent with significant increases in winter, of up to 40% in the ensemble mean for the highest warming levels, and lower increases in summer except for WSB where changes are small and suggest drying at the 4°C GWL (Figure Atlas.1 7 and the Interactive Atlas).
The CMIP5 ensemble projects a warming of the annual mean SAT over northern Eurasia in the 21st century, likely in the range of 0.8°C–1.0°C (RCP2.6), 2.3°C–3.1°C (RCP4.5) and up to 7.2°C (RCP8.5) (Miao et al., 2014; Peng et al., 2019). Mid-latitude permafrost sub-regions in Eurasia are projected to warm more than the global mean and non-permafrost territories, with ensemble area-averaged changes of 1.7°C (RCP2.6), 3.2°C (RCP4.5) or 6.4°C (RCP8.5) in 2081–2100 relative to 1986–2005 (Peng et al., 2019).
Over the Central Asia CORDEX domain, RegCM4.3.5 simulations driven by two different CMIP5 GCMs (HadGEM2-ES and MPI-ESM-MR) project SAT warming for 2071–2100 relative to 1971–2000 of about 3°C–4°C during the summer for RCP4.5 to over 7°C for all seasons for RCP8.5. Projected warming is most evident on the large continental Siberian Plateau with boreal and sub-boreal climates and biomes (i.e., taiga forests and tundra) during the winter season (Ozturk et al., 2017). The Voeikov Main Geophysical Observatory (MGO) RCM, driven by five CMIP5 GCMs for the RCP8.5 scenario, projects a faster increase in annual minimum temperature as compared with maximum temperature over the whole territory of Russia (Kattsov et al., 2017), and the smallest change in growing season lengths (i.e., periods with daily temperatures over 5°C, 10°C and 15°C) in the area of northern taiga in WSB and ESB comparable with other territories of Russia during the 21st century (Torzhkov et al., 2019).
For precipitation, MGO RCM projects for the Arctic-CORDEX domain under the RCP8.5 scenario increases in annual totals for northern North Asia, a decrease in summer over ESB for 2006–2100 relative to 1951–2005 and significant increases in the upper limit of intense precipitation over most of the region in winter (Kattsov et al., 2017; Khlebnikova et al., 2018). Other RCM projections show that in most seasons and for all future periods, precipitation in Siberia is not projected to change with respect to the 1971–2000 period, except under the RCP8.5 scenario for the winter and autumn (Ozturk et al., 2017). This very limited and controversial evidence leads to low confidence in RCM precipitation projections for North Asia and since the projections of GCMs and ESMs are more physically consistent, assessment of future precipitation changes is based on CMIP5/CMIP6 presented in Figure Atlas.1 7 and the Interactive Atlas.
Atlas.5.2.5 Summary
Annual surface air temperature and precipitation have very likely increased and maximum snow depth has likely increased over most of North Asia since the mid-1970s. The highest warming has been found in spring in ESB and RFE, strengthening from south to north with linear trends of 0.8°C–1.2°C per decade over the 1976–2014 period (high confidence). A temperature decrease was identified just in winter in the southern part of WSB and ESB as a result of natural variability, but halved from –0.6°C per decade in 1976–2012 to –0.3°C per decade for the longer 1976–2018 period due to recent warmer winters (high confidence). Over North Asia annual precipitation increases with estimated trends of 5–15 mm per decade in the 1976–2014 period have been recorded with an exception over the Kamchatka and the Chukchi peninsulas, where decreases of up to –20 mm per decade in the same period have been found (medium confidence). Snow cover duration has very likely decreased over Siberia and increases in maximum snow depths of 1.8 cm, 1.1 cm and 4.6 cm per decade have been observed for WSB, ESB and RFE respectively from 1976 to 2016 (limited evidence).
Most of the CMIP5 and some CMIP6 GCMs overestimate the annual mean air temperature and precipitation over the North Asia region (medium confidence). GCMs generally represent the observed decadal temperature trend (medium confidence) and biases primarily come from the winter (DJF) season (high confidence). Results of a very limited number of RCMs applied over the whole region show that they have warmer biases for maximum and colder biases for minimum temperatures (limited evidence, medium agreement). Sparsity of observational data particularly in the northern part of ESB and the whole of the RFE results in low confidence in the assessments of model performance in North Asia.
Surface air temperature and precipitation in North Asia are projected to increase further (high confidence) with warming higher than the global average and around 6°C at the 4°C GWL. Temperature change in 2080–2099 relative to 1981–2000 is likely in the range of 3°C in summer to 4.9°C in winter under the RCP4.5 scenario, and 5.6°C in summer to 9.7°C in winter under the RCP8.5 scenario. Precipitation is projected to increase with ensemble-mean changes of 9% in summer under both RCP4.5 and RCP8.5, and of 22% and 56% in winter respectively.
Atlas.5.3 South Asia
Atlas.5.3.1 Key Features of the Regional Climate and Findings from IPCC Previous Assessments
Atlas.5.3.1.1 Key Features of the Regional Climate
The countries in this region are mostly semi-arid to arid and therefore depend heavily on the summer monsoon (June–September, JJAS) which is when most of the precipitation falls over the South Asia region (SAS; Figure Atlas.1 7). The topographic mechanical effect of the Tibetan Plateau (TIB) promotes moisture convergence downstream which triggers the early summer monsoon onset particularly over the Bay of Bengal and south China. In winter, westerly disturbances (WD) originating over the Atlantic Ocean bring moisture. The interaction between the WD and the Himalayas causes precipitation over northern and western parts of South Asia that is crucial to maintain the glacier mass balance. The observed teleconnection patterns over SAS for temperature show cooling effects during NAM and warming effects when in positive phase with ENSO, IOB, AMM and AMV (Annex IV). IOD also influences South Asian precipitation (Annex IV).
Atlas.5.3.1.2 Findings From Previous IPCC Assessments
Recent IPCC reports assessed that it is very likely that the mean annual temperature over South Asia has increased during the past century (Figure 2.21 in Hartmann et al., 2013, Figure 24-2 in Hijioka et al., 2014), and the frequency of cold (warm) days and nights have decreased (increased) across most of Asia since about 1950 (Figure 2.32 in Hartmann et al., 2013). The AR5 assessed that there is high confidence that the large-scale patterns of surface temperature are generally well simulated by the CMIP5 models though with problems in some regions, particularly at higher elevations over the Himalayas (Flato et al., 2013). CMIP5 models projected for the 21st century a significant increase in temperature over South Asia (high confidencefrom robust evidence) and in projections of increased summer monsoon precipitation (medium confidence) (Collins et al., 2013). The AR5 assessed there is high confidence that high-resolution regional downscaling, which generate results complementary to those from global climate models, adds value to the simulation of spatial variations in climate in regions with highly variable topography (e.g., distinct orography, coastlines), and for mesoscale phenomena and extremes (Flato et al., 2013).
Inconsistent evidence was found on the declining trends in mean precipitation and increasing droughts from 1950 onwards considering 1960–1990 as the baseline period. Similarly, SREX (Table 3-3 in Seneviratne et al., 2012) reported low confidence (due to lack of literature) in trends in climate indices related to extreme precipitation events. The Indian summer monsoon circulation was found to have weakened, but this was compensated by increased local atmospheric moisture content leading to more rainfall (medium confidence). It is likely that the occurrence of snowfall events is decreasing in South Asia along with other regions due to an increase in winter temperatures (Hock et al., 2019b). Based on satellite- and surface-based remote sensing it is very likely that aerosol optical depth has increased over southern Asia since 2000.
Atlas.5.3.2 Assessment and Synthesis of Observations, Trends and Attribution
Recent studies show that annual mean land temperatures over Indiawarmed at a rate of around 0.6°C per century during 1901–2018, which was primarily contributed by a significant increase in annual maximum temperature of 1.0°C per century, while the annual minimum temperature showed a lesser increasing trend of 0.18°C per century during this period, with a significant rise only in the recent few decades (1981–2010) at a rate of 0.17°C per decade (Srivastava et al., 2017, 2019). The annual average of daily maximum and minimum temperatures has increased over almost all Pakistan with a faster increasing trend in the south (high confidence). Minimum temperatures have increased faster (0.17°C–0.37°C per decade) than maximum temperatures (0.17°C–0.29°C per decade) with the diurnal temperature range reduced (–0.15°C to –0.08°C per decade) in some regions (Khan et al., 2019).
There has been a noticeable declining trend in rainfall with monsoon deficits occurring with higher frequency in different regions in South Asia (see also Section 8.3.2.4 on the South Asian monsoon). Concurrently, the frequency of heavy precipitation events has increased over India, while the frequency of moderate rain events has decreased since 1950 (high confidence) (Goswami et al., 2006; Dash et al., 2009; Christensen et al., 2013; Krishnan et al., 2016; Kulkarni et al., 2017; Roxy et al., 2017). There is a considerable spread in the seasonal and annual mean precipitation climatology and interannual variability among the different observed precipitation datasets over India (Collins et al., 2013; Prakash et al., 2014; Kim et al., 2018; Ramarao et al., 2019). Yet, the regions of agreement among datasets lend high confidence that there has been a decrease in mean rainfall over most parts of the eastern and central north regions of India (Singh et al., 2014; Roxy et al., 2015; Juneng et al., 2016; Krishnan et al., 2016; Guhathakurta and Revadekar, 2017; Jin and Wang, 2017; Latif et al., 2017). A global modelling study with high resolution over South Asia (Sabin et al., 2013) indicated that a juxtaposition of regional land-use changes, anthropogenic-aerosol forcing and the rapid warming signal of the Equatorial Indian Ocean was crucial to simulate the observed Indian summer monsoon weakening in recent decades (medium confidence).
A dipole-like structure in summer monsoon rainfall trends is observed over the northern Indo-Pakistan area with significant increases over Pakistan and decreases over central north India resulting from strengthening (weakening) of vertically integrated meridional moisture transport over the Arabian Sea (Bay of Bengal) (low confidence) (Latif et al., 2017). Positive annual precipitation trends are observed in global and regional datasets (Figure Atlas.11 and the Interactive Atlas) during 1961–2015 and over arid provinces of Pakistan (for rabi and kharif cropping seasons) during 1951–2015 of 2.8–34.8 mm per decade (Khan et al., 2020) imply high confidence for increased precipitation in Pakistan. Observations located in the monsoon-dominated strip in Pakistan indicate that the mean monsoon onset became earlier during 1971–2010 (Ali et al., 2020).
Snow and glaciers are major water resources of all countries in South Asia. Glacier melting is mainly controlled by natural phenomena but anthropogenic emissions of black carbon (BC) are now making a significant contributing to total glacial melting in the Hindu Kush Himalaya (HKH) region (Menon, 2002; Ramanathan et al., 2007; Ramanathan and Carmichael, 2008). BC concentration is seven to 10 times higher in mid-altitudes (1000–4000 metres above sea level) than at high altitudes (>4000 metres above sea level). The concentration of BC sampled from the surface of snow/ice samples as well as ice-core records shows decreasing ice albedo and an acceleration in glacier melting (Cross-Chapter Box 10.4; Wester et al., 2019). Karakoram and western HKH snow cover is increasing, a phenomena known as the ‘Karakoram anomaly’, and partially attributed to an increase in the strength of westerly disturbances (Wester et al., 2019).
Significant glacier retreat has been observed since 1960 in TIB with lower rates in the interior of the region (Yao et al., 2007). A large inter-decadal variation in snow cover is also observed from 1960 to 2010. Observations and model simulations showed that the increasing temperature of frozen grounds is leading to thawing and reduced depth of permafrost, with further significant reductions projected under future global warming scenarios (medium confidence) (Yang et al., 2019).
Atlas.5.3.3 Assessment of Model Performance
Whilst simulations of Indian summer monsoon rainfall (ISMR) have improved in CMIP5 compared to CMIP3 in terms of northward propagation, time for peak monsoon and withdrawal (Sperber et al., 2013), they fail to simulate the trends in monsoon rainfall and the post-1950 weakening of monsoon circulation (Saha et al., 2014). This is partially attributed to the failure of coarse-resolution CMIP5 models to simulate fine-resolution processes such as orographic effects or land surface feedback, and problems in cloud parametrization result in an overestimation of convective precipitation fraction (M.S. Singh et al., 2017 ). In CMIP6, a significant improvement is found in capturing the monsoon spatio-temporal patterns over India, particularly in the Western Ghats and north-eastern Himalayan foothills (Gusain et al., 2020). Over Pakistan the CMIP6 models simulate surface temperature better in JJA than DJF (Karim et al., 2020). The CMIP6 ensemble underestimates annual mean temperature over all of South Asian with mixed results for precipitation (Almazroui et al., 2020b). The CMIP6 GCMs have a large cold bias in both mean annual maximum and minimum temperatures in the complex Karakorum and Himalayan mountain ranges but exhibit warm biases in mean annual minimum temperature in most of the rest of South Asia.
Regional climate model (RCM) downscaling of CMIP5 models as part of CORDEX South Asia uses higher resolution (50 km) and improved surface fields such as topography and coastlines to resolve better the complexities of the monsoon and other hydrological processes (Giorgi et al., 2009). The added value of their simulations, relative to the driving GCMs, presents a complex picture. CORDEX RCMs better represent spatial patterns of temperature (Sanjay et al., 2017), the spatial features of precipitation distribution associated with the Indian summer monsoon (Choudhary and Dimri, 2018), and the simulation of monsoon active- and break-phase composite precipitation (Karmacharya et al., 2017b). The RCMs follow the driving GCMs in underestimating seasonal mean surface air temperature and overestimating spatial variability in precipitation. They amplify CMIP5 cold biases over almost the entire region, including over the HKH region, Afghanistan and south-west Pakistan during winter (Iqbal et al., 2017), and substantial cold biases of 6°C–10°C are found over the Himalayan watersheds of the Indus basin (Nengker et al., 2018; Hasson et al., 2019). Neither RCMs nor their driving CMIP5 GCMs reproduce well the region’s precipitation climatology (Mishra, 2015). In addition, important characteristics of ISMR such as northward and eastward propagation, onset, seasonal rainfall patterns, intra-seasonal oscillations and patterns of extremes did not show consistent improvement (S. Singh et al., 2017 ). Also, these RCM simulations have not demonstrated added value in capturing the observed changes in ISMR characteristics over recent decades, though RegCM4 simulations at 25 km showed high accuracy in capturing monsoon precipitation characteristics and atmospheric dynamics in historical simulations (Ashfaq et al., 2021).
Evaluation of four global reanalysis products (ERA5 and ERA-Interim, JRA-55 and MERRA-2; Atlas.1.4.2) for snow depth and snow cover over TIB was performed against 33 in situ station observations, Interactive Multisensor Snow and Ice Mapping System (IMS) snow cover and a satellite microwave snow-depth dataset (Orsolini et al., 2019). Most of the reanalyses showed a systematic overestimation. Only ERA-Interim assimilated IMS snow cover at high altitudes, whereas ERA5 did not and the excessive snowfall, snow depth and snow cover in ERA5 was attributed to this difference. The analysis of annual maximum consecutive snow-covered days for the period 1980–2018 over TIB using JRA-55 and passive microwave satellite observations showed a decreasing trend in all time periods and in recent snow seasons for MERRA-2 (Bian et al., 2020). The uncertainty assessment of model physics in snow modelling over TIB using ground-based observations and high-resolution snow cover satellite products from the Moderate Resolution Imaging Spectroradiometer (MODIS) and FengYun-3B suggests that errors can be overcome by optimizing parametrizations of the snow cover fraction rather than optimizing physics-scheme options (Y. Jiang et al., 2020 ).
Atlas.5.3.4 Assessment and Synthesis of Projections
CMIP5 and CMIP6 surface temperature projections for South Asia are consistent across the range of GWLs withincreases greater than the global average, more so over TIB (Figure Atlas.1 7). CMIP6 models show higher sensitivity to greenhouse gas emissions, projecting higher warming for a given emissions scenario. The north-western parts of South Asia, mainly covering the Karakorum and Himalayan mountain ranges, are projected to warm more (over 6°C under SSP5-8.5, with higher warming in winters than in summer; Interactive Atlas) and this will accelerate glacier melting in the region. The warming pattern of maximum and minimum temperatures are projected to intensify in higher latitudes compared with mid-latitudes of South Asia in CMIP5 simulations for all RCP scenarios (Ullah et al., 2020).
Seasonal precipitation projections show increased winter precipitation over the western Himalayas and decreased precipitation over the eastern Himalayas. On the other hand, summer precipitation projections show a robust increase over most of South Asia, with the largest over the arid region of southern Pakistan and in adjacent areas of India, under SSP5-8.5 (Almazroui et al., 2020b). Daily bias-adjusted projections from 13 CMIP6 GCMs using all emissions scenarios project a warmer (3°C–5°C) and wetter (13–30%) climate in South Asia in the 21st century (Mishra et al., 2020).
With continued global warming and anticipated reductions in anthropogenic aerosol emissions in the future, CMIP5 models project an increase in the mean and variability of summer monsoon precipitation over India by the end of the 21st century, together with substantial increases in daily precipitation extremes (medium confidence) (Krishnan et al., 2020), see also Section 8.4.2.4 on changes in the South Asian monsoon. The CMIP5 GCMs consistently project an increase in moisture transport over the Arabian Sea and Bay of Bengal towards the end of the 21st century, an increase in moisture convergence and consequent increases in monsoon rainfall over the Indo-Pakistan region which are higher under RCP8.5 than RCP4.5 (Srivastava and Delsole, 2014; Mei et al., 2015; Latif et al., 2018). Out of 20 CMIP5 GCMs, four showed an increase in magnitude and lengthening of the summer monsoon across India under RCP8.5. The intensity of both strong and weak monsoons is projected to increase during the period 2051–2099 (Srivastava and Delsole, 2014).
Summer precipitation changes in South Asia are consistent between CMIP3 and CMIP5 projections, but the model spread is large for winter precipitation changes. Changes in summer monsoon rainfall will dominate annual changes over South Asia (Woo et al., 2019). CMIP3 GCMs project a gradual increase in annual precipitation over monsoon-dominated areas of Pakistan throughout the 21st Century and increases in humid and semi-arid climate areas (Saeed and Athar, 2018).
Warming of 2.5°C–5°C is projected over northern Pakistan and India (Syed et al., 2014). CORDEX-South Asia projections over north-east India under RCP4.5 for the period 2011–2060, show increasing trends for both seasonal maximum and minimum temperature over north-east India (Interactive Atlas). The future projections of South Asian monsoon from the CORDEX-CORE exhibit a spatially robust delay in the monsoon onset, an increase in seasonality, and a reduction in the rainy season length over parts of South Asia at higher levels of radiative forcing (Ashfaq et al., 2021).
With TIB continuing to warm, snow cover and snow water equivalent are projected to decrease but with regional differences due to synoptic influences (Cross-Chapter Box 10.4; Wester et al., 2019). There is limited evidence on whether the ‘Karakoram Anomaly’ will persist in coming decades, but its long-term persistence is unlikely with continued projected warming (high confidence) (Section 9.5.1.1). It is projected that peak river flow at higher altitudes will commence earlier, due to warming influences on snow cover area and snow/glacier melt rates and with more precipitation falling as rain rather than snow, and the magnitude and seasonality of flow will change over South Asia (Charles et al., 2016).
Atlas.5.3.5 Summary
Mean, minimum and maximum daily temperatures in South Asia are increasing and winters are getting warmer faster than summers (high confidence). The South Asian monsoon has shown contrasting behaviour over India and Pakistan. There is high confidence that there has been a decrease in mean rainfall over most parts of the eastern and central north regions of India and an increase in precipitation in Pakistan.
Global model performance over the region has improved from CMIP3 to CMIP5 to CMIP6 in the multi-model ensemble-mean simulation of the amplitude and phase of the seasonal cycles of temperature and precipitation. However, there was no appreciable improvement in regions with steep orography, and there has remained substantial inter-model spread in seasonal and annual mean temperatures over South Asia with generally cold biases which are largest in the complex Karakorum and Himalayan mountain ranges. CMIP6 GCMs also show a dry bias (15–20%) in mean annual precipitation in the majority of the South Asia region with a wet bias in Nepal, Pakistan and northern India.
It is likely that surface temperatures over South Asia will increase more than the global average and more so over TIB, with projected increases of 4.6°C (3.4°C–6.0°C) during 2081–2100 compared with 1995–2014 under SSP5-8.5 and 1.3°C (0.7°C– 2.0°C) under SSP1-2.6 (Interactive Atlas). Summer monsoon precipitation in South Asia is likely to increase by the end of the 21st century while winter monsoons are projected to be drier. Over the same time periods CMIP6 models project an increase in annual precipitation in the range 14–36% under SSP5-8.5 and 0.4–16% under SSP1-2.6 (medium confidence).
With continued warming, TIB snow cover and snow water equivalent are likely to decrease and with more precipitation falling as rain rather than snow in SAS. It is projected that the peak river flow at higher altitudes will commence earlier due to the effect of warming on snow cover and snow/glacier melt rates, causing changes in magnitude and seasonality of flow.
Atlas.5.4 South East Asia
Atlas.5.4.1 Key Features of the Regional Climate and Findings from Previous IPCC Assessments
Atlas.5.4.1.1 Key Features of the Regional Climate
The South East Asia region is composed of countries that are part of Indochina (or mainland South East Asia) and countries that are very archipelagic in nature and have strong land-ocean-atmosphere interactions, including those that are part of the Maritime Continent and the Philippines. Its climate is mainly tropical (i.e., hot and humid with abundant rainfall). Rainfall seasonal variability in the region is mainly affected by the synoptic-scale monsoon systems, the north–south migration of the Inter-tropical Convergence Zone (ITCZ) and tropical cyclones (mainly for the Philippines and Indochina), while intra-seasonal variability can be influenced by the MJO (Annex IV). Temperature and especially rainfall are also interannually affected by ENSO and Indian Ocean basin and Dipole (IOB/IOD) modes (Annex IV and Table Atlas.1).
Atlas.5.4.1.2 Findings From Previous IPCC Assessments
The AR5 WGI showed that the mean annual temperature of South East Asia has been increasing at a rate of 0.14°C–0.20°C per decade since the 1960s, along with an increasing number of warm days and nights, and a decreasing number of cold days and nights (Christensen et al., 2013). The AR5 also reported the lack of sufficient observational records to allow for a full understanding of past precipitation trends in most of the Asian region, including South East Asia, and that precipitation trends that were available differed considerably across the region and between seasons (Christensen et al., 2013).
On projected changes, findings from AR5 showed that warming is very likely to continue with substantial sub-regional variations over South East Asia (Christensen et al., 2013). The median increase in temperature over land projected by the CMIP5 ensemble mean ranges from 0.8°C in RCP2.6 to 3.2°C in RCP8.5 by the end of the 21st century. Moderate future increases in precipitation are very likely , with projected ensemble mean increases of 1% in RCP2.6 to 8% in RCP8.5 by 2100. In SR1.5, there is a projected increase in flooding and runoff over South East Asia for a 1.5°C to 2°C global warming, and these will increase even more for a greater than 2°C level of warming (Hoegh-Guldberg et al., 2018).
Atlas.5.4.2 Assessment and Synthesis of Observations, Trends and Attribution
Within the last decade, there has been an increasing number of studies on climatic trends over South East Asia, carried out on a regional basis (Thirumalai et al., 2017; Cheong et al., 2018) or focused on specific countries (Cinco et al., 2014; Villafuerte et al., 2014; Mayowa et al., 2015; Villafuerte and Matsumoto, 2015; Guo et al., 2017a; Supari et al., 2017; Sa’adi et al., 2019; Tan et al., 2021). They document virtually certainsignificant increases in mean as well as extreme temperature. The minimum temperature extremes very likely warmed faster compared to the maximum temperature. Temperatures, including extremes, are strongly influenced by ENSO in the region (Cinco et al., 2014; Thirumalai et al., 2017; Cheong et al., 2018). Over much of the region, extreme high temperatures occurred mostly in April and almost all April extreme temperatures occur in El Niño years (Thirumalai et al., 2017). In most of South East Asia (except for the north-eastern areas), there was likely an increase in the number of warm nights with El Niño episodes within the period 1972–2010 (Cheong et al., 2018).
Changes in mean precipitation are less spatially coherent over South East Asia. Over Thailand, the average number of rain days has decreased by 1.3 to 5.9 days per decade while average daily rainfall intensity has increased by 0.24–0.73 mm day–1per decade (Limsakul and Singhruck, 2016). Precipitation is also affected by ENSO events (Tangang et al., 2017; Supari et al., 2018). Over South East Asia, there has been a significant increase in the amount of precipitation and its extremes with La Niña episodes in the past decades, especially during the winter monsoon period (high confidence) (Villafuerte and Matsumoto, 2015; Limsakul and Singhruck, 2016; Cheong et al., 2018).
Figure Atlas.11 shows trends in mean temperature and precipitation during 1961–2015 for two global datasets, indicating a significant overall warming over South East Asia (high confidence), with higher rates of warming in Malaysia, Indonesia, and the southern areas of mainland South East Asia (low confidence). Annual mean precipitation trends (Atlas.1.4.1 and the Interactive Atlas, which includes the regional dataset Aphrodite) over the region are mostly not significant except for increases over parts of Malaysia, Vietnam and the southern Philippines (medium confidence).
It is important to note that the availability, quality, and temporal and spatial density of observation data may lead to uncertainties and varying results in South East Asia (Juneng et al., 2016). Some efforts have been made to produce better observationally-based gridded datasets for the region (e.g., Nguyen-Xuan et al., 2016; van den Besselaar et al., 2017; Yatagai et al., 2020).
Atlas.5.4.3 Assessment of Model Performance
Performance in simulating rainfall over South East Asia varies among CMIP5 GCMs (high confidence). Only some are capable of reasonably simulating the rainfall seasonal cycle and spatial pattern (Siew et al., 2013; Raghavan et al., 2018). Over mainland South East Asia, the performance of CMIP5 GCMs in simulating rainfall during the wet season was superior to that for annual and dry-season precipitation (J. Li et al., 2019 ).
RCMs have been intensively used over the region in recent years in a series of single or multi-model experiments and there is medium confidence that they reproduce reasonably well seasonal climate patterns of temperature, precipitation and large-scale circulation over the different sub-regions of South East Asia with added values compared to their host GCMs (Kwan et al., 2014; Ngo-Duc et al., 2014, 2017; Van Khiem et al., 2014; Juneng et al., 2016; Katzfey et al., 2016; Loh et al., 2016; Raghavan et al., 2016; Cruz et al., 2017; Ratna et al., 2017; Trinh-Tuan et al., 2018; Nguyen-Thuy et al., 2021). RCM ensemble means tend to outperform the individual models in representing the climatological mean state (Ngo-Duc et al., 2014; Trinh-Tuan et al., 2018; Nguyen-Thi et al., 2021). There is relatively high consistency among the simulations of historical climate over mainland South East Asia compared to those over the Maritime Continent for both seasonal and interannual variability (Ngo-Duc et al., 2017). The consistency in rainfall simulations was lower than for temperature simulations.
Some RCMs showed a systematic cold bias (Manomaiphiboon et al., 2013; Kwan et al., 2014; Ngo-Duc et al., 2014; Loh et al., 2016; Cruz and Sasaki, 2017; Cruz et al., 2017) that was mainly due to model physics (Manomaiphiboon et al., 2013; Kwan et al., 2014) and/or the biases in the SST forcing (Ngo-Duc et al., 2014). A few simulations revealed a warm bias over some areas such as in the Maritime Continent (Cruz et al., 2017) or Vietnam (Van Khiem et al., 2014). The biases for rainfall in GCMs and RCMs over South East Asia were found to be less systematic with wet or dry biases depending on the sub-regions (Manomaiphiboon et al., 2013; Kwan et al., 2014; Van Khiem et al., 2014; Juneng et al., 2016; Supari et al., 2020; Tangang et al., 2020; Nguyen-Thi et al., 2021), although wet biases were more pronounced in RCMs (Kwan et al., 2014; Van Khiem et al., 2014; Kirono et al., 2015; Juneng et al., 2016; Supari et al., 2020; Tangang et al., 2020). Some RCMs overestimated rainfall interannual variability (Juneng et al., 2016) while some others underestimated it (Kirono et al., 2015). Simulated rainfall amount is sensitive to the choice of convective scheme (Juneng et al., 2016; Ngo-Duc et al., 2017) and the choice of land surface scheme (Chung et al., 2018). Rainfall biases in current climate simulations can be greatly reduced if a bias adjustment method such as quantile mapping is applied (Trinh-Tuan et al., 2018). The pattern of tropical cyclone numbers in the region were reasonable represented by RCM outputs (Van Khiem et al., 2014; Kieu-Thi et al., 2016; Herrmann et al., 2020).
Atlas.5.4.4 Assessment and Synthesis of Projections
Mean temperature in South East Asia is projected to continue to rise through the 21st century (virtually certain, very high confidence). Projections by multi-model regional climate simulations of CORDEX-SEA showed a temperature increment over land under RCP8.5 to range from 3°C–5°C by the end of the 21st century relative to the pre-1986–2005 period (Tangang et al., 2018). For the same periods, the average mean temperature increase over land projected by CMIP5 (CMIP6) varies, with 10th–90th percentile ranges, from 0.7°C to 1.3°C (0.7°C to 1.8°C) under RCP2.6 (SSP1-2.6) to 2.8°C to 4.4°C (2.6°C to 4.8°C) under RCP8.5 (SSP5-8.5) (Interactive Atlas). For all GWLs the land region is projected to warm by a slightly smaller amount than the global average, with 10th–90th percentile ranges for CMIP5 (CMIP6) of 1.2°C–1.6°C (1.2°C–1.5°C) for the 1.5°C GWL and of 3.3°C–4.0°C (3.3°C–3.9°C) for the 4°C GWL relative to the 1850–1900 baseline (calculated from RCP8.5 (SSP5-8.5) projections). Changes for other warming levels, periods and emissions pathways are shown in Figure Atlas.1 7 and can be explored in the Interactive Atlas.
Projections of future rainfall changes are highly variable among sub-regions of South East Asia and among the models (high confidence). The CMIP5 and CMIP6 ensembles showed an increase in annual mean precipitation over most land areas by the mid- and late 21st century, although only with a strong model agreement for higher warming levels (Figure Atlas.1 7 and the Interactive Atlas), while CORDEX produces a general decrease in projected precipitation (Figure Atlas.1 7). Based on CORDEX South East Asia multi-model simulations, significant and robust increases of mean rainfall over Indochina and the Philippines were projected while there is a drying tendency over the Maritime Continent during DJF for the early, mid and end of the 21st century periods under both RCP4.5 and RCP8.5 (Figure Atlas.1 9; Tangang et al., 2020). At the end of the 21st century during DJF and under RCP8.5, an increase of 20% in mean rainfall is projected over Myanmar, northern central Thailand and northern Laos, and of 5–10% over the eastern Philippines and northern Vietnam. During JJA, significantly drier conditions are projected over almost the entire South East Asia region except over Myanmar and northern Borneo. Over the Indonesian region, especially Java, Sumatra and Kalimantan, as much as a 20–30% decrease in mean rainfall is projected during JJA by the end of the 21st century. The projected drier condition over Indonesia from CORDEX is consistent with that of Kusunoki (2017), Giorgi et al. (2019), Kang et al. (2019) and Supari et al. (2020) and is associated with enhanced subsidence over the region (Kang et al., 2019; Tangang et al., 2020).
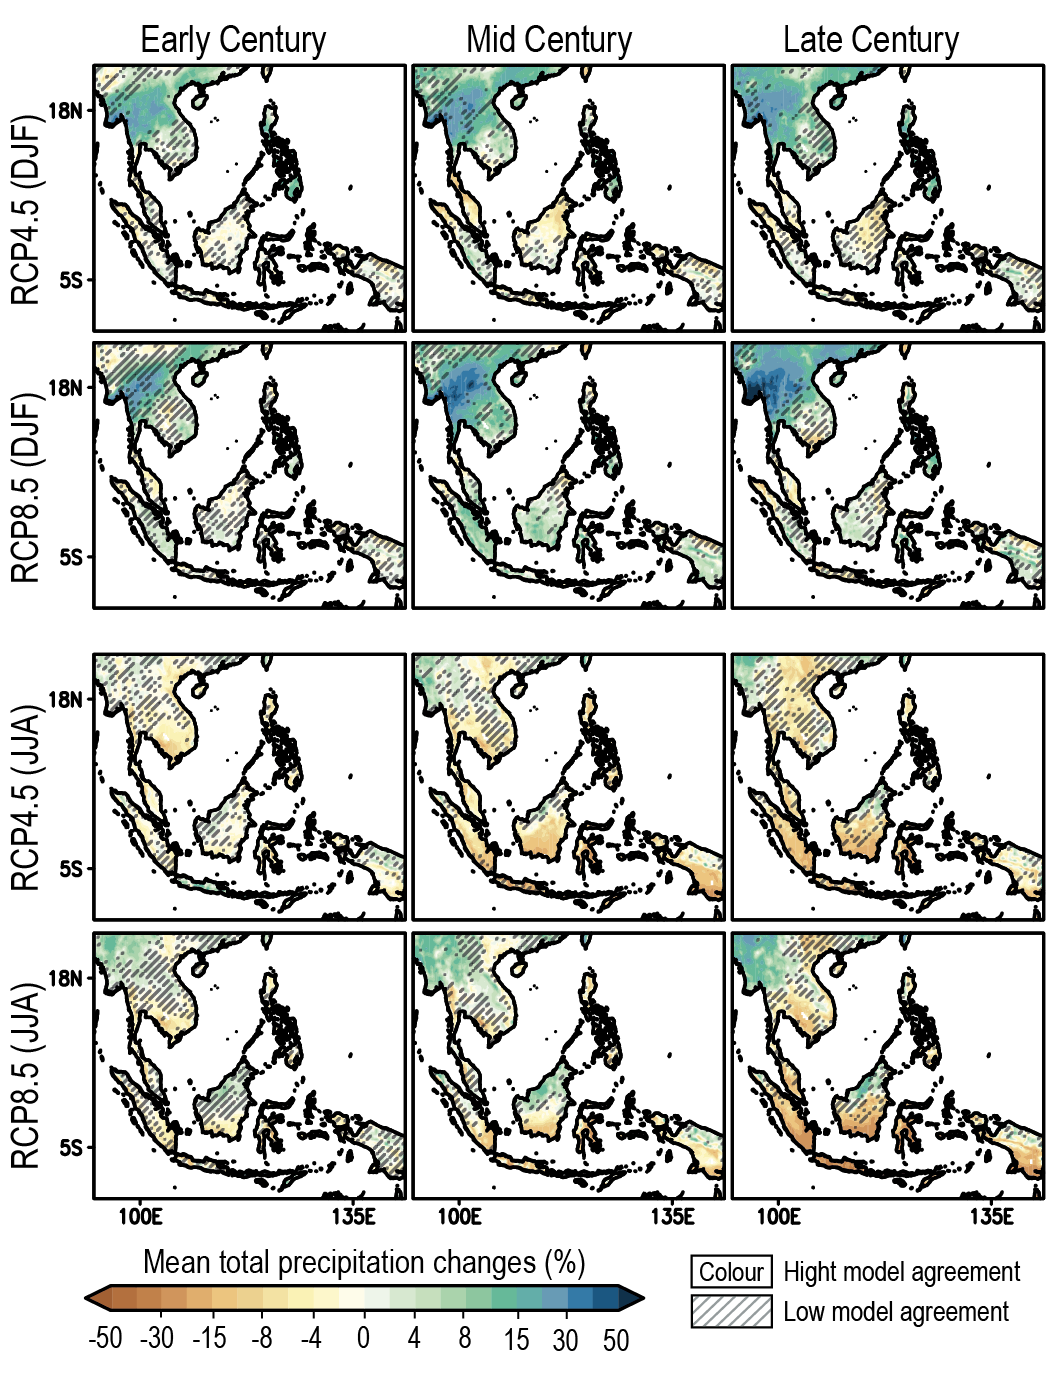 Figure Atlas.19 | The RCM-projected changes in mean precipitation between the early (2011–2040), mid- (2041–2070) and late (2071–2099) 21st century and the historical period 1976–2005. Data are obtained from the CORDEX-SEA downscaling simulations. Diagonal lines indicate areas with low model agreement (less than 80%). Figure adapted from Tangang et al. (2020).
 Atlas.5.4.5 Summary
It is virtually certain that annual mean temperature has been increasing in South East Asia in the past decades while changes in annual mean precipitation are less spatially coherent though with some increasing trends over parts of Malaysia, Vietnam and the southern Philippines (medium confidence).
Although various biases still exist, there is high confidence that the models can reproduce seasonal climate patterns well over the different sub-regions of South East Asia. There is medium confidence that the RCMs show added value compared to their host GCMs over the region.
Projections show continued warming over South East Asia, but likely by a slightly smaller amount than the global average. Projected changes in rainfall over South East Asia vary, depending on model, sub-region and season (high confidence), with consistent projections of increases in annual mean rainfall from CMIP5 and CMIP6 over most land areas (medium confidence) and decreases in summer rainfall from CORDEX projections over much of Indonesia (medium confidence).
Atlas.5.5 South West Asia
Atlas.5.5.1 Key Features of the Regional Climate and Findings From Previous IPCC Assessments
Atlas.5.5.1.1 Key Features of the Regional Climate
South West Asia includes the Arabian Peninsula (ARP) and West Central Asia (WCA) reference regions (Figure Atlas.1 7). ARP has a semi-arid or arid desert climate with very low annual mean precipitation and very high temperature. Its temperature is influenced by SST variations over the tropical ocean (e.g., ENSO) and the NAO and AO (see Annex IV for these and subsequent modes of variability; Attada et al., 2019). Rainfall is influenced by the IOD and ENSO, with more rainfall during El Niño (Kang et al., 2015; Kumar et al., 2015; Abid et al., 2018; Kamil et al., 2019) and less during La Niña (Atif et al., 2020). The wet season in ARP is mainly from November to April and the dry season is from June to August. Rainfall is confined mostly to the south-western part of the peninsula and contribution of extreme events to the total rainfall varies within 20–70% from region to region and season to season (Almazroui, 2020b; Almazroui and Saeed, 2020). WCA is separated from Eastern Europe by the Caucasus Mountains, is adjacent to ARP, with South Asia (SAS) to the south and West Siberia (WSB) to the north, and lies between the Mediterranean (MED), Tibetan Plateau (TIB) and East Central Asia (ECA) regions. WCA is heterogeneous in terrain with the Zagros Mountains and Iranian Plateau in the west and south-west, the Caspian Sea and lowland with deserts in the north and north-east. The regional climate of WCA is influenced by the NAO and ENSO and it is typically semi-arid or arid with a strong gradient in both precipitation and temperature from the mountains to the plains and from north to south.
Atlas.5.5.1.2 Findings From Previous IPCC Assessments
The IPCC AR5 established it is very likely that temperatures will continue to increase over WCA in all seasons whilst projections of decreased annual mean precipitation had medium confidence due to medium agreement resulting from model-dependent sub-regional and seasonal changes (Christensen et al., 2013). The AR5 also concluded that for a better understanding of the climate of the region, results of high-resolution regional climate models also need to be assessed and CMIP5 models generally had difficulties simulating the mean temperature and precipitation climatology for South West Asia. This is partly related to the poor spatial resolution of the models not resolving the complex mountainous terrain and the influence of different drivers of the European, Asian and African climates. However, observational data scarcity and issues related to the comparison of observations with coarse-resolution models added to the uncertainty and remained poorly analysed in peer-reviewed literature on climate model performance (Christensen et al., 2013).
The SR1.5 stated that even for 1.5°C and 2°C of global warming, South West Asia is among the regions with the strongest projected increase in hot extremes with more urban populations exposed to severe droughts in West Asia, while an increase of heavy precipitation events is projected in mountainous regions of Central Asia (Hoegh-Guldberg et al., 2018; IPCC, 2018c). Higher temperatures with less precipitation will likely result in higher risks of desertification, wildfires and dust storms exacerbated by land-use and land-cover changes in the region with consequent effects on human health. Further drying of the Aral Sea in Central Asia will likely have negative effects on the regional microclimate, adding to the growing wind erosion in adjacent deltaic areas and deserts that is already resulting in a reduction of the vegetation productivity including croplands. There is also a projected increase of precipitation intensity in the Arabian Peninsula which is likely to lead to higher soil erosion particularly in winter and spring due to floods (Mirzabaev et al., 2019). WCA includes high mountains with enhanced warming above 500 m where, regardless of the emissions scenario, decreases in snow cover are projected due to increased winter snowmelt and more precipitation falling as rain (high confidence). A very strong interannual and decadal variability, as well as scarce in situ records for mountain snow cover, have prevented a quantification of recent trends in High Mountain Asia (Hock et al., 2019b).
Atlas.5.5.2 Assessment and Synthesis of Observations, Trends and Attribution
Since AR5, there has been an increasing number of studies on past climate change in South West Asia though meteorological stations are sparsely scattered in the region. They are mainly located in the plains below 2 km of altitude, very scarce in mountainous areas and have declined in number in WCA since the end of the Soviet Union in 1991. This increases the uncertainty in both temperature and precipitation trends, particularly for elevated areas (high confidence) (Christensen et al., 2013; Huang et al., 2014). So researchers use other sources of climate data in the region, particularly freely available gridded data (Annex I).
Globally, drylands showed an enhanced warming over the past century of 1.2°C–1.3°C, significantly higher than the warming over humid lands (0.8°C–1.0°C) (J. Huang et al., 2017 ). A strong increase in annual surface air temperature of 0.27°C–0.47°C per decade has been found over WCA between 1960 and 2013 (very high confidence) (Han and Yang, 2013; Li et al., 2013; Hu et al., 2014, 2017; Huang et al., 2014; Deng and Chen, 2017; Zhang et al., 2017, 2019a; H. Guo et al., 2018 ; Haag et al., 2019; Yu et al., 2019). Warming is most prominent in the spring based on the CRU dataset with rates likely ranging from 0.64°C–0.82°C per decade (Hu et al., 2014). Analysis of seasonal temperature trends based on high-resolution 1 km × 1 km downscaled dataset CHELSA and 20 stations in Uzbekistan has confirmed the maximum significant trend in temperature from 0.6°C up to 1°C per decade in spring from 1979 to 2013 and no significant trend in winter (Khaydarov and Gerlitz, 2019). There is very high confidence (robust evidence, high agreement) that the shrinking of the Aral Sea has induced an increase in surface air temperature around the Aral Sea region in the range of 2°C–6°C (Baidya Roy et al., 2014; McDermid and Winter, 2017; Sharma et al., 2018). The plateau of Iran has experienced significant increases in the average monthly values of daily maximum and minimum temperatures with spatially varying rates of 0.1°C–0.3°C up to 0.3°C–0.4°C per decade and greater spatial variation in minimum temperatures (high confidence) (Mahmoudi et al., 2019; Fathian et al., 2020; Sharafi and Mir Karim, 2020).
Observed warming over northern ARP is higher than over the south, where minimum temperatures are increasing faster than maximum temperatures (Almazroui, 2020a). The rate of mean temperature increase is estimated at 0.10°C per decade over 1901–2010 (Attada et al., 2019), while it has reached 0.63°C (likely in the range of 0.24°C–0.81°C) per decade for the more recent period of 1978–2019 (Almazroui, 2020a).
An overall increasing trend of annual precipitation (0.66 mm per decade) was found over Central Asia based on GPCC v7 data for the period 1901–2013 (Hu et al., 2017), but annual trends were found not significant over the shorter period 1960–2013 (Figure Atlas.11 and Interactive Atlas). Winter precipitation saw a significant increase of 1.1 mm per decade (Song and Bai, 2016). These estimates have low to medium confidencesince the satellite precipitation products have large systematic and random errors in mountainous regions. Moreover CMORPH and TRMM products fail to capture the precipitation events in the ice/snow covered regions in winter and show a substantial false-alarm percentage in summer, but the gauge-corrected GSMAP performs better than other products (Song and Bai, 2016; Guo et al., 2017b; Hu et al., 2017; S. Chen et al., 2019 ). Over the elevated part of eastern WCA precipitation increases in the range of 1.3–4.8 mm per decade during 1960–2013 were observed (very high confidence) (Han and Yang, 2013; Li et al., 2013; Hu et al., 2014, 2017; Huang et al., 2014; Deng and Chen, 2017; Zhang et al., 2017, 2019a; H. Guo et al., 2018 ; Haag et al., 2019; Yu et al., 2019). Reductions in spring precipitation and increases in winter have been reported for Uzbekistan over the period 1979–2013 based on station data but these are not significant (Khaydarov and Gerlitz, 2019). There is very low confidence of the impact of the Aral Sea shrinking on precipitation (Chen et al., 2011; Jin et al., 2017).
A decreasing trend of precipitation is reported for ARP with the mean value of –6.3 mm per decade (range of –30 mm–16 mm) for the period 1978–2019 (low confidence) with large interannual variability over Saudi Arabia, which covers 80% of the region (AlSarmi and Washington, 2011; Almazroui et al., 2012; Donat et al., 2014). The same decreasing trend in precipitation totals and an increasing trend in the number of consecutive dry days are found for most of the Iranian Plateau (medium confidence) (Rahimi and Fatemi, 2019; Fathian et al., 2020; Sharafi and Mir Karim, 2020). January-to-March mean snow cover and depth over mountainous areas decreased between 2000 and 2019 (low to medium confidence due to limited evidence) (Safarianzengir et al., 2020).
Atlas.5.5.3 Assessment of Model Performance
There is limited evidence about the performance of GCMs and RCMs in representing the current climate of South West Asia due to very few studies evaluating models over this region, but literature is now emerging particularly on CMIP5/CMIP6 and CORDEX simulations.
Over ARP, surface temperature biases for 18 of 30 CMIP5 models are within one standard deviation of the observed variability (Almazroui et al., 2017). A warm bias in summer and a cold bias for other months along with an underestimation of wet-season precipitation and an overestimation in the dry season have been reported in 26 CMIP5 models (Lelieveld et al., 2016). Thirty CMIP6 GCMs have limited skill in simulating annual precipitation patterns, annual cycle statistics and long-term precipitation trends over Central Asia partially due to considerable wet biases of up to 100% in the southern Xinjiang and Hexi Corridor regions (Guo et al., 2021). Also, CMIP6 models display a wide range of performance in reproducing ENSO teleconnections that influence the region (Barlow et al., 2021).
RCM simulations using the CORDEX-MENA domain reproduce the main features of the mean surface climatology over ARP with moderate biases (high confidence). RegCM4 driven by five GCMs (HadGEM2, GFDL, CNRM, CanESM2 and ECHAM6) showed an ensemble-mean cold bias of about –0.7°C and a dry bias of –13% over ARP (Almazroui, 2016) with a cold (warm) bias over western (south-eastern) areas (Syed et al., 2019). Temperature biases in 30-year historical simulations with WRF using three different radiation parametrizations were within ±2°C and mostly caused by surface long-wave radiation errors which affected nighttime minimum temperatures over 70% of the domain (Zittis and Hadjinicolaou, 2017). Mean absolute errors in COSMO-CLM driven by ERA-Interim were about 1.2°C for temperature, 15 mm per month for precipitation and 9% for total cloud cover, and with new parametrizations of albedo and aerosols optimized for the region the RCM simulated the main climate features of this very complex area (Bucchignani et al., 2016). RegCM4.4 also simulated the main features of the observed climatology (especially for dry regions) with temperature biases within ±3.0°C. Annual precipitation was overestimated with winter and spring underestimated (Ozturk et al., 2018).
Four RCMs (REMO, RegCM4.3.5, ALARO-0, and COSMO-CLM5.0) driven by ERA-Interim, NCEP2 reanalyses and two different GCMs reproduced reasonably well the spatio-temporal patterns for temperature and precipitation though underestimated diurnal temperature range and had cold biases over mountainous and high plateau regions in all seasons. There is low confidence in this result because of low station density and a lack of high-elevation stations, and with biases dependent on the choice of the observational dataset. However, the performance of both GCMs and RCMs is better than reanalyses when compared to available observations (Mannig et al., 2013; Ozturk et al., 2017; Russo et al., 2019; Top et al., 2021).
Atlas.5.5.4 Assessment and Synthesis of Projections
Temperature and precipitation projections from CMIP5/CMIP6 and CORDEX for different GWLs, SSP and RCP scenarios, time periods and baselines are shown in Figure Atlas.1 7 and further details can be explored in the Interactive Atlas.
In WCA, projections for different GWLs are consistent not only in annual and seasonal warming but in the ranges of the projections. Under RCP8.5, annual mean temperature will likely exceed 2°C by mid-century (compared with 1995–2014) and reach up to 4.8°C–6°C by the end of the century (Yang et al., 2017), with faster warming projected by the CMIP6 ensemble under SSP5-8.5. In individual county-level studies on GCM future climate projections, temperatures increased by up to 7°C by the end of the century, depending on season and emissions scenario (Allaberdiyev, 2010; MENRPG, 2015; MNP, 2015; Gevorgyan et al., 2016; Osborn et al., 2016; Aalto et al., 2017; IDOE, 2017; Salman et al., 2017). Statistical downscaling of 18 CMIP5 GCMs projected an annual temperature increase of 0.37°C per decade (under RCP4.5) with the maximum in northern WCA and warming most conspicuous in summer (Luo et al., 2019). RCM downscaling of GCMs over Central Asia projected a larger increase of temperature under RCP8.5 for the 2071–2100 period, ranging from 5°C to 8°C (Ozturk et al., 2017).
In ARP, the projected change in ensemble mean annual temperature from 30 CMIP6 models is from 1.6°C (SSP1-2.6) to 5.3°C (SSP5-8.5) by 2070–2099 compared to 1981–2010 (Almazroui et al., 2020a). The projected warming is the highest in the north, reaching 5.9°C and lowest in the south (4.7°C). COSMO-CLM projections over the CORDEX-MENA domain show for ARP and WCA a strong warming with marked seasonality for the end of the 21st century, ranging from 2.5°C in winter under RCP4.5 to 8°C in summer under RCP8.5 and with large increases found over high-altitude areas in winter and spring (Bucchignani et al., 2018; Ozturk et al., 2018). The CMIP5 multi-model mean warming in boreal summer in 2070–2099, compared with 1951–1980, is projected to be about 2.5°C and 6.5°C at the 2°C and 4°C global warming levels respectively (Huang et al., 2014).
Future projections of precipitation in South West Asia have large uncertainties and thus low confidence. There are few significant changes, little consensus on the sign and with a tendency for reduction in CMIP5 being reversed in CMIP6 across all warming levels (Ozturk et al., 2018). Statistical downscaling of 18 CMIP5 GCMs under RCP4.5 projected an increase in precipitation of 4.6 mm per decade in South West Asia during 2021–2060 relative to 1965–2004 (Luo et al., 2019). CMIP5 simulations project a general decrease in precipitation over lowlands in Turkey, Iran, Afghanistan and Pakistan (Ozturk et al., 2017), and an increase over high-mountain regions (Aalto et al., 2017; Salman et al., 2018). At a 4°C global warming level, the multi-model mean annual precipitation for Turkmenistan and parts of Tajikistan and Uzbekistan is projected to decrease by 20%, with somewhat stronger relative decreases in summer (Reyer et al., 2017). Over northern WCA, the CMIP5 ensemble mean projects increases of over 3 mm per decade under RCP2.6 and over 6 mm per decade under RCP4.5 and RCP8.5 over the 21st century (Huang et al., 2014). Mean annual precipitation is projected to rise by 5.2% at the end of the 21st century (2070–2099) under RCP8.5, compared to 1976–2005, while mean annual snowfall is projected to decrease by 26.5% in Central Asia (Yang et al., 2017). However, regardless of the sign of the precipitation change in the high-mountain regions of Central Asia, the influence of the warming on the snowpack will very likely cause important changes in the timing and amount of the spring melt (Diffenbaugh et al., 2013).
In ARP, the projected change in ensemble mean annual precipitation from 30 CMIP6 models ranges from 3.8% (–2.6 to 28.8%) to 31.8% (12.0–106.5%) under SSP1-2.6 and SSP5-8.5 emissions for the period 2080–2100 compared with 1995–2014 (Almazroui et al., 2020a). North-west ARP precipitation is projected to decrease between –6 to –27% per decade and in the south precipitation to increase by up to 8.6% per decade. CMIP6 projections are in line with those from CMIP3 and CMIP5, however they are less variable in the central area in CMIP6. The uncertainty associated with precipitation over ARP is large because of very low annual amounts and high variability.
Atlas.5.5.5 Summary
Increases in annual surface air temperature over South West Asia are very likely in the range of 0.24°C–0.81°C per decade over the last 50–60 years. Annual precipitation change over ARP since 1970 is estimated at –6.3 mm per decade (and in the range of –30 to 16 mm per decade) and over WCA is generally not significant except over the elevated part of eastern WCA where increases between 1.3 mm and 4.8 mm per decade during 1960–2013 have been observed (very high confidence). In mountainous areas, the scarcity and decline of the number of observation sites since the end of the former Soviet Union in 1991 increase the uncertainty of the long-term temperature and precipitation estimates (high confidence).
Mean temperature biases in RCMs are within ±3°C in South West Asia, and annual precipitation biases are positive in almost all parts of the region, except over the ARP where they are negative in the wet season (November to April) and over WCA in winter and spring (from December to May) (medium confidence). Since regional model evaluation literature has only recently emerged there is medium evidence about the performance of RCMs in South West Asia though with medium to high agreement on mean temperature and precipitation biases. RCMs simulate colder temperatures than observed over mountainous and high plateau regions (limited evidence, high agreement).
Further warming over South West Asia is projected in the 21st century to be greater than the global average, with rates varying from 0.25°C to 0.8°C per decade depending on the season and scenario, and the maximum rates found in the northern part of the region in summer (high confidence). The influence of the warming on the snowpack will very likely cause changes in the timing and amount of the spring melt. CMIP6 projected changes in annual precipitation totals are in the range of –3 to 29% (SSP1-2.6) and 12–107% (SSP5-8.5) in ARP (medium confidence). Strong spatio-temporal differences with overall precipitation decreases are projected in the central and northern parts of WCA in summer (JJA) with increases in winter (DJF) (medium confidence).
Atlas.6 Australasia
The assessment in this section focuses on changes in average temperature and precipitation (rainfall and snow), including the most recent years of observations, updates to observed datasets, the consideration of recent studies using CMIP5 and those using CMIP6 and CORDEX simulations. Assessment of changes in extremes is in Chapter 11 (Tables 11.10–12) and climatic impact-drivers in Chapter 12 (Table 12.5).
Atlas.6.1 Key Features of the Regional Climate and Findings From Previous IPCC Assessments
Atlas.6.1.1 Key Features of the Regional Climate
Australasia is divided into five regions for the Atlas (Figure Atlas.21), as follows: New Zealand (NZ), with a varied climate with diverse landscapes, mainly maritime temperate with four distinct seasons; Northern Australia (NAU), which is mainly tropical with monsoonal summer-dominated rainfall (monsoon season December to March, see Annex V), but with a hot, semi-arid climate in the south of the region; Central Australia (CAU) with a predominantly hot, dry desert climate; Eastern Australia (EAU) with a temperate oceanic climate at the coast to semi-arid inland; and Southern Australia (SAU), which ranges from Mediterranean and semi-arid in the west to mainly cool temperate maritime climate in the south-east. Various remote drivers have notable teleconnections to regions within Australasia, including an effect of the El Niño–Southern Oscillation (ENSO) and the Indian Ocean Dipole (Table Atlas.1 and Annex IV). Much of southern NZ and SAU are affected by systems within the westerly mid-latitude circulation, in turn affected by the Southern Annular Mode (SAM). The monsoon and the Madden–Julian Oscillation (MJO) affect rainfall variability in northern Australia.
 Figure Atlas.21 | Regional changes over land in annual mean surface air temperature and precipitation relative to the 1995–2014 baseline for the reference regions in Australasia (warming since the 1850–1900 pre-industrial baseline is also provided as an offset). Bar plots in theleft panel of each region triplet show the median (dots) and 10th–90th percentile range (bars) across each model ensemble for annual mean temperature changes for four datasets (CMIP5 in intermediate colours; a subset of CMIP5 used to drive CORDEX in light colours; CORDEX overlying the CMIP5 subset with dashed bars; and CMIP6 in solid colours); the first six groups of bars represent the regional warming over two time periods (near-term 2021–2040 and long-term 2081–2100) for three scenarios (SSP1-2.6/RCP2.6, SSP2-4.5/RCP4.5 and SSP5-8.5/RCP8.5), and the remaining bars correspond to four global warming levels (GWLs: 1.5°C, 2°C, 3°C and 4°C). The scatter diagrams of temperature against precipitation changes display the median (dots) and 10th–90th percentile ranges for the above four warming levels for December–January–February (DJF; middle panel) and June–July–August (JJA; right panel), respectively; for the CMIP5 subset only the percentile range of temperature is shown, and only for 3°C and 4°C GWLs. Changes are absolute for temperature (in °C) and relative (as %) for precipitation. See Atlas.1.3 for more details on reference regions (Iturbide et al., 2020) and Atlas.1.4 for details on model data selection and processing. The script used to generate this figure is available online (Iturbide et al., 2021) and similar results can be generated in the Interactive Atlas for flexibly defined seasonal periods. Further details on data sources and processing are available in the chapter data table (Table Atlas.SM.15).
 Atlas.6.1.2 Findings From Previous IPCC Assessments
The AR5 WGI and WGII reports (IPCC, 2013c; Stocker et al., 2013; Reisinger et al., 2014) give very high confidence that air and sea temperatures in the region have warmed; cool extremes have become rarer in Australia and New Zealand since 1950, while hot extremes have become more frequent and intense (e.g., it is very likely that the number of warm days and nights have increased). The AR5 reported that it is virtually certain that mean air and sea temperatures will continue to increase, with very high confidence that the greatest increase will be experienced by inland Australia and the smallest increase by coastal areas and New Zealand. The AR5 reported a range of different precipitation trends within the region. For example, while annual rainfall has been significantly increasing in north-western Australia since the 1950s (very high confidence), it has been decreasing in the north-east of the South Island of New Zealand over 1950–2004 (very high confidence) and over the south-west of the state of Western Australia. In line with these trends, AR5 reported it is likely that drought has decreased in north-west Australia. Future projections for precipitation extremes indicate an increase in most of Australia and New Zealand, in terms of rare daily rainfall extremes (i.e., current 20-year return period events) and of short duration (sub-daily) extremes (medium confidence). Likewise, however, there is a projected increase in the frequency of drought in southern Australia (medium confidence) and in many parts of New Zealand (medium confidence). Owing to hotter and drier conditions there is high confidence that the occurrence of fire weather will increase in most of southern Australia, and medium confidence that the fire danger index will increase in many parts of New Zealand.
The AR5 reported mean sea levels have also increased in Australia and New Zealand at average rates of relative sea level rise of 1.4 ± 0.6 mm yr–1from 1900 to 2011, and 1.7 ± 0.1 mm yr–1from 1900 to 2009, respectively (very high confidence). The assessment found that the volume of ice in New Zealand has declined by 36–61% from the mid- to late 1800s to the late 1900s (high confidence), while late-season significant snow depth has also declined in three out of four Snowy Mountain sites in Australia between 1957 and 2002 (high confidence). As mean sea level rise is projected to continue for at least several more centuries, there is very high confidence that this will lead to large increases in the frequency of extreme sea level events in Australia and New Zealand. On the other hand, the volume of winter snow and the number of days with low-elevation snow cover in New Zealand are projected to decrease in the future (very high confidence), while both snow depth and area are projected to decline in Australia (very high confidence).
The SROCC (Hock et al., 2019b) reports on the observed and projected decline in snow cover in Australasia, as well as the retreat of New Zealand glaciers following an advance in 1983–2008 due to enhanced snowfall. It also reports on the vulnerability of some Australian communities and ecosystems to sea level rise, increases in the intensity and duration of marine heatwaves driven by human influence (high confidence), the decrease in frequency of tropical cyclones’ landfall on eastern Australia since the late 1800s (low confidence in an anthropogenic signal), and presents a case study on the multiple hazards, compound risk and cascading impacts from climate extremes in Tasmania in 2015–2016 (including an attributable human influence on some events). The SRCCL (Mirzabaev et al., 2019) found widespread vegetation ‘greening’ has occurred in parts of Australia, and an increase in the desertification and drought risk in future in southern Australia.
Atlas.6.2 Assessment and Synthesis of Observations, Trends and Attribution
Reliable station observations are available from around 1900 in Australasia, but in some regions the coverage was and remains poor. Australia and New Zealand have continued to warm, and many rainfall trends have continued since AR5. Changes and trends in temperature and precipitation from 1961 to 2015 from three different global datasets are displayed in Figure Atlas.11 and the Interactive Atlas, and show significant (at 0.1 significance level) warming trends over southern and eastern Australia. Most of the observed changes in precipitation over the region are not significant over this period. Although observed datasets (e.g., GPCC and GPCP) generally agree on a significant drying trend in the southern regions of New Zealand during the shorter 1980–2015 period, this is in fact the reverse of the longer-term trends in 1961–2015 (Interactive Atlas).
For a longer-term perspective based on high-quality regional datasets, Figure Atlas.20 shows Australasia has warmed over the last century (very high confidence). Australian mean temperature has increased by 1.44°C ± 0.24°C during the period 1910–2019 using the updated observed temperature dataset ACORN-SATv2.1, with 2019 Australia’s hottest year on record and nine out of 10 of the warmest years on record occurring since 2005 (Trewin et al., 2020). Much of the warming has occurred since 1960, there is clear anthropogenic attribution of this change and emergence of the signal from the1850–1900 climate (BOM and CSIRO, 2020; Hawkins et al., 2020). Warming has been more rapid than the national average in central and eastern Australia, with a warming minimum and non-significant trends since the 1960s in the north-west (CSIRO and BOM, 2015; BOM and CSIRO, 2020). The National Institute of Water and Atmospheric Research temperature record, NIWA NZ, shows a warming of 1.13°C ± 0.27°C during the period 1909–2019, although several stations show non-significant trends since 1960 (Figure Atlas.20), including a warming minimum in the south-east at least partly due to a persistent shift in atmospheric circulation (Sturman and Quénol, 2013; MfE and Stats NZ, 2017, 2020).
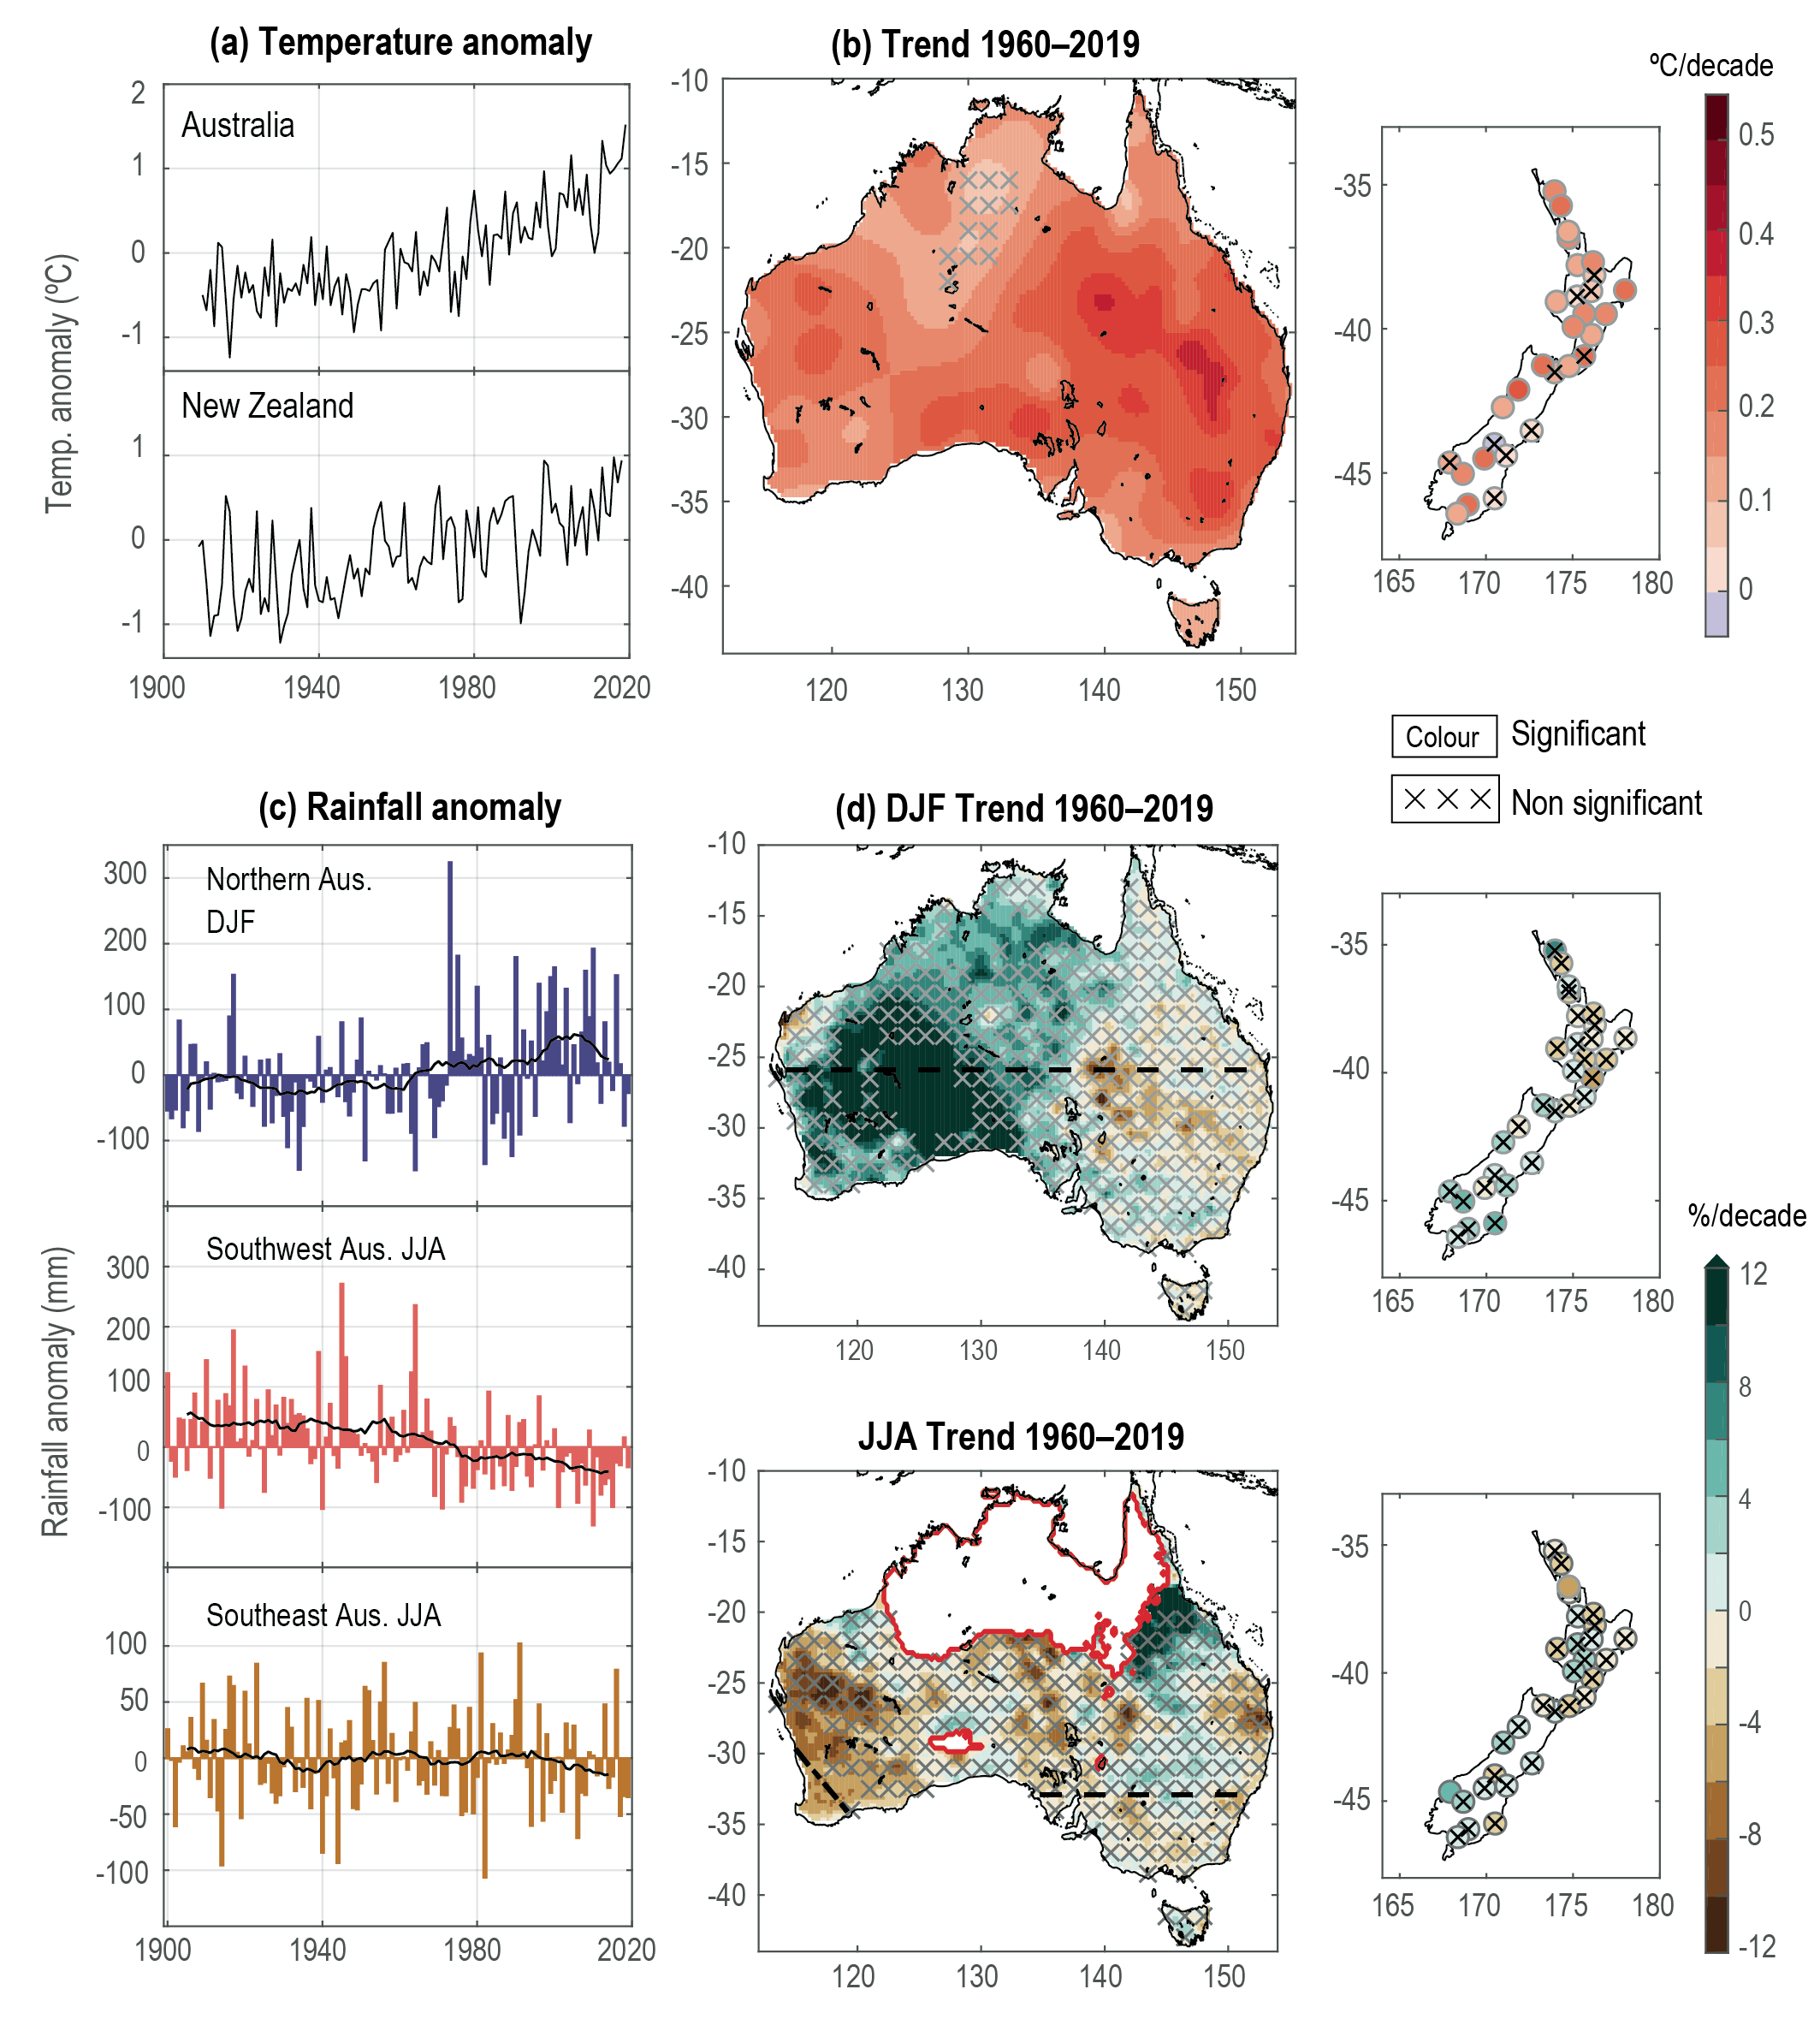 Figure Atlas.20 | Observed trends in mean annual temperature (a, b) and summer (December–January–February, DJF) and winter (June–July–August, JJA) precipitation (c, d) for Australia and New Zealand from high-quality regional datasets. Time series show anomalies from the 1961–1990 average and 10-year running mean; maps show annual linear trends for 1960–2019; rainfall trends are shown in % per decade, crosses show areas and stations with a lack of significant trend and regions of seasonally dry conditions (<0.25 mm day–1) are masked and outlined in red. Datasets are Australian Climate Observation Reference Network – Surface Air Temperature version 2.1 (ACORN-SATv2.1) for Australian temperature, the Australian Gridded Climate Data (AGCD) for Australian rainfall (Evans et al., 2020), and the 30-station high-quality network for New Zealand temperature and rainfall. Further details on data sources and processing are available in the chapter data table (Table Atlas.SM.15).
 Since 1960, precipitation has increased in much of mainland Australia in austral summer and decreased in many regions of southern and eastern Australia in austral winter (Figure Atlas.20). A detectable anthropogenic signal of increases in precipitation in Australia has been reported particularly for north central Australia and for a few regions along the south-central coast for the period 1901–2010 (Knutson and Zeng, 2018). Seasonally, there is a significant decline in winter rainfall in the south-west of the state of Western Australia (Figure Atlas.20), with an attributable human influence (high confidence, robust evidence, medium agreement) (Section 10.4 and references therein, e.g., Delworth and Zeng, 2014). Rainfall trends in the south-east are not significant since 1960 but have shown a notable reduction since the 1990s, and there is limited evidence for the attribution of this change to human influence (e.g., Rauniyar and Power, 2020). In New Zealand between 1960 and 2019 in both summer and winter, rainfall increased in some stations in the South Island and decreased at many stations in the North Island, however most station trends are not statistically significant (Figure Atlas.20; MfE and Stats NZ, 2020). In JJA, Milford Sound (increasing) and Whangaparaoa (decreasing) trends are significant.
In Australia, there has been a decrease in snow depth and area since the late 1950s, especially in spring (BOM and CSIRO, 2018). Based on a reconstructed snow cover record, the recent rapid decrease in the past five decades has been shown to be larger by more than an order of magnitude than the maximum loss for any five-decade period over the past 2000 years (McGowan et al., 2018). In New Zealand, from 1977 to 2018, glacier ice volume decreased from 26.6 km3to 17.9 km3 (a loss of 33%; Salinger et al., 2019).
Atlas.6.3 Assessment of Climate Model Performance
Most studies assessed in AR5 WGII were based on Coupled Model Intercomparison Project Phase 3 (CMIP3) models and Special Report on Emissions Scenarios (SRES) scenarios and CMIP5 models whenever available. The AR5 WGI reported that model biases in annual temperature and rainfall are similar to or lower than other continental regions outside the tropics, with temperature biases generally <1°C in the multi-model mean and <2°C in most models over Australia compared to reanalysis, and with a wet bias over the Australian inland region but a dry bias near coasts and mountain regions of both Australia and New Zealand.
Early results from CMIP6 suggest incremental improvements compared to CMIP5 in the simulation of the mean annual climatology of temperature and precipitation of the Indo-Pacific region surrounding Australasia, the teleconnection between ENSO and IOD and Australian rainfall and other relevant climate features (Grose et al., 2020). These assessments suggest that confidence in projections is similar to AR5 or incrementally improved. The CORDEX Australasia simulations are found to have cold biases in daily maximum temperature and an overestimation of precipitation but overall showed added value in the simulation of the current climate (Di Virgilio et al., 2019; Evans et al., 2021).
Atlas.6.4 Assessment and Synthesis of Projections
Similar to the global average (Chapter 4), mean temperature in Australasia is projected to continue to rise through the 21st century at a magnitude proportional to the cumulative greenhouse gas emissions (virtually certain, very high confidence, robust evidence), CMIP5 and CMIP6 results are shown in Figure Atlas.21. A higher end to the range of temperature projections is found in CMIP6 compared to CMIP5 (Grose et al., 2020), produced by a group of models with high climate sensitivity (Forster et al., 2020), and this creates a higher multi-model-mean change. For example, projections for Australasia including ocean between 1995–2014 and 2081–2100 are 1.4°C (1.1°C–1.8°C, 10th–90th percentile range) in CMIP5 under RCP4.5, but 1.8°C (1.3°C–2.5°C) in CMIP6 under SSP2-4.5.
Using warming levels, the results can be directly compared, accounting for the different distribution of climate sensitivities in the two ensembles. In this framework, Australasia (land only) is projected to warm by a similar amount to the global average: 1.4°C–1.8°C for the 1.5°C warming level, through to 3.9°C–4.8°C for the 4°C warming level from the 1850–1900 baseline in CMIP6 using SSP5-8.5 (results using other SSPs and from CMIP5 are similar). Projected warming is greater over land than ocean, greater in Australia than in New Zealand, and greater over inland Australia than in coastal regions. Due to historical warming, projected temperature change from the AR6 baseline of 1995–2014 is lower: 0.3°C–1.0°C for the 1.5°C warming level, through to 2.9°C–4.0°C for the 4°C warming level. Changes for other warming levels, sub-regions and emissions pathways are shown in Figure Atlas.21 and can be explored in the Interactive Atlas. Regional modelling suggests projected temperature increase is higher in mountainous areas than surrounding low-elevation areas in New Zealand and Australia (Olson et al., 2016; MfE, 2018).
In line with recent trends, a significant reduction in annual mean rainfall in south-west Australia is projected, with the greatest reduction in winter and spring (very likely , high confidence). There is more than 80% model agreement for projected mean annual rainfall decrease in the south-west of the state of Western Australia for both the mid- (2041–2060) and far (2081–2100) future, and for all warming levels (Interactive Atlas). Rainfall decreases, mainly in winter and spring, are also projected for other regions within southern Australia with onlymedium confidence (medium evidence, medium agreement). Almost all models project continued drying in SAU in winter (JJA) and also in spring (SON), but a few models show little change. CMIP5 and CMIP6 results are similar or with a slightly narrower range in the latter (Figure Atlas.21). CORDEX produces a similar range of change in winter rainfall change for SAU as a whole. Circulation change is the dominant driver of these projected reductions, explaining the range of model results for southern Australia (CSIRO and BOM, 2015; Mindlin et al., 2020). Studies of winter rainfall change and circulation in southern Australia suggest the wettest changes in winter rainfall change may possibly be rejected (Grose et al., 2017, Grose et al., 2019a).
The model mean projection of northern Australian wet-season precipitation (a period including DJF) is for little change under all SSPs and warming levels, with low confidence in the direction of change as the projections include both large and significant decrease and increases (Figure Atlas.21 and Interactive Atlas). Evidence from warming patterns suggests a constraint on the dry end of projections (Brown et al., 2016), and the CMIP6 ensemble suggests that the projection follows the zonally averaged rainfall response in the Southern Hemisphere rather than changes in the western Pacific (Narsey et al., 2020). There is also evidence for a projected increase in rainfall variability in northern Australia in scales from days to decades (Brown et al., 2017). Liu et al. (2018) find that under 1.5°C warming, central and north-east Australia are projected to become wetter, however this projection has low confidence. There are similar projections from CMIP5 and CMIP6 (Figure Atlas.21).
Projections for EAU vary by season, with moderate model agreement on a decrease in rainfall in winter and spring, but with lower agreement in CMIP6 compared to CMIP5, and low model agreement on the direction of change in summer (Figure Atlas.21). CAU shows a similar range of change as EAU, with low model agreement on the direction of change in DJF, moderate agreement on direction of change in JJA, but significant changes are projected by some models. Other seasonal and regional rainfall changes in Australia are reviewed in Dey et al. (2019).
For the NZ reference region, precipitation is projected to increase in winter and annual rainfall, with some differences in magnitude between CMIP5, CMIP6 and CORDEX (Figure Atlas.21). This projection of rainfall increase is a function of changes in the southern extent of the region, and notable regional differences are expected. Regional modelling suggests precipitation increases in the west and south of New Zealand and decreases in the north and east (MfE, 2018), with medium confidence and notable differences by season. Liu et al. (2018) project that the North Island will be drier, while the South Island will be wetter under both 1.5°C and 2°C warming levels. The projected increase in precipitation in the far future (2081–2100) for the southern regions of NZ has high agreement (Interactive Atlas). Other seasonal and regional rainfall changes in Australia can be explored in the Interactive Atlas.
The CORDEX Australasia simulations produce some regional detail in projected precipitation change associated with important features such as orography. Areas where there is coincident ‘added value’ in the simulation of the current climate and ‘potential added value’ as new information in the projected climate change signal (collectively termed ‘realized added value’) in Australia include the Australian Alps, Tasmania and parts of northern Australia (Di Virgilio et al., 2020). There have been several studies of regional climate change for New Zealand and states within Australia at fine resolution (5–12 km) that have produced important insights. One is enhanced drying in cool seasons on the windward slopes of the southern Australian Alps (decreases of 20–30% compared to 10–15% in the driving models), and conversely a chance of enhanced rainfall increase on the peaks of mountains in summer (Grose et al., 2019b), with the summer finding in line with those for the European Alps (Giorgi et al., 2016).
Under future warming, the snowpack in Australia is projected to decrease by approximately 15% and 60% by 2030 and 2070 respectively under the SRES A2 scenario (Di Luca et al., 2018), while in New Zealand the number of annual snow days is projected to decrease by 30 days or more by 2090 under RCP8.5 (MfE, 2018). New Zealand is also projected to lose up to 88 ± 5% of its glacier volume by the end of the 21st century (Chinn et al., 2012; Hock et al., 2019a).
Atlas.6.5 Summary
There is very high confidence that the climate of Australia warmed by around 1.4°C and New Zealand by around 1.1°C since reliable records began in 1910 and 1909 respectively, with human influence the dominant driver. Warming is virtually certain to continue, with a magnitude roughly equal to the global average temperature. A significant decrease in April to October rainfall in the south-west of the state of Western Australia observed from 1910 to 2019 is attributable to human influence with high confidence and is very likely to continue in future, noting consistent projections in CMIP5 and CMIP6. Other observed and projected rainfall trends are less significant or less certain. Model representation of the climatology of Australasian temperature and rainfall has improved since AR5, through an incremental improvement between CMIP5 and CMIP6, and the development of coordinated regional modelling through CORDEX-Australasia. Snow cover is likely to decrease throughout the region at high altitudes in both Australia and New Zealand (high confidence).
Atlas.7 Central and South America
The assessment in this section focuses on changes in average surface temperature and precipitation (rainfall and snow), including the most recent years of observations, updates to observed datasets, the consideration of recent studies using CMIP5 and those using CMIP6 and CORDEX simulations. Assessment of changes in extremes is in Chapter 11 (Tables 11.13–15) and climatic impact-drivers in Chapter 12 (Table 12.6). It considers climate change over the regions shown in Figure Atlas.22, extending to all territories from Mexico to South America, including the Caribbean islands. This figure supports the assessment of regional mean changes over the region which, due to the high climatological and geographical heterogeneity, has been split into two sub-regions: Central America and the Caribbean, and South America.
Atlas.7.1 Central America and the Caribbean
Atlas.7.1.1 Key Features of the Regional Climate and Findings From Previous IPCC Assessments
Atlas.7.1.1.1 Key Features of the Regional Climate
The Central America and Caribbean region is assessed considering three reference regions Southern Central America (SCA), including the isthmus and the Yucatan Peninsula; Northern Central America (NCA), including Mexico (centre and north); and the Caribbean (CAR), including the Greater Antilles, the Lesser Antilles, the Bahamas and other small islands (see Figure Atlas.22); NCA is also covered in Section Atlas.9 North America.
Precipitation in most of SCA is characterized by two maxima in June and September, an extended dry season from November to May, and a shorter relatively dry season between July and August known as the midsummer drought (MSD; Chapter 10; Magaña et al., 1999; Perdigón-Morales et al., 2018). To some extent, precipitation seasonality is explained by the migration of the Inter-tropical Convergence Zone (ITCZ) (Taylor and Alfaro, 2005). The climate of NCA is temperate to the north of the Tropic of Cancer, with a marked difference between winter and summer, modulated by the North American Monsoon (NAmerM, Section 8.3.2.4.4). The CAR region has two main seasons, characterized by differences in temperature and precipitation. The wet or rainy season, with higher values of temperature and accumulated precipitation, occurs during the boreal summer and part of spring and autumn (Gouirand et al., 2020). The MSD is also present in the Greater Antilles and the Bahamas (Taylor and Alfaro, 2005), influenced by the oscillations of the North Atlantic Subtropical High (NASH), interacting with the Pacific and Atlantic branches of the ITCZ and modulated by the Atlantic Warm Pool and the Caribbean low-level jet (CLLJ), while the Atlantic ITCZ is responsible for the unimodal rainfall cycle of the central and southern Lesser Antilles (Martinez et al., 2019). The CLLJ is a persistent climatological feature of the low-level circulation in the Central Caribbean, with a characteristic semi-annual cycle with maxima in the summer (main) and winter (secondary) (Amador, 1998; Magaña et al., 1999; Whyte et al., 2008). Temporal variability is influenced by several large-scale atmospheric modes (Annex IV and Table Atlas.1). A significant positive correlation between precipitation rates in CAR and the Atlantic Multi-decadal Variability (AMV) was found (Enfield et al., 2001). A similar result was found in southern Mexico (north of SCA) in the MSD region (see case-study discussion in Section 10.4.2.3; Méndez and Magaña, 2010; Cavazos et al., 2020). On the other hand, ENSO favours wet conditions in NCA, but its effect is modulated by Pacific Decadal Variability (PDV; Maldonado et al., 2016).
 Figure Atlas.22 | Regional changes over land in annual mean surface air temperature and precipitation relative to the 1995–2014 baseline for the reference regions in Central America, the Caribbean and South America (warming since the 1850–1900 pre-industrial baseline is also provided as an offset). Barplots in the left panel of each region triplet show the median (dots) and 10th–90th percentile range (bars) across each model ensemble for annual mean temperature changes for four datasets (CMIP5 in intermediate colours; a subset of CMIP5 used to drive CORDEX in light colours; CORDEX overlying the CMIP5 subset with dashed bars; and CMIP6 in solid colours); the first six groups of bars represent the regional warming over two time periods (near-term 2021–2040 and long-term 2081–2100) for three scenarios (SSP1-2.6/RCP2.6, SSP2-4.5/RCP4.5 and SSP5-8.5/RCP8.5), and the remaining bars correspond to four global warming levels (GWL: 1.5°C, 2°C, 3°C and 4°C). The scatter diagrams of temperature against precipitation changes display the median (dots) and 10th–90th percentile ranges for the above four warming levels for December–January–February (DJF; middle panel) and June–July–August (JJA; right panel), respectively; for the CMIP5 subset only the percentile range of temperature is shown, and only for 3°C and 4°C GWLs. Changes are absolute for temperature (in °C) and relative (as %) for precipitation. See Atlas.1.3 for more details on reference regions (Iturbide et al., 2020) and Atlas.1.4 for details on model data selection and processing. The script used to generate this figure is available online (Iturbide et al., 2021) and similar results can be generated in the Interactive Atlas for flexibly defined seasonal periods. Further details on data sources and processing are available in the chapter data table (Table Atlas.SM.15).
 One of the most prominent features of the regional climate is the incidence of tropical cyclones (TCs), which represent an important hazard for almost all the countries of the region between June and November. A detailed assessment is given in Chapter 11.
Atlas.7.1.1.2 Findings From Previous IPCC Assessments
According to AR5 (Christensen et al., 2013), significant positive trends of temperature have been observed in Central America (high confidence), while significant precipitation trends are regionally dependent, especially during the summer. In addition, changes in climate variability and in extreme events have severely affected the region (medium confidence). A decrease in mean precipitation is projected in SCA and NCA. El Niño and La Niña teleconnections are projected to move eastwards in the future (medium confidence), while changes in their effects on other regions, including Central America and the Caribbean is uncertain (medium confidence). There is medium confidence in projections showing an increase in seasonal mean precipitation on the equatorial flank of the ITCZ affecting parts of Central America and the Caribbean.
In relation to the 1986–2005 baseline period, temperatures are very likely to increase by the end of the century, even for the RCP2.6 scenario, with changes of more than 5°C in some regions for the RCP8.5 scenario. Precipitation change is projected to vary between +10% and –25% (medium confidence) (Christensen et al., 2013). The SR1.5 (Hoegh-Guldberg et al., 2018) states there is a high agreement and robust evidence that at the 1.5°C global warming level the Caribbean region will experience a 0.5°C–1.5°C warming compared to the 1971–2000 baseline period, with greatest warming over larger land masses.
Atlas.7.1.2 Assessment and Synthesis of Observations, Trends and Attribution
Significant warming trends between 0.2°C and 0.3°C per decade have been observed in the three reference regions of Central America in the last 30 years (Planos Gutiérrez et al., 2012; P.D. Jones et al., 2016 a; Hidalgo et al., 2017), with the largest increases in the North American Monsoon region (high confidence) (Figure Atlas.11 and the Interactive Atlas; Cavazos et al., 2020). There is high confidence of increasing temperature over parts of NCA, reaching 0.5°C per decade in Mexico and southern Baja California, with a lower rate (0.2°C per decade) in the Yucatan Peninsula and the Guatemala Pacific coastal region (Cueto et al., 2010; García Cueto et al., 2013; Martínez-Austria et al., 2016; Martínez-Austria and Bandala, 2017; Navarro-Estupiñan et al., 2018; Cavazos et al., 2020) and CAR (McLean et al., 2015) over the last 30 to 40 years. Cooling trends have been detected in limited areas of Honduras and northern Panama (Hidalgo et al., 2017).
Changes in mean precipitation rates are less consistent and long-term trends are generally weak. Different databases show significant differences depending mainly on the type and resolution of data (Centella-Artola et al., 2020). Small positive trends were observed in the total annual precipitation (Stephenson et al., 2014). In SCA and CAR, trends in annual precipitation are generally non-significant, with the exception of small significant positive trends for sub-regions or limited periods (Planos Gutiérrez et al., 2012; Hidalgo et al., 2017), and the 1970–1999 trends in precipitation in SCA are generally non-significant (J.M. Jones et al., 2016; Hidalgo et al., 2017). Positive trends in the duration of the MSD have been found in this region over the past four decades (low confidence) (Anderson et al., 2019). For CAR see also Atlas.10 Small Islands.
Atlas.7.1.3 Assessment of Model Performance
The ability of climate models to simulate the climate in this region has improved in many key aspects (Karmalkar et al., 2013; Fuentes-Franco et al., 2014, Fuentes-Franco et al., 2015, Fuentes-Franco et al., 2017; Vichot-Llano et al., 2014; Vichot-Llano and Martínez-Castro, 2017; Martínez-Castro et al., 2018). Particularly relevant for this region are increased model resolution and a better representation of the land surface processes (high confidence).
Regional climate models (RCMs) forced with reanalyses and atmosphere-only global climate models provide simulations with a reasonably good performance over the core North American Monsoon region, mostly in NCA (high confidence) (Bukovsky et al., 2013; Cerezo-Mota et al., 2016). RCMs also reproduce the seasonal spatial patterns of temperature and the bimodal rainfall characteristics of the NCA, SCA and CAR (high confidence) (Karmalkar et al., 2013; Centella-Artola et al., 2015; Martínez-Castro et al., 2018; Cavazos et al., 2020; Vichot-Llano et al., 2021b), though in some sub-regions specific models overestimate and shift the month of the maxima. RCM simulations in the region do not necessarily improve with the size of the domain, as important features of the regional circulation and key rainfall climate features, such as the CLLJ and MSD, are well represented for a variety of domains of different sizes (high confidence) (Centella-Artola et al., 2015; Martínez-Castro et al., 2018; Cabos et al., 2019; Cavazos et al., 2020; Vichot-Llano et al., 2021b).
Atlas.7.1.4 Assessment and Synthesis of Projections
Figure Atlas.22 and the Interactive Atlas synthesize regional mean changes in annual mean surface air temperature and precipitation for the Central American reference regions for CMIP6, CMIP5 and CORDEX for different warming levels and time periods. At the 1.5°C GWL, it is very likely that average annual temperature in Central America over land surpasses 1.3°C (CAR), 1.7°C (NCA) and 1.6°C (SCA). For the 3°C GWL, the corresponding projected ensemble mean regional warming values are 2.7°C (CAR), 3.5°C (NCA) and 3.1°C (SCA). CAR average annual warming is below the level of global warming, while the two continental reference regions are close to the global warming level with CMIP6 and CMIP5 showing very consistent results (Figure Atlas.22). However, when focusing on time slices instead of warming levels, the CMIP6 projections show systematically higher median values than CMIP5. CORDEX results are also consistent with the previous findings, though the subset of driving models spans a smaller range of uncertainty, particularly over CAR. Results have also been reported for this region based on CMIP5, CMIP6 and downscaled simulations over the CORDEX CAM domain or similar smaller domains (Taylor et al., 2013b; Nakaegawa et al., 2014; Imbach et al., 2018; Vichot-Llano et al., 2019; Almazroui et al., 2021). Statistical downscaling methods have been also applied to CMIP5 projections to obtain bias-adjusted regional projections (Colorado-Ruiz et al., 2018; Taylor et al., 2018; Vichot-Llano et al., 2019).
Global and regional models consistently project warming in the whole region for the end of the century, under RCP4.5 and RCP8.5 for CMIP5 projections with greater warming for continental compared to insular territories, likely reaching values between 2°C and 4°C (high confidence) (Campbell et al., 2011; Karmalkar et al., 2011; Cavazos and Arriaga-Ramírez, 2012; Cantet et al., 2014; Chou et al., 2014; Coppola et al., 2014; Hidalgo et al., 2017; Colorado-Ruiz et al., 2018; Imbach et al., 2018). The greatest warming of 5.8°C for the end of the century was projected for northern Mexico under RCP8.5 (Colorado-Ruiz et al., 2018), using an ensemble of CMIP5 GCMs (Interactive Atlas).
Regarding precipitation, it is likely that the annual average precipitation changes for the 1.5°C GWL will be in the ranges of –11 to 0% in CAR, from –12 to 0% in SCA, and from –10 to +3% in NCA (Interactive Atlas). For the 3°C GWL, the corresponding annual average precipitation changes will be from –17 to –2% in CAR, from –16 to +2% in NCA, and from –23 to 0% in SCA. A clear drying tendency is observed for the 3°C GWL relative to the 1.5°C GWL. Maloney et al. (2014) examined 21st-century climate projections of North American climate in CMIP5 models under RCP8.5, including Central America and the Caribbean. Summer drying was projected in CAR and SCA for most of the models, with good agreement. The strongest drying is projected to occur during July and August which are the months when the MSD occurs in many sub-regions (Figure Atlas.22 and the Interactive Atlas). Intensification of the MSD in SCA was also projected by using the Rossby Centre Regional Climate Model (RCA4; Corrales-Suastegui et al., 2020), but with a future decrease in area and frequency (Cross-Chapter Box Atlas.2). They also found a projected intensification of CLLJ and drying for the future time slice of 2071–2095, relative to their baseline of 1981–2005. Decreased precipitation was also projected for SCA (Imbach et al., 2018) with the 8-km resolution Eta RCM during the rainy season, including an intensification of the MSD, although no significant change was projected for the CLLJ.
Colorado-Ruiz et al. (2018) assessed an ensemble of 14 GCMs from CMIP5 for a 1971–2000 baseline period, projecting precipitation decreases of between 5% and 10% by the end of the century for the RCP4.5 and RCP8.5 scenarios respectively. The greatest decrease in precipitation is projected during summer reaching 13%, especially in southern Mexico, Central America and the Caribbean. Dynamically downscaled simulations (Bukovsky et al., 2015) also projected a decrease of precipitation for the middle of the century (2041–2069) relative to 1971–1999 for the north of Mexico, though despite good agreement amongst the models, these results must be considered of low confidence, because of their poor simulation of important monsoon physical processes. Vichot-Llano et al. (2021a) used a multi-parameter ensemble of RegCM4, driven by the CMIP5 global model HagGEM2-ES projections to conclude that, relative to the 1975–2004 baseline, in the near (2020–2049) and more prominently in the far (2070–2099) future, drier conditions will prevail at over the eastern Caribbean. The projected future warming trend was statistically significant at the 95% confidence level over CAR and SCA. Almazroui et al. (2021) used an ensemble of 31 CMIP6 models to estimate climate change signals of temperature and precipitation in six reference regions in North and Central America and the Caribbean, finding a decrease in precipitation (10–30%) over Central America and the Caribbean under three scenarios with regional and seasonal variations.
There is high agreement and high confidence in the projected decrease of precipitation by the end of the century for most of the region, particularly for annual and summer precipitation, but there is low confidence on the magnitude of this decrease which varies between 5% and 50% for different projections and different sub-regions (see extended information in the Interactive Atlas).
The status of climateextreme trends and projections for the region has been assessed in Chapter 11 and the main findings are synthesized here. There is high confidence in the projections of significant heatwave events at the end of the century in SCA (Angeles-Malaspina et al., 2018) and an increase in warm days and warm nights over this region and CAR (Stennett-Brown et al., 2017). For CAR islands, using dynamically downscaled CMIP3 models, Karmalkar et al. (2013) projected an increase in drought severity at the end of the century, mainly due to a precipitation decrease during the early wet season. In SCA, projections suggest an increase in the MSD (Imbach et al., 2018) and an increase in consecutive dry days (Chou et al., 2014), consistent with the projections of Stennett-Brown et al. (2017).
Atlas.7.1.5 Summary
Significant warming trends between 0.2°C and 0.3°C per decade have been observed in the three reference regions of Central America in the last 30 years, with the largest increases in the North American Monsoon region (high confidence). Changes in mean precipitation rates are less consistent and long-term trends are generally weak. Small positive trends were observed in the total annual precipitation in part of the region.
Warming in the continental part of the region is projected to increase in the range of the mean global values for GWL of 1.5°C and 3°C, but in the Caribbean regional warming will be lower. Precipitation is projected to decrease with increasing GWLs, especially for CAR and SCA.
Projected change in mean annual precipitation shows a large spatial variability across Central America and the Caribbean. Under moderate future emissions overall negative but non-significant precipitation trends are projected for the 21st century (low confidence). Under higher-emissions scenarios and at higher GWLs, average precipitation is likely to decrease in most of the region, particularly in the north-western and central Caribbean and part of continental Central America, especially in SCA.
Atlas.7.2 South America
Atlas.7.2.1 Key Features of the Regional Climate and Findings From Previous IPCC Assessments
Atlas.7.2.1.1 Key Features of the Regional Climate
Regional synthesis of observed and modelled climate in South America is challenging due to the latitudinal extent of the continent, the Andes Mountains, and local-to-regional climatic features, which are influenced by multiple drivers. The main large-scale drivers include many modes of natural variability (Annex IV.2): the inter-decadal modes, Atlantic Multi-decadal Variability (AMV) and Pacific Decadal Variability (PDV); the interannual-to-annual modes, El Niño–Southern Oscillation (ENSO), the Indian Ocean Dipole (IOD), the Southern Annular Mode (SAM) and the North Atlantic Oscillation (NAO); seasonal variability driven by the meridional migration of the Inter-tropical Convergence Zone (ITCZ) and the timing and intensity of the South American Monsoon System (SAmerM, Section 8.3.2.4.5), the Madden–Julian Oscillation sub-seasonal mode of natural variability (MJO) and the behaviour at finer scales of the tropical easterly waves.
The regional assessment in this section emphasizes the seven new South American reference regions (Figure Atlas.22; Iturbide et al., 2020) that have a largely consistent climate and response to climate change, and can be used for analysis and impact studies (Solman et al., 2008; Neukom et al., 2010; Barros et al., 2015; Nobre et al., 2016). At the sub-regional scale, several phenomena drive climate variability. Brazil’s north-east (North-Eastern South America; NES) is the most densely populated dryland globally and recurrently affected by climatic extremes. The climate variability, particularly the precipitation, is marked by strong interannual variability related to ENSO, the ITCZ, and the North Tropical Atlantic Ocean SSTs (Marengo et al., 2018a). Northern (NSA) and North-Western South America (NWS) are part of the Amazonia region. Its most recognizable features are the high rainfall, high humidity and high temperatures that prevail in the region. Rainfall variability in these regions results from the interplay between regional atmospheric circulation, the SST variations in both the Pacific and Atlantic oceans, among other regional-to-local interactions (Marengo and Espinoza, 2016; Espinoza et al., 2020). The South American Monsoon (SAM) region has distinct wet (summer) and dry (winter) periods. Key drivers include the South Atlantic Convergence Zone (Marengo et al., 2012), the Bolivian High, the 40- to 60-day intra-seasonal oscillation, and the forcing of the high Andes Mountains to the west (Almeida et al., 2017). The geographic position of South-Western South America (SWS) results in very specific climatic characteristics since SWS contains subtropical climates as well as sub-Antarctic and Antarctic climates. The climate of SWS is driven by seasonal changes in the position of subtropical high-pressure air masses in the South Atlantic and South Pacific oceans, the Southern Annular Mode, the dynamics of the cold Humboldt ocean current, and icy cold fronts and mid-latitude westerlies (Valdés-Pineda et al., 2016). The densely populated, highly productive sub-region of South-Eastern South America (SES) has cool winters and hot summers typical of the temperate zone, and climatic conditions are strongly tied to ENSO, whose influence is moderated by local air-sea thermodynamics in the South Atlantic (Barreiro, 2010). Lastly, the climate of the southern tip of South America (SSA) is cold and dry, and is influenced by the Southern Annular Mode, and the interaction between the wetter Pacific winds and the Andean Cordillera (Aceituno, 1988; Silvestri and Vera, 2009).
Atlas.7.2.1.2 Findings From Previous IPCC Assessments
According to AR5 WGII Chapter 27 (Magrin et al., 2014), during the last decades of the 20th century, observational studies identified significant trends in precipitation and temperature in South America (high confidence). Increasing trends in annual rainfall in South-Eastern South America contrast with decreasing trends in central southern Chile and some regions of Brazil. Warming has been detected throughout South America (near 0.7°C–1°C in the 40 years since the mid-1970s), except for a cooling off the Chilean coast of about –1°C over the same period.
The AR5 WGI (Flato et al., 2013) noted that climate simulations from CMIP3 and CMIP5 models were able to represent well the main climatological features, such as seasonal mean and annual cycle (high confidence), although some biases remained over the Andes, the Amazonian basin and for the South America Monsoon. On the other hand, climate models from CMIP5 showed better results when compared to CMIP3.
The SR1.5 (Hoegh-Guldberg et al., 2018) assessed that a further increase of 0.5°C or 1°C is likely to have detectable effects on mean temperature and precipitation in South America, particularly in tropical regions (NWS, NAS, SAM and NES), as well as in SES, given that changes in mean temperatures and precipitation have already been attributed in the last decades for global warming of less than 1°C.
Atlas.7.2.2 Assessment andSynthesis of Observations, Trends and Attribution
Studies on climatic trends in South America indicate that mean temperature and extremely warm maximum and minimum temperatures have shown an increasing trend (high confidence), particularly for a large region in Northern South America and the south-western Andes (NSA, SAM, NES, SWS and the north of SES; Skansi et al., 2013; de Barros Soares et al., 2017). Also, the trend of the difference between the annual mean of the daily maximum temperature and the annual mean of the daily minimum temperature was positive – up to 1°C per decade – over the extratropics with the maximum temperature generally increasing faster than the minimum temperature, while a negative trend of up to –0.5°C per decade was observed over the tropics.
Regionally, analyses of temperatures point to an increased warming trend (high confidence) over Amazonia over the last 40 years, which reached approximately 0.6°C–0.7°C (Figure Atlas.11 and the Interactive Atlas) and with stronger warming during the dry season and over the south-east. The analyses also showed that 2016 was the warmest year since at least 1950 (Marengo et al., 2018b). Andean temperatures showed significant warming trends, especially at inland and higher-elevation sites, while trends are non-significant or negative at coastal sites (high confidence) (Vuille et al., 2015; Burger et al., 2018; Vicente-Serrano et al., 2018; Pabón-Caicedo et al., 2020). Over central Chile, positive trends are largely restricted to austral spring, summer and autumn seasons for mean, maximum and minimum temperatures (Burger et al., 2018; Vicente-Serrano et al., 2018). Over Peru, trends of maximum air temperature were mainly amplified during the austral summer, but trends of cold-season minimum air temperature showed an opposite pattern, with the strongest warming being recorded in the austral winter (Vicente-Serrano et al., 2018).
In general, the spatial patterns of observed trends in temperature are more consistent than for precipitation across the whole of South America (medium confidence) (Interactive Atlas; de Barros Soares et al., 2017). In south-east Brazil there is a region of highly significant decrease of rainfall in both wet and dry seasons recorded in the period 1979–2011 (Interactive Atlas; Rao et al., 2016). The most consistent evidence of positive rainfall trend occurs in the southern part of the La Plata basin (high confidence) (southern Brazil, Uruguay, and north-eastern Argentina; de Barros Soares et al., 2017). By contrast, there is high confidence that annual rainfall has decreased over north-east Brazil during the last decades (Carvalho et al., 2020). Contrary to temperature changes, trends in annual precipitation exhibit different signs across sectors in the Andes. For instance, annual precipitation trends in the north tropical (north of 8°S) and south tropical (8°S–27°S) Andes do not show a homogeneous pattern. Over the subtropical Andes, central Chile shows a robust signal of declining precipitation since 1970 (high confidence) (Pabón-Caicedo et al., 2020).
Observational studies show that the dry-season length over southern Amazonia has increased significantly since 1979 (high confidence) (Fu et al., 2013; Alves, 2016). In the Peruvian Amazon-Andes basin, there is no trend in mean rainfall during the period 1965–2007 (Lavado Casimiro et al., 2012) though statistically significant decreases in total annual rainfall in the central and southern Peruvian Andes from 1966 to 2010 were found (Heidinger et al., 2018). Despite that, recent analyses of Amazon hydrological and precipitation data suggest an intensification of the hydrological cycle over the past few decades (Gloor et al., 2015). In general, these changes are attributed mainly to decadal climate fluctuations (high confidence), ENSO, the Atlantic SST north–south gradient, feedbacks between fire and land-use change mainly across southern south-eastern Amazon, and changes in the frequency of organized deep convection (Fernandes et al., 2015; Sánchez et al., 2015; Tan et al., 2015).
Since AR5, there has been limited attribution literature in the South America. Recent publications based on observational and modelling evidence assessed that anthropogenic forcing in CMIP5 models explains the overall warming (high confidence) over the entire South American continent, including the increase in the frequency of extreme temperature events (Hannart et al., 2015). It has a detectable influence in explaining positive and negative precipitation trends observed in regions such as SES and the southern Andes (Vera and Díaz, 2015; de Barros Soares et al., 2017; Boisier et al., 2018; de Abreu et al., 2019). Despite that, there is limited evidence that human-induced greenhouse gas emissions had an influence on the 2014/2015 water shortage in south-east Brazil (Otto et al., 2015). Extreme event attribution on sub-continental scales is assessed in Chapter 11 and continental-scale attribution in Chapter 3.
In summary, analyses of historical temperature time series point strongly to an increased warming trend (high confidence) across many South American regions, except for a cooling off the Chilean coast. Annual rainfall has increased over South-Eastern South America and decreased in most tropical land regions, particularly in central Chile (high confidence). The number and strength of extreme events, such as extreme temperatures, droughts and floods, have already increased (medium confidence) (Table 11.7).
It is noted that the major barrier to the study of climate change in many regions of South America is still the absence or insufficiency of long time series of observational data (Carvalho, 2020; Condom et al., 2020). Most national datasets were created in the 1970s and 1980s, preventing a more comprehensive long-term trend analysis. To fulfil the users’ demand for climatological and meteorological data products covering the whole region, several interpolation techniques have been used with reanalysis and gridded gauge-analysis products to add the necessary spatial detail to the climate analyses over land and for climate variability and trend studies, but these are subject to uncertainties (Skansi et al., 2013; Rozante et al., 2020).
Atlas.7.2.3 Assessment of Model Performance
Since AR5 the number of publications on climate model performance and their projections in South America has increased, particularly for regional climate modelling studies (Giorgi et al., 2009; Boulanger et al., 2016; Ambrizzi et al., 2019) and the understanding of their strengths and weaknesses (high confidence).
Most global and regional climate models can simulate reasonably well the current climatological features of South America, such as seasonal mean and annual cycles. However, significant biases persist mainly at regional scales (high confidence) (Blázquez and Nuñez, 2013b; Gulizia et al., 2013; Joetzjer et al., 2013; Jones and Carvalho, 2013; Torres and Marengo, 2013; Gulizia and Camilloni, 2015; Zazulie et al., 2017; Abadi et al., 2018; Barros and Doyle, 2018; Solman and Blázquez, 2019; Fan et al., 2020; Rivera and Arnould, 2020; Teichmann et al., 2021). During the dry season, precipitation is underestimated in most models over Amazonia (medium evidence, high agreement) (Torres and Marengo, 2013; Yin et al., 2013; Solman and Blázquez, 2019). Over regions with complex orography, such as the tropical Andes of NWS, CMIP5 models tend to underestimate precipitation which is associated with the misrepresentation of the Pacific ITCZ and local low-level jets (Sierra et al., 2015, 2018), whereas over the subtropical central Andes in SWS, the models are found to overestimate both mean temperature and precipitation values (limited evidence, high agreement) (Zazulie et al., 2017; Rivera and Arnould, 2020; Díaz et al., 2021). Most models show a dry bias over SES (Díaz and Vera, 2017; Barros and Doyle, 2018; Solman and Blázquez, 2019; Díaz et al., 2021) associated with an underestimation of the northern flow that brings water vapour into the region (medium confidence) (Gulizia et al., 2013; Zazulie et al., 2017; Barros and Doyle, 2018). The biases in seasonal precipitation, annual precipitation and climate extremes over several regions of South America were reduced, including the Amazon, central South America, Bolivia, eastern Argentina and Uruguay, in the CMIP5 models when compared to those of CMIP3 (medium confidence) (Joetzjer et al., 2013; Gulizia and Camilloni, 2015; Díaz and Vera, 2017). The evidence is still insufficient to determine whether CMIP6 biases are reduced when compared with CMIP5 simulations regarding precipitation and its variability in South America. The temperature and precipitation patterns of anomalies associated with ENSO in tropical South America (NWS, NSA and NES) are better captured by GCMs in tropical South America (NWS, NSA and NES) than in extratropical South America (SES), particularly during austral summer and autumn (limited evidence, high agreement) (Tedeschi and Collins, 2016; Perry et al., 2020).
Based on regional simulations, studies showed that some RCMs improve the quality of the simulated climate when compared with the driving GCM (medium evidence, high agreement) (Llopart et al., 2014; Sánchez et al., 2015; Falco et al., 2019; Solman and Blázquez, 2019; Ciarlo` et al., 2021; Teichmann et al., 2021). Regional climate model (RCM) simulations over South America can reproduce the main features of temperature and precipitation in terms of both spatial distributions (Solman et al., 2013; Falco et al., 2019) and seasonal cycles over the different climate regimes, including the main SAmerM features (high confidence) (Jacob et al., 2012; Solman, 2013; Llopart et al., 2014; Reboita et al., 2014; de Jesus et al., 2016; Lyra et al., 2018; Bozkurt et al., 2019; Ashfaq et al., 2021). However, RCMs showed systematic biases such as precipitation overestimations and temperature underestimations along the Andes throughout the year (high confidence), although these biases may be artificially amplified by the lack of a dense observational station network (Jacob et al., 2012; Solman et al., 2013; Bozkurt et al., 2019; Falco et al., 2019). RCMs tended to show dry biases over the Amazon and the northern part of the continent (SAM, NSA) during DJF and during the maximum precipitation associated with the ITCZ over NSA during JJA (medium evidence, high agreement) (Solman et al., 2013; Falco et al., 2019). Temperature overestimation and precipitation underestimation over La Plata basin (in SES) are also RCM common biases, with the warm bias amplified for austral summer and the dry bias amplified for the rainy season (high confidence) (Solman et al., 2013; Reboita et al., 2014; Solman, 2016; Falco et al., 2019). Despite their relevance, RCM simulations at very high resolution (less than 10 km) are still few in South America (high confidence) and are mainly designed for specific regions or purposes (Lyra et al., 2018; Bozkurt et al., 2019; Bettolli et al., 2021).
The evaluation of statistical downscaling models (ESD) in representing regional climate features in South America has increased since AR5, however there are still few ESD studies over the different sub-regions. Precipitation simulations based on ESD models are able to reproduce mean precipitation over tropical and subtropical South American regions, especially over maximum precipitation areas in western Colombia, south-eastern Peru, central Bolivia, Chile and the La Plata basin (medium confidence) (Souvignet et al., 2010; Mendes et al., 2014; Palomino-Lemus et al., 2015, 2017, 2018; Soares dos Santos et al., 2016; Troin et al., 2016; Borges et al., 2017; Bettolli and Penalba, 2018; Araya-Osses et al., 2020; Bettolli et al., 2021). Temperature simulations are fewer but show added value to GCM simulations (medium evidence, high agreement) (Souvignet et al., 2010; Borges et al., 2017; Bettolli and Penalba, 2018; Araya-Osses et al., 2020).
Overall, climate modelling has made some progress in the past decade but there is no model that performs well in simulating all aspects of the present climate over South America (high confidence). The performance of the models varies according to the region, time scale and variables analysed (Abadi et al., 2018). There is also a fairly narrow spread in the representation of temperature and precipitation over South America by the CMIP5 GCMs and also the RCMs, with biases that can be associated with the parametrizations and schemes of surface, boundary layer, microphysics and radiation used by the models. Finally, observational reference datasets, such as reanalysis products, used in the calibration and validation of climate models can also be quite uncertain and may explain part of the apparent biases present in climate models (high confidence).
Atlas.7.2.4 Assessment and Synthesis of Projections
It is very likely that annual mean temperature will increase over South America, with a wide range of projected changes of 1.0°C–6.0°C by the end of the 21st century (from RCP2.6/SSP1-2.6 to RCP8.5/SSP5-8.5 emissions, Figure Atlas.22). Overall, GCMs project higher temperature change than RCMs in austral summer and winter over all sub-regions and in winter mainly over the central part of the continent (Interactive Atlas; Coppola et al., 2014; Llopart et al., 2021; Teichmann et al., 2021). The largest warmings over the South American continent are projected for the Amazon basin (SAM and NSA) and the central Andes range (southern SAM, northern SWS and south-eastern NWS; Figure Atlas.22), especially during the dry and dry-to-wet transition seasons (austral winter and spring) (high confidence) (Blázquez and Nuñez, 2013a; Coppola et al., 2014; Pabón-Caicedo et al., 2020; Teichmann et al., 2021).
Using warming levels (Figure Atlas.22), the temperature is projected to increase at or above the level of global warming in all regions apart from SSA with additional warming (compared to a 1995–2014 baseline) of over 4°C for the 4°C warming level in NSA and SAM. Changes for other warming levels, sub-regions and emissions pathways are shown in Figure Atlas.22 and can be explored with the Interactive Atlas.
In general, models show a wide regional range in the direction and the magnitude of mean precipitation change in many South American regions, with large significant increases and decreases (Figure Atlas.22 and the Interactive Atlas). In the medium and long term, under the high-emissions scenario, the CMIP5 multi-model ensemble projected an increase in precipitation (generally greater than 10%) in SES and NWS, and a decrease (less than 10%) in NSA across seasons (high confidence, robust evidence) (Solman, 2013; Chou et al., 2014; Coppola et al., 2014; Llopart et al., 2014, 2021; Reboita et al., 2014, 2021; Sánchez et al., 2015; Menéndez et al., 2016; Ruscica et al., 2016; Bozkurt et al., 2018a; Zaninelli et al., 2019). Also, in parts of SWS, annual precipitation is projected to decrease (up to 30%) by the late 21st century (Souvignet et al., 2010; Palomino-Lemus et al., 2017, 2018; Bozkurt et al., 2018a). Under high RCPs, the CMIP5 ensemble projects that all Brazilian regions will experience more rainfall variability in the future, so drier dry periods and wetter wet periods on daily, weekly, monthly and seasonal time scales, despite the future changes in mean rainfall being currently uncertain (medium confidence) (Alves et al., 2021). Regarding the SAmerM, it is very likely that the monsoon will experience changes in its life cycle by the end of the 21st century for both RCP4.5 and RCP8.5 emissions and, in particular, delayed onset. However there is low agreement on the projected changes in terms of extreme and total precipitation of the monsoon season in South America (Llopart et al., 2014; Ashfaq et al., 2021). Changes in the SAmerM are assessed in Section 8.3.2.4.5.
Projected changes in seasonal precipitation and their uncertainties generally agree with the annual changes, particularly for the decreases in SWS (Figure Atlas.22). DJF precipitation changes in NSA and SAM are largely uncertain, with weak agreements in the projections, particularly for CMIP5 and CMIP6 ensembles, which project almost no change, and decreasing precipitation for NSA and a narrow range from slight increases to no change respectively for SAM.
Atlas.7.2.5 Summary
In summary, it is virtually certain that the climate of South America has warmed. Studies on climate trends in South America indicate that mean temperature and maximum and minimum temperatures have increased over the last 40 years. Long-term observed precipitation trends show an increase over South-Eastern South America and decreases in most tropical land regions (high confidence).
Evaluation of global and regional climate model simulations have increased over South America in the past decade and shown improved performance. However, the results reveal that no model performs well in simulating all aspects of the present climate (very likely) . On the other hand, there is still a lack of high-quality and high-resolution observational data that may explain part of the important biases present in climate models (high confidence).
Climate model projections show a general increase in annual mean surface temperature over the coming century for all emissions scenarios (RCPs and SSPs) (high confidence), consistent with the observed warming, and with all regions except SSA warming faster than the global average. Unlike temperature, annual precipitation has patterns of decrease in North-Eastern South America (NES) and South-Western South America (SWS), and increase in Southern South America (SES) and North-Western South America (NWS) (high confidence), with small changes projected under a low-emissions scenario. However, there is low confidence in the magnitude because of the large spread among models, both GCMs and RCMs.
Atlas.8 Europe
The assessment in this section focuses on changes in average temperature and precipitation (rainfall and snow), including the most recent years of observations, updates to observed datasets, the consideration of recent studies using CMIP5 and those using CMIP6 and CORDEX simulations. Assessment of changes in extremes is in Chapter 11 (Tables 11.16–11.18) and climatic impact-drivers in Chapter 12 (Table 12.7).
Atlas.8.1 Key Features of the Regional Climate and Findings From Previous IPCC Assessments
Atlas.8.1.1 Key Features of the Regional Climate
Westerly winds and the accompanying Atlantic storm track with cyclones and anticyclones travelling from the Atlantic towards inland Europe are the main climatic features that characterize daily to interannual variability in the European region. The Siberian High in winter determines cold weather in Eastern Europe and can affect other regions with cold outbreaks. Intra-seasonal and interannual variations are driven by modes of climate variability such as the North Atlantic Oscillation (NAO; Table Atlas.1 and Annex IV.2). Global warming can lead to systematic changes in regional climate variability via thermodynamic responses such as altered lapse rates (Kröner et al., 2017; Brogli et al., 2019) and land-atmosphere feedbacks (Zampieri and Lionello, 2011; Boé and Terray, 2014). Regional feedbacks involving the land-sea contrast, sea surface, land surface, clouds, aerosols, radiation and other processes modulate the regional response to enhanced warming.
Four climatic regions are defined for Europe (Figure Atlas.24). The Mediterranean region (MED) in the south is characterized by mild winters and hot and dry summers (Mediterranean climate; Section 10.6.4.2). It covers both Europe and Africa, and MED assessments in this section generally imply the entire MED domain unless stated otherwise. The Western and Central Europe region (WCE) has distinct summer and winter seasons with increasing continentality of climate eastwards. The Northern Europe region (NEU), close to the Atlantic Ocean, is characterized by high humidity and relatively mild winters, and strong exposure to the Atlantic storm track. Eastern Europe (EEU) covers the western part of Russia and neighbouring territories and has continental characteristics. Many regional datasets and model projections assessed here do not sufficiently cover the EEU region.
Atlas.8.1.2 Findings From Previous IPCC Assessments
The AR5 WGII (Kovats et al., 2014) reports with high confidence that observed climate trends show regionally varying changes in temperature and rainfall in Europe. The average temperature in Europe has continued to increase, with seasonally different rates of warming being greatest in high latitudes in Northern Europe. Annual precipitation has increased in Northern Europe and decreased in parts of Southern Europe. The SROCC (Hock et al., 2019b) reports with high confidence that a reduction in snow cover at low elevation and glacier extent is observed in recent decades, with consequent changes in annual and seasonal runoff patterns. According to the SRCCL report (IPCC, 2019b) there is high agreement that observed vegetation greening and forestation in the last 30 years cools summer surface temperature and warms winter temperature due to decreased snow cover and increased snow shading in forested areas. It is very likely that aerosol column amounts have declined over Europe since the mid-1980s.
The AR5 (Collins et al., 2013) reports that the ability of models to simulate the climate in Europe has improved in many important aspects. Particularly relevant for this region are increased model resolution and a better representation of the land surface processes in many of the models that participated in CMIP5. The spread in climate model projections is still substantial, partly due to pronounced internal variability in this region (particularly NAO and AMO). In the winter half year, NEU and WCE are likely to have increased mean precipitation associated with increased atmospheric moisture and moisture convergence, and intensification in extratropical cyclone activity. No change or a moderate reduction is projected for MED. In the summer half year, it is likely that NEU and WCE mean precipitation will have only small changes with a notable reduction in MED. According to SR1.5 (Hoegh-Guldberg et al., 2018), these precipitation changes are more pronounced at 2°C than at 1.5°C of global warming. For a 2°C global warming level, an increase in runoff is projected for north-eastern Europe while decreases are projected in the Mediterranean region, where runoff differences between 1.5°C and 2°C global warming will be most prominent (medium confidence). According to SROCC (Hock et al., 2019b) the RCP8.5 projections lead to a loss of more than 80% of the ice mass from small glaciers by the end of century in Central Europe (high confidence). Snow cover and glaciers are projected to decrease throughout the 21st century.
Atlas.8.2 Assessment and Synthesis ofObservations, Trends and Attribution
To support climatological analyses and model evaluation, national meteorological and hydrological services are increasingly making available high spatial and temporal resolution gridded and in situ homogenized and quality-checked datasets (Déqué and Somot, 2008; Vidal et al., 2010; Rauthe et al., 2013; Noël et al., 2015; Spinoni et al., 2015b; Ruti et al., 2016; Fantini et al., 2018; Lussana et al., 2018; Herrera et al., 2019; Skrynyk et al., 2020). The inclusion of additional station data and data rescue activities lead to a better representation of extreme precipitation statistics than the global- or continental-scale datasets (Atlas.1.4.1). Recent gridded products merging radar and station data allow higher spatial and temporal resolutions to be reached (Haiden et al., 2011; Tabary et al., 2012; Berg et al., 2016; Fumière et al., 2020). A number of regional reanalysis products has become available for the European region (Bollmeyer et al., 2015; Bach et al., 2016; Dahlgren et al., 2016; Landelius et al., 2016). A European ensemble of regional reanalyses from 1961 to 2019 is shown to add accuracy and reliability in comparison to global reanalysis products, but also introduces additional uncertainties, especially for threshold-based climate indices (Kaiser-Weiss et al., 2019). However, gridded European datasets are unreliable over data-sparse regions. Also, many datasets employ different approaches to interpolation and gridding, which adds to their uncertainty and complicates comparative evaluations (Fantini et al., 2018; Kotlarski et al., 2019; Berthou et al., 2020). For some sub-regions and performance metrics, differences between datasets have been shown to be of the same magnitude as errors in regional climate models (Prein et al., 2016; Prein and Gobiet, 2017; Fantini et al., 2018), but observational uncertainty is substantially reduced when datasets of similar nature and representativeness are used (Kotlarski et al., 2019).
In addition to the global display of observed temperature and precipitation trends in Figure Atlas.11, annual mean temperature and precipitation trends between 1980 and 2015 calculated from the gridded ensemble E-OBS dataset (Cornes et al., 2018) are shown in Figure Atlas.23, together with time series of temperature and precipitation anomalies relative to the 1980–2015 mean value from E-OBS, CRU, EWEMBI and Berkeley for temperature, and E-OBS, CRU, GPCC and GPCP for precipitation (see also Figure 2.11 for global mean values, and Atlas.1.4.1 for description of global datasets).
 Figure Atlas.23 | (a) Mean 1980–2015 trend ofannual mean surface air temperature (°C per decade) from E-OBS (Cornes et al., 2018). Data for non-European countries in the MED area are masked out. (b) Time series of mean annual temperature anomaly relative to the 1980–2015 period (shown with grey shading) aggregated for the land area in each of the four European sub-regions, from E-OBS, CRU, Berkeley and ERA5 (see Atlas.1.4.1 for description of global datasets). Mean trends for 1901–2015, 1961–2015 and 1980–2015 are shown for each dataset in corresponding colours in the same units as panel (a) (see legend in upper panel). (c) As panel (a) for annual mean precipitation (mm day–1per decade). (d) As panel (b) for annual mean precipitation, from datasets E-OBS, CRU, GPCC and GPCP. Note that E-OBS data are not shown in panels (b) and (d) for the region EEU. For the MED region data are aggregated over the European countries alone. Trends have been calculated using ordinary least squares regression and the crosses indicate non-significant trend values (at the 0.1 level) following the method of Santer et al. (2008) to account for serial correlation. Further details on data sources and processing are available in the chapter data table (Table Atlas.SM.15).
 In NEU continued warming has been observed, particularly during spring. An annual mean temperature increase of 0.4°C per decade was reported between 1970 and 2008 (Rutgersson et al., 2015). In WCE temperature increases since the mid-20th century have been documented for Poland (Degirmendžić et al., 2004) and Ukraine (Boychenko et al., 2016; Balabukh and Malitskaya, 2017). Land-only observations indicate a rapid increase in summer (JJA) mean surface air temperature since the mid-1990s (Dong et al., 2017). In Eastern Europe no significant trend in winter mean air temperatures was found between 1881 and 2016 in Belarus (Loginov et al., 2018). In parts of the European area of the MED, spring and summer temperatures are reported to increase faster than in the other seasons (see the Mediterranean case study in Section 10.6.4 and Figure 10.18; Brunetti et al., 2006; Homar et al., 2009; Lionello et al., 2012; Philandras et al., 2015; Gonzalez-Hidalgo et al., 2016; Vicente-Serrano et al., 2017). Figure Atlas.23 shows that since 1980 in each European region all datasets show a consistent warming of annual mean temperature of 0.04°C yr–1to 0.05°C yr–1. Trends in European land temperature cannot be explained without accounting for anthropogenic warming offset by anthropogenic aerosol emissions (Section 3.3.1.1 and Figure 3.9). It is virtually certain that annual mean temperature continues to increase in each European subdomain.
Multi-decadal trends in mean precipitation are generally small and non-significant. Apart from difficulties related to observational coverage (Prein and Gobiet, 2017), gauge undercatch (e.g., Murphy et al., 2020) and data inhomogeneity (e.g., Camuffo et al., 2013), strong interannual and multi-decadal variability is dominant over at least the last two centuries. However, significant precipitation trends have been recorded for recent periods, for example in south-western Europe between 1960 and 2000 (Peña-Angulo et al., 2020), and between 1961 and 2015 in NEU (Interactive Atlas). Also, some studies suggest that in the MED precipitation has declined and more frequent and severe meteorological droughts have occurred between 1960 and 2000 (Spinoni et al., 2015a; Gudmundsson and Seneviratne, 2016), and in some regions cannot be explained without anthropogenic forcing (Section 10.4.1.2; Knutson and Zeng, 2018). Other studies suggest that this trend can be seen as an expression of multi-decadal internal variability driven mainly by the North Atlantic Oscillation (Table Atlas.1; Kelley et al., 2012; Zittis, 2018). Global dimming and brightening also are reported to affect precipitation trends in the Mediterranean region (Section 8.3.1.6 and Figure 8.7).
The large-scale spatial patterns of the E-OBS annual mean precipitation trend between 1980 and 2015 shown in Figure Atlas.23 is broadly consistent with trends derived from CRU, GPCP and GPCC (Figure Atlas.11) but with more explicit spatial detail. Trends calculated for regional averages are sensitive to the selection of the time window: for 1980–2015 annual mean precipitation averaged over the regions shows a positive trend (not significant at p = 0.05), while for CRU and GPCC the trend calculated over 1901–2015 is positive for NEU, EEU and WCE, and non-significant for MED. Precipitation trends in the MED are significant only in selected areas (Lionello et al., 2012; MedECC, 2020). Also the NEU trends show large spatial variability and are subject to decadal variability related to NAO (Heikkilä and Sorteberg, 2012), but are generally positive over the 20th century (Figure Atlas.23). There is medium confidence that annual mean precipitation in NEU, WCE and EEU has increased since the early 20th century. In the European Mediterranean, observed land precipitation trends show pronounced variability within the region, with magnitude and sign of trend in the past century depending on time period and exact study region (medium confidence).
Trends in snowfall and snowmelt are related to seasonal changes in both temperature and precipitation. In EEU, melt onset dates have advanced by one to two weeks in the 1979–2012 period (Mioduszewski et al., 2015). Over Eurasia, trends in spring and early summer snow cover extent increased over the 1971–2014 period (Hernández-Henríquez et al., 2015). Between 1966 and 2012, averaged over entire Eurasia, monthly mean snow depth decreased in autumn and increased in winter and spring (Zhong et al., 2018), while the snow cover extent was reported to have decreased during the past 40 years (Bulygina et al., 2011). In NEU late winter and early spring snow depth and snow cover decreases since the early 1960s are reported over Finland (Luomaranta et al., 2019) and Norway (Rizzi et al., 2018) with a dependence on altitude (Skaugen et al., 2012), while winter snow depth increased in northern Sweden (Kohler et al., 2006). It is very likely that since the early 1980s in snow-dominant areas in NEU and EEU the length of the snowfall season is reduced with regional warming, and the melt onset dates have advanced.
The increasing trend in surface shortwave radiation, documented in AR5 (Hartmann et al., 2013) to have occurred since the 1980s and referred to as a brightening effect, is substantiated over Europe and the Mediterranean region (Nabat et al., 2014; Sanchez-Lorenzo et al., 2015; Cherif et al., 2020). This increasing trend has been attributed to the decrease in anthropogenic sulphate aerosols over the 1980–2012 period (Nabat et al., 2014). In model sensitivity experiments, the aerosol trend has been quantified to explain 81 ± 16% of the European surface shortwave trend and 23 ± 5% of the European surface temperature warming. It is likely that trends in anthropogenic aerosols in Europe have generated positive trends in shortwave radiation and surface temperature since the 1980s (Sections 6.3.3.1, 8.3.1.6 and 10.6.4).
Assessments of observed European trends in meteorological extremes and CIDs are reported elsewhere in this report. Section 11.3.5 documents and attributes an increase in the frequency and extent of heatwaves and daily maximum temperatures, and Section 11.6.2 discusses the uncertainty concerning the detection of trends in meteorological droughts, and the role of increasing atmospheric evaporative demand on hydrological and ecological/agricultural droughts. Section 8.3.1.8 reports on increasing aridity trends in the Mediterranean related to soil moisture declines and increases in atmospheric water vapor demand. Section 11.4.2 reports on the increased likelihood and intensity of daily precipitation extremes, while Sections 11.5.2 and 12.4.5.2 discuss implications for peak streamflow. Section 12.4.5.5 discusses the increased likelihood of wildfires, while Section 12.4.5.3 discusses the substantial decadal variability in mean wind speed and the trends in wind storms and gusts. The acceleration of sea level rise in the Atlantic and European seas has been discussed in Section 12.4.5.5.
Atlas.8.3 Assessment of Model Performance
A globalevaluation of annual mean temperature and precipitation from the CMIP6 ensemble is presented in Sections 3.3.1 and 3.3.2 respectively. In general, annual mean temperature is slightly underestimated at high latitudes and overestimated in the MED area. Temporal evolution of decadal temperature oscillations in Europe simulated by the CMIP6 historical simulations is well reproduced (Fan et al., 2020). Fernandez-Granja et al. (2021) report an overall improvement of CMIP6 compared to CMIP5 to reproduce atmospheric weather patterns over Europe.
Regional climate models (RCMs; Section 10.3.1.2) have been extensively evaluated for a range of climate features over Europe (Casanueva et al., 2016; Vaittinada Ayar et al., 2016; Krakovska et al., 2017; Terzago et al., 2017; Cavicchia et al., 2018; Drobinski et al., 2018; Fantini et al., 2018; Harzallah et al., 2018; Ivanov et al., 2018; Panthou et al., 2018a). Standard assessments of RCMs driven by reanalyses, typically run at 12–25 km spatial resolution, confirm that the Euro-CORDEX and Med-CORDEX ensembles are capable of reproducing the salient features of European climate (Kotlarski et al., 2014; Krakovska, 2018) and represent European circulation features realistically (Cardoso et al., 2016; Drobinski et al., 2018; Flaounas et al., 2018; Sanchez-Gomez and Somot, 2018). Seasonal and regionally averaged temperature biases generally do not exceed 1.5°C, while precipitation biases can be up to ±40% (Kotlarski et al., 2014). Extensive evaluation of a large collection of RCM–GCM combinations show a general wet, cold and windy bias compared to observations and reanalyses, but none of the models is systematically performing best or worst (Vautard et al., 2021). Higher-resolution simulations do show improved performance in reproducing the spatial patterns and seasonal cycle of not only extreme precipitation but also mean precipitation over all European regions (see Sections 10.3.3.4 and 10.3.3.5 for an extensive evaluation of the added value of increased simulation resolution; Mayer et al., 2015; Fantini et al., 2018; Soares and Cardoso, 2018; Ciarlo` et al., 2021).
In line with findings reported in Section 10.3.3.8, several studies argue that both GCMs and RCMs underestimate the observed trend in European summer temperature (Dosio, 2016; Boé et al., 2020b), indicating that essential processes are missing or that the natural variability is not correctly sampled (Dell’Aquila et al., 2018). Nabat et al. (2014) argued that including realistic aerosol variations enables climate models to correctly reproduce the summer warming trend (as is required for attributing continental annual temperature trends, Section 3.3.1.1). However, other studies showed models to be sensitive also to local effects, such as land surface processes, convection, microphysics and snow albedo (Vautard et al., 2013; Davin et al., 2016). In Euro-CORDEX the warm and dry summer bias over southern and south-eastern Europe is reduced compared to the previous ENSEMBLES simulations (Katragkou et al., 2015; Giot et al., 2016; Prein and Gobiet, 2017; Dell’Aquila et al., 2018). Natural variability has strongly affected the historical warming and large ensembles are necessary for a correct estimation of the forced signal versus natural variability (Aalbers et al., 2018; Lehner et al., 2020).
Specific assessments of convection-permitting RCMs (CPRCMs, running at a resolution of typically 1 to 3 km and designed for extreme precipitation characteristics) is undertaken in Section 10.3.3.4.1. A unique CPRCM ensemble has been applied over the great Alpine domain and improves representation of mean and extreme precipitation compared to coarser resolution models (Ban et al., 2021; Pichelli et al., 2021). The role of aerosol forcing is increasingly analysed as new and more realistic aerosol datasets become available (Nabat et al., 2013; Pavlidis et al., 2020), and as RCMs begin to include interactive aerosols (Nabat et al., 2012, 2015, 2020; Drugé et al., 2019). Explicitly accounting for aerosol effects in RCMs leads to improved representation of the surface shortwave radiation at various scales: long-term means (Gutiérrez et al., 2018), day-to-day variability (Nabat et al., 2015), and long-term trends (Nabat et al., 2014).
New, or updated, higher-resolution, coupled atmosphere-ocean-ice model systems have been found to improve simulations of observed climate features over the Baltic area compared to atmosphere-only model versions, including correlation between precipitation and SST, between surface heat-flux components and SST, and weather events like convective snow bands over the Baltic Sea (e.g., Tian et al., 2013; Van Pham et al., 2014; Gröger et al., 2015; S. Wang et al., 2015 ; Pham et al., 2017). Coupled atmosphere–land–river–ocean regional climate system models (RCSMs) from Med-CORDEX have similar skill as the ENSEMBLES and the Euro-CORDEX ensembles to represent decadal variability of Mediterranean climate and its extremes (Cavicchia et al., 2018; Dell’Aquila et al., 2018; Gaertner et al., 2018). Panthou et al. (2018a) showed that, over land, differences between atmosphere-only and coupled RCMs are confined to coastal areas that are directly influenced by SST anomalies. In contrast, Van Pham et al. (2014) showed significant differences in seasonal mean temperature across a widespread continental domain.
Statistical downscaling methods are assessed in Section 10.3.3.7, including the intercomparison and evaluation activities performed in the framework of VALUE and Euro-CORDEX over Europe.
Atlas.8.4 Assessment and Synthesis of Projections
Simulations from CMIP5 and CMIP6 indicate pronounced geographical patterns and scenario dependence of the projections of mean temperature and precipitation. Global warming projected under SSP5-8.5 emissions in CMIP6 exceeds the warming projected by RCP8.5 emissions in CMIP5 (Section 4.3; Forster et al., 2020). In selected regions in Europe CMIP6 also projects a systematically higher mean temperature than CMIP5 (Seneviratne and Hauser, 2020). The annual mean projections from CMIP5, CMIP6 and 0.11° resolution EURO-CORDEX contained in the Interactive Atlas are shown for the four European regions in Figure Atlas.24. For each region and season a warming offset between the pre-industrial (1850–1900) and the recent past (1995–2014) baselines is also shown. The results confirm higher CMIP6 long-term annual mean warming rates for WCE, EEU and MED and a larger inter-model spread for each region. For given GWLs, regional annual mean temperature change in CMIP5 and CMIP6 are largely consistent and higher than the global average, most prominently in EEU. For high warming levels the CMIP5 subset of eight GCMs used to drive the EURO-CORDEX simulations show a lower annual mean temperature change than the full CMIP5 ensemble in each of the European sub-regions. This illustrates the large inter-model spread and implications for subsampling a relatively small subset from the full ensemble. Regional warming is strongest in continental EEU away from the Atlantic and in MED during summer (Lionello and Scarascia, 2018). The assessment of EURO-CORDEX projections for levels of global warming of 1.5°C and 2.0°C indicate enhanced local warming even at relatively low global warming levels, particularly towards the north in winter (Schaller et al., 2016; Dosio and Fischer, 2018; Kjellström et al., 2018; Teichmann et al., 2018).
 Figure Atlas.24 | Regional changes over land in annual mean surface air temperature and precipitation relative to the 1995–2014 baseline for the reference regions in Europe (warming since the 1850–1900 pre-industrial baseline is also provided as an offset). Bar plots in the left panel of each region triplet show the median (dots) and 10th–90th percentile range (bars) across each model ensemble for annual mean temperature changes for four datasets (CMIP5 in intermediate colours; a subset of CMIP5 used to drive CORDEX in light colours; CORDEX overlying the CMIP5 subset with dashed bars; and CMIP6 in solid colours); the first six groups of bars represent the regional warming over two time periods (near-term 2021–2040 and long-term 2081–2100) for three scenarios (SSP1-2.6/RCP2.6, SSP2-4.5/RCP4.5 and SSP5-8.5/RCP8.5), and the remaining bars correspond to four global warming levels (GWLs: 1.5°C, 2°C, 3°C and 4°C). The scatter diagrams of temperature against precipitation changes display the median (dots) and 10th–90th percentile ranges for the above four warming levels for December–January–February (DJF; middle panel) and June–July–August (JJA; right panel), respectively; for the CMIP5 subset only the percentile range of temperature is shown, and only for 3°C and 4°C GWLs. Changes are absolute for temperature (in °C) and relative (as %) for precipitation. See Atlas.1.3 for more details on reference regions (Iturbide et al., 2020) and Atlas.1.4 for details on model data selection and processing. The script used to generate this figure is available online (Iturbide et al., 2021) and similar results can be generated in the Interactive Atlas for flexibly defined seasonal periods. Further details on data sources and processing are available in the chapter data table (Table Atlas.SM.15).
 Some signatures of climate change projected by GCMs are modified by RCMs and CPRCMs. Projections of temperature, precipitation and wind in RCMs may deviate from GCM signals dependent on the dominant atmospheric circulation (Kjellström et al., 2018). In many areas RCMs produce lower warming rates and higher precipitation (less drying) in summer (Fernández et al., 2019; Boé et al., 2020a). Also, for mean surface shortwave radiation, systematic differences between GCM and RCM outputs are found (Bartók et al., 2017; Gutiérrez et al., 2020). Although RCMs generally have a smaller bias for the present climate (Sørland et al., 2018) and better cloud representation (Bartók et al., 2017), the representation of aerosol forcing (Boé et al., 2020a; Gutiérrez et al., 2020), air-sea coupling (Boé et al., 2020a) or vegetation response to elevated atmospheric CO2 (Schwingshackl et al., 2019) give rise to systematic biases in RCM projections. The comparison between EURO-CORDEX and the CMIP5 subset shown in Figure Atlas.24 illustrates that the RCMs primarily modify the climate change warming signal from the driving GCMs for MED and WCE in summer (Boé et al., 2020a).
Changes in precipitation clearly show a seasonal signature and a meridional gradient over Europe. Mean precipitation increases by 4–5% per °C of global warming in NEU, EEU and WCE in DJF, and decreases in summer in WCE and MED (Figure Atlas.24; Jacob et al., 2018). CMIP5 projections of precipitation change in MED are strongest in DJF in the south, while changes in JJA are dominant in the northern (European) part of MED (Lionello and Scarascia, 2018). The European north–south gradient in precipitation response is confirmed by the EURO-CORDEX experiment (Coppola et al., 2021a), but Figure Atlas.24 shows that the JJA precipitation reduction in WCE projected by CMIP5 and CMIP6 at higher warming levels has low confidence in the CORDEX simulations. Precipitation in JJA in EEU is reduced in CMIP6, while little change is shown in CMIP5. Quantitative estimations of climate change features from regional climate projections in Eastern Europe (Partasenok et al., 2015; Kattsov et al., 2017) have low confidence due to the use of relatively small ensembles of GCMs and/or RCMs, and limited evaluation of model performance in the region.
Over specific geographic features such as high mountains, RCMs further modify the climate change signal of precipitation simulated by the low-resolution GCMs (Giorgi et al., 2016; Torma and Giorgi, 2020). This is especially true for summer precipitation over the Alps where opposite signs of changes in mean and extreme precipitation are generated by the CMIP5 GCM ensemble and the 12-km Med-CORDEX and EURO-CORDEX RCM ensembles (Section 10.6.4.7; Giorgi et al., 2016).
Regional warming is virtually certain to extend the observed downward trends in snow accumulation, snow water equivalent and length of the snow cover season in NEU and at low altitudes in mountainous areas in the Alps and Pyrenees (very high confidence). This is supported by regional and global multi-model and/or single-model ensemble projections including CMIP5, PRUDENCE, ENSEMBLES and EURO-CORDEX (Jylhä et al., 2008; Steger et al., 2013; Mankin and Diffenbaugh, 2015; Schmucki et al., 2015; Marty et al., 2017; Frei et al., 2018), and attributed to changes in the snowfall fraction of precipitation and to increased snowmelt. In mountain areas a strong dependence of projected snow trends on altitude is shown, with most pronounced effects below 1500 m (López-Moreno et al., 2009). Terzago et al. (2017) showed a large positive bias in the amplitude of the annual snow cycle of EURO-CORDEX 0.11° simulations driven by GCM projections, while reanalysis-driven RCMs showed good agreement with in situ observations.
Regional ocean warming in projections with RCSMs for the Baltic and North seas (Gröger et al., 2015) and for the Mediterranean (Darmaraki et al., 2019) is associated with increased intensity and frequency of marine heatwaves in the Mediterranean (Section 12.4.5.5), strong freshening in the Baltic, and, for some simulations, changes in the circulation in response to non-uniform changes in air-sea interaction (Dieterich et al., 2019). Med-CORDEX RCSM and CMIP5 GCM results agree well on the Mediterranean SST warming rate (Mariotti et al., 2015; Darmaraki et al., 2019); see also the Interactive Atlas.
Assessments of projected changes in meteorological extremes and CIDs are reported elsewhere in this report. Extreme precipitation and temperature often exhibit a different response to global warming than mean values. Increased intensity and frequency of extreme temperatures and heatwaves is assessed in Sections 11.3.5 and 12.4.5.1. Changes in the hydrological cycle include enhanced soil moisture decline in southern Europe, drying in summer and autumn in Central Europe, and spring drought due to early snowmelt in Northern Europe (Sections 8.4.1, 11.6.5 and 12.4.5.2). Changes in mean and extreme wind are very uncertain (Section 12.4.5.3), while sea level rise will increase the frequency of occurrence of extreme sea level at most European coasts (Section 12.4.5.5).
Atlas.8.5 Summary
An assessment of recent literature largely confirms the findings of previous IPCC reports but with additional detail and (in some cases) higher confidence due to improvements in observations, reanalyses and methods. Observational datasets with global coverage are complemented by the E-OBS gridded ensemble temperature and precipitation dataset, a range of regional observational analyses, and regional reanalysis products. New RCM experiments, including CPRCMs and regional coupled climate system models, mostly coordinated under the umbrella of CORDEX, have generated many new projections and process studies.
The representation of mean European climate features by GCMs and RCMs is improved compared to previous IPCC assessments (medium confidence), in spite of persisting biases in annual mean and seasonal temperature and precipitation characteristics. The added value of regional downscaling of GCMs by RCM projections for summer mean temperature, precipitation and shortwave radiation is constrained by the representation of processes that lead to a systematic difference between RCM and driving GCM, such as aerosol forcing (medium confidence).
It is virtually certain that annual mean temperature continues to increase in each European region. There is medium confidence that annual mean precipitation in NEU, WCE and EEU has increased since the early 20th century. In the European Mediterranean trends in annual mean precipitation contain substantial spatial and temporal variability (medium confidence). It is very likely that since the early 1980s in snow-dominated areas in NEU and EEU the length of the snowfall season is reduced with regional warming, and the melt onset dates have advanced. It is likely that decreasing trends in anthropogenic aerosols in Europe have generated positive trends in shortwave radiation and surface temperature since the 1980s.
At increasing levels of global warming, there is very high confidence that temperature will increase in all European areas at a rate exceeding global mean temperature increases, while increased mean precipitation amounts at high latitudes in DJF and reduced JJA precipitation in southern Europe will occur with medium confidence for global warming levels below 2°C, and with high confidence for higher warming levels. At high latitudes and low-altitude mountain areas in Europe strong declines in snow accumulation are virtually certain to occur with further increasing regional temperatures (very high confidence).
Atlas.9 North America
The assessment in this section focuses on changes in average temperature and precipitation (rainfall and snow) for North America, including the most recent years of observations, updates to observed datasets, the consideration of recent studies using CMIP5 and those using CMIP6 and CORDEX simulations. Assessment of changes in extremes is in Chapter 11 (Tables 11.19–21) and climatic impact-drivers in Chapter 12 (Table 12.8).
Atlas.9.1 Key Features of the Regional Climate and Findings From Previous IPCC Assessments
Atlas.9.1.1 Key Features of the Regional Climate
The recent-past climate of North America is characterized by high spatial heterogeneity and by variability at diverse temporal scales. Considering the traditional Köppen-Geiger classification, North America covers all main climate types (see reference region descriptions below). Important geographical features influence local climates over various distances, like the Rocky Mountains through cyclogenesis (Grise et al., 2013) and the Great Lakes through lake-effect snowfall (Wright et al., 2013). The cryosphere is an important component of the climate system in North America, with fundamental roles for sea ice cover, snow cover and permafrost. The ocean surrounding the continent also influences its climate, with water temperatures strongly influencing hurricane activity which impacts the coasts of eastern Mexico and south-eastern USA (Walsh et al., 2010). Temporal variability is influenced by several large-scale atmospheric modes (Table Atlas.1 and Annex IV) with the North Atlantic Oscillation (NAO) affecting north-eastern USA and eastern Canada precipitation (Whan and Zwiers, 2017), and El Niño–Southern Oscillation (ENSO) affecting temperature and precipitation in California, although in a complex and not yet fully understood manner (Yoon et al., 2015; Yeh et al., 2018).
The reference regions defined for summarising North America climate change (Figure Atlas.26) include: North-Western North America (NWN), characterized by a sub-Arctic climate with cool summers and rainfall all year round; North-Eastern North America (NEN), which also has a sub-Arctic climate with sections of tundra climate in the far north (these two northern regions are also discussed in Section Atlas.11.2, Polar Arctic); Western North America (WNA), which has a complex but mainly cold semi-arid climate; Central North America (CNA) with a mainly continental climate in the northern part of the region and a humid subtropical climate in the southern portion; Eastern North America (ENA) with a humid continental climate in the northern half and a humid subtropical climate to the south; Northern Central America (northern Mexico; NCA), has a temperate climate to the north of the Tropic of Cancer, with marked differences between winter and summer, modulated by the North American Monsoon (Peel et al., 2007).
Atlas.9.1.1 Findings From Previous IPCC Assessments
The IPCC AR5 (Bindoff et al., 2013; Hartmann et al., 2013) found that the climate of North America has changed due to anthropogenic causes (high confidence), in particular with primarily increasing annual precipitation and annual temperature (very high confidence). Assessment of CMIP5 ensemble projections concluded that mean annual temperature over North America and annual precipitation north of 45°N will very likely continue to increase in the future. Also, CMIP5 projects increases in winter precipitation over Canada and Alaska and decreases in winter precipitation over the south-western USA and much of Mexico.
The CMIP5 multi-model ensemble generally reproduces the observed spatial patterns but somewhat underestimates the extent and intensity of the North American Monsoon, and also underestimates wetting over Central North America over the period of 1950–2012 during the winter season according to AR5 (Flato et al., 2013). In the long term (2081–2100), the largest changes of precipitation over North America are projected to occur in the mid- and high latitudes and during winter (Kirtman et al., 2013).
The SR1.5 (Hoegh-Guldberg et al., 2018) reported a stronger warming compared to the global mean over Central and Eastern North America, and a weakening of storm activity over North America under 1.5°C of global warming. The SROCC (Hock et al., 2019b) reported that snow depth or mass is projected to decline by 25% mainly at lower elevations over the high mountains in Western North America. The SRCCL (Mirzabaev et al., 2019) observed vegetation greening in Central North America with high confidence.
Atlas.9.2 Assessment and Synthesis of Observations, Trends, and Attribution
The observed trends in annual mean surface temperature (Figure Atlas.11 and the Interactive Atlas) across near-Arctic latitudes are exceptionally pronounced (>0.5°C per decade), significant and consistent across datasets except for far north-east Canada where trends are not significant in the CRU dataset. Significant positive trends are seen across the rest of North America during 1961–2015 (Figure Atlas.11) though over the shorter 1980–2015 period the regional dataset Daymet (Thornton et al., 2016) records non-significant changes over southern Alaska, western and south-central Canada, and north-central USA (Interactive Atlas). An analysis of annual mean surface temperature in the Berkeley Earth dataset aggregated over the reference regions (Figure Atlas.11) demonstrates that a temperature change signal has emerged over all regions of North America. There is a detectable anthropogenic influence (medium confidence) on the observed upward annual temperature trends in Western and northern North America (Vose et al., 2017; Z. Wang et al., 2017 ; Smith et al., 2019).
Compared to temperature, trends in annual precipitation over 1961–2015 are generally non-significant though there are consistent positive trends over parts of ENA and CNA (Figure Atlas.11 and Daymet, Interactive Atlas) (high confidence). The global and regional datasets in Figure Atlas.11 and the Interactive Atlas also indicate significant decreases in precipitation in parts of south-western USA and north-western Mexico (Figure 2.15) though these are not all spatially coherent so there is onlymedium confidence in a drying trend over this region.
Several factors account for the differences in temperature and precipitation trend significance. Observed trends in precipitation are relatively modest compared to the very large natural interannual variability of precipitation. Furthermore, the precipitation observing network is spatially inadequate (Section 10.2.2.3) and temporally inconsistent (Section 10.2.2.2) over some regions of North America, particularly over the Arctic and mountainous areas. So detection of multi-decadal trends is difficult, especially for regions with summer convective precipitation maxima that may be spatially patchy (Easterling et al., 2017). See Section 2.3 for further discussion of precipitation trends.
There is evidence of a recent decline in the overall North American annual maximum snow mass, with a trend for non-alpine regions above 40°N during 1980–2018 estimated from the bias-corrected GlobSnow 3.0 data (medium confidence) (Pulliainen et al., 2020). This is despite technical challenges with in situ measurements and remote-sensing retrievals of snow variables (Larue et al., 2017; Smith et al., 2017; X.L. Wang et al., 2017 ; Zeng et al., 2018), spatial heterogeneity and interpolation assumptions that affect gridded reference products, notably over alpine and forested areas (Mudryk et al., 2015; Dozier et al., 2016; Cantet et al., 2019), and breaks in instruments and procedures (Kunkel et al., 2007; Mortimer et al., 2020). Changes in snow cover have evolved in a complex way, with both positive and negative trends, and differing from one metric to another (Knowles, 2015; Brown et al., 2019). Evidence of snow cover decline includes decreases in annual maximum snow depth and in snow water equivalent (Vincent et al., 2015; Kunkel et al., 2016; Mote et al., 2018), as well as a shortening of the snow-season duration (Knowles, 2015; Vincent et al., 2015). However, reported snow-decline trends are statistically significant only for a fraction of the concerned areas or locations (low confidence) (Figure Atlas.25). See also Sections 2.3.2.2 and 9.5.3.1.
 Figure Atlas.25 | Grid-box trends (mm yr–1) in annual maximum snow depth for cold-season periods of 1960/1961 to 2014/2015 in North America. (Left) Numbers indicate number of stations available in that grid box. (Right) Boxes with ‘x’ indicate non-significant trends (at the p < 0.05 level of significance; Kunkel et al., 2016).
 Rupp et al. (2013) applied a standard fingerprinting approach to CMIP5 models and determined that the decline in Northern Hemisphere spring snow cover extent could only be explained by simulations that included natural and anthropogenic forcing. In an attribution study focusing on direct physical causes, it was found that increased spring snowmelt in northern Canada was driven by warming-induced high-latitude changes such as atmospheric moisture, cloud cover, and energy advection (Mioduszewski et al., 2014).
In an analysis of drivers of the record low snow water equivalent (SWE) values of spring 2015 in the western USA, it was found that the relative importance of greenhouse gases varies spatially (Mote et al., 2016). See also Section 3.4.2 for further discussion of anthropogenic influences on snow extent.
Atlas.9.3 Assessment of Model Performance
CMIP6 models have been evaluated in the literature, although these studies have not included the full set of CMIP6 simulations. Fan et al. (2020) established on a continental basis for North America that temperature pattern correlations were quite accurate. Thorarinsdottir et al. (2020) compared maximum and minimum temperatures over Europe and North America with several observational datasets and found that the CMIP6 ensemble agreed better with ERA5 data than did CMIP5. Srivastava et al. (2020) evaluated historical CMIP6 simulations for precipitation, comparing them with several observational datasets over the continental US. Most models show a wet bias over the eastern half of the continental USA and the north-east region, while dry biases persist in the central part of the country (Akinsanola et al., 2020a; Almazroui et al., 2021). The spatial structure of biases is similar in CMIP5 and CMIP6, but with lower magnitudes in CMIP6. Agel and Barlow (2020) examined 16 CMIP6 models over the north-eastern USA for precipitation and did not find a distinct improvement over CMIP5, although they did find the higher-resolution models tended to perform better. On the basis of the evidence so far, there is medium confidence that CMIP6 models are improved compared to CMIP5 in terms of biases in mean temperature and precipitation over North America.
North America has been extensively used as a test bed for regional climate model (RCM) experiments, such as the North American Regional Climate Change Assessment Program (NARCCAP; Mearns et al., 2009), the MultiRCM Ensemble Downscaling (MRED; Yoon et al., 2012), and NA-CORDEX (Bukovsky and Mearns, 2020). Therefore, much performance evaluation has been conducted with a focus on specific climate features in North America. For the North American Monsoon region, multi-model performance evaluation (Bukovsky et al., 2013; Tripathi and Dominguez, 2013; Cerezo-Mota et al., 2016) or a single-member performance (Lucas-Picher et al., 2013; Martynov et al., 2013; Šeparović et al., 2013) demonstrated the added value of RCMs, particularly more recent CORDEX simulations, through improved simulation of summer precipitation and the climatological winter storm tracks across the western USA. NA-CORDEX simulations were more successful at reproducing weather types compared to a single model-based large perturbed-physics ensemble (Prein et al., 2019). The application of a complex evaluation tool to the full suite of NA-CORDEX simulations found that the higher-resolution simulations (25 km compared with 50 km) of precipitation were improved, particularly for daily intensity (Gibson et al., 2019).
However, deficiencies have also been reported. For example, excessive storm occurrence over the east coast of North America was found (Poan et al., 2018), and amplitude in the simulated annual cycle was generally excessive in NA-CORDEX simulations. RCMs tend to produce more (less) precipitation over mountains (the coastal plains; Cerezo-Mota et al., 2016) and winter precipitation in the western USA had large positive biases in all RegCM simulations, regardless of the driving GCM (Mahoney et al., 2021).
Recently, convective-permitting RCMs have been used to simulate North American climate features and generated better simulations of precipitation. For example, summer precipitation over the south-western USA was improved due to better representation of organized mesoscale convective systems at the sub-daily scale (Castro et al., 2012; Liu et al., 2017; Prein et al., 2017a; Pal et al., 2019), the diurnal cycle of convection (Nesbitt et al., 2008), and in terms of means (and extremes) for the north-eastern USA (Komurcu et al., 2018).
Recent studies have examined RCMs’ simulation of SWE, a quantity of primary importance notably for hydrological modelling, though its ground measurements are restricted by relatively high time and monetary costs (Smith et al., 2017; Odry et al., 2020) which limit model assessment. Also, studies often emphasize that a false impression of model skill for SWE can be obtained by compensating temperature and precipitation biases. Assessment frameworks have dealt with these issues by considering observational uncertainty (Mccrary et al., 2017) and by decomposing SWE biases into their contributing processes (Rhoades et al., 2018; Xu et al., 2019). SWE biases exceed observational uncertainty in several 50-km reanalysis-driven NARCCAP simulations over several regions, for all cold months (Mccrary et al., 2017). Analyses of NA-CORDEX simulations show that refining spatial resolution from 50 to 12 km improves certain (but not all) aspects of SWE, stemming from improved mean precipitation and topography-related temperature (Xu et al., 2019). Similarly an assessment of RCM simulations of freezing rain over eastern Canada found a mix of improved and deteriorated aspects from higher resolution (St-Pierre et al., 2019).
Atlas.9.4 Assessment and Synthesis of Projections
CMIP5 and CMIP6 surface temperature and precipitation projections over the region are similar, with all regions warming more than the global average, most prominently those in the north (Figure Atlas.26). CMIP6 projects, for all scenarios and time periods, higher temperature changes (Chapter 4), with this contrast more accentuated in the long-term future and at higher global warming levels. The higher warming in the north (Interactive Atlas) is clear when comparing NEN, with increases from 2°C to over 8.5°C on an annual basis for SSP5-8.5 (near term to long term compared to a 1995–2014 baseline), to NCA, where changes range from 1.5°C to 6°C across the same periods. Maps showing changes in temperature and precipitation, and their robustness, are available in the Interactive Atlas. The number of model results (i.e., ensemble size used to generate these figures) differs, and this sample size difference may affect the results, but the patterns and magnitudes of change are generally consistent and thus it is very likely that temperatures will increase throughout the 21st century in all land areas, with stronger warming in the far north.
 Figure Atlas.26 | Regional changes over land in annual mean surface air temperature andprecipitation relative to the 1995–2014 baseline for the reference regions in North America (warming since the 1850–1900 pre-industrial baseline is also provided as an offset). Bar plots in the left panel of each region triplet show the median (dots) and 10th–90th percentile range (bars) across each model ensemble for annual mean temperature changes for four datasets (CMIP5 in intermediate colours; a subset of CMIP5 used to drive CORDEX in light colours; CORDEX overlying the CMIP5 subset with dashed bars; and CMIP6 in solid colours); the first six groups of bars represent the regional warming over two time periods (near-term 2021–2040 and long-term 2081–2100) for three scenarios (SSP1-2.6/RCP2.6, SSP2-4.5/RCP4.5 and SSP5-8.5/RCP8.5), and the remaining bars correspond to four global warming levels (GWLs: 1.5°C, 2°C, 3°C and 4°C). The scatter diagrams of temperature against precipitation changes display the median (dots) and 10th–90th percentile ranges for the above four warming levels for December–January–February (DJF; middle panel) and June–July–August (JJA; right panel), respectively; for the CMIP5 subset only the percentile range of temperature is shown, and only for 3°C and 4°C GWLs. Changes are absolute for temperature (in °C) and relative (as %) for precipitation. See Atlas.1.3 for more details on reference regions (Iturbide et al., 2020) and Atlas.1.4 for details on model data selection and processing. The script used to generate this figure is available online (Iturbide et al., 2021) and similar results can be generated in the Interactive Atlas for flexibly defined seasonal periods. Further details on data sources and processing are available in the chapter data table (Table Atlas.SM.15).
 CMIP5 results have been analysed extensively (e.g., Maloney et al., 2014) and used in major climate change assessments. The most recent US National Climate Assessment analysis of CMIP5 focusing on RCP4.5 and RCP8.5 for two future time periods stated that the USA would continue to warm regardless of the scenario, but is likely to be higher with higher-emissions scenarios (e.g., RCP8.5). Projected changes in precipitation are somewhat complex, but increased precipitation dominates in winter and spring, whereas in summer changes are more variable and uncertain. Canada’s Changing Climate Report (Bush and Lemmen, 2019) presents changes in temperature and precipitation, as well as other variables, such as snow, for future periods in Canada using results from CMIP5. It indicates that annual and winter precipitation is projected to increase everywhere in Canada over the 21st century with larger percentage increases in the north. Temperature is also projected to increase, regardless of the scenario, and with larger changes occurring in the north.
To provide the basis for generating additional information compared to that derived from CMIP5 the NA-CORDEX experiments were designed to involve a GCM-RCM matrix which included multiple GCMs that sampled the full range of climate sensitivity, multiple RCMs, at two different spatial resolutions (25 and 50 km) and a range of emissions scenarios (in most cases RCP4.5 and RCP8.5; Mearns et al., 2017). Karmalkar (2018) noted that the NA-CORDEX models cover sub-regional ranges of temperature change from the CMIP5 GCMs better than NARCCAP did for the CMIP3 models. This structural design shift provides greater confidence in the NA-CORDEX results in terms of sampling the uncertainty across the CMIP5 models (Figure Atlas.27; Bukovsky and Mearns, 2020). The pattern of warming is as seen in CMIP5 and CMIP6, which also builds confidence that the RCMs generate high-resolution results consistent with CMIP5 on large scales whilst providing added value over regions such as the complex topography of the Rocky Mountains in the western USA, which are not well resolved in the GCMs. There is high confidence that downscaling a subset of CMIP models that spans the range of climate sensitivities in the full ensemble is critical for producing a representative range of dynamically downscaled projections.
 Figure Atlas.27 | Changes (2070–2099 relative to 1970–1999) in the annual mean surface air temperature by three GCMs (GFDL-ESM2M, MPI-ESM-LR, HadGEM2-ES) and two RCMs (WRF and RegCM4) nested in the GCMs, for the RCP8.5 scenario over North America (after Bukovsky and Mearns, 2020).
 There are striking contrasts in the seasonal results for precipitation for the sub-regions (Figure Atlas.26). The northern regions and ENA all show steady increases with the global warming levels (very high confidence). For example, the projected increases in the NEN region range from 7% in the near term to 40% at the end of the 21st century for the SSP5-8.5 scenario. In contrast, projected changes for NCA are for significant decreases both on an annual basis (Interactive Atlas) and in winter, and which become greater as warming increases (Akinsanola et al., 2020b; Almazroui et al., 2021). The other two regions (WNA and CNA) exhibit mainly increases in winter. In summer, distributions are in general less uniform except for NWN and NEN, which display steady increases with global warming levels (but smaller than in winter). WNA and CNA mainly show decreases (based on the median values) but with some models projecting increases. Projections from the NA-CORDEX ensemble are consistent with those from the GCMs whilst providing greater detail of precipitation changes over the mountains and along the coasts (Interactive Atlas; Bukovsky and Mearns, 2020). Similar results are found in other analyses of RCM projections (Wang and Kotamarthi, 2015; Ashfaq et al., 2016; Teichmann et al., 2021). Also, further analysis of the NA-CORDEX projections showed substantial changes in weather types related to increased monsoonal flow frequency and drying of the northern Great Plains in summer (Prein et al., 2019).
In summary, NEN, NWN and most of ENA will very likely experience increased annual mean precipitation, with greater increases at higher levels of warming (very high confidence). In NCA decreases predominate on an annual basis and particularly in winter (high confidence). Projected changes in summer are highly uncertain throughout other regions apart from the far northern parts of NEN and NWN which will likely experience increases (high confidence).
As discussed in Section 10.3.3.4, an important advance in regional modelling over the past decade or so is the use of convection-permitting regional models (CPMs; Prein et al., 2015, Prein et al., 2017a). There have been a number of experiments using CPMs over North America (e.g., Rasmussen et al., 2014; Prein et al., 2015, Prein et al., 2019; Liu et al., 2017; Komurcu et al., 2018). A CPM study over North America that investigated changes in Mesoscale Convective Systems projected that by the end of the century, assuming an RCP8.5 scenario, their frequency more than tripled and associated precipitation increased by 80% (Prein et al., 2017b). A multiple nesting of WRF over the north-eastern USA, downscaling to 3 km a CESM GCM climate projection assuming an RCP8.5 scenario, found a different pattern of precipitation change of mixed increases and decreases compared to the GCM projection of increases every month (Komurcu et al., 2018). These investigations demonstrate the potential of very-high-resolution simulations to add important dimensions to our understanding of regional climate change, though not necessarily to reduce uncertainty (high confidence).
It is virtually certain that snow cover will experience a general decline across North America during the 21st century, in terms of extent, annual duration and SWE, based on CMIP5 (Maloney et al., 2014), CMIP6 (Mudryk et al., 2020), NA-CORDEX (Mahoney et al., 2021) and NARCCAP (e.g., McCrary and Mearns, 2019) simulations. For some regions the decline could be discernible over the next few decades, for example in the western USA (Fyfe et al., 2017). It is, however, likely that some high-latitude regions will rather experience an increase in certain winter snow cover properties (Mudryk et al., 2018; McCrary and Mearns, 2019), due to snowfall increase (Krasting et al., 2013) prevailing over the warming effect. Discussion of changes in snow in the future is also covered in Section 9.5.3, but for larger regions.
The fraction of precipitation falling as snow is projected to decrease practically everywhere over North America, including over the western USA and south-western Canada (Mahoney et al., 2021), and in the Great Lakes basin where lake-effect precipitation is important (Suriano and Leathers, 2016). In this basin, the frequency of heavy lake-effect snowstorms is expected to decrease during the 21st century, except for a possible temporary increase around Lake Superior by mid-century, if local air temperatures remain low enough (Notaro et al., 2015). CMIP5 simulations of the periods 1981–2000 and 2081–2100 over the central and eastern USA suggest a northward shift in the transition zone between rain-dominated and snow-dominated areas, by about 2° latitude under the RCP4.5 scenario and 4° latitude under the RCP8.5 scenario (Ning and Bradley, 2015). Rain-on-snow event properties over North America should also evolve during the 21st century, with non-trivial dependencies on the positioning relative to the freezing line (Jeong and Sushama, 2018) and on elevation (Musselman et al., 2018).
Atlas.9.5 Summary
Across North America it is very likely that positive surface temperature trends are persistent. Across near-Arctic latitudes of North America, increases are exceptionally pronounced, greater than 0.5°C per decade (high confidence). In parts of Eastern and Central North America it is likely that annual precipitation has increased over the period 1961–2015 but with no clear trends in other regions except for parts of the south-western USA and north-western Mexico where there is medium confidence in drying.
Model representation of the climatology of mean temperature and precipitation has likely improved compared to AR5 over North America. This is aided by continuous model development, and the existence of new coordinated modelling initiatives such as NA-CORDEX. There is high confidence that downscaling a subset of CMIP models that spans the range of climate sensitivities in the full ensemble is critical for producing a representative range of dynamically downscaled projections.
It is virtually certain that annual and seasonal surface temperatures over all of North America will continue to increase at a rate greater than the global average, with greater increases in the far north. It is very likely , based on global and regional model future projections, that on an annual time scale precipitation will increase over most of North America north of about 45°N and in Eastern North America, and it is likely that it will decrease in the south-western USA and northern Mexico, particularly in winter. Elsewhere the direction of change of precipitation is uncertain. It is virtually certain that snow cover will experience a decline over most regions of North America during the 21st century, in terms of water equivalent, extent and annual duration. It is, however, likely that some high-latitude regions will rather experience an increase in winter SWE, due to the snowfall increase prevailing over the warming effect.
Atlas.10 Small Islands
The assessment in this section focuses on changes in average temperature and precipitation for the main Small Islands regions, including the most recent years of observations, updates to observed datasets, the consideration of recent studies using CMIP5 and those using CMIP6 and CORDEX simulations. Assessment of changes in extremes is in Chapter 11 (Sections 11.3.2, 11.4.2, 11.7.1.5 and, for the Caribbean, Tables 11.13–15) and of changes in climatic impact-drivers in Chapter 12 (Section, 12.4.7 and Table 12.9).
Atlas.10.1 Key Features of the Regional Climate and Findings From Previous IPCC Assessments
Atlas.10.1.1 Key Features of the Regional Climate
Many small islands lie in tropical regions and their climate varies depending on a range of factors with location, extent and topography having major influences. In general, their climate is determined by that of the broader region in which they lie as they have little influence on the regional climate, although steep topography can induce higher rainfall totals locally. Temperature variability tends to be low due to the influence of the surrounding ocean, most marked in the tropics where oceanic temperature ranges are small. However, seasonal rainfall variability can often be significant, both through the annual cycle and also interannually through the influence of many modes of variability (Cross-Chapter Box Atlas.2:, Annex IV and Atlas.7.1 for the Caribbean). Many small islands are exposed to tropical cyclones and the associated hazards of high winds, storm surges and extreme rainfall, and many low-lying islands are exposed to regular flooding from natural high-tide and wave activity. In the Pacific, phases of the El Niño–Southern Oscillation result in periods of warmer or cooler than average temperatures following the upper ocean warming of El Niño events or cooling of La Niña events, and respectively weaker and stronger trade winds. El Niño conditions also lead to drought in Melanesian islands and increased tropical cyclones and storm surges in French Polynesia with La Niña conditions causing drought in Kiribati. Other islands experience increased rainfall during these periods.
Atlas.10.1.2 Findings From Previous IPCC Assessments
The AR5 noted observed temperature increases of 0.1°C–0.2°C per decade in the Pacific Islands and that warming was very likely to continue across all Small Islands regions (Christensen et al., 2013; IPCC, 2013a). It also reported decreased rainfall over the Caribbean, increases over the Seychelles, streamflow reductions over the Hawaiian Islands and projections of reduced rainfall over the Caribbean and drier rainy season for many of the south-west Pacific Islands (Christensen et al., 2013; IPCC, 2013a; Nurse et al., 2014). The remaining findings are derived from the SROCC (IPCC, 2019a). Ocean warming rates have likely increased in recent decades with marine heatwaves increasing and very likely to have become longer-lasting, more intense and extensive as a result of anthropogenic warming. Open ocean oxygen levels have very likely decreased and oxygen minimum zones have likely increased in extent. There is very high confidence that global mean sea level rise has accelerated in recent decades which, combined with increases in tropical cyclone winds and rainfall and increases in extreme waves, has exacerbated extreme sea level events and coastal hazards (high confidence). It is virtually certain that during the 21st century, the ocean will transition to unprecedented conditions with further warming and acidification virtually certain, increased upper ocean stratification very likely and continued oxygen decline (medium confidence). There is very high confidence that marine heatwaves and medium confidence that extreme El Niño and La Niña events will become more frequent. It is very likely that these changes will be smaller under scenarios with low greenhouse gas emissions. Global mean sea level will continue to rise and there is high confidence that the consequent increases in extreme levels will result in local sea levels in most locations that historically occurred once per century occurring at least annually by the end of the century under all RCP scenarios (high confidence). In particular, many small islands are projected to experience historical centennial events at least annually by 2050 under RCP2.6 and higher emissions. The proportion of Category 4 and 5 tropical cyclones, and associated precipitation rates and storm surges, along with average tropical cyclone intensity are projected to increase with a 2°C global temperature rise, thereby exacerbating coastal hazards.
Atlas.10.2 Assessment and Synthesis of Observations, Trends and Attribution
Significant positive trends in temperature ranging from 0.15°C per decade (over the period 1953–2010) to 0.18°C per decade (over the period 1961–2011) are noted in the tropical western Pacific, where the significant increasing and decreasing trends in warm and cool extremes, respectively, are also spatially homogeneous (Jones et al., 2013; Whan et al., 2014; Wang et al., 2016). Similarly, much of the Caribbean region showed statistically significant warming (at the 95% level) over the period 1901–2010 (P.D. Jones et al., 2016 b). Observation records in the Caribbean region indicate a significant warming trend of 0.19°C per decade and 0.28°C per decade in daily maximum and minimum temperatures, respectively, with statistically significant increases (at the 5% level) in the number of warm days and warm nights during 1961–2010 (M.A. Taylor et al., 2012 ; Stephenson et al., 2014; Beharry et al., 2015).
A weather station-based annual precipitation trend analysis over 1901–2010 in the Caribbean region indicated some locations with detectable decreasing trends (Knutson and Zeng, 2018), which were attributable in part to anthropogenic forcing. These include southern Cuba, the northern Bahamas, and the Windward Islands, although significant trends were not found over the shorter periods of 1951–2010 and 1981–2010. In the Caribbean islands, a dataset of the Palmer Drought Severity Index (PDSI) from 1950 to 2016 showed a clear drying trend in the region (Herrera and Ault, 2017). The 2013–2016 period showed the most severe drought during the period and was strongly related to anthropogenic warming, which would have increased the severity of the event by 17% and its spatial extent by 7% (Herrera et al., 2018). However, a seasonal analysis of observations grouped into large sub-regions of the Caribbean revealed no significant long-term trends in rainfall over 1901–2012 but significant inter-decadal variability (P.D. Jones et al., 2016 b). Declines in summer rainfall (–4.4% per decade) and maximum five-day rainfall (–32.6 mm per decade) over 1960–2005 were reported for Jamaica (CSGM, 2012), and an insignificant decrease in summer precipitation was observed for Cuba for 1960–1995 (Naranjo-Diaz and Centella, 1998). Three of four stations examined for Puerto Rico exhibited declining JJA rainfall over 1955–2009 with the trend statistically significant at the 95% level for Canóvana (Méndez-Lázaro et al., 2014). In the Caribbean, positive regional trends in precipitation and trends in extremes during 1961–2010 were found to be not statistically significant (at the 5% level; Stephenson et al., 2014; Beharry et al., 2015). Positive trends in JJA rainfall over Cuba and Jamaica are seen in CRU, whereas they are negative over Cuba for GPCC; over eastern Hispaniola they are positive in CRU and negative in CHIRPS (Cavazos et al., 2020).
In Hawaii, between 1920 and 2012, over 90% of the islands showed reduced rainfall and streamflow, an increase in the frequency of days with zero flow (Strauch et al., 2015; Frazier and Giambelluca, 2017), and robust positive trends in drought frequency and severity (McGree et al., 2016). Over the western Pacific, interannual and decadal variabilities also drive long-term trends in rainfall. Recent analysis of station data showed spatial variations in the mostly decreasing but non-significant trends in annual and extreme rainfall over the western Pacific from 1961 to 2011 (low confidence) (McGree et al., 2014). Over the southern subtropical Pacific, decreases in annual, JJA, SON and extreme rainfall, and increasing drought frequency in the western region, has been observed since 1951 (Jovanovic et al., 2013; McGree et al., 2016, 2019).
Over the western Indian Ocean significant warming trends have been reported for Mauritius (1.2°C during 1951–2016; MESDDBM, 2016), La Réunion (0.18°C per decade over 1968–2019; Météo-France, 2020) and Maldives (MEE, 2016). Both Mauritius and La Réunion have experienced rainfall decreases of 8% during 1951–2016 and 1.2% per decade during 1961–2019 with generally weak, non-significant rainfall trends during 1967–2012.
Assessing observed climate change for Small Islands is often constrained by low station density (Ryu and Hayhoe, 2014; P.D. Jones et al., 2016 a), digitization requirements or data-sharing limitations (P.D. Jones et al., 2016 a). Station data typically have longer temporal coverage relative to satellite products but are limited in spatial coverage (Cavazos et al., 2020). For Small Island nations, spatial gaps between observations can be very large due to the isolation of the islands (Wright et al., 2016). Additionally, over past decades, the number of station observations has declined substantially in Mauritius (Dhurmea et al., 2019), Hawai’i (Bassiouni and Oki, 2013; Frazier and Giambelluca, 2017) and most Pacific Island countries since the 1980s (Jones et al., 2013; McGree et al., 2014, 2016). In Fiji, meteorological stations were located on or by the coast and are sparse in the interior (Kumar et al., 2013). Notable topography and land use may result in changes in climatic conditions over small distances (Foley, 2018), making the observational density particularly relevant.
Moreover, many stations have little metadata available, including those in Vanuatu, the Solomon Islands and Papua New Guinea (Whan et al., 2014). Compared to earlier decades, few metadata are currently being documented in the western Pacific islands (McGree et al., 2014), which will challenge the homogenization of long-term observational records. Challenges in the Caribbean include maintaining continuous daily time series with metadata, converting climatological data into digital formats and making them freely available (Stephenson et al., 2014; Beharry et al., 2015; P.D. Jones et al., 2016 a). This is also an issue in the Pacific as many data are kept in national (local) databases, with only a fraction having been incorporated into global datasets (Whan et al., 2014).
Because of the small number of stations used for interpolation and the complex mountainous topography, gridded product for these small islands should be interpreted with caution (Frazier and Giambelluca, 2017). For the Antilles, the error in estimating CRU2.0 monthly precipitation can stand locally between 20% and 40%. Over the Caribbean, Cavazos et al. (2020) found a discrepancy across gridded observational datasets (CRU, CHIRPS and GPCP) in detecting orographicprecipitation, especially during boreal summer, making their use in climate model evaluation challenging (Herrera and Ault, 2017). Furthermore, some reanalysis products such as the 0.7° × 0.7° ERA-Interim reanalysis are not adequate as many of the smaller Caribbean islands are not represented as land (P.D. Jones et al., 2016 a).
Atlas.10.3 Assessment of Model Performance
An assessment of model performance for the Caribbean region is contained in Atlas.7.1 on Central America. In summary, the ability of climate models to simulate the climate over the region has improved in many key respects with the application of increased model resolution and a better representation of the land surface processes of particular importance in these advances (high confidence). Regional climate models (RCMs) simulate realistically seasonal surface temperature and precipitation patterns including the bimodal rainfall in the precipitation annual cycle although with some timing biases in some regions (high confidence). The important regional circulation and precipitation features, the Caribbean low-level jet and the midsummer drought (MSD), are well represented over a variety of RCM domains covering the region (high confidence).
Over the tropical Pacific, surface temperature biases in CMIP6 models remain similar to those in CMIP5, although are reduced in the higher-resolution models in the HiResMIP ensemble. CMIP6 models generally represent trends in sea surface temperatures better than CMIP5 (see Section 9.2.1 for more details). For precipitation, the persistent tropical Pacific bias of the double ITCZ (erroneous bands of excessive rainfall both sides of the equatorial Pacific) is still present in CMIP6 models although is slightly improved compared to those in CMIP3 and CMIP5 models (Section 3.3.2.3). Application of downscaling techniques (RCMs and stretched-grid GCMs) using resolutions finer than 10 km over the Pacific can capture topographic influences on wind and rainfall to generate realistic simulations of island climates – for example over Fiji and New Caledonia (Chattopadhyay and Katzfey, 2015; Dutheil et al., 2019). In both cases applying bias adjustment to the sea surface temperatures used as a lower boundary condition for the downscaling models was important to generate realistic simulations.
Atlas.10.4 Assessment and Synthesis of Projections
Projected median temperature increases for Small Islands from the CMIP5 ensemble range from 1°C (RCP4.5) to 1.5°C (RCP8.5) in the period 2046–2065, and from 1.3°C (RCP4.5) to 2.8°C (RCP8.5) by 2081–2100 relative to 1986–2005 (Harter et al., 2015). Spatial variations in the warming trend are projected to increase by the end of the 21st century, with relatively higher increases in the Arctic and sub-Arctic islands, and in the equatorial regions compared with islands in the Southern Ocean (Harter et al., 2015). In the western Pacific, temperatures are projected to increase by 2.0°C–4.5°C by the end of the 21st century relative to 1961–1990 (Wang et al., 2016). The warming over land in the Lesser Antilles is estimated to be about 1.6°C (3.0°C) by 2071–2100 for the RCP4.5 (RCP8.5) scenario, relative to 1971–2000 (Cantet et al., 2014). Projections from the CMIP6 ensemble support these findings (Figure Atlas.28) and across global warming levels from 1.5°C to 4°C CMIP5 and CMIP6 consistently project lower levels of warming for Small Islands than the global average (Interactive Atlas).
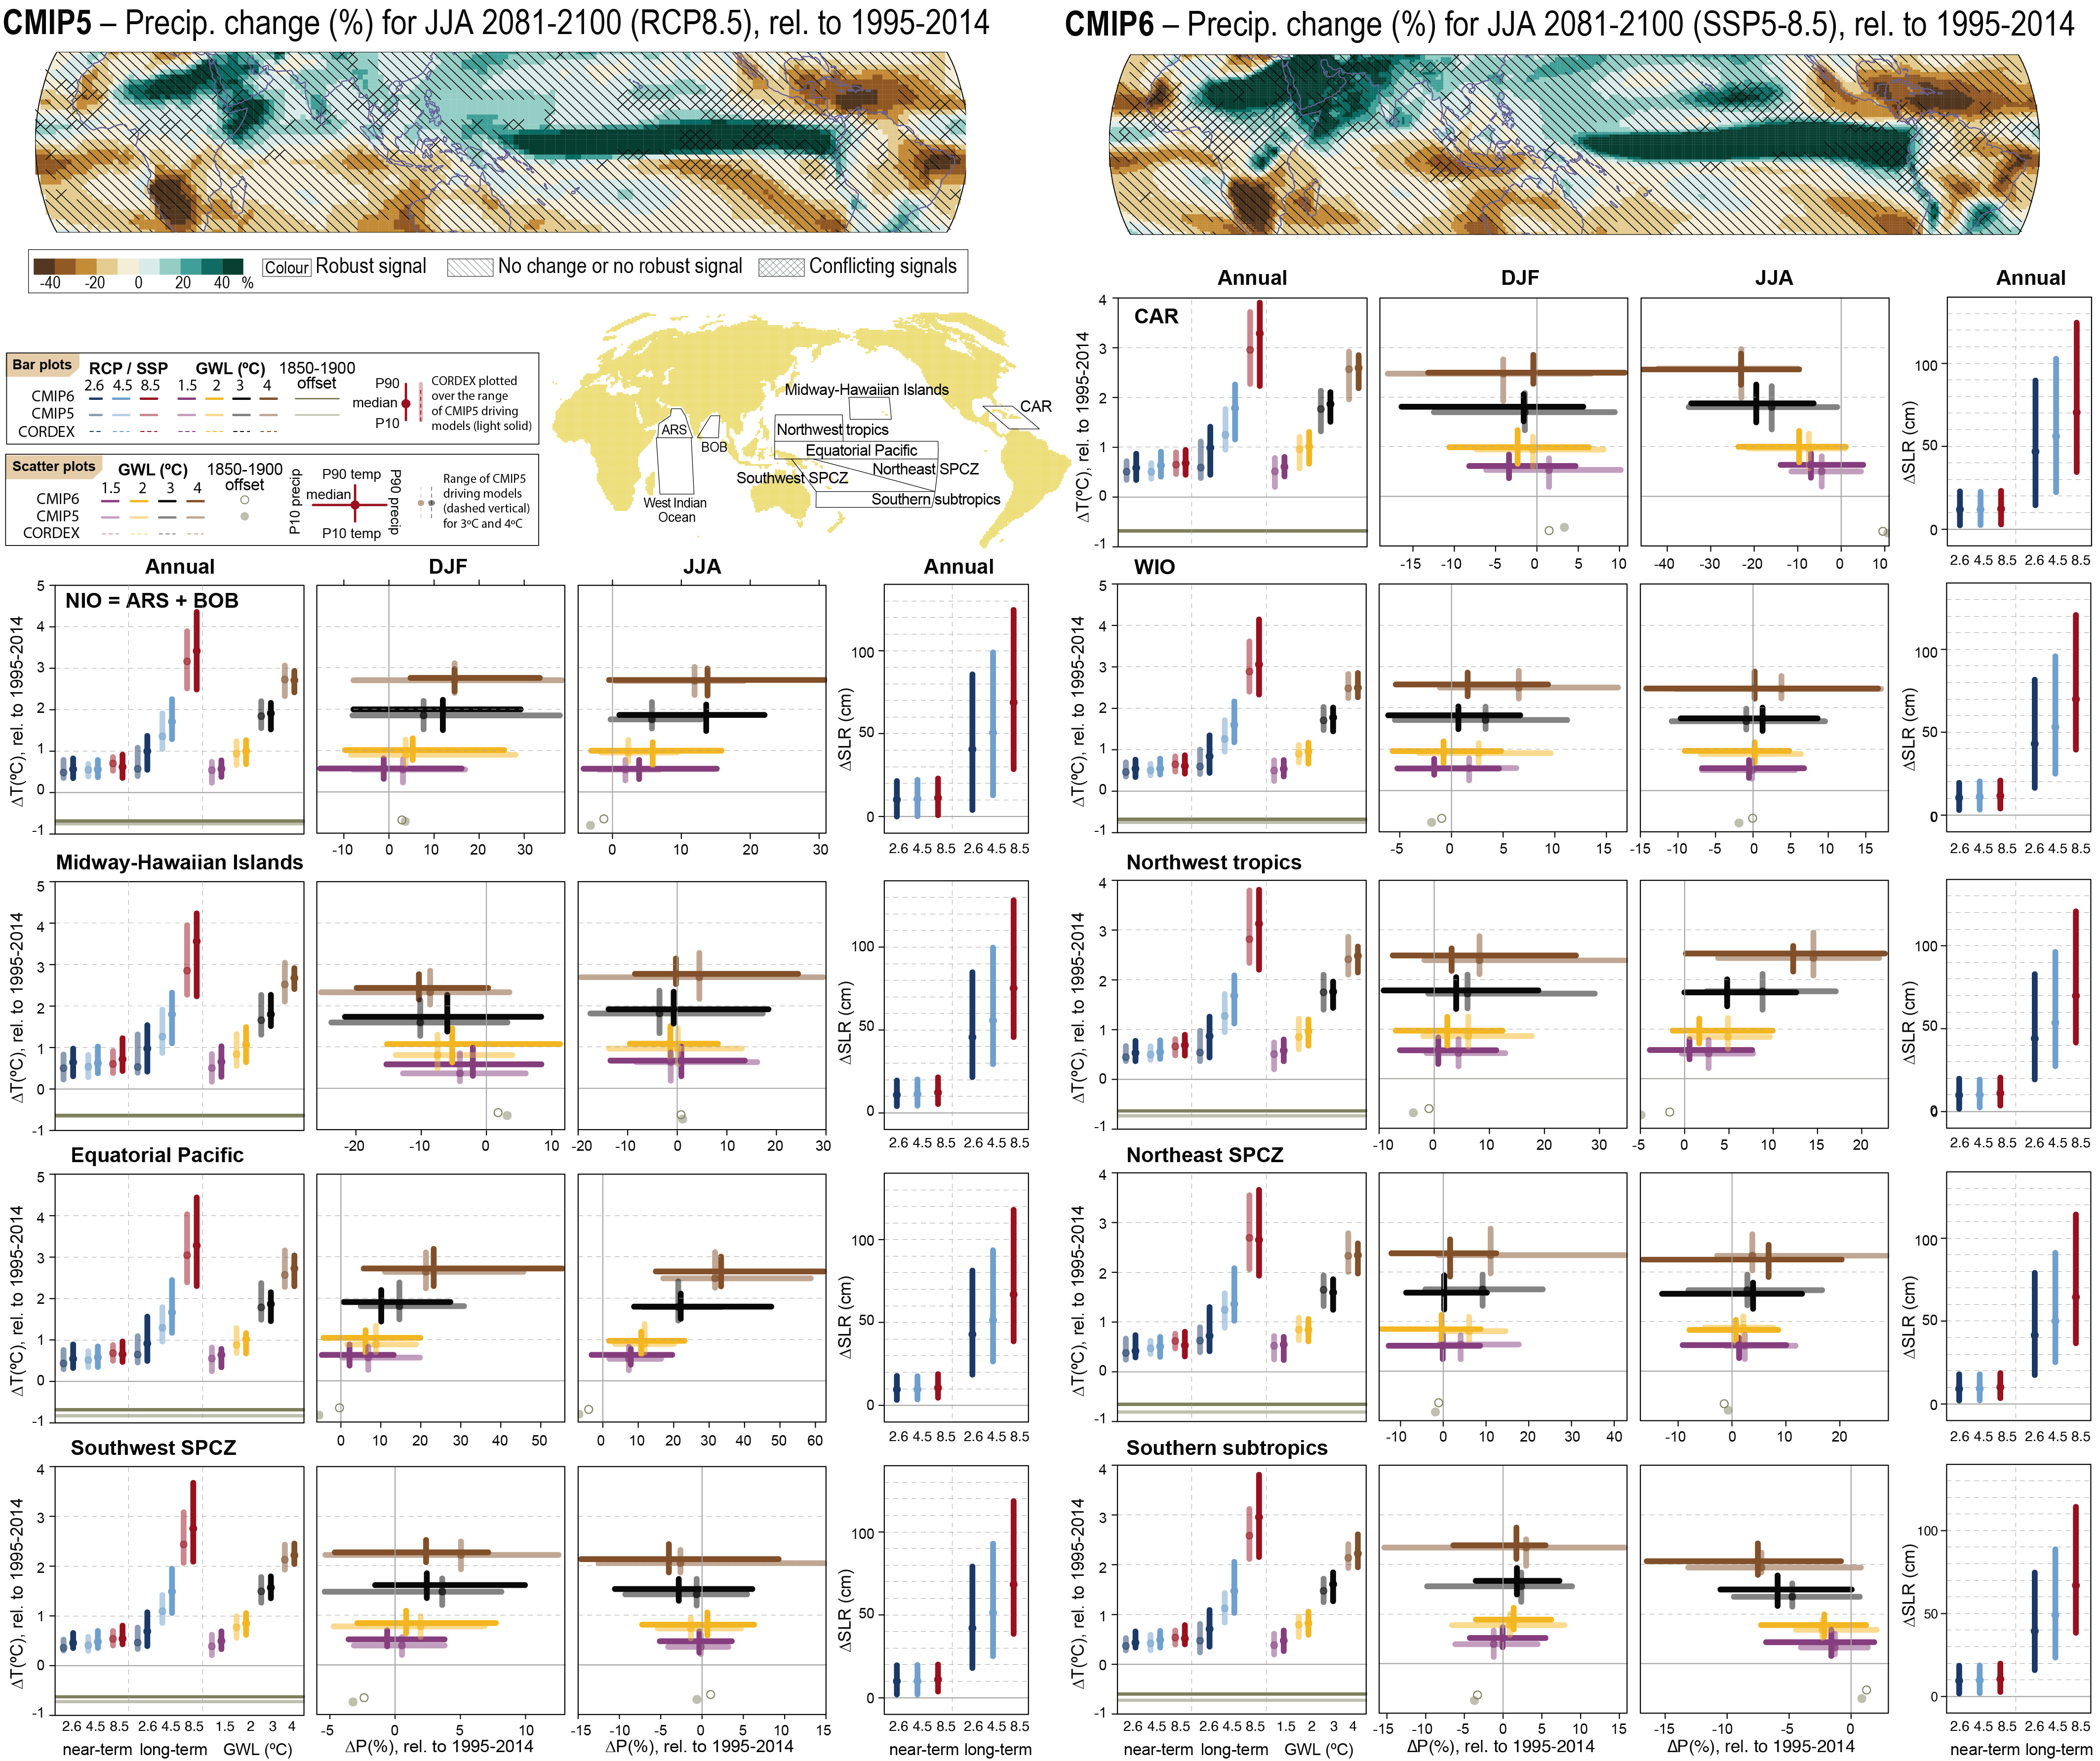 Figure Atlas.28 | Regional mean changes in annual mean surface air temperature, precipitation and sea level rise relative to the 1995–2014 baseline for the reference regions in the Small Islands (warming since the 1850–1900 pre-industrial baseline is also provided as an offset). Maps on the top show global June–July–August (JJA) precipitation changes (%, relative to 1995–2014) projected for 2081–2100 under RCP8.5 (left) and SSP5-8.5 (right) for the CMIP5 and CMIP6 ensembles, respectively. Bar plots in the left panel of each region triplet show the median (dots) and 10th–90th percentile range (bars) across each model ensemble for annual mean temperature changes for four datasets (CMIP5 in intermediate colours; a subset of CMIP5 used to drive CORDEX in light colours; CORDEX overlying the CMIP5 subset with dashed bars; and CMIP6 in solid colours); the first six groups of bars represent the regional warming over two time periods (near-term 2021–2040 and long-term 2081–2100) for three scenarios (SSP1-2.6/RCP2.6, SSP2-4.5/RCP4.5 and SSP5-8.5/RCP8.5), and the remaining bars correspond to four global warming levels (GWLs: 1.5°C, 2°C, 3°C and 4°C). Bar plots in the right panel show the median (dots) and 5th–95th percentile range (bars) sea level rise from the CMIP6 ensemble (see Chapter 9 for details) for the same time periods and scenarios. The scatter diagrams of temperature against precipitation changes display the median (dots) and 10th–90th percentile ranges for the above four warming levels for December–January–February (DJF; middle panel) and June–July–August (JJA; right panel), respectively; for the CMIP5 subset only the percentile range of temperature is shown, and only for 3°C and 4°C GWLs. Changes are absolute for temperature (in °C) and relative (as %) for precipitation. See Atlas.1.3 for more details on reference regions (Iturbide et al., 2020) and Atlas.1.4 for details on model data selection and processing. The script used to generate this figure is available online (Iturbide et al., 2021) and similar results can be generated in the Interactive Atlas for flexibly defined seasonal periods. Further details on data sources and processing are available in the chapter data table (Table Atlas.SM.15).
 The CMIP5 ensemble median projected precipitation decreases of up to –16% over the Caribbean, parts of the Atlantic and Indian oceans, and the southern subtropical and eastern Pacific Ocean, and increases of up to 10% over parts of the western Pacific and Southern oceans, and up to 55% in the equatorial Pacific Islands under RCP6.0 in the period 2081–2100 relative to 1986–2005 (Harter et al., 2015). A projected decrease in annual precipitation is also noted over the Lesser Antilles under the RCP4.5 and RCP8.5 scenarios (Cantet et al., 2014). Seasonal rainfall is projected to decrease in most areas in Hawaii, except for the climatically wet windward side of the mountains, which would increase the wet to dry gradient over the area (Timm et al., 2015). The average precipitation changes in Hawaii are estimated to be about –11% to –28% under RCP4.5 during the wet season, and about –4% to –28% under RCP4.5 during the dry season in the period 2041–2071 relative to 1975–2005, with larger changes under RCP8.5 (Timm et al., 2015). There are still uncertainties in the projected changes, which have been attributed to factors including insufficient model skill in representing topography in the small islands, and high variability in climate drivers. However, the broad-scale pattern of projected wetter conditions in the western and equatorial Pacific, and the north Indian and Southern oceans, and of drier conditions over the Caribbean, and in parts of the Atlantic, Indian and southern subtropical and eastern Pacific oceans are further strengthened in the CMIP6 ensemble (Figure Atlas.28), which are thus likely regional responses as the climate continues to warm.
The negative trend in future summer rainfall in the Caribbean and Central America is projected to be strongest during midsummer (June–August) based on studies using GCMs (Rauscher et al., 2008; Karmalkar et al., 2013; Karmacharya et al., 2017a; Taylor et al., 2018). The future summer drying over the Caribbean is associated with a projected future strengthening of the Caribbean low-level jet (Taylor et al., 2013a). Rauscher et al. (2008) hypothesized that the simulated 21st-century drying over Central America represents an early onset and intensification of the MSD. The westward expansion and intensification of the NASH associated with the MSD occurs earlier with stronger low-level easterlies. Rauscher et al. (2008) further suggested that the eastern Pacific ITCZ is also located further southward and that there are some indications that these changes could be forced by ENSO-like warming of the tropical eastern Pacific and increased land-ocean heating contrasts over the North American continent. Other studies also suggest a future intensification of the NASH due to changes in land-sea temperature contrast resulting from increased greenhouse-gas concentrations (W. Li et al., 2012 ).
Atlas.10.5 Summary
It is very likely that all Small Island regions have warmed with significant trends recorded from at least the 1960s in all territories or nations. Trends include increases of 0.15°C–0.18°C per decade in the tropical western Pacific (1953–2011), significant warming over the Caribbean (1901–2010) with trends of 0.19°C (0.28°C) per decade in daily maximum (minimum temperatures) (1961–2010) and in La Réunion of 0.18°C per decade (1968–2019). There are fewer significant trends in precipitation in these regions though several locations in the Caribbean have detectable decreasing trends (high confidence), in part attributable to anthropogenic forcing (limited evidence). Also, it is likely that drying has occurred since the mid-20th century in some parts of the western Indian Ocean, and in the Pacific poleward of 20° latitude in both the northern and southern hemispheres.
It is very likely that Small Island regions will continue to warm in the coming decades at a level slightly lower than the global mean. Small Island regions in the western and Equatorial Pacific, north Indian and Southern oceans are likely to be wetter in the future; and those in the Caribbean, parts of the Atlantic and west Indian oceans, and the southern subtropical and eastern Pacific Ocean drier.
Cross-Chapter Box Atlas.2 | Climate information relevant to water resources in Small Islands
Coordinators: Tannecia Stephenson (Jamaica), Faye Abigail Cruz (The Philippines)
Contributors: Donovan Campbell (Jamaica), Subimal Ghosh (India), Rafiq Hamdi (Belgium), Mark Hemer (Australia), Richard G. Jones (United Kingdom), James Kossin (United States of America), Simon McGree (Australia/Fiji), Blair Trewin (Australia), Sergio M. Vicente-Serrano (Spain)
Constructing regional climate information for Small Islands involves synthesis from multiple sources. This cross-chapter box presents information relevant to water resources, drawing on several chapters in AR6 and Atlas.10. It introduces the context and current evidence base followed by an assessment of trends and projections in rainfall, temperature and sea levels across Small Islands and it highlights key findings.
Cross-Chapter Box Atlas.2
Regional context
Small Islands are predominantly located in the Pacific, Atlantic and Indian oceans, and in the Caribbean (Nurse et al., 2014; Shultz et al., 2019). They are characterized by their small physical size, being surrounded by large ocean expanses, vulnerability to natural disasters and extreme events, and relative isolation (Section 12.4.7, Atlas.10 and Glossary; Nurse et al., 2014). These and nearby larger islands (e.g., Madagascar and Cuba) are often water-scarce with low water volumes due to increasing demand (from population growth and tourism), aging and poorly designed infrastructure (Burns, 2002), and decreasing supply (from pollution, changes in precipitation patterns, drought, saltwater intrusion, regional sea level rise, inadequate water governance (Belmar et al., 2016; Mycoo, 2018) and competing and conflicting uses (Section 8.1.1.1; Cashman, 2014; Gheuens et al., 2019). In the Caribbean, groundwater is the main freshwater source and depends strongly on rainfall variability (Post et al., 2018), while rain, ground or surface water are the primary sources for the Pacific Islands depending on island type (volcanic or atoll), size and quality of groundwater reserves (Burns, 2002). Groundwater pumping and increasing sea levels also affect water availability by increasing the salinity of the aquifer (e.g., Bailey et al., 2015, 2016), thus reinforcing negative drought effects from reduced rainfall and increased evaporative demand from higher temperatures. For example, in 54% of the Marshall Islands, groundwater is highly vulnerable to droughts (Barkey and Bailey, 2017).
The climate of Small Islands and findings from previous IPCC assessments
Intra-seasonal to interannual rainfall in the Caribbean and in the Indian and Pacific oceans is influenced by the trade winds, the passage of tropical cyclones (TCs), Madden–Julian Oscillation (MJO), easterly waves, migrations of the Inter-tropical Convergence Zone (ITCZ) and the North Atlantic Subtropical High (NASH) for the Caribbean; the South Pacific Convergence Zone (SPCZ) and western North Pacific summer monsoon for the Pacific; and the South Asian monsoons for the Indian Ocean. The relevant dominant modes of climate variability (Section 8.3.2.9 and Annex IV) are El Niño–Southern Oscillation (ENSO) and the Indian Ocean Dipole (IOD) which have been associated with extreme events in the islands (Annex IV; Stephenson et al., 2014; Kruk et al., 2015; Frazier et al., 2018). The modes of climate variability are modulated by Pacific Decadal Variability (PDV), Inter-decadal Pacific Oscillation (IPO) and Atlantic Multi-decadal Variability (AMV). These modes show no sustained trend since the late 19th century (high confidence) (Section 2.4).
The AR5 WGI reports observed temperature increases of 0.1°C–0.2°C per decade in the Pacific Islands with these trends very likely to continue under high emissions, and projects a drier rainy season for many islands in the south-west Pacific (Christensen et al., 2013). The AR5 WGII reports rainfall reductions over the Caribbean, increases over the Seychelles, streamflow reductions over the Hawaiian Islands and saltwater intrusion into groundwater reserves in the Pacific Islands resulting from storm surges and high tides (Nurse et al., 2014). The SROCC (IPCC, 2019a) finds very high confidence that global mean sea level rise has accelerated in recent decades which has exacerbated extreme sea level events and flooding (high confidence). It will continue to rise with consequent increases in extreme levels so that the historical one-in-a-century extreme local sea level will become an annual event by the end of the century under all RCP scenarios (high confidence). In particular, many Small Islands are projected to experience historical centennial events at least annually by 2050 under RCP2.6, RCP4.5 and RCP8.5 emissions. The proportion of Category 4 and 5 TCs and associated precipitation rates along with their average intensity are projected to increase with a 2°C global temperature rise which will further increase the magnitude of resultant storm surges and flooding. The SROCC Cross-Chapter Box on Low-lying Islands and Coasts (Magnan et al., 2019) focused on sea level rise and oceanic changes and their impacts, therefore the assessment presented here on climate changes relevant to water resources, including precipitation and temperature, is complementary.
Observations and attribution of changes
Cross-Chapter Box Atlas.2: presents an overview of observed sub-regional trends relevant to water resources in some Small Islands and island regions largely from 1951. Some general observed climate trends include higher magnitude and frequency of temperatures including warm extremes (high confidence) (Section 12.4.7.1, Table 11.13 and Atlas.10.2), declines in high-intensity rainfall events (low to medium confidence) (Table 11.14), regional sea level rises with strong storm surges and waves resulting in increased coastal flood intensity (high confidence) (Section 12.4.7.4 and Atlas.10.2), and increased intensity and intensification rates of tropical cyclones at global scale (medium confidence) (Sections 11.7.1.2 and 12.4.7.3) and ocean acidification (virtually certain) (Chapters 2, 6 and 9, and Atlas.3.2).
No significant long-term trends are observed for annual Caribbean rainfall over the 20th century (low confidence) (Atlas.10.2). Over the western Pacific, generally decreasing but non-significant trends are noted in annual total rainfall from 1961 to 2011 (low confidence) (Atlas.10.2). June–July–August (JJA) rainfall over the Caribbean shows some drying tendencies that may be linked to the combined effect of warm ENSO events and a positive NAO phase (Giannini et al., 2000; Méndez-Lázaro et al., 2014; Fernandes et al., 2015), or to warm ENSO events and a positive PDV (Maldonado et al., 2016). However, the work of Herrera et al. (2018) suggests that anthropogenic influences may also be possible, although mechanisms proposed to date have not decoupled the influence of anthropogenic trends from natural decadal variability (Vecchi et al., 2006; Vecchi and Soden, 2007; DiNezio et al., 2009).
Cross-Chapter Box Atlas.2
Cross-Chapter Box Atlas.2, Table1 | Summary of observed trends for Small Island regions. SLR = sea level rise; TC = tropical cyclone; SPCZ = South Pacific Convergence Zone.
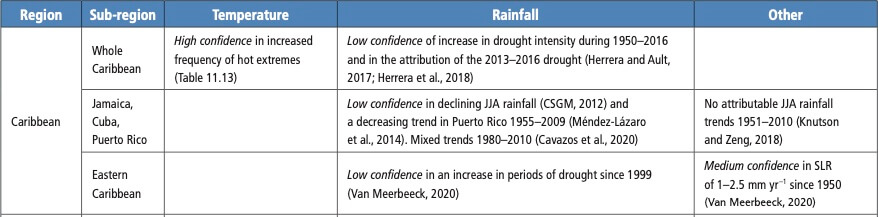
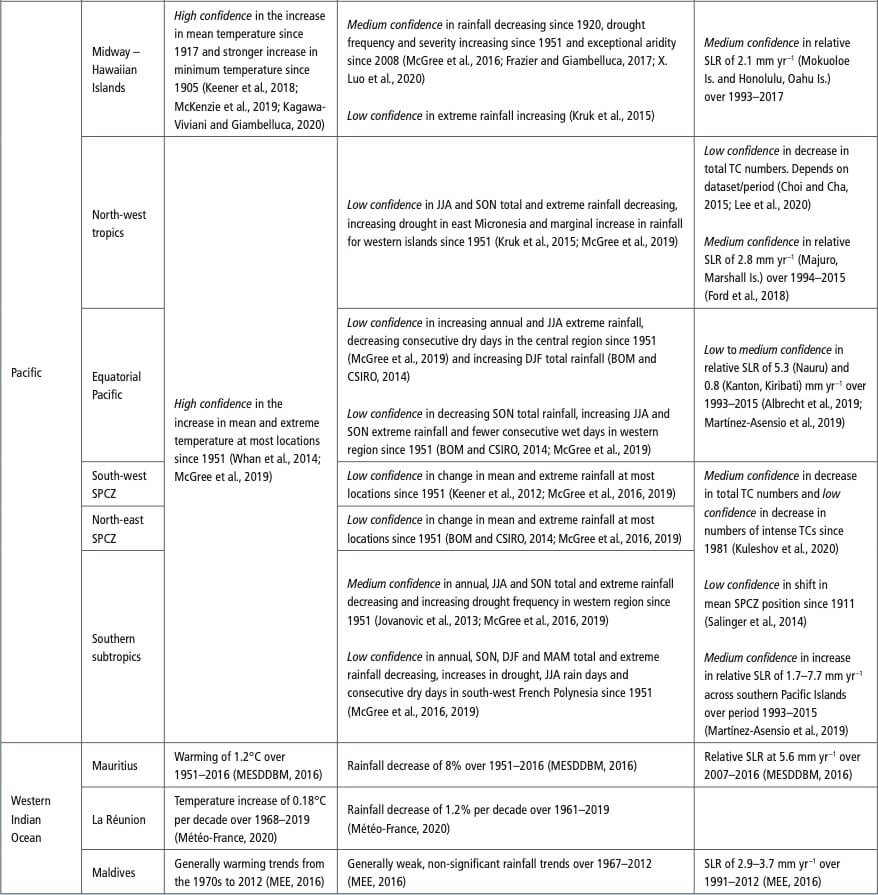
Cross-Chapter Box Atlas.2
Southern Hemisphere subtropical Pacific June–November drying has been associated with intensification of the subtropical ridge and associated declines in baroclinicity (Whan et al., 2014). Austral summer drying in the south-west French Polynesia sub-region has been linked with increased greenhouse gas and ozone changes (Fyfe et al., 2012). The Southern Hemisphere jet stream has likely shifted polewards (Section 2.3.1.4.3) which is attributed largely to a trend in the Southern Annular Mode (Section 3.7.2).
These assessments are constrained by limited availability of observational datasets and of scientific studies. Assessment of observed climate change for Small Islands is often constrained by low station density (Ryu and Hayhoe, 2014; P.D. Jones et al., 2016 a), short periods of record, digitization requirements or data-sharing limitations (P.D. Jones et al., 2016 a), availability of metadata (McGree et al., 2014; Stephenson et al., 2014; P.D. Jones et al., 2016 b), challenges in some gridded product representations of variability, for example, for complex topography (Frazier and Giambelluca, 2017), and challenges characterizing the impact of vertical land motion on sea level rise (Atlas.10.2; Wöppelmann and Marcos, 2016).
Information on future climate changes
Small Islands will very likely continue to warm this century, though at a rate less than the global average (Figure Atlas.28), with consequent increased frequency of warm extremes for the Caribbean and western Pacific islands, and heatwave events for the Caribbean (high confidence) (Table 11.13). Annual and JJA rainfall declines are likely for some Indian and southern Pacific ocean regions with drying over southern French Polynesia (attributed partially to greenhouse gas increases) and farther east clearly evident in CMIP5 and CMIP6 projections (high confidence) (Figure Atlas.28). See also Section Atlas.10.4.
Rainfall is very likely to decline over the Caribbean, in the annual mean and especially in JJA, with a stronger and more coherent signal in CMIP6 compared to CMIP5 (Figure Atlas.28 and Interactive Atlas) and reductions of 20–30% by the end of the century under high future emissions (SSP5-8.5). This JJA drying has been linked to a future strengthening of the Caribbean low level jet (CLLJ) (Taylor et al., 2013a), a westward expansion and intensification of the NASH, stronger low-level easterlies over the region, a southwardly-placed eastern Pacific ITCZ (Rauscher et al., 2008), and changing dynamics due to increased greenhouse gas concentrations (very high confidence) (W. Li et al., 2012 ). Projections from 15 GCM and two RCM experiments for 2080–2089 relative to 1970–1989 were for a generally drier Caribbean and a robust summer drying (Karmalkar et al., 2013). More recent downscaling studies (e.g., Taylor et al., 2018; Vichot-Llano et al., 2021a) also project a drier Caribbean and longer dry spells (Van Meerbeeck, 2020).
Sea level rise is very likely to continue in all Small Island regions (Sections 9.6.3.3 and 12.4.7.4, and Figure Atlas.28) and its effects will be compounded by TC surge events. In general, the most intense TCs are likely to intensify and produce more flood rains with warming, however detailed effects of climate change on TCs will vary by region (Section 11.7.1; Knutson et al., 2019). Bailey et al. (2016) projected a 20% decline in groundwater availability by 2050 in coral atoll islands of the Federated States of Micronesia and stressed that under higher sea level rises the decrease could be higher than 50% due to marine water intrusion into aquifers, as well as drought events.
Summary of information distilled from multiple lines of evidence
It is very likely that most Small Islands have warmed over the period of instrumental records. The clearest precipitation trend is a likely decrease in JJA rainfall over the Caribbean since 1950. There is limited evidence and low agreement for the cause of the observed drying trend, whether it is mainly caused by decadal-scale internal variability or anthropogenic forcing, but it is likely that it will continue over coming decades. It is likely that drying has occurred since the mid-20th century in some parts of the Pacific poleward of 20° latitude in both the Northern Hemisphere and the Southern Hemisphere and that these changes will continue over coming decades. Rainfall trends in most other Pacific Ocean and Indian Ocean Small Islands are mixed and largely non-significant. It is very likely that sea levels will continue to rise in all Small Island regions, and this will result in increased coastal flooding with the potential to increase saltwater intrusion into aquifers in Small Islands.
Whilst this assessment demonstrates that the climate of Small Islands has and will continue to change in diverse ways, constructing climate information for Small Islands is challenging. This is due to observational issues, incomplete understanding of some modes of variability and their representation by climate models and the lack of availability of large ensembles of regional climate model simulations and limited studies to decouple internal variability and anthropogenic influences.
Atlas.11 Polar Regions
The assessment in this section focuses on changes in average temperature, precipitation (rainfall and snow) and surface mass balance over the polar regions, Antarctica and the Arctic, including the most recent years of observations, updates to observed datasets, the consideration of recent studies using CMIP5 simulations and those using CMIP6 and CORDEX simulations. Findings are presented for West Antarctica (WAN) and East Antarctica (EAN), and three Arctic regions: Arctic Ocean (ARO), Greenland/Iceland (GIC) and Russian Arctic (RAR; Figure Atlas.29) with some reference also to North-Eastern North America (NEN), North-Western North America (NWN) and Northern Europe (NEU), which are covered more extensively in Atlas.9 and Atlas.8 respectively. Sub-regional changes are discussed when relevant, for example the Antarctic Peninsula (AP) as a sub-region of WAN. The Southern Ocean (SOO) region is assessed in Chapter 9 with changes in climatic impact-drivers assessed in Chapter 12 (Section 12.4.9 and Table 12.11) and some extremes in Chapter 11 (Tables 11.7–9 for RAR). Chapter 9 provides an overall assessment of the ice-sheet processes and changes, as part of the cryosphere, ocean and sea level change assessment.
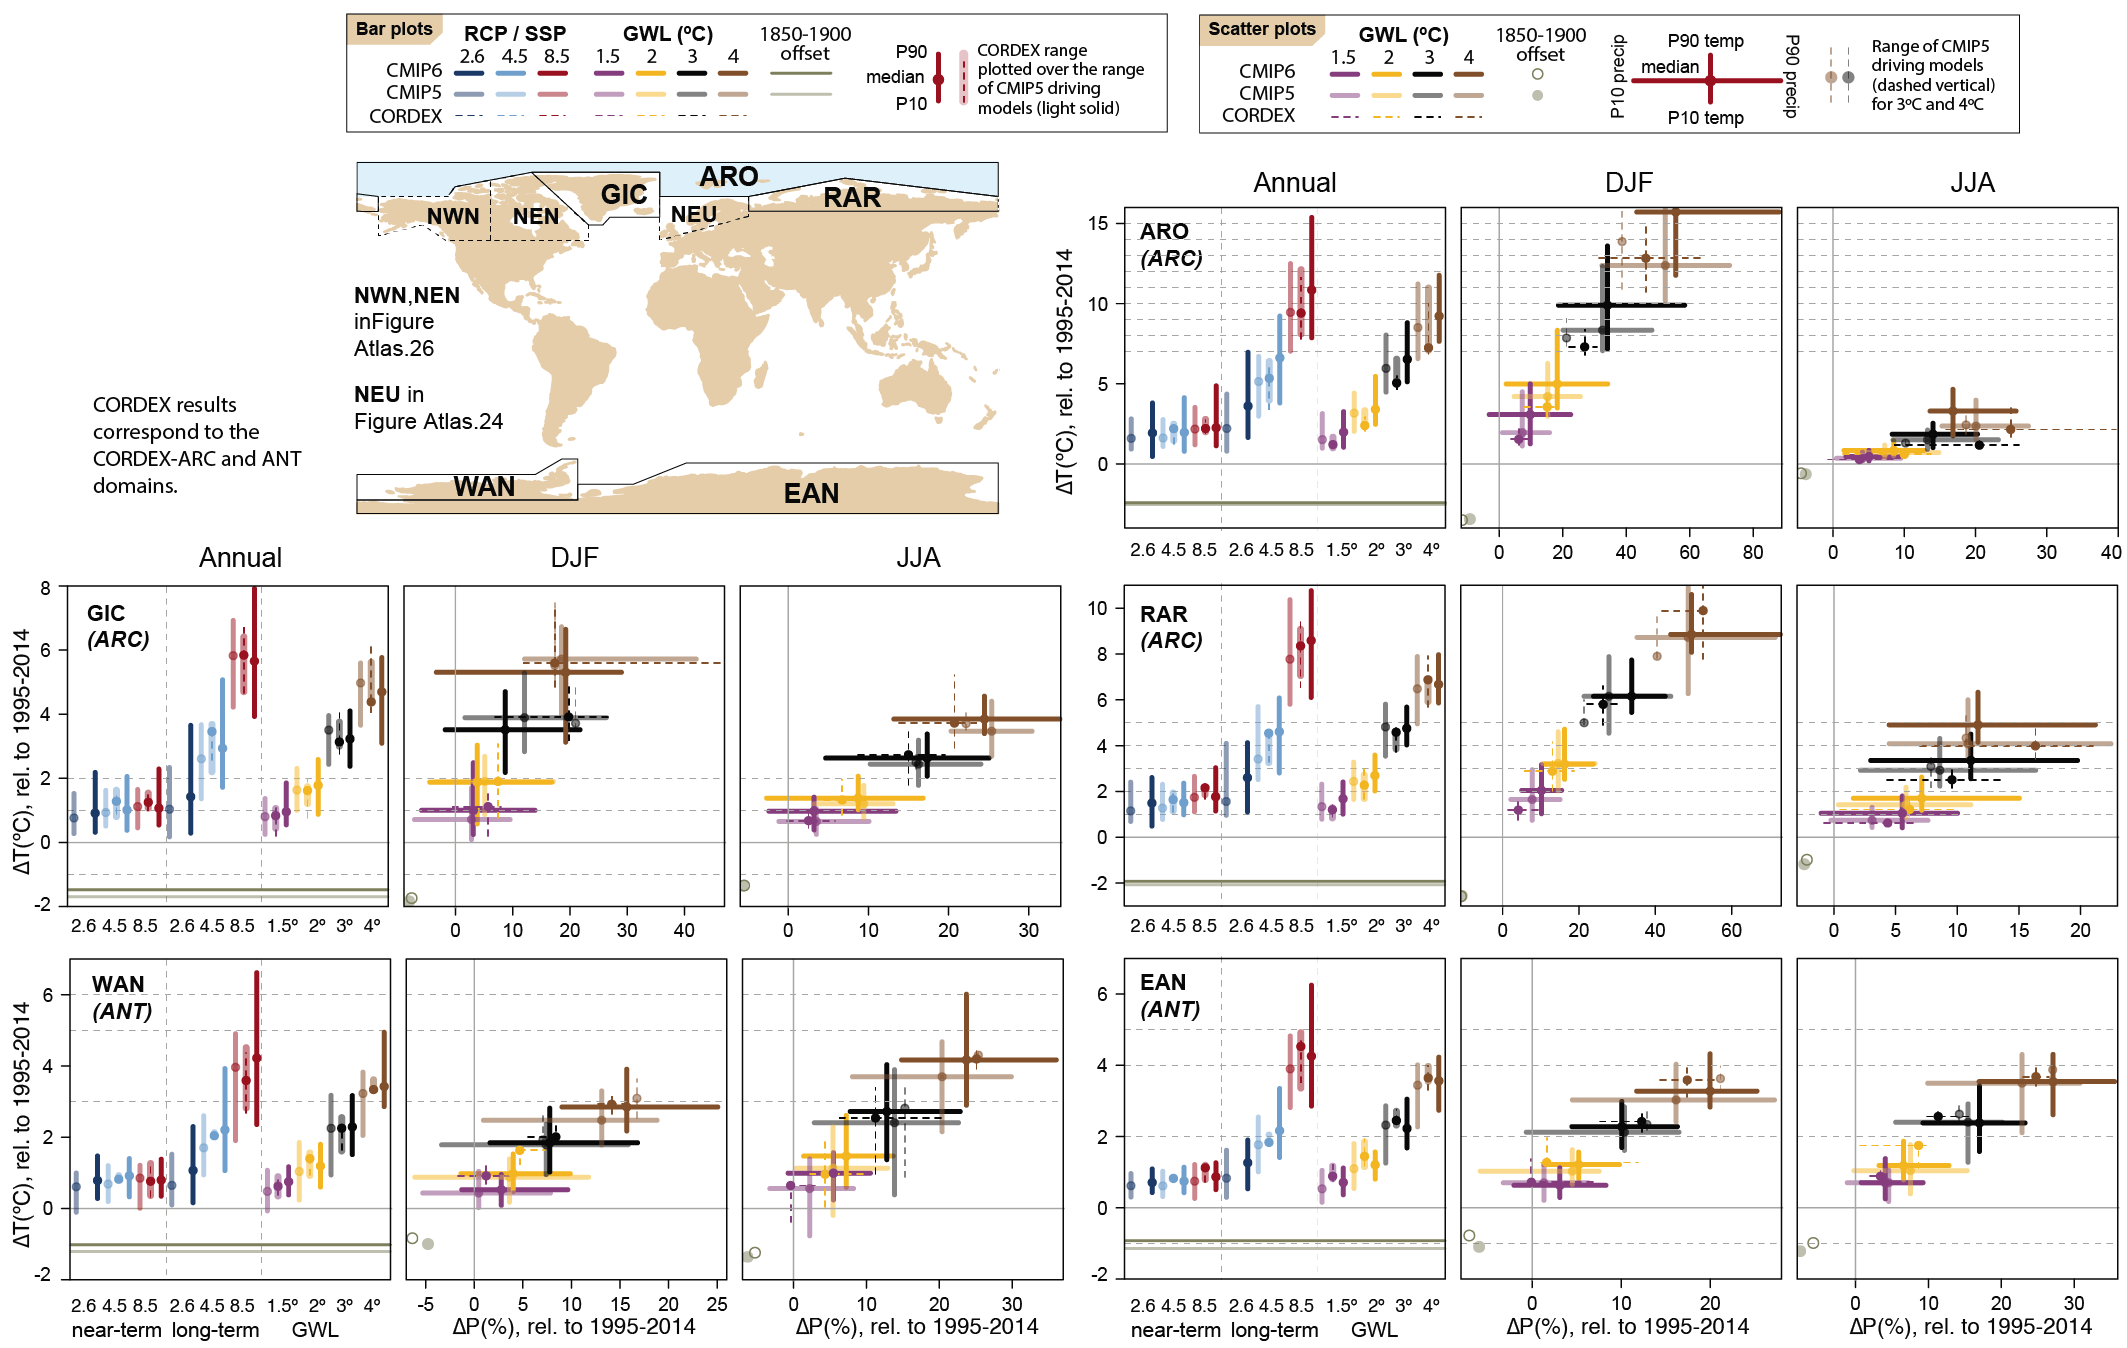 Figure Atlas.29 | Regional changes over land (except for ARO) in annual mean surface air temperature and precipitation relative to the 1995–2014 baseline for the reference regions in Arctic and Antarctica (warming since the 1850–1900 pre-industrial baseline is also provided as an offset). Bar plots in the left panel of each region triplet show the median (dots) and 10th–90th percentile range (bars) across each model ensemble for annual mean temperature changes for four datasets (CMIP5 in intermediate colours; a subset of CMIP5 used to drive CORDEX in light colours; CORDEX overlying the CMIP5 subset with dashed bars; and CMIP6 in solid colours); the first six groups of bars represent the regional warming over two time periods (near-term 2021–2040 and long-term 2081–2100) for three scenarios (SSP1-2.6/RCP2.6, SSP2-4.5/RCP4.5 and SSP5-8.5/RCP8.5), and the remaining bars correspond to four global warming levels (GWLs: 1.5°C, 2°C, 3°C and 4°C). The scatter diagrams of temperature against precipitation changes display the median (dots) and 10th–90th percentile ranges for the above four warming levels for December–January–February (DJF; middle panel) and June–July–August (JJA; right panel), respectively; for the CMIP5 subset only the percentile range of temperature is shown, and only for 3°C and 4°C GWLs. Changes are absolute for temperature (in °C) and relative (as %) for precipitation. See Atlas.1.3 for more details on reference regions (Iturbide et al., 2020) and Atlas.1.4 for details on model data selection and processing. The script used to generate this figure is available online (Iturbide et al., 2021) and similar results can be generated in the Interactive Atlas for flexibly defined seasonal periods. Further details on data sources and processing are available in the chapter data table (Table Atlas.SM.15).
 Atlas.11.1 Antarctica
Atlas.11.1.1 Key Features of the Regional Climate and Findings From Previous IPCC Assessments
Atlas.11.1.1.1 Key Features of the Regional Climate
The Antarctic region, covered by an ice sheet and surrounded by the Southern Ocean, is characterized by polar climate. It is the coldest, windiest and driest continent on Earth and plays a pivotal role in regulating the global climate and hydrological cycle. Antarctica has a mean temperature of –35°C (Lenaerts et al., 2016) and receives 171 mm yr–1 water equivalent of snowfall (north of 82°S, estimate based on satellite measurements during 2006–2011; Palerme et al., 2014). Precipitation in Antarctica occurs mostly in the form of snowfall and diamond dust, with sporadic coastal rainfall during the summer over the Antarctic Peninsula and sub-Antarctic islands. Drizzle events sometimes occur during warm air intrusions (Nicolas et al., 2017) at relatively low temperatures (Silber et al., 2019). Precipitation constitutes the largest component of the surface mass balance (SMB), which also includes sublimation (from the surface or drifting snow), meltwater runoff and redistribution by wind (Lenaerts et al., 2019). SMB can be considered as a proxy of precipitation if averaged over an annual cycle (Gorodetskaya et al., 2015; Bracegirdle et al., 2019). Precipitation and SMB exhibit spatial and temporal variability controlled by atmospheric large-scale low-pressure systems and moisture advection from lower latitudes. SMB is an important component of the total ice-sheet mass balance (Section 9.4.2.1). The Antarctic contribution to sea level results from the imbalance between net snow accumulation and ice discharge into the ocean (Box 9.1). Ice shelves buttress the ice sheet and are influenced by oceanic and atmospheric drivers (Box 9.1).
Antarctic climate variability is influenced by the Southern Annular Mode (SAM) and regionally by other modes, including ENSO, Pacific–South American pattern, Pacific Decadal Variability (PDV), Indian Ocean Dipole and Zonal Wave 3 (Annex IV). Climate change in Antarctica and the Southern Ocean is influenced by interactions between the ice sheet, ocean, sea ice and atmosphere (Sections 9.2.3.2, 9.3.2 and 9.4.2; Meredith et al., 2019). In addition to Chapter 9, Antarctica is discussed across the report: global climate links (Chapters 2 and 10), attribution (Chapter 3), global water cycle (Chapter 8), extremes (Chapter 11), and climatic impact-drivers (Chapter 12).
Atlas.11.1.1.2 Findings From previous IPCC Assessments
The AR5 (Vaughan et al., 2013) reported warming over Antarctica since the 1950s, mostly over the AP and WAN, attributed to the positive trend in the SAM. These trends in the Antarctic temperature were given low confidence due to substantial multi-annual to multi-decadal variability, as well as uncertainties in magnitude and spatial trend structure. The AR5 reported low confidence that anthropogenic forcing has contributed to the temperature change in Antarctica. The AR5 highlighted a large interannual variability in snow accumulation with no significant trend since 1979 around Antarctica, and high confidence in the overall mass loss from Antarctica, accelerated since the 1990s.
In this and the following paragraphs, findings are from SROCC (Meredith et al., 2019) unless otherwise stated. Warming trends were reported over parts of WAN with record surface warmth over WAN during the 1990s compared to the past 200 years, and AP surface melting intensifying since the mid-20th century. No significant temperature trends were reported over EAN and there was low confidence in both WAN and EAN trend estimates due to sparse in situ records and large interannual to inter-decadal variability. In the AP, concomitant increase in temperature and foehn winds due to positive SAM caused increased surface melting over the Larsen ice shelves (medium confidence). Strong warming between the mid-1950s and the late 1990s led to the collapse of the Larsen B ice shelf in 2002, which had been intact for 11,000 years (medium confidence).
Snowfall increased over the Antarctic Ice Sheet over AP and WAN, offsetting some of the 20th-century sea level rise (medium confidence). Longer records suggest either a decrease in snowfall over the Antarctic Ice Sheet over the last 1000 years or a statistically negligible change over the last 800 years (low confidence).
Recent warming in the AP and consequent ice-shelf collapse are likely linked to anthropogenic ozone and greenhouse gas forcing via the SAM and anthropogenically driven Atlantic sea surface. Also, there is high confidence in the influence of tropical sea surface temperature on the Antarctic temperature and Southern Hemisphere mid-latitude circulation, as well as the SAM. There is medium agreement but limited evidence of an anthropogenic forcing effect on Antarctic ice-sheet mass balance (low confidence) and partitioning between natural and human drivers of atmospheric and ocean circulation changes remains very uncertain.
In AR5, Church et al. (2013) gave medium confidence in model projections of a future Antarctic SMB increase, implying a negative contribution to global mean sea level rise, consistent with a projection of significant Antarctic warming. Church et al. (2013) also gave high confidence to the relationship between future temperature and precipitation increases in Antarctica on physical grounds and from ice-core evidence. In Meredith et al. (2019), the total mass balance projections derived from ice-sheet models were reported without separating the SMB, though projections were reported of increased precipitation and continued strengthening of the westerly winds in the Southern Ocean.
Atlas.11.1.2 Assessment and Synthesis of Observations, Trends and Attribution
Figure Atlas.30 (Antarctic map inset) shows near-surface air temperature trends for 1957–2016 and 1979–2016 at the stations where observations are available for at least 50 years and the detected trends have statistical significance of at least 90% according to the most recent (after SROCC) studies (Jones et al., 2019; Turner et al., 2020). It is very likely that the western and northern AP has been warming significantly since the 1950s (0.49°C ± 0.28°C per decade during 1957–2016 and 0.46°C ± 0.15°C during 1951–2018 at Faraday-Vernadsky station; 0.29°C ± 0.16°C per decade during 1957–2016 at Esperanza station), with no significant trends reported in the eastern AP during the same period (Gonzalez and Fortuny, 2018; Jones et al., 2019; Turner et al., 2020). Short-term cooling trends, strongest during austral summer, have been reported at AP stations during 1999–2016, but the absence of warming and cooling at some stations during 1999–2016 is consistent with natural variability, and there is no evidence of a shift in the overall warming trend observed since the 1950s (Turner et al., 2016, 2020; Gonzalez and Fortuny, 2018; Jones et al., 2019; Bozkurt et al., 2020).
 Figure Atlas.30 | (Upper panels) Time series of annual surface mass balance (SMB) rates (in Gt a–1) for the Greenland Ice Sheet and its regions (shown in the inset map) for the periods 1972–2018 (Mouginot et al., 2019) and 1980–2012 (Fettweis et al., 2020) using 13 different models. (Lower panels) Time series of annual SMB rates (in Gt a–1) for the grounded Antarctic Ice Sheet (excluding ice shelves) and its regions (shown in the inset map) for the periods 1979–2019 (Rignot et al., 2019) and 1980–2016 (Mottram et al., 2021) using five Polar-CORDEX regional climate models. The Antarctic inset map also shows the location of the stations discussed in Atlas.11.1.2 where observations are available for at least 50 years. Colours indicate near-surface air temperature trends for 1957–2016 (circles) and 1979–2016 (diamonds) statistically significant at 90% (Jones et al. 2019; Turner et al. 2020). Stations with an asterisk (*) are where significance estimates disagree between the two publications. Further details on data sources and processing are available in the chapter data table (Table Atlas.SM.15).
 Significant warming at the Byrd station (0.29°C ± 0.19°C per decade during 1957–2016) confirms and extends earlier trend estimates (0.42°C ± 0.24°C per decade during 1958–2010) and is representative of the entire WAN warming (0.22°C ± 0.12°C per decade from 1958 to 2012 averaged over WAN excluding AP, medium confidence due to lack of observations) (Bromwich et al., 2013, 2014; Jones et al., 2019). WAN and AP show statistically significant warming in the HadCRUTv5 observational dataset (Figure 2.11b). There is high confidence in the long-term warming trend at the AP and WAN, and also at the century scale based on reconstructions (Zagorodnov et al., 2012; Stenni et al., 2017; Lyu et al., 2020), confirming the trends estimated by earlier studies assessed in the SROCC (Meredith et al., 2019). The century-scale warming trend in the AP is very likely an emerging signal compared to natural variability, while the WAN warming trend falls in the high end of century-scale trends over the last 2000 years (medium confidence) (Stenni et al., 2017).
In EAN, during 1957–2016, three stations showed significant warming (Scott 0.22°C ± 0.15°C, Novolazarevskaya 0.13°C ± 0.09°C, and Vostok 0.15°C ± 0.13°C per decade), while other stations with long-term observations indicated no statistically significant trends (Figure Atlas.3 0). During 1979–2016, three coastal stations showed cooling, while at the South Pole a warming trend was detected, increasing to 0.61°C ± 0.34°C per decade during 1989–2018 (Figure Atlas.3 0; Jones et al., 2019; Clem et al., 2020; Turner et al., 2020). The century-scale warming in Queen Maud Land coast based on ice-core reconstructions is within the range of centennial internal variability (Stenni et al., 2017).
While a trend towards a positive phase of the SAM since the 1970s likely explains a significant part of the warming at the northern AP, it had a cooling effect on continental WAN and EAN (particularly strong in DJF; Table Atlas.1). Warming in western AP and over WAN during 1957–2016 (Figure Atlas.3 0) and through to 2020 (Figure 2.11) is likely due to significant contribution of other factors, such as tropical Pacific forcing through PDV, ENSO, Amundsen Sea Low position/strength and also anthropogenic climate change (Jones et al., 2019; Scott et al., 2019; Wille et al., 2019; Donat-Magnin et al., 2020; Turner et al., 2020). Since SROCC, new studies confirmed the influence of foehn wind and cloud radiative forcing on Larsen C surface melt (Elvidge et al., 2020; Gilbert et al., 2020; Turton et al., 2020). In WAN, summer surface-melt occurrence over ice shelves may have increased since the late 2000s (Scott et al., 2019). It is likely that increased meltwater ponding and resulting hydrofracturing have been important mechanisms of the rapid disintegration of the Larsen B ice shelf (Banwell et al., 2013; MacAyeal and Sergienko, 2013; Robel and Banwell, 2019). Ice-shelf disintegration and relevant processes are discussed in Sections 9.4.2.1 and 9.4.2.3.
Direct observations of snowfall in Antarctica using traditional gauges are highly uncertain and records from precipitation radars (Gorodetskaya et al., 2015; Grazioli et al., 2017; Scarchilli et al., 2020) are not long enough to assess trends. Estimates of precipitation and SMB are largely model-based due to the paucity of in situ observations in Antarctica (Lenaerts et al., 2019; Hanna et al., 2020). Antarctic SMB is dominated by precipitation and removal by sublimation with very small amounts of melt mostly important only on the ice shelves. Climate models and satellite records (IMBIE team et al., 2018; Rignot et al., 2019; Mottram et al., 2021) suggest that strong interannual variability of Antarctic-wide SMB over the satellite period currently masks any existing trend (Figure Atlas.3 0) in spite of a possible ozone depletion-related precipitation increase over the 1991–2005 period (Lenaerts et al., 2018). No significant Antarctic-wide SMB trend is inferred since 1979 (IMBIE team et al., 2018; Medley and Thomas, 2019). While ice-core reconstructions show a significant increase in the western AP SMB since the 1950s (Thomas et al., 2017; Medley and Thomas, 2019; Wang et al., 2019), this trend is not reproduced by regional climate models or the reanalyses used to drive them (Figure Atlas.3 0; van Wessem et al., 2016; Wang et al., 2019).
According to the ice-core reconstructions, SMB over WAN (including AP) has likely increased during the 20th century with trends of 5.4 ± 2.9 Gt yr–1per decade (1900–2010; Wang et al., 2019) mitigating global mean sea level rise by, respectively, 0.28 ± 0.17 mm per decade (WAN excluding AP, during 1901–2000) and 0.62 ± 0.17 mm per decade (AP, during 1979–2000; Medley and Thomas, 2019). Significant spatial heterogeneity in SMB trends has been observed over AP and WAN:
- Western AP has likely experienced a significant increase in SMB beginning around 1930 and accelerating during 1970–2010, which is outside of the natural variability range of the past 300 years (Thomas et al., 2017; Medley and Thomas, 2019; Wang et al., 2019);
- eastern AP has no significant SMB trends during the same period (low confidence, observations limited to one ice core and large interannual variability) (Thomas et al., 2017; Engel et al., 2018);
- overall WAN SMB (excluding AP) was stable during 1980–2009 but exhibited high regional variability (Medley et al., 2013): significant increases (5–15 mm per decade during 1957–2000) to the east of the West Antarctic Ice Sheet divide and a significant decrease (–1 to –5 mm per decade during 1901–1956, and –5 to –15 mm per decade during 1957–2000) to the west (Medley and Thomas, 2019; Wang et al., 2019).
The SMB of EAN increased during the 20th century which mitigated global mean sea level rise by 0.77 ± 0.40 mm per decade during 1901–2000 (medium confidence) (Medley and Thomas, 2019). EAN SMB has been increasing at a much lower rate since 1979 as shown by observations, while regional climate models show strong interannual variability masking any trend (low confidence due to limited observations) (Figure Atlas.3 0; Medley and Thomas, 2019; Rignot et al., 2019). EAN SMB changes during the 20th century and recent decades showed large spatial heterogeneity:
- With significant increases likely in Queen Maud Land (QML): 5.2 ± 3.7% per decade during 1920–2011 measured in ice cores near the Kohnen station (Medley et al., 2018), an increase on the plateau (Altnau et al., 2015), and stable conditions during 1993–2010 along the annual stake line from Syowa (coast) to Dome F (plateau) (Y. Wang et al., 2015 ); increases during 1911–2010 (Thomas et al., 2017) with anomalously high SMB observed in 2009 and 2011 (Boening et al., 2012; Lenaerts et al., 2013; Gorodetskaya et al., 2014);
- increases in Wilkes Land and Queen Mary Land during 1957–2000 (low confidence due to limited observations and strong spatial variability) (Thomas et al., 2017; Medley and Thomas, 2019);
- a likely stable SMB in the interior of the east Antarctic plateau during the 1901–2000 period and the last decades (Thomas et al., 2017; Medley and Thomas, 2019);
- stable in Adelie Land (annual stake line during 1971–2008) (low confidence due to limited evidence) (Agosta et al., 2012).
Regional trends during recent 50 year (1961–2010) and 100 year (1911–2010) periods are within the centennial variability of the past 1000 years, except for coastal QML (unusual 100-year increase in accumulation) and for coastal Victoria Land (unusual 100-year decrease in accumulation) (Thomas et al., 2017). Nevertheless, the current EAN SMB is not unusual compared to the past 800 years (Frezzotti et al., 2013).
The geographic pattern of accumulation changes since the 1950s bears a strong imprint of a trend towards a more positive phase of the SAM (e.g., Medley and Thomas, 2019), which could be linked to ozone depletion (Lenaerts et al., 2018) or large-scale atmospheric warming (Frieler et al., 2015; Medley and Thomas, 2019). More evidence has emerged showing the importance of the Pacific–South American pattern, ENSO and Pacific Ocean convection, and large-scale blocking causing warm-air intrusions and both extreme precipitation and melt events, responsible for large interannual SMB variability (high confidence) (Gorodetskaya et al., 2014; Bodart and Bingham, 2019; Scott et al., 2019; Turner et al., 2019; Wille et al., 2019; Adusumilli et al., 2021). This strengthens evidence for an important connection between Antarctic climate and tropical sea surface temperature stated by SROCC (Meredith et al., 2019). Section 3.4.3 and SROCC (Meredith et al., 2019) provide a discussion of attribution of Antarctic ice-sheet changes.
Atlas.11.1.3 Assessment of Model Performance
This section provides evaluation of atmospheric global and regional climate models, including reanalyses. Evaluation of the ice-sheet models and relevant processes, including selection of the atmospheric models used to drive ice-sheet models, is given in Section 9.4.2.2.
One of the major systematic biases in CMIP5 and earlier GCMs was an equatorward bias in the latitude of the Southern Hemisphere mid‐latitude westerly jet, which is significantly reduced in the CMIP6 ensemble (Bracegirdle et al., 2020a). GCM Southern Ocean sea ice biases are also of importance as they influence 21st-century temperature projections in Antarctica and simulations of present-day temperatures are highly sensitive to these biases (Agosta et al., 2015; Bracegirdle et al., 2015). A positive bias in near-surface temperature over the Antarctic plateau is seen in CMIP5 models (Lenaerts et al., 2016).
CMIP6 GCMs showed an improved representation of the Antarctic near-surface temperature compared to CMIP5 but little improvement (maintaining positive bias) in Antarctic precipitation estimates (Palerme et al., 2017; Roussel et al., 2020). An analysis of the 1850–2000 SMB mean, trends, and interannual and spatial variability suggests slightly worse agreement with ice-core-based reanalyses in CMIP6 than CMIP5 (Gorte et al., 2020). Comparison of CMIP5 models with CloudSat satellite products and an ice-core-based SMB reconstruction showed almost all the models overestimate current Antarctic precipitation, some by more than 100% (Palerme et al., 2017; Gorte et al., 2020). GCM simulations of surface snow-melt processes are either of variable quality, with extremely simple representatons, or non-existent (Agosta et al., 2015; Trusel et al., 2015). Though most meltwater refreezes in the snowpack in current climate simulations, this may be an issue in the future climate simulations under global warming as runoff is projected to increase (Kittel et al., 2021). Since CMIP5, representation of snow (Lenaerts et al., 2016) and stable surface boundary layers (Vignon et al., 2018) has improved in some atmospheric GCMs. In one example, the CMIP6 model CESM2 simulation of cloud and precipitation showed substantial improvements (Schneider et al., 2020), though surface melting is still considerably overestimated compared to RCMs and satellite products (Trusel et al., 2015; Lenaerts et al., 2016).
Assimilation of observations in reanalysis products yields realistic temperature patterns and seasonal variations, with the recent ERA5 reanalysis showing improved performance compared to others for mean and extreme temperature, wind and humidity, though a warm bias in near-surface air temperatures remains (Retamales-Muñoz et al., 2019; Tetzner et al., 2019; Dong et al., 2020; Gorodetskaya et al., 2020). The ability of the reanalyses to simulate precipitation and SMB is more variable; they generally overestimate the latter (Gossart et al., 2019; Roussel et al., 2020), but are well suited to provide atmospheric and sea surface boundary conditions to drive RCMs.
Recent higher-resolution simulations covering the entire Antarctic Ice Sheet with a grid spacing of 12 to 50 km include five Polar-CORDEX RCMs – RACMO2 (van Wessem et al., 2018), MAR (Agosta et al., 2019; Kittel et al., 2021), COSMO-CLM2 (Souverijns et al., 2019), HIRHAM5 (Lucas-Picher et al., 2012) and MetUM (Walters et al., 2017; Mottram et al., 2021) – and one stretched-grid GCM – ARPEGE (Beaumet et al., 2019). RCM simulations forced by ERA-Interim agree well with automatic weather station temperatures, with high correlation (R2> 0.9) and low bias (<1.5°C) except for high-resolution HIRHAM5 (–2.1°C) and MetUM (–3.4°C), which are not internally nudged models (Mottram et al., 2021). RCMs generally underestimate the observed SMB but with biases lower than 20%, except for COSMO-CLM2 at lower elevations (<1200 m) and HIRHAM5 and MetUM at higher elevations (>2200 m) (Mottram et al., 2021). These RCM simulations lead to estimates of the grounded Antarctic Ice Sheet SMB ranging from 2133 Gt yr–1to 2328 Gt yr–1 when considering the four simulations compatible with the IMBIE2 Antarctic total mass budget (IMBIE team et al., 2018; Mottram et al., 2021). However, the simulated spatial pattern of SMB differs widely between models, suggesting the importance of missing or under-represented processes in the models, such as drifting-snow transport and sublimation (Agosta et al., 2019), cloud-precipitation microphysical processes (van Wessem et al., 2018) and snowpack modelling (Mottram et al., 2021). Comparisons of integrated SMB estimates between models are also complicated by different resolutions and continental ice masks, with models showing large differences in the absolute SMB (Mottram et al., 2021) but better agreement for SMB annual rates (Figure Atlas.3 0).
Finer-resolution RCM studies demonstrate improved representation of precipitation and temperature gradients (van Wessem et al., 2018; Bozkurt et al., 2020; Donat-Magnin et al., 2020; Elvidge et al., 2020), and strength of katabatic winds (Bintanja et al., 2014; Souverijns et al., 2019) in coastal and mountainous regions. Adequate representation of some processes is still lacking, including drifting snow, sublimation of falling snow or the spectral dependency of snow albedo (Lenaerts et al., 2019). Non-hydrostatic regional models, for example Polar-WRF, MetUM or HARMONIE-AROME at spatial resolutions up to 2 km further improve regional RCM simulations, but are still often unable to resolve relevant feedbacks and foehn processes (Grosvenor et al., 2014; Elvidge et al., 2015, 2020; Elvidge and Renfrew, 2016; King et al., 2017; Turton et al., 2017; Bozkurt et al., 2018b; Hines et al., 2019; Vignon et al., 2019; Gilbert et al., 2020).
Existing uncertainties in the Antarctic climate representation by both GCMs and RCMs cause significant spread in the future Antarctic climate and SMB projections (Gorte et al., 2020; Kittel et al., 2021). Run-time bias adjustment in atmospheric GCMs (Cross-Chapter Box 10.2; Krinner et al., 2019, 2020) has been proposed to provide low-bias present and consistently corrected future RCM forcing (reducing the need for coupled model selection), which could be used directly for Antarctic climate projections (Krinner et al., 2019).
Atlas.11.1.4 Assessment and Synthesis of Projections
This section provides an assessment of projections in temperature, precipitation and SMB. See Section 9.4.2 for projected changes in the ice-sheet total mass balance and relevant processes, and see Section 4.3.1 (Table 4.2) and Section 4.5.1 for Antarctic temperature projections relative to other regions.
The Antarctic region is very likely to experience a significant increase in annual mean temperature and precipitation by the end of this century under all emissions scenarios used in CMIP5 and CMIP6 (Figure Atlas.29; Bracegirdle et al., 2015, 2020b; Frieler et al., 2015; Lenaerts et al., 2016; Previdi and Polvani, 2016; Palerme et al., 2017). Ensemble means (and 10th–90th percentile ranges) of end-of-century (2081–2100) projected Antarctic surface air temperature change from 35 CMIP6 models and relative to 1995–2014 are 1.2°C (0.5°C–2.0°C) for the SSP1-2.6 emissions scenarios, 2.3°C (1.3°C–3.4°C) for SSP2-4.5, 3.5°C (2°C–5°C) for SSP3-7.0, and 4.4°C (2.8°C–6.4°C) for SSP5-8.5 (Interactive Atlas). Both temperature and precipitation projections are characterized by a relatively large multi-model range (Figure Atlas.29 and the Interactive Atlas). A strong regional variability is present with the projected changes over coastal Antarctica not scaling linearly with global forcing. While continental mean temperatures are linearly related to global mean temperatures in CMIP6 models, the relative increase in coastal temperatures are higher for low-emissions scenarios due to stronger relative Southern Ocean warming and relatively stronger effects of ozone recovery (Bracegirdle et al., 2020b). A higher multi-model average increase in temperature is projected by CMIP6 models compared to CMIP5, with a 1.3°C higher mean Antarctic near-surface temperature at the end of the 21st century (Kittel et al., 2021). While similar median temperature changes are projected for WAN and EAN, the former shows larger spread and higher projected temperature range in both CMIP5 and CMIP6 models and for all scenarios (Figure Atlas.29). CORDEX-Antarctica simulations show a mean and range in the future temperature changes similar to the subset of CMIP5 models used to drive them for the RCP8.5 scenario and 1.5°C, 2°C and 3°C GWLs (Figure Atlas.29).
There is high confidence that projected future surface air temperature increase over Antarctica will be accompanied by precipitation increase (Figure Atlas.29). CMIP6 models show a similar or larger but more constrained increase in precipitation (more models agreeing with larger precipitation increase) for the same GWLs compared to CMIP5. For example, over WAN during JJA for 3°C GWL, CMIP6 and CMIP5 models project a median 15% increase in precipitation with a 10th–90th percentile range of 7–25% in CMIP6 models and of 3–24% in CMIP5. Average precipitation changes relative to 1995–2014 over WAN and EAN are largely similar; they show projected increases for SSP2-4.5 (SSP5-8.5) of around 5% (5%) for 2021–2040, 7% (10%) for 2041–2060, and 12% (25%) for 2081–2100 with smaller increases projected for SSP1-2.6 emissions, reaching around 5% in 2081–2100. Regionally, the largest relative precipitation increase is projected (under all scenarios) for the eastern part of WAN, the western AP, large parts of the EAN plateau and over coastal EAN within 0°E–90°E longitudinal sector (Interactive Atlas). The largest increase in absolute precipitation amount is projected along the coastal regions, with the largest increase over coastal WAN and the western AP, and is projected to be largely driven by the increase in maximum five-day precipitation (Interactive Atlas), which is in line with the dominant contribution of extreme snowfall events to the total annual precipitation in the present Antarctic climate (Boening et al., 2012; Gorodetskaya et al., 2014; Turner et al., 2020). Under all emissions scenarios, the coastal precipitation increase corresponds to the snowfall increase, except for the northern and central part of the western AP, where snowfall is projected to decrease and rainfall to increase (similarly to the tendency towards increased precipitation, decreased snowfall and increase in rainfall over the Southern Ocean; Interactive Atlas).
From 2000 to 2100, the grounded Antarctic SMB is projected to mitigate sea level rise for RCP4.5 (RCP8.5) by the following sea level equivalents (SLEs), 0.03 ± 0.02 m (0.08 ± 0.04 m SLE) from 30 CMIP5 models and for SSP2-4.5 (SSP5-8.5) by 0.03 ± 0.03 m SLE (0.07 ± 0.04 m SLE) from 24 CMIP6 models (Gorte et al., 2020). Subsets or downscaling of CMIP AOGCMs lead to 21st-century cumulative projections in the range of 0.05 ± 0.03 m SLE for CMIP5 RCP8.5 and 0.08 ± 0.04 m SLE for CMIP6 SSP5-8.5 (Gorte et al., 2020; Nowicki et al., 2020; Seroussi et al., 2020; Kittel et al., 2021). Use of model subsets reduces spread leading to either lower or higher climate sensitivity in the Antarctic depending on the selection method. For example, models selected by Gorte et al. (2020) based on SMB ice-core reconstruction from Medley and Thomas (2019) tend to underestimate strongly winter sea ice area (Agosta et al., 2015; Roach et al., 2020) and show reduced 21st-century increase in Antarctic SMB compared to the full ensembles (Agosta et al., 2015; Bracegirdle et al., 2015). A different subset of models is used for ISMIP6 (Section 9.4.2.3) which gives a lower increase in Antarctic SMB than the full ensemble for CMIP5 but a larger increase for CMIP6.
Polar-CORDEX RCMs show higher variability in precipitation projections compared to CMIP5 models with a similar spatial pattern of the areas with precipitation increase over continental Antarctica but with higher local magnitude, and also showing a larger increase over the Weddell Sea ice shelves (Interactive Atlas). CMIP5 and CMIP6 models, bias adjusted based on regional climate model simulations, showed that the projected warming is expected to result in increased surface melting over the Antarctic ice shelves, with meltwater runoff under RCP8.5 and SSP5-8.5 becoming larger than precipitation over ice shelves over the period 2045–2050, surpassing intensities that were linked with the collapse of Larsen A and B ice shelves (Trusel et al., 2015; Kittel et al., 2021). Given the existing uncertainty in the present precipitation and SMB simulations and the significant range in the projected precipitation increase under various emissions scenarios in CMIP5, CMIP6 and CORDEX models, there is medium confidence that the future Antarctic SMB will have a negative contribution to sea level during the 21st century under all emissions scenarios (see Section 9.4.2.3 for assessment of the drivers of future Antarctic ice-sheet change and Section 9.4.2.6 for longer time scales).
Atlas.11.1.5 Summary
Observations show a very likely widespread, strong warming trend starting in the 1950s in the Antarctic Peninsula. Significant warming trends are observed in other West Antarctic regions and at selected stations in East Antarctica (medium confidence). Antarctic precipitation and SMB showed a significant positive trend over the 20th century according to the ice cores, while large interannual variability masks any existing trend over the satellite period since the end of the 1970s (medium confidence).
An assessment of model performance for the present day shows that high-resolution regional climate models with polar-optimized physics are important for estimating SMB and generating climate information, and show improved realizations compared to reanalyses and GCMs when evaluated against observations. At the same time, CMIP6 GCMs showed an improved representation of the Antarctic near-surface temperature compared to CMIP5, though still struggle with the representation of precipitation. There is therefore medium confidence in the capacity of climate models to simulate Antarctic climate and SMB changes.
Under all assessed emissions scenarios, both West and East Antarctica are very likely to have higher annual mean surface air temperatures and more precipitation, which will have a dominant influence on determining future changes in the SMB (high confidence). However, due to the challenges of model evaluation over the region and the possibility of increased meltwater runoff described above, there is onlymedium confidence that the future contribution of the Antarctic SMB to sea level this century will be negative under all greenhouse gas emissions scenarios.
Atlas.11.2 Arctic
Atlas.11.2.1 Key Features of the Regional Climate and Findings From Previous IPCC Assessments
Atlas.11.2.1.1 Key Features of the Regional Climate
The Arctic region comprises the Arctic Ocean (ARO), Russian Arctic (RAR), Greenland and Iceland (GIC), and other surrounding land areas in Europe (NEU) and North America (NEN, NWN) (Figure Atlas.29). The region is one of the coldest and driest regions on Earth and plays a key role influencing global and regional climates and the hydrological cycle. A number of physical processes contribute to amplified Arctic temperature variations as compared to the global temperature, in particular thermodynamic changes that include the increase in surface absorption of solar radiation due to surface albedo feedbacks related with sea ice, ice, and snow cover retreat as well as poleward energy transports, water-vapour-radiation and cloud-radiation feedbacks (Screen and Simmonds, 2010; Serreze and Barry, 2011; Pithan and Mauritsen, 2014; Bintanja and Krikken, 2016; Graversen and Burtu, 2016; Franzke et al., 2017; Stuecker et al., 2018). Precipitation in the Arctic is dominated by snowfall, with rainfall present mostly during the summer period. Arctic climate is influenced by the North Atlantic Oscillation (NAO), the leading mode of atmospheric variability in the North Atlantic basin with a northward extension into the Arctic affecting temperature, precipitation and sea ice over the region, with ENSO and Atlantic Multi-decadal Variability (AMV) also affecting parts of the region (Annex IV). Further, the Greenland Ice Sheet contribution to sea level results from the imbalance between mass gain by net snow accumulation and mass loss by meltwater runoff and ice discharge into the ocean (IMBIE team, 2020), highlighting that the ice sheet is a major contributor to sea level changes.
Atlas.11.2.1.2 Findings From Previous IPCC Assessments
The following summary from previous IPCC reports is derived from the SROCC (IPCC, 2019a) unless otherwise stated. Arctic surface air temperatures have increased from the mid-1950s, with feedbacks from loss of sea ice and snow cover contributing to the amplified warming (high confidence) (IPCC, 2018c), and have likely increased by more than double the global average over the last two decades (high confidence). Arctic snow cover in June has declined from 1967 to 2018 (high confidence). Arctic glaciers are losing mass (very high confidence) and this along with changes in high-mountain snowmelt have caused changes in hydrology, including river runoff, that are projected to continue in the near term (high confidence). The rate of ice loss from the Greenland Ice Sheet has increased; during 2006–2015 the loss was 278 ± 11 Gt yr–1 with the rate for 2012–2016 higher than for 2002–2011 and several times higher than during 1992–2001 (high confidence).
The Arctic sea ice area is declining in all months of the year (very high confidence) with the September sea ice minimum very likely having reduced by 12.8 ± 2.3% per decade during the satellite era (1979–2018) to levels unprecedented for at least 1000 years (medium confidence).
The high latitudes are likely to experience an increase in annual mean precipitation under RCP8.5 (IPCC, 2013c). Further, changes in precipitation will not be uniform. Autumn and spring snow cover duration are projected to decrease by a further 5–10% from current conditions in the near term (2031–2050). No further losses are projected under RCP2.6 whereas a further 15–25% reduction in snow cover duration is projected by the end of century under RCP8.5 (high confidence).
Atlas.11.2.2 Assessment and Synthesis of Observations, Trends and Attribution
The Arctic has warmedat more than twice the global rate over the past 50 years with the greatest warming during the cold season (high confidence) (Davy et al., 2018; Box et al., 2019; Przybylak and Wyszyński, 2020; Xiao et al., 2020). This is based on various Arctic amplification processes, in particular the combined effect of several related feedback processes, including between various radiation components and (a) the albedo of sea ice and snow, (b) water vapour, and (c) clouds, as well as poleward energy transports. The annual average Arctic surface air temperature increased by 2.7°C from 1971 to 2017, with a 3.1°C increase in the cold season (October–May) and a 1.8°C increase in the warm season (June–September) (AMAP, 2019). Satellite-based data estimate the rate of annual warming for 1981–2012 over sea ice covered regions to be 0.47°C per decade, whereas the trend was significantly higher at 0.77°C per decade over Greenland and amplified in the northern Barents and Kara seas (Comiso and Hall, 2014). The largest Arctic warming in 2003–2017 was reported over the Barents and Kara seas with trends larger than 2.5°C per decade (Susskind et al., 2019), and Arctic temperatures from 2014 to 2018 have exceeded all previous records since 1900 (Blunden and Arndt, 2019).
Over the ARO, long-term temperature records are available from Spitsbergen (Svalbard Airport). For the period 1898–2018, the annual mean warming was 0.32°C per decade, about 3.5 times the global mean temperature for the same period and since 1991, it was 1.7°C per decade or about seven times the global average for the same period (Nordli et al., 2020). There is a positive trend in the annual temperature for all stations across Svalbard (Gjelten et al., 2016; Hanssen-Bauer et al., 2019; Dahlke et al., 2020) of 0.64°C–1.01°C per decade for 1971–2017 (Hanssen-Bauer et al., 2019), co-varying with regional changes in sea ice conditions (Dahlke et al., 2020). The largest temperature trends very likely occur in winter, with Svalbard Airport warming at 0.43°C per decade during 1898–2018 and 3.19°C per decade during 1991–2018 (Nordli et al., 2020), and Isaksen et al. (2016) reporting on substantial warming in western Spitsbergen, particularly in winter, while the summer warming is moderate.
A multi-dataset analysis for NEN shows a consistent warming (Rapaić et al., 2015), with the largest annual temperature trend greater than 0.3°C per decade during 1981–2010 over eastern NEN and also significant warming over northern Quebec and most of the Canadian Arctic north of the treeline. For the longer 1950–2010 period, a consistent warming is found over central and western NEN, but no trend or no consensus is found over the Labrador coast. The latter is related with cooling of the North Atlantic region during the 1970s. For western Greenland, however, summer temperatures increased (2.2°C in June, 1.1°C in July) from 1994 to 2015 (Saros et al., 2019). For neighbouring Arctic regions of NEU, WSE and ESB, datasets show a consistent warming of annual mean temperature since the mid-1970s and 1980 (Atlas.8 and Atlas.5.2).
Along with the amplified warming, the Arctic has become moister (Rinke et al., 2019; Nygård et al., 2020). AMAP reported Arctic precipitation increases of 1.5–2.0% per decade, with the strongest increase in the cold season (October–May) (medium confidence) (AMAP, 2019). Also, for neighbouring Arctic regions for example NEU, EEU and North Asia, mean annual precipitation has increased since the early 20th century (Atlas.8 and Atlas.5.2). Estimated trends for precipitation and snowfall fraction are mixed for the Arctic, with increases and decreases for different regions and seasons (Vihma et al., 2016). However, annual precipitation trends derived from different reanalyses do not agree, differ in sign and have low significance (Lindsay et al., 2014; Boisvert et al., 2018). Direct precipitation measurements are difficult and include uncertainties (among others measuring frozen precipitation), therefore precipitation estimates in the Arctic rely on climate models and reanalyses.
An average of five reanalyses for 2000–2010 suggests around 40% of Arctic Ocean precipitation falls as snow, though there is large uncertainty in this estimate (Boisvert et al., 2018). Rainfall frequency is estimated to have increased over the Arctic by 2.7–5.4% over 2000–2016 (Boisvert et al., 2018) with more frequent rainfall events reported for NEU and ARO (Svalbard; Maturilli et al., 2015; AMAP, 2019), and winter rain totals and frequency have increased in Svalbard since 2000 (medium confidence) (Łupikasza et al., 2019). Rain-free winters have rarely occurred since 1998 (Peeters et al., 2019).
Observational records (1966–2010) for the RAR region show changing precipitation characteristics (Ye et al., 2016), with higher precipitation intensity but lower frequency and little change in annual precipitation total. Precipitation intensity is reported to have increased in all seasons, strongest in winter and spring, weakest in summer, and at a rate of about 1–3% per degree Celsius of air temperature increase.
Atlas.11.2.3 Assessment of Model Performance
Evaluating simulated temperature and precipitation is problematic in the Arctic due to sparse weather station observations. The lack of reliable observed precipitation datasets for the Arctic thus makes it very unlikely to be able to evaluate objectively the skill of models to reproduce precipitation patterns (Takhsha et al., 2018).
The CMIP5 models reproduce the observed Arctic warming over the past century (medium confidence) (Chylek et al., 2016; Hao et al., 2018; Huang et al., 2019). The simulated mean Arctic warming for 1900–2014 averaged over 40 CMIP5 models is 2.7°C compared to the observed values of 2.2°C (NASA GISS data smoothed using a 1200-km radius) or 1.7°C (using a 250-km smoothing radius) (Chylek et al., 2016). However, there are large inter-model differences in the simulated warming which ranges from 1.2°C to 5.0°C. Although the CMIP5 models reproduce the spatially averaged observed warming over the past 50 to 100 years, the pattern is different from that of observations and reanalysis (Xie et al., 2016; Franzke et al., 2017; Hao et al., 2018). Zonal mean temperature trends in the CMIP5 models overestimate the warming in the cold season over high latitudes in the Northern Hemisphere (Xie et al., 2016). Overall, the amplified Arctic warming in recent decades is overestimated by CMIP5 models (Huang et al., 2019). Possible reasons are modelled sea surface temperature biases and an overestimated temperature response to the Arctic sea ice decline. Furthermore, some models, which have a warm or weak bias in their Arctic temperature simulations, closely relate the Arctic warming to changes in the large-scale atmospheric circulation. In other models, which show large cold biases, the albedo feedback effect plays a more important role for the temperature trend magnitude. This implies that the dominant simulated Arctic warming mechanism and trend may be dependent on the bias of the model mean state (Franzke et al., 2017). Compared to CMIP5 models, Davy and Outten (2020) found lower biases in CMIP6 models’ representation of sea ice extent and volume with improved extents linked to a better seasonal cycle in the Barents Sea.
Rapid temperature changes, such as the pronounced increase of 2°C yr–1during 2003–2012 over the Kara and Barents seas in March is well captured in Arctic CORDEX simulations (Kohnemann et al., 2017). The models show adequate skill in capturing the general temperature patterns (Koenigk et al., 2015; Matthes et al., 2015; Hamman et al., 2016; Cassano et al., 2017; Brunke et al., 2018; Diaconescu et al., 2018; Takhsha et al., 2018), but tend to show a cold temperature bias which is largest in winter and depends on the reference dataset. Cassano et al. (2017) showed a large sensitivity of the simulated surface climate to changes in atmospheric model physics. In particular, large changes in radiative flux biases, driven by changes in simulated clouds, lead to large differences in temperature and precipitation biases.
The CMIP5 models perform well in simulating 20th-century snowfall for the Northern Hemisphere, although there is a positive bias in the multi-model ensemble relative to the observed data in many regions (Krasting et al., 2013). Lack of sufficient spatial resolution in the model topography has a serious impact on the simulation of snowfall. The patterns of relative maxima and minima of snowfall, however, are captured reasonably well by the models.
Arctic CORDEX RCMs reproduce the dominant features of regional precipitation patterns and extremes (e.g., Glisan and Gutowski, 2014; Hamman et al., 2016). Due to their higher spatial resolution, RCMs simulates larger amounts of orographic precipitation compared to reanalyses. Overall, the simulated precipitation is within the reanalysis and global model ensemble spread, but the Arctic river basin precipitation is closer to observations (Brunke et al., 2018). However, Takhsha et al. (2018) show that the RCMs’ precipitation bias highly depends on the observational reference dataset used.
The annual mean precipitation pattern of ensemble global atmospheric simulations with a high horizontal resolution agrees well with the observations, with precipitation maxima over the Greenland and Norwegian seas (Kusunoki et al., 2015). However, the simulated Arctic average annual precipitation shows a positive bias with excessive precipitation over Alaska and the western Arctic (Kattsov et al., 2017).
Regarding the Greenland Ice Sheet (region GIC), modelled surface mass balance (SMB) has decreased since the end of the 1990s (Fettweis et al., 2020). A multi-model intercomparison study (Fettweis et al., 2020) emphasized a simulated positive mean annual SMB of 338 ± 68 Gt yr–1between 1980 and 2012, with a decreasing average rate of 7.3 ± 2.0 Gt yr–2, mainly driven by an increase in meltwater runoff. Mouginot et al. (2019) stated that SMB played a strong role in the ice-sheet mass loss, where SMB dominated in the last two decades. Mottram et al. (2019) found that SMB processes dominate the ice-sheet mass budget over most of the interior, highlighting that the ice sheet is a contributor to global mean sea level rise between 1991 and 2015. More specifically, SMB models have improved (Fettweis et al., 2020; Hanna et al., 2021) due to increased availability and quality of remotely sensed (Koenig et al., 2016; Overly et al., 2016) and in situ observations (Machguth et al., 2016; Fausto et al., 2018; Vandecrux et al., 2019, 2020). Fettweis et al. (2020) showed that the models’ ensemble mean provides the best estimate of the present-day SMB relative to observations. This is the case for the patterns in all seven regions (regional division after Mouginot et al., 2019) apart from the SE accumulation zone where large discrepancies in modelled snowfall accumulation occurred where the spread can reach 2-m water equivalent per year. Montgomery et al. (2020) confirmed this, highlighting that RCMs (MAR and RACMO) are underestimating accumulation in south-east Greenland and that models misrepresent spatial heterogeneity due to an orographically forced bias in snowfall near the coast. Further, for north-east Greenland, Karlsson et al. (2020) found RCMs underestimate snow accumulation rates by up to 35%. The regional time series show that SMB has been gradually decreasing in all seven regions (1979–2017), although the trend is less strong in central-eastern and south-eastern regions. In the south-west, north-east and north-west, SMB turns negative or close to zero after 2000 and remains above zero in other regions (medium confidence) (Figure Atlas.3 0).
Atlas.11.2.4 Assessment and Synthesis of Projections
Mean temperature in the Arctic is projected to continue to rise throughthe 21st century significantly higher than the global average (Figure Atlas.29 and the Interactive Atlas). For the regions NWN and NEN, see Atlas.9. The Arctic is projected to reach a 2°C annual mean warming above the 1981–2005 baseline about 25 to 50 years before the globe as a whole under RCP8.5 and RCP4.5 (Post et al., 2019). The Arctic warming may be as much as 4°C in the annual mean and 7°C in late autumn under 2°C global warming, regardless of which scenario is considered (high confidence) (Post et al., 2019).
Projections from 40 CMIP5 models of the 2014–2100 Arctic annual warming under RCP4.5 vary from 0.9°C to 6.7°C, with a multi-model mean of 3.7°C (Chylek et al., 2016). All models agree on a projected Arctic amplification (of at least 1.5 times), but they disagree on the magnitude and spatial patterns. Arctic warming trends projected by models that include a full direct and indirect aerosol effect (‘fully aerosol–cloud interactive’) are significantly higher than those projected by models without a full indirect aerosol effect (Chylek et al., 2016).
Projected Arctic warming exhibits a very pronounced seasonal cycle, with exceptionally strong warming in the winter. In projections from 30 CMIP5 models, winter warming over ARO varies regionally from 3°C to 5°C by mid-century and 5°C to 9°C by late-century under RCP4.5 (high confidence) (AMAP, 2017). Averaged over the Arctic and based on 36 CMIP5 models, winter warming is 5.8°C ± 1.5°C by mid-century and 7.1°C ± 2.3°C by 2100 under RCP4.5 (Overland et al., 2019), and an exceptionally strong warming of up to 14.1°C ± 2.9°C is projected in December under RCP8.5 (Bintanja and Krikken, 2016). Bintanja and Van Der Linden (2013) estimated the Arctic winter warming over the 21st century to exceed the summer warming by at least a factor of four, irrespective of the magnitude of the climate forcing.
Overland et al. (2014) highlighted the difference between the near-term ‘adaptation timescale’ and the long-term ‘mitigation timescale’ for the Arctic. Only in the latter half of the century do the projections under RCP4.5 and RCP8.5 noticeably separate. End-of-the-century warming is approximately twice as large under RCP8.5 demonstrating the impact of the lower emissions under RCP4.5 (high confidence) (AMAP, 2017). More specifically under the strong forcing scenario, annual mean surface air temperature in the Arctic is projected to increase by 8.5°C ± 2.1°C over the course of the 21st century (Bintanja and Andry, 2017), and emerges as a ‘new Arctic’ climate being significantly different from that of the mid-20th century (Landrum and Holland, 2020). The end-of-the-century warming (2080–2099 relative to 1980–1999, RCP8.5) can exceed 15°C in autumn and winter over the Arctic Ocean (Koenigk et al., 2015). Projections averaged over the four best-performing CMIP5 models show an Arctic annual warming of 4.1°C (RCP2.6), 5.7°C (RCP4.5) and 10.6°C (RCP8.5) by 2100 compared to 1951–1980 (Hao et al., 2018). Also, for neighbouring Arctic regions, for example NEU, WSB and ESB, temperature is projected to increase towards the end of the century under both RCP4.5 and RCP8.5 (Atlas.8 and Atlas.5.2).
The ensemble of CMIP6 shows likely greater warming compared to CMIP5 (Figure Atlas.29). There is weak agreement among the models in projected temperature change over the Arctic North Atlantic under SSPs until the mid-century, but a robust warming signal clearly emerges even there by 2100 (Interactive Atlas). Generally, the largest annual warming is simulated over the Arctic Ocean, particularly over the Barents Sea and the Kara Sea. Future warming in CORDEX RCMs and the CMIP5 models are similar (Spinoni et al., 2020). The RCM warming over the AO is smaller, while the warming over land is larger in winter and spring but smaller in summer, compared with CMIP5 (Koenigk et al., 2015).
Mean precipitation in ARO, GIC and RAR is projected to rise in a warming climate (Figure Atlas.29), with different rates for the different seasons and scenarios. For NWN and NEN, see Atlas.9. The CMIP5 multi-model mean projected precipitation increase in the Arctic is likely of the order of 50% under RCP8.5 by the end of the 21st century, which is among the highest globally (Bintanja and Selten, 2014). Over 70°N–90°N, the precipitation increase is likely 62 ± 20% and 56 ± 13% for RCP4.5 and RCP8.5 respectively. For ARO (Svalbard), the increase in annual precipitation by 2100 is estimated to be about 45% for RCP4.5 and 65% for RCP8.5 (CMIP5 ensemble median; Van der Bilt et al., 2019). However, importantly the simulated Arctic precipitation increase varies by a factor of three to four between models (Bintanja and Selten, 2014). The projected increase is strongest in late autumn and winter (Vihma et al., 2016). The interannual variability of Arctic precipitation will likely increase markedly (up to 40% over the 21st century), especially in summer (medium confidence) (Bintanja et al., 2020).
The CMIP6 projections confirm precipitation will likely increase almost everywhere in the Arctic (Interactive Atlas). The largest increase is simulated over the Barents Sea, Kara Sea and East Siberian Sea regions, and over north-east Greenland. A pronounced uncertainty in the projection exists over the Arctic North Atlantic and south Greenland. There, the precipitation signal is not significant even by the end of the 21st century and under high-emissions scenarios (RCP8.5, SSP5-8.5). Consistent with the generally higher warming in CMIP6, compared to CMIP5, the projected precipitation increase is also higher (high confidence) (Figure Atlas.29).
The Arctic mean annual precipitation sensitivity has been estimated at a 4.5% increase per degree Celsius of temperature rise, compared to a global average of 1.6–1.9% per degree Celsius of temperature rise (Bintanja and Selten, 2014) based on a set of 37 CMIP5 GCMs. Koenigk et al. (2015) stress the different precipitation sensitivity in winter (0.8 mm per month per degree Celsius of temperature rise) and summer (2 mm per month per degree Celsius of temperature rise). The pattern and amplitude of precipitation changes agree in CORDEX simulations with their driving CMIP5 models (high confidence) (Koenigk et al., 2015; Spinoni et al., 2020). However, more small-scale variations over land and coastlines, and significantly larger precipitation changes in summer are obvious in the downscaling.
Rain is projected to become the dominant form of precipitation in the Arctic region by the end of the 21st century (Bintanja, 2018). The CMIP5 models show a decrease in annual Arctic snowfall under both RCP4.5 and RCP8.5 (high confidence) (Krasting et al., 2013; Bintanja and Andry, 2017). In the central Arctic, the snowfall fraction barely remains larger than 50%, with only Greenland still having snowfall fractions larger than 80% (Bintanja and Andry, 2017). The most dramatic reductions in snowfall fraction are projected to occur over the North Atlantic and, especially, the Barents Sea.
With ongoing warming and polar amplification in the Arctic, the Greenland Ice Sheet SMB will inevitably continue to change (high confidence) (Lenaerts et al., 2019). For the ice sheet, despite large differences between model scenarios, future projections and regions agree that increasing temperatures will increase runoff which will in turn dominate the future decrease of SMB (Rae et al., 2012; van Angelen et al., 2014; Mottram et al., 2017; Hofer et al., 2020), confirming the high sensitivity of the SMB to atmospheric warming. Changes in SMB will continue to dominate future mass loss from the ice sheet, and likely even more when marine-terminating glaciers retreat onto land, and solid ice discharge is reduced (Vizcaino, 2014; Lenaerts et al., 2019).
Atlas.11.2.5 Summary
It is very likely that the Arctic has warmed at more than twice the global rate over the past 50 years and likely that annual precipitation has increased with the highest increases during the cold season. This is based on various Arctic amplification processes, in particular, a combination of several feedback-related processes such as sea ice and snow-cover albedo, poleward energy transports, and water-vapour-cloud-radiation feedbacks. The frequency of rainfall increased over the Arctic by 2.7–5.4% over the 2000–2016 period with more frequent rainfall events being reported for northern Europe and Svalbard (medium confidence).
The CMIP5 models reproduce the observed Arctic warming over the past century but overestimate the amplified Arctic warming in the recent decades (medium confidence). Arctic CORDEX simulations show adequate skill in capturing regional temperature and precipitation patterns and precipitation extremes (high confidence). SMB models have improved due to increased availability and quality of remotely sensed and in situ observations, and an ensemble mean of SMB model simulations provides the best estimate of the present-day SMB (medium confidence).
It is very likely that the Arctic annual mean temperature and precipitation will continue to increase, reaching around 11.5°C ± 3.4°C and 49 ± 19% over the 2081–2100 period (with respect to a 1995–2014 baseline) under the SSP5-8.5 scenario or 4.0°C ± 2.5°C and 17 ± 11% under the SSP1-2.6 scenario. These CMIP6 results show likely higher Arctic annual mean temperatures compared to CMIP5 for a given time-period and emissions scenario, though the projections are consistent for global warming levels.
Atlas.12 Final Remarks
Developing from the AR5 WGI Atlas Annex (IPCC, 2013a), the Atlas is an innovation in the WGI contribution to the AR6, providing a region-by-region assessment of new knowledge on changes in mean climate and an online interactive tool, the Interactive Atlas. It demonstrates the diversity in the climate changes across these regions, in the evidence base for generating information on what changes have already occurred and why, and what further changes each region is projected to face in the future based on different emissions scenarios and global warming levels. Finally, the Interactive Atlas allows for further exploration of the data underpinning the assessment material generated by many of the other chapters.
The foundation of the regional information generated by the Atlas chapter is an assessment of the significant body of new literature on regional climate change though noting substantial heterogeneity in both its availability and the involvement of regional expertise. In many regions this allows for an in-depth assessment though in some the range of information that can be provided and/or the level of confidence in the information is limited. There is similar heterogeneity in the availability of observations to assess recent trends and evaluate model performance, with a lack of curated regional datasets in the polar regions, Northern South America, Africa and the Small Islands.
Internal variability is a large contributor to the climate uncertainty at regional scales. Recent work has combined outputs of single model initial-conditions large ensembles (SMILEs) with CMIP5 and CMIP6 to partition and gain insights on the modelled range and uncertainty arising from internal variability and from model-response uncertainty for a given emissions scenario (Deser et al., 2020; Lehner et al., 2020; Maher et al., 2021). The work highlights the notable role for internal variability at regional scales, particularly for precipitation in regions with weaker forced response, where internal variability can remain larger than model uncertainty or scenario uncertainty throughout the whole century. The Atlas (similarly to other regional chapters) uses a single realization per model (CMIP6 models provide multiple realizations, but it is not the case for CORDEX and less so for CMIP5), which allows for the comparison of the different lines of evidence but at the expense of internal variability having a larger influence on the ability to detect or quantify changes.
The assessment produced in the Atlas is based on the individual results from the different lines of global and regional evidence and the consistency amongst them, as there is a lack of literature on methodologies that combine multiple lines of evidence to distil regional climate change information.
References
Aalbers, E.E., G. Lenderink, E. van Meijgaard, and B.J.J.M. van den Hurk, 2018: Local-scale changes in mean and heavy precipitation in Western Europe, climate change or internal variability?Climate Dynamics, 50(11–12) , 4745–4766, doi: 10.1007/s00382-017-3901-9.
Aalto, J., M. Kämäräinen, M. Shodmonov, N. Rajabov, and A. Venäläinen, 2017: Features of Tajikistan’s past and future climate. International Journal of Climatology, 37(14) , 4949–4961, doi: 10.1002/joc.5135.
Abadi, A.M., R. Oglesby, C. Rowe, and R. Mawalagedara, 2018: Evaluation of GCMs historical simulations of monthly and seasonal climatology over Bolivia. Climate Dynamics, 51(1–2) , 733–754, doi: 10.1007/s00382-017-3952-y.
Abid, M.A., M. Almazroui, F. Kucharski, E. O’Brien, and A.E. Yousef, 2018: ENSO relationship to summer rainfall variability and its potential predictability over Arabian Peninsula region. npj Climate and Atmospheric Science, 1(1) , 20171, doi: 10.1038/s41612-017-0003-7.
Aceituno, P., 1988: On the functioning of the Southern Oscillation in the South American sector. Part I: surface climate. Monthly Weather Review, 116(3) , 505–524, doi: 10.1175/1520-0493(1988)116<0505:otfots>2.0.co;2.
Adler, R. et al., 2018: The Global Precipitation Climatology Project (GPCP) Monthly Analysis (New Version 2.3) and a Review of 2017 Global Precipitation. Atmosphere, 9(4) , 138, doi: 10.3390/atmos9040138.
Adusumilli, S., M. A. Fish, H.A. Fricker, and B. Medley, 2021: Atmospheric River Precipitation Contributed to Rapid Increases in Surface Height of the West Antarctic Ice Sheet in 2019. Geophysical Research Letters, 48(5) , 1–11, doi: 10.1029/2020gl091076.
Agel, L. and M. Barlow, 2020: How Well Do CMIP6 Historical Runs Match Observed Northeast U.S. Precipitation and Extreme Precipitation–Related Circulation?Journal of Climate, 33(22) , 9835–9848, doi: 10.1175/jcli-d-19-1025.1.
Agosta, C., X. Fettweis, and R. Datta, 2015: Evaluation of the CMIP5 models in the aim of regional modelling of the Antarctic surface mass balance. The Cryosphere, 9(6) , 2311–2321, doi: 10.5194/tc-9-2311-2015.
Agosta, C. et al., 2012: A 40-year accumulation dataset for Adelie Land, Antarctica and its application for model validation. Climate Dynamics, 38(1) , 75–86, doi: 10.1007/s00382-011-1103-4.
Agosta, C. et al., 2019: Estimation of the Antarctic surface mass balance using the regional climate model MAR (1979–2015) and identification of dominant processes. The Cryosphere, 13(1) , 281–296, doi: 10.5194/tc-13-281-2019.
Aguilar, E. et al., 2009: Changes in temperature and precipitation extremes in western central Africa, Guinea Conakry, and Zimbabwe, 1955–2006. Journal of Geophysical Research: Atmospheres, 114(D2) , D02115, doi: 10.1029/2008jd011010.
Akinsanola, A.A., G.J. Kooperman, A.G. Pendergrass, W.M. Hannah, and K.A. Reed, 2020a: Seasonal representation of extreme precipitation indices over the United States in CMIP6 present-day simulations. Environmental Research Letters, 15(9) , 094003, doi: 10.1088/1748-9326/ab92c1.
Akinsanola, A.A., G.J. Kooperman, K.A. Reed, A.G. Pendergrass, and W.M. Hannah, 2020b: Projected changes in seasonal precipitation extremes over the United States in CMIP6 simulations. Environmental Research Letters, 15(10) , 104078, doi: 10.1088/1748-9326/abb397.
Akperov, M. et al., 2019: Future projections of cyclone activity in the Arctic for the 21st century from regional climate models (Arctic-CORDEX). Global and Planetary Change, 182, 103005, doi: 10.1016/j.gloplacha.2019.103005.
Albrecht, F., O. Pizarro, A. Montecinos, and X. Zhang, 2019: Understanding Sea Level Change in the South Pacific During the Late 20th Century and Early 21st Century. Journal of Geophysical Research: Oceans, 124(6) , 3849–3858, doi: 10.1029/2018jc014828.
Ali, S. et al., 2020: Spatio-Temporal Variability of Summer Monsoon Onset over Pakistan. Asia-Pacific Journal of Atmospheric Sciences, 56(1) , 147–172, doi: 10.1007/s13143-019-00130-z.
Allaberdiyev, G., 2010: Climate change and Turkmenistan. United Nations Development Programme (UNDP), 29 pp.
Almazroui, M., 2016: RegCM4 in climate simulation over CORDEX-MENA/Arab domain: selection of suitable domain, convection and land-surface schemes. International Journal of Climatology, 36(1) , 236–251, doi: 10.1002/joc.4340.
Almazroui, M., 2020a: Changes in Temperature Trends and Extremes over Saudi Arabia for the Period 1978–2019. Advances in Meteorology, 2020, 1–21, doi: 10.1155/2020/8828421.
Almazroui, M., 2020b: Rainfall Trends and Extremes in Saudi Arabia in Recent Decades. Atmosphere, 11(9) , 964, doi: 10.3390/atmos11090964.
Almazroui, M. and S. Saeed, 2020: Contribution of extreme daily precipitation to total rainfall over the Arabian Peninsula. Atmospheric Research, 231, 104672, doi: 10.1016/j.atmosres.2019.104672.
Almazroui, M., M.N. Islam, H. Athar, P.D. Jones, and M.A. Rahman, 2012: Recent climate change in the Arabian Peninsula: Annual rainfall and temperature analysis of Saudi Arabia for 1978–2009. International Journal of Climatology, 32(6) , 953–966, doi: 10.1002/joc.3446.
Almazroui, M., M. Nazrul Islam, S. Saeed, A.K. Alkhalaf, and R. Dambul, 2017: Assessment of Uncertainties in Projected Temperature and Precipitation over the Arabian Peninsula Using Three Categories of Cmip5 Multimodel Ensembles. Earth Systems and Environment, 1(2) , 23, doi: 10.1007/s41748-017-0027-5.
Almazroui, M., M.N. Islam, S. Saeed, F. Saeed, and M. Ismail, 2020a: Future changes in climate over the Arabian Peninsula based on CMIP6 multimodel simulations. Earth Systems and Environment, 4(4) , 611–630, doi: 10.1007/s41748-020-00183-5.
Almazroui, M., S. Saeed, F. Saeed, M.N. Islam, and M. Ismail, 2020b: Projections of Precipitation and Temperature over the South Asian Countries in CMIP6. Earth Systems and Environment, 4(2) , 297–320, doi: 10.1007/s41748-020-00157-7.
Almazroui, M. et al., 2020c: Projected Change in Temperature and Precipitation Over Africa from CMIP6. Earth Systems and Environment, 4(3) , 455–475, doi: 10.1007/s41748-020-00161-x.
Almazroui, M. et al., 2021: Projected Changes in Temperature and Precipitation Over the United States, Central America, and the Caribbean in CMIP6 GCMs. Earth Systems and Environment, 5(1) , 1–24, doi: 10.1007/s41748-021-00199-5.
Almeida, C.T., J.F. Oliveira-Júnior, R.C. Delgado, P. Cubo, and M.C. Ramos, 2017: Spatiotemporal rainfall and temperature trends throughout the Brazilian Legal Amazon, 1973–2013. International Journal of Climatology, 37(4) , 2013–2026, doi: 10.1002/joc.4831.
AlSarmi, S. and R. Washington, 2011: Recent observed climate change over the Arabian Peninsula. Journal of Geophysical Research: Atmospheres, 116(D11) , D11109, doi: 10.1029/2010jd015459.
Altnau, S., E. Schlosser, E. Isaksson, and D. Divine, 2015: Climatic signals from 76 shallow firn cores in Dronning Maud Land, East Antarctica. The Cryosphere, 9(3) , 925–944, doi: 10.5194/tc-9-925-2015.
Alves, L.M., 2016: Análise estatística da sazonalidade e tendências das estações chuvosas e seca na Amazônia: Clima presente e projeções futuras. PhD Thesis, National Institute for Space Research (INPE), São José dos Campos, Brazil, 140 pp., http://urlib.net/8JMKD3MGP3W34P/3L9KTPH.
Alves, L.M., R. Chadwick, A. Moise, J. Brown, and J.A. Marengo, 2021: Assessment of rainfall variability and future change in Brazil across multiple timescales. International Journal of Climatology, 41(S1) , E1875–E1888, doi: 10.1002/joc.6818.
Amador, J., 1998: A climatic feature of the tropical Americas: The trade wind easterly jet. Tópicos Meteorológicos y Oceanográficos, 5, 91–102.
AMAP, 2017: Snow, Water, Ice and Permafrost in the Arctic (SWIPA) 2017. Arctic Monitoring and Assessment Programme (AMAP), Oslo, Norway, 269 pp., www.amap.no/documents/doc/snow-water-ice-and-permafrost-in-the-arctic-swipa-2017/1610.
AMAP, 2019: AMAP Climate Change Update 2019: An Update to Key Findings of Snow, Water, Ice and Permafrost in the Arctic (SWIPA) 2017. Arctic Monitoring and Assessment Programme (AMAP), Oslo, Norway, 12 pp., www.amap.no/documents/doc/amap-climate-change-update-2019/1761.
Ambrizzi, T., M.S. Reboita, R.P. da Rocha, and M. Llopart, 2019: The state of the art and fundamental aspects of regional climate modeling in South America. Annals of the New York Academy of Sciences, 1436(1) , 98–120, doi: 10.1111/nyas.13932.
Anderson, T.G., K.J. Anchukaitis, D. Pons, and M. Taylor, 2019: Multiscale trends and precipitation extremes in the Central American Midsummer Drought. Environmental Research Letters, 14(12) , 124016, doi: 10.1088/1748-9326/ab5023.
Angeles-Malaspina, M., J.E. González-Cruz, and N. Ramírez-Beltran, 2018: Projections of Heat Waves Events in the Intra-Americas Region Using Multimodel Ensemble. Advances in Meteorology, 2018, 1–16, doi: 10.1155/2018/7827984.
Anyah, R.O. and W. Qiu, 2012: Characteristic 20th and 21st century precipitation and temperature patterns and changes over the Greater Horn of Africa. International Journal of Climatology, 32(3) , 347–363, doi: 10.1002/joc.2270.
Araya-Osses, D., A. Casanueva, C. Román-Figueroa, J.M. Uribe, and M. Paneque, 2020: Climate change projections of temperature and precipitation in Chile based on statistical downscaling. Climate Dynamics, 54(9–10) , 4309–4330, doi: 10.1007/s00382-020-05231-4.
Ashfaq, M. et al., 2016: High-resolution ensemble projections of near-term regional climate over the continental United States. Journal of Geophysical Research: Atmospheres, 121(17) , 9943–9963, doi: 10.1002/2016jd025285.
Ashfaq, M. et al., 2021: Robust late twenty-first century shift in the regional monsoons in RegCM-CORDEX simulations. Climate Dynamics, 57(5–6) , 1463–1488, doi: 10.1007/s00382-020-05306-2.
Atif, R.M. et al., 2020: Extreme precipitation events over Saudi Arabia during the wet season and their associated teleconnections. Atmospheric Research, 231, 104655, doi: 10.1016/j.atmosres.2019.104655.
Attada, R. et al., 2019: Surface air temperature variability over the Arabian Peninsula and its links to circulation patterns. International Journal of Climatology, 39(1) , 445–464, doi: 10.1002/joc.5821.
Bach, L., C. Schraff, J.D. Keller, and A. Hense, 2016: Towards a probabilistic regional reanalysis system for Europe: evaluation of precipitation from experiments. Tellus A: Dynamic Meteorology and Oceanography, 68(1) , 32209, doi: 10.3402/tellusa.v68.32209.
Baidya Roy, S., M. Smith, L. Morris, N. Orlovsky, and A. Khalilov, 2014: Impact of the desiccation of the Aral Sea on summertime surface air temperatures. Journal of Arid Environments, 110, 79–85, doi: 10.1016/j.jaridenv.2014.06.008.
Bailey, R.T., A. Khalil, and V. Chatikavanij, 2015: Estimating Current and Future Groundwater Resources of the Maldives. JAWRA Journal of the American Water Resources Association, 51(1) , 112–122, doi: 10.1111/jawr.12236.
Bailey, R.T., K. Barnes, and C.D. Wallace, 2016: Predicting Future Groundwater Resources of Coral Atoll Islands. Hydrological Processes, 30(13) , 2092–2105, doi: 10.1002/hyp.10781.
Baker, M., 2016: 1,500 scientists lift the lid on reproducibility. Nature, 533(7604) , 452–454, doi: 10.1038/533452a.
Balabukh, V. and L. Malitskaya, 2017: Assessment of the current changes in the thermal regime of Ukraine. Geoinformatika, 4(64) , 34–49, w ww.geology.com.ua/en/7176-2/.
Ban, N. et al., 2021: The first multi-model ensemble of regional climate simulations at kilometer-scale resolution, part I: evaluation of precipitation. Climate Dynamics, 57(1–2) , 275–302, doi: 10.1007/s00382-021-05708-w.
Banwell, A.F., D.R. MacAyeal, and O. Sergienko, 2013: Breakup of the Larsen B Ice Shelf triggered by chain reaction drainage of supraglacial lakes. Geophysical Research Letters, 40(22) , 5872–5876, doi: 10.1002/2013gl057694.
Barkey, B. and R. Bailey, 2017: Estimating the Impact of Drought on Groundwater Resources of the Marshall Islands. Water, 9(1) , 41, doi: 10.3390/w9010041.
Barkhordarian, A., J. Bhend, and H. von Storch, 2012: Consistency of observed near surface temperature trends with climate change projections over the Mediterranean region. Climate Dynamics, 38(9–10) , 1695–1702, doi: 10.1007/s00382-011-1060-y.
Barlow, M., A. Hoell, and L. Agel, 2021: An Evaluation of CMIP6 Historical Simulations of the Cold Season Teleconnection between Tropical Indo-Pacific Sea Surface Temperatures and Precipitation in Southwest Asia, the Coastal Middle East, and Northern Pakistan and India. Journal of Climate, 34(16) , 6905–6926, doi: 10.1175/jcli-d-19-1026.1.
Barreiro, M., 2010: Influence of ENSO and the South Atlantic Ocean on climate predictability over Southeastern South America. Climate Dynamics, 35(7–8) , 1493–1508, doi: 10.1007/s00382-009-0666-9.
Barros, V.R. and M.E. Doyle, 2018: Low-level circulation and precipitation simulated by CMIP5 GCMS over southeastern South America. International Journal of Climatology, 38(15) , 5476–5490, doi: 10.1002/joc.5740.
Barros, V.R. et al., 2015: Climate change in Argentina: trends, projections, impacts and adaptation. WIREs Climate Change, 6(2) , 151–169, doi: 10.1002/wcc.316.
Bartók, B. et al., 2017: Projected changes in surface solar radiation in CMIP5 global climate models and in EURO-CORDEX regional climate models for Europe. Climate Dynamics, 49(7–8) , 2665–2683, doi: 10.1007/s00382-016-3471-2.
Bassiouni, M. and D.S. Oki, 2013: Trends and shifts in streamflow in Hawai’i, 1913–2008. Hydrological Processes, 27(10) , 1484–1500, doi: 10.1002/hyp.9298.
Beaumet, J., M. Déqué, G. Krinner, C. Agosta, and A. Alias, 2019: Effect of prescribed sea surface conditions on the modern and future Antarctic surface climate simulated by the ARPEGE atmosphere general circulation model. Cryosphere, 13(11) , 3023–3043, doi: 10.5194/tc-13-3023-2019.
Beck, H.E. et al., 2017: Global-scale evaluation of 22 precipitation datasets using gauge observations and hydrological modeling. Hydrology and Earth System Sciences, 21(12) , 6201–6217, doi: 10.5194/hess-21-6201-2017.
Bedia, J. and D. San Martin, 2021: Repository of Metaclip vocabularies for climate products. Zenodo. Retrieved from: https://doi.org/10.5281/zenodo.4707187.
Bedia, J. et al., 2019: The METACLIP semantic provenance framework for climate products. Environmental Modelling & Software, 119, 445–457, doi: 10.1016/j.envsoft.2019.07.005.
Beharry, S.L., R.M. Clarke, and K. Kumarsingh, 2015: Variations in extreme temperature and precipitation for a Caribbean island: Trinidad. Theoretical and Applied Climatology, 122(3) , 783–797, doi: 10.1007/s00704-014-1330-9.
Belmar, Y.N., K.E. McNamara, and T.H. Morrison, 2016: Water security in small island developing states: the limited utility of evolving governance paradigms. WIREs Water, 3, 181–193, doi: 10.1002/wat2.1129.
Berg, P., L. Norin, and J. Olsson, 2016: Creation of a high resolution precipitation data set by merging gridded gauge data and radar observations for Sweden. Journal of Hydrology, 541, 6–13, doi: 10.1016/j.jhydrol.2015.11.031.
Berthou, S. et al., 2020: Pan-European climate at convection-permitting scale: a model intercomparison study. Climate Dynamics, 55(1–2) , 35–59, doi: 10.1007/s00382-018-4114-6.
Bettolli, M.L. and O.C. Penalba, 2018: Statistical downscaling of daily precipitation and temperatures in southern La Plata Basin. International Journal of Climatology, 38(9) , 3705–3722, doi: 10.1002/joc.5531.
Bettolli, M.L. et al., 2021: The CORDEX Flagship Pilot Study in southeastern South America: a comparative study of statistical and dynamical downscaling models in simulating daily extreme precipitation events. Climate Dynamics, 56(5–6) , 1589–1608, doi: 10.1007/s00382-020-05549-z.
Bian, Q. et al., 2020: Multiscale Changes in Snow Over the Tibetan Plateau During 1980–2018 Represented by Reanalysis Data Sets and Satellite Observations. Journal of Geophysical Research: Atmospheres, 125(19) , e2019JD031914, doi: 10.1029/2019jd031914.
Biasutti, M., 2013: Forced Sahel rainfall trends in the CMIP5 archive. Journal of Geophysical Research: Atmospheres, 118(4) , 1613–1623, doi: 10.1002/jgrd.50206.
Biasutti, M., 2019: Rainfall trends in the African Sahel: Characteristics, processes, and causes. WIREs Climate Change, 10(4) , e591, doi: 10.1002/wcc.591.
Bindoff, N.L. et al., 2013: Detection and attribution of climate change: from global to regional. In: Climate Change 2013: The Physical Science Basis. Contribution of Working Group I to the Fifth Assessment Report of the Intergovernmental Panel on Climate Change[Stocker, T.F., D. Qin, G.-K. Plattner, M. Tignor, S.K. Allen, J. Boschung, A. Nauels, Y. Xia, V. Bex, and P.M. Midgley (eds.)]. Cambridge University Press, Cambridge, United Kingdom and New York, NY, USA, pp. 867–952, doi: 10.1017/cbo9781107415324.022.
Bintanja, R., 2018: The impact of Arctic warming on increased rainfall. Scientific Reports, 8(1) , 16001, doi: 10.1038/s41598-018-34450-3.
Bintanja, R. and E.C. Van Der Linden, 2013: The changing seasonal climate in the Arctic. Scientific Reports, 3, 1–8, doi: 10.1038/srep01556.
Bintanja, R. and F.M. Selten, 2014: Future increases in Arctic precipitation linked to local evaporation and sea-ice retreat. Nature, 509(7501) , 479–482, doi: 10.1038/nature13259.
Bintanja, R. and F. Krikken, 2016: Magnitude and pattern of Arctic warming governed by the seasonality of radiative forcing. Scientific Reports, 6, 1–7, doi: 10.1038/srep38287.
Bintanja, R. and O. Andry, 2017: Towards a rain-dominated Arctic. Nature Climate Change, 7(4) , 263–267, doi: 10.1038/nclimate3240.
Bintanja, R., C. Severijns, R. Haarsma, and W. Hazeleger, 2014: The future of Antarctica’s surface winds simulated by a high-resolution global climate model: 1. Model description and validation. Journal of Geophysical Research: Atmospheres, 119(12) , 7136–7159, doi: 10.1002/2013jd020847.
Bintanja, R. et al., 2020: Strong future increases in Arctic precipitation variability linked to poleward moisture transport. Science Advances, 6(7) , eaax6869, doi: 10.1126/sciadv.aax6869.
Blackport, R., J.A. Screen, K. van der Wiel, and R. Bintanja, 2019: Minimal influence of reduced Arctic sea ice on coincident cold winters in mid-latitudes. Nature Climate Change, 9(9) , 697–704, doi: 10.1038/s41558-019-0551-4.
Blázquez, J. and M.N. Nuñez, 2013a: Analysis of uncertainties in future climate projections for South America: comparison of WCRP-CMIP3 and WCRP-CMIP5 models. Climate Dynamics, 41(3–4) , 1039–1056, doi: 10.1007/s00382-012-1489-7.
Blázquez, J. and M.N. Nuñez, 2013b: Performance of a high resolution global model over southern South America. International Journal of Climatology, 33(4) , 904–919, doi: 10.1002/joc.3478.
Blunden, J. and D.S. Arndt, 2019: State of the Climate in 2018. Bulletin of the American Meteorological Society, 100(9) , Si–S306, doi: 10.1175/2019bamsstateoftheclimate.1.
Bodart, J.A. and R.J. Bingham, 2019: The Impact of the Extreme 2015–2016 El Niño on the Mass Balance of the Antarctic Ice Sheet. Geophysical Research Letters, 46(23) , 13862–13871, doi: 10.1029/2019gl084466.
Boé, J. and L. Terray, 2014: Land–sea contrast, soil–atmosphere and cloud-temperature interactions: interplays and roles in future summer European climate change. Climate Dynamics, 42(3–4) , 683–699, doi: 10.1007/s00382-013-1868-8.
Boé, J., S. Somot, L. Corre, and P. Nabat, 2020a: Large discrepancies in summer climate change over Europe as projected by global and regional climate models: causes and consequences. Climate Dynamics, 54(5–6) , 2981–3002, doi: 10.1007/s00382-020-05153-1.
Boé, J. et al., 2020b: Past long-term summer warming over western Europe in new generation climate models: Role of large-scale atmospheric circulation. Environmental Research Letters, 15(8) , 84038, doi: 10.1088/1748-9326/ab8a89.
Boening, C., M. Lebsock, F. Landerer, and G. Stephens, 2012: Snowfall-driven mass change on the East Antarctic ice sheet. Geophysical Research Letters, 39(21) , L21501, doi: 10.1029/2012gl053316.
Boisier, J.P. et al., 2018: Anthropogenic drying in central-southern Chile evidenced by long-term observations and climate model simulations. Elementa: Science of the Anthropocene, 6(1) , 74, doi: 10.1525/elementa.328.
Boisvert, L.N. et al., 2018: Intercomparison of precipitation estimates over the Arctic ocean and its peripheral seas from reanalyses. Journal of Climate, 31(20) , 8441–8462, doi: 10.1175/jcli-d-18-0125.1.
Bollmeyer, C. et al., 2015: Towards a high-resolution regional reanalysis for the european CORDEX domain. Quarterly Journal of the Royal Meteorological Society, 141(686) , 1–15, doi: 10.1002/qj.2486.
BOM and CSIRO, 2014: Climate Variability, Extremes and Change in the Western Tropical Pacific: New Science and Updated Country Reports 2014. Bureau of Meteorology (BOM) and Commonwealth Scientific and Industrial Research Organisation (CSIRO), Australia, 372 pp., www.pacificclimatechangescience.org/wp-content/uploads/2014/07/PACCSAP_CountryReports2014_CoverForwardContents_WEB_140710.pdf .
BOM and CSIRO, 2018: State of the Climate 2018. Bureau of Meteorology (BOM) and Commonwealth Scientific and Industrial Research Organisation (CSIRO), Australia, 24 pp., www.bom.gov.au/state-of-the-climate/State-of-the-Climate-2018.pdf .
BOM and CSIRO, 2020: State of the climate 2020. Bureau of Meteorology (BOM) and Commonwealth Scientific and Industrial Research Organisation (CSIRO), Australia, 23 pp., www.bom.gov.au/state-of-the-climate/documents/State-of-the-Climate-2020.pdf .
Borges, P.A., K. Barfus, H. Weiss, and C. Bernhofer, 2017: Extended predictor screening, application and added value of statistical downscaling of a CMIP5 ensemble for single-site projections in Distrito Federal, Brazil. International Journal of Climatology, 37(1) , 46–65, doi: 10.1002/joc.4686.
Boulanger, J.P., A.F. Carril, and E. Sanchez, 2016: CLARIS-La Plata Basin: regional hydroclimate variability, uncertainties and climate change scenarios. Climate Research, 68(2–3) , 93–94, doi: 10.3354/cr01392.
Box, J.E. et al., 2019: Key indicators of Arctic climate change: 1971–2017. Environmental Research Letters, 14(4) , 045010, doi: 10.1088/1748-9326/aafc1b.
Boychenko, S. et al., 2016: Features of Climate Change on Ukraine: Scenarios, Consequences for Nature and Agroecosystems. Proceedings of the National Aviation University, 69(4) , 96–113, doi: 10.18372/2306-1472.69.11061.
Bozkurt, D., M. Rojas, J.P. Boisier, and J. Valdivieso, 2018a: Projected hydroclimate changes over Andean basins in central Chile from downscaled CMIP5 models under the low and high emission scenarios. Climatic Change, 150(3) , 131–147, doi: 10.1007/s10584-018-2246-7.
Bozkurt, D., R. Rondanelli, J.C. Marín, and R. Garreaud, 2018b: Foehn Event Triggered by an Atmospheric River Underlies Record-Setting Temperature Along Continental Antarctica. Journal of Geophysical Research: Atmospheres, 123(8) , 3871–3892, doi: 10.1002/2017jd027796.
Bozkurt, D. et al., 2019: Dynamical downscaling over the complex terrain of southwest South America: present climate conditions and added value analysis. Climate Dynamics, 53(11) , 6745–6767, doi: 10.1007/s00382-019-04959-y.
Bozkurt, D. et al., 2020: Recent Near-surface Temperature Trends in the Antarctic Peninsula from Observed, Reanalysis and Regional Climate Model Data. Advances in Atmospheric Sciences, 37(5) , 477–493, doi: 10.1007/s00376-020-9183-x.
Bracegirdle, T.J., D.B. Stephenson, J. Turner, and T. Phillips, 2015: The importance of sea ice area biases in 21st century multimodel projections of Antarctic temperature and precipitation. Geophysical Research Letters, 42(24) , 10832–10839, doi: 10.1002/2015gl067055.
Bracegirdle, T.J. et al., 2019: Back to the Future: Using Long-Term Observational and Paleo-Proxy Reconstructions to Improve Model Projections of Antarctic Climate. Geosciences, 9(6) , 255, doi: 10.3390/geosciences9060255.
Bracegirdle, T.J. et al., 2020a: Improvements in Circumpolar Southern Hemisphere Extratropical Atmospheric Circulation in CMIP6 Compared to CMIP5. Earth and Space Science, 7(6) , e2019EA001065, doi: 10.1029/2019ea001065.
Bracegirdle, T.J. et al., 2020b: Twenty first century changes in Antarctic and Southern Ocean surface climate in CMIP6. Atmospheric Science Letters, 21(9) , e984, doi: 10.1002/asl.984.
Brogli, R. et al., 2019: The Role of Hadley Circulation and Lapse-Rate Changes for the Future European Summer Climate. Journal of Climate, 32(2) , 385–404, doi: 10.1175/jcli-d-18-0431.1.
Bromwich, D.H. et al., 2013: Central West Antarctica among the most rapidly warming regions on Earth. Nature Geoscience, 6(2) , 139–145, doi: 10.1038/ngeo1671.
Bromwich, D.H. et al., 2014: Correction: Corrigendum: Central West Antarctica among the most rapidly warming regions on Earth. Nature Geoscience, 7(1) , 76–76, doi: 10.1038/ngeo2016.
Brown, J.R., A.F. Moise, and R.A. Colman, 2017: Projected increases in daily to decadal variability of Asian-Australian monsoon rainfall. Geophysical Research Letters, 44(11) , 5683–5690, doi: 10.1002/2017gl073217.
Brown, J.R., A.F. Moise, R. Colman, and H. Zhang, 2016: Will a Warmer World Mean a Wetter or Drier Australian Monsoon?Journal of Climate, 29(12) , 4577–4596, doi: 10.1175/jcli-d-15-0695.1.
Brown, R.D., B. Fang, and L. Mudryk, 2019: Update of Canadian Historical Snow Survey Data and Analysis of Snow Water Equivalent Trends, 1967–2016. Atmosphere-Ocean, 57(2) , 149–156, doi: 10.1080/07055900.2019.1598843.
Brunetti, M., M. Maugeri, F. Monti, and T. Nanni, 2006: Temperature and precipitation variability in Italy in the last two centuries from homogenised instrumental time series. International Journal of Climatology, 26(3) , 345–381, doi: 10.1002/joc.1251.
Brunke, M.A. et al., 2018: Evaluation of the atmosphere–land–ocean–sea ice interface processes in the Regional Arctic System Model version 1 (RASM1) using local and globally gridded observations. Geoscientific Model Development, 11(12) , 4817–4841, doi: 10.5194/gmd-11-4817-2018.
Bucchignani, E., L. Cattaneo, H.J. Panitz, and P. Mercogliano, 2016: Sensitivity analysis with the regional climate model COSMO-CLM over the CORDEX-MENA domain. Meteorology and Atmospheric Physics, 128(1) , 73–95, doi: 10.1007/s00703-015-0403-3.
Bucchignani, E., P. Mercogliano, H.J. Panitz, and M. Montesarchio, 2018: Climate change projections for the Middle East–North Africa domain with COSMO-CLM at different spatial resolutions. Advances in Climate Change Research, 9(1) , 66–80, doi: 10.1016/j.accre.2018.01.004.
Bukovsky, M.S. and L.O. Mearns, 2020: Regional climate change projections from NA-CORDEX and their relation to climate sensitivity. Climatic Change, 162(2) , 645–665, doi: 10.1007/s10584-020-02835-x.
Bukovsky, M.S., D.J. Gochis, and L.O. Mearns, 2013: Towards Assessing NARCCAP Regional Climate Model Credibility for the North American Monsoon: Current Climate Simulations. Journal of Climate, 26(22) , 8802–8826, doi: 10.1175/jcli-d-12-00538.1.
Bukovsky, M.S. et al., 2015: Toward Assessing NARCCAP Regional Climate Model Credibility for the North American Monsoon: Future Climate Simulations. Journal of Climate, 28(17) , 6707–6728, doi: 10.1175/jcli-d-14-00695.1.
Bulygina, O.N., N.N. Korshunova, and V.N. Razuvaev, 2014: Specialized datasets for climate research. Trudy of VNIIGMI-WDC, 177, http://meteo.ru/publications/125-trudy-vniigmi/trudy-vniigmi-mtsd-vypusk-177-2014-g/518-spetsializirovannye-massivy-dannykh-dlya-klimaticheskikh-issledovanij.
Bulygina, O.N., N.N. Korshunova, and V.N. Razuvaev, 2017: Monitoring snow cover on the territory of Russia [in Russian]. Proceedings of Hydrometcentre of Russia, 366, 87–96, http://method.meteorf.ru/publ/tr/tr366/bulig.pdf .
Bulygina, O.N., P.Y. Groisman, V.N. Razuvaev, and N.N. Korshunova, 2011: Changes in snow cover characteristics over Northern Eurasia since 1966. Environmental Research Letters, 6(4) , 45204–45214, doi: 10.1088/1748-9326/6/4/045204.
Burger, F., B. Brock, and A. Montecinos, 2018: Seasonal and elevational contrasts in temperature trends in Central Chile between 1979 and 2015. Global and Planetary Change, 162, 136–147, doi: 10.1016/j.gloplacha.2018.01.005.
Burns, W.C.G., 2002: Pacific Island Developing Country Water Resources and Climate Change. In: World’s Water 2002–2003: The Biennial Report on Freshwater Resources[Gleick, P.H., W.C.G. Burns, E.L. Chalecki, and M. Cohen (eds.)]. Island Press, Washington, DC, USA, pp. 113–131, https://pacinst.org/wp-content/uploads/2013/02/worlds_water_2002_chapter53.pdf .
Bush, E. and D.S. Lemmen (eds.), 2019: Canada’s Changing Climate Report. Government of Canada, Ottawa, ON, Canada, 444 pp., www.changingclimate.ca/CCCR2019.
Cabos, W. et al., 2019: Dynamical downscaling of historical climate over CORDEX Central America domain with a regionally coupled atmosphere–ocean model. Climate Dynamics, 52(7–8) , 4305–4328, doi: 10.1007/s00382-018-4381-2.
Cai, P. et al., 2019: Agriculture intensification increases summer precipitation in Tianshan Mountains, China. Atmospheric Research, 227, 140–146, doi: 10.1016/j.atmosres.2019.05.005.
Callaghan, T. et al., 2011: The Changing Face of Arctic Snow Cover: A Synthesis of Observed and Projected Changes. AMBIO, 40(S1) , 17–31, doi: 10.1007/s13280-011-0212-y.
Campbell, J.D., M.A. Taylor, T.S. Stephenson, R.A. Watson, and F.S. Whyte, 2011: Future climate of the Caribbean from a regional climate model. International Journal of Climatology, 31(12) , 1866–1878, doi: 10.1002/joc.2200.
Camuffo, D. et al., 2013: Western Mediterranean precipitation over the last 300 years from instrumental observations. Climatic Change, 117(1–2) , 85–101, doi: 10.1007/s10584-012-0539-9.
Candan, K.S., H. Liu, and R. Suvarna, 2001: Resource Description Framework: Metadata and Its Applications. SIGKDD Explorations, 3(1) , 6–19, doi: 10.1145/507533.507536.
Cantet, P., M. Déqué, P. Palany, and J.-L. Maridet, 2014: The importance of using a high-resolution model to study the climate change on small islands: the Lesser Antilles case. Tellus A: Dynamic Meteorology and Oceanography, 66(1) , 24065, doi: 10.3402/tellusa.v66.24065.
Cantet, P., M.A. Boucher, S. Lachance-Coutier, R. Turcotte, and V. Fortin, 2019: Using a particle filter to estimate the spatial distribution of the snowpack water equivalent. Journal of Hydrometeorology, 20(4) , 577–594, doi: 10.1175/jhm-d-18-0140.1.
Cardoso, R.M., P.M.M. Soares, D.C.A. Lima, and A. Semedo, 2016: The impact of climate change on the Iberian low-level wind jet: EURO-CORDEX regional climate simulation. Tellus A: Dynamic Meteorology and Oceanography, 68(1) , 29005, doi: 10.3402/tellusa.v68.29005.
Carvalho, A.A. et al., 2020: Trends of rainfall and temperature in Northeast Brazil. Revista Brasileira de Engenharia Agrícola e Ambiental, 24(1) , 15–23, doi: 10.1590/1807-1929/agriambi.v24n1p15-23.
Carvalho, L.M., 2020: Assessing precipitation trends in the Americas with historical data: A review. WIREs Climate Change, 11(2) , e627, doi: 10.1002/wcc.627.
Casanueva, A. et al., 2016: Daily precipitation statistics in a EURO-CORDEX RCM ensemble: added value of raw and bias-corrected high-resolution simulations. Climate Dynamics, 47(3–4) , 719–737, doi: 10.1007/s00382-015-2865-x.
Casanueva, A. et al., 2020: Testing bias adjustment methods for regional climate change applications under observational uncertainty and resolution mismatch. Atmospheric Science Letters, 21(7) , e978, doi: 10.1002/asl.978.
Cashman, A., 2014: Water Security and Services in the Caribbean. Water, 6(5) , 1187–1203, doi: 10.3390/w6051187.
Cassano, J.J. et al., 2017: Development of the Regional Arctic System Model (RASM): Near-surface atmospheric climate sensitivity. Journal of Climate, 30(15) , 5729–5753, doi: 10.1175/jcli-d-15-0775.1.
Castro, C.L. et al., 2012: Can a Regional Climate Model Improve the Ability to Forecast the North American Monsoon?Journal of Climate, 25(23) , 8212–8237, doi: 10.1175/jcli-d-11-00441.1.
Cavazos, T. and S. Arriaga-Ramírez, 2012: Downscaled Climate Change Scenarios for Baja California and the North American Monsoon during the Twenty-First Century. Journal of Climate, 25(17) , 5904–5915, doi: 10.1175/jcli-d-11-00425.1.
Cavazos, T. et al., 2020: Climatic trends and regional climate models intercomparison over the CORDEX-CAM (Central America, Caribbean, and Mexico) domain. International Journal of Climatology, 40(3) , 1396–1420, doi: 10.1002/joc.6276.
Cavicchia, L. et al., 2018: Mediterranean extreme precipitation: a multi-model assessment. Climate Dynamics, 51(3) , 901–913, doi: 10.1007/s00382-016-3245-x.
Centella-Artola, A. et al., 2015: Assessing the effect of domain size over the Caribbean region using the PRECIS regional climate model. Climate Dynamics, 44(7–8) , 1901–1918, doi: 10.1007/s00382-014-2272-8.
Centella-Artola, A. et al., 2020: Evaluation of Sixteen Gridded Precipitation Datasets over the Caribbean Region Using Gauge Observations. Atmosphere, 11(12) , 1334, doi: 10.3390/atmos11121334.
Cerezo-Mota, R. et al., 2016: CORDEX-NA: factors inducing dry/wet years on the North American Monsoon region. International Journal of Climatology, 36(2) , 824–836, doi: 10.1002/joc.4385.
Charles, S.P., F.H. Chiew, and H. Zheng, 2016: Climate change and water in south Asia – overview and literature review. CSIRO Sustainable Development Investment Portfolio project. CSIRO Land and Water, Australia, 31 pp., https://publications.csiro.au/rpr/pub?list=SEA&pid=csiro:EP156957& .
Chattopadhyay, M. and J. Katzfey, 2015: Simulating the climate of South Pacific islands using a high resolution model. International Journal of Climatology, 35(6) , 1157–1171, doi: 10.1002/joc.4046.
Chen, F.H., W. Huang, L.Y. Jin, J.H. Chen, and J.S. Wang, 2011: Spatiotemporal precipitation variations in the arid Central Asia in the context of global warming. Science China Earth Sciences, 54(12) , 1812–1821, doi: 10.1007/s11430-011-4333-8.
Chen, L., X. Qu, G. Huang, and Y. Gong, 2019: Projections of East Asian summer monsoon under 1.5°C and 2°C warming goals. Theoretical and Applied Climatology, 137(3) , 2187–2201, doi: 10.1007/s00704-018-2720-1.
Chen, S. et al., 2019: Added Value of a Dynamical Downscaling Approach for Simulating Precipitation and Temperature Over Tianshan Mountains Area, Central Asia. Journal of Geophysical Research: Atmospheres, 124(21) , 11051–11069, doi: 10.1029/2019jd031016.
Cheong, W.K. et al., 2018: Observed and modelled temperature and precipitation extremes over Southeast Asia from 1972 to 2010. International Journal of Climatology, 38(7) , 3013–3027, doi: 10.1002/joc.5479.
Cherif, S. et al., 2020: Drivers of change. In: Climate and Environmental Change in the Mediterranean Basin – Current Situation and Risks for the Future. First Mediterranean Assessment Report[Cramer, W., J. Guiot, and K. Marini (eds.)]. Union for the Mediterranean, Plan Bleu, UNEP/MAP, Marseille, France, pp. 59–180, doi: 10.5281/zenodo.4768833.
Chernokulsky, A. et al., 2019: Observed changes in convective and stratiform precipitation in Northern Eurasia over the last five decades. Environmental Research Letters, 14(4) , 045001, doi: 10.1088/1748-9326/aafb82.
Chinn, T., B.B. Fitzharris, A. Willsman, and M.J. Salinger, 2012: Annual ice volume changes 1976–2008 for the New Zealand Southern Alps. Global and Planetary Change, 92–93, 105–118, doi: 10.1016/j.gloplacha.2012.04.002.
Choi, J.-W. and Y. Cha, 2015: Interdecadal Variation in the Activity of Tropical Cyclones Affecting Korea. Tropical Cyclone Research and Review, 4(2) , 88–93, doi: 10.6057/2015tcrr02.05.
Chou, S.C. et al., 2014: Assessment of Climate Change over South America under RCP 4.5 and 8.5 Downscaling Scenarios. American Journal of Climate Change, 3(5) , 512–527, doi: 10.4236/ajcc.2014.35043.
Choudhary, A. and A.P. Dimri, 2018: Assessment of CORDEX-South Asia experiments for monsoonal precipitation over Himalayan region for future climate. Climate Dynamics, 50(7–8) , 3009–3030, doi: 10.1007/s00382-017-3789-4.
Christensen, J.H. et al., 2013: Climate Phenomena and their Relevance for Future Regional Climate Change. In: Climate Change 2013: The Physical Science Basis. Contribution of Working Group I to the Fifth Assessment Report of the Intergovernmental Panel on Climate Change[Stocker, T.F., D. Qin, G.-K. Plattner, M. Tignor, S.K. Allen, J. Boschung, A. Nauels, Y. Xia, V. Bex, and P.M. Midgley (eds.)]. Cambridge University Press, Cambridge, United Kingdom and New York, NY, USA, pp. 1217–1308, doi: 10.1017/cbo9781107415324.028.
Chung, J.X., L. Juneng, F. Tangang, and A.F. Jamaluddin, 2018: Performances of BATS and CLM land-surface schemes in RegCM4 in simulating precipitation over CORDEX Southeast Asia domain. International Journal of Climatology, 38(2) , 794–810, doi: 10.1002/joc.5211.
Church, J.A. et al., 2013: Sea Level Change. In: Climate Change 2013: The Physical Science Basis. Contribution of Working Group I to the Fifth Assessment Report of the Intergovernmental Panel on Climate Change[Stocker, T.F., D. Qin, G.-K. Plattner, M. Tignor, S.K. Allen, J. Boschung, A. Nauels, Y. Xia, V. Bex, and P.M. Midgley (eds.)]. Cambridge University Press, Cambridge, United Kingdom and New York, NY, USA, pp. 1137–1216, doi: 10.1017/CBO9781107415324.026.
Chylek, P. et al., 2016: Indirect aerosol effect increases CMIP5 models’ projected arctic warming. Journal of Climate, 29(4) , 1417–1428, doi: 10.1175/jcli-d-15-0362.1.
Ciarlo`, J.M. et al., 2021: A new spatially distributed added value index for regional climate models: the EURO-CORDEX and the CORDEX-CORE highest resolution ensembles. Climate Dynamics, 57(5–6) , 1403–1424, doi: 10.1007/s00382-020-05400-5.
Cinco, T.A., R.G. de Guzman, F.D. Hilario, and D.M. Wilson, 2014: Long-term trends and extremes in observed daily precipitation and near surface air temperature in the Philippines for the period 1951–2010. Atmospheric Research, 145–146, 12–26, doi: 10.1016/j.atmosres.2014.03.025.
Clark, J.P. and S. Lee, 2019: The Role of the Tropically Excited Arctic Warming Mechanism on the Warm Arctic Cold Continent Surface Air Temperature Trend Pattern. Geophysical Research Letters, 46(14) , 8490–8499, doi: 10.1029/2019gl082714.
Clem, K.R. et al., 2020: Record warming at the South Pole during the past three decades. Nature Climate Change, 10(8) , 762–770, doi: 10.1038/s41558-020-0815-z.
Cohen, J. et al., 2014: Recent Arctic amplification and extreme mid-latitude weather. Nature Geoscience, 7(9) , 627–637, doi: 10.1038/ngeo2234.
Collins, J.M., 2011: Temperature variability over Africa. Journal of Climate, 24, 3649–3666, doi: 10.1175/2011jcli3753.1.
Collins, M. et al., 2013: Long Term Climate Change: Projections, Commitments and Irreversibility. In: Climate Change 2013: The Physical Science Basis. Contribution of Working Group I to the Fifth Assessment Report of the Intergovernmental Panel on Climate Change[Stocker, T.F., D. Qin, G.-K. Plattner, M. Tignor, S.K. Allen, J. Boschung, A. Nauels, Y. Xia, V. Bex, and P.M. Midgley (eds.)]. Cambridge University Press, Cambridge, United Kingdom and New York, NY, USA, pp. 1029–1136, doi: 10.1017/CBO9781107415324.024.
Colorado-Ruiz, G., T. Cavazos, J.A. Salinas, P. De Grau, and R. Ayala, 2018: Climate change projections from Coupled Model Intercomparison Project phase 5 multi-model weighted ensembles for Mexico, the North American monsoon, and the mid-summer drought region. International Journal of Climatology, 38(15) , 5699–5716, doi: 10.1002/joc.5773.
Comiso, J.C. and D.K. Hall, 2014: Climate trends in the Arctic as observed from space. WIREs Climate Change, 5(3) , 389–409, doi: 10.1002/wcc.277.
Condom, T. et al., 2020: Climatological and Hydrological Observations for the South American Andes: In situStations, Satellite, and Reanalysis Data Sets. Frontiers in Earth Science, 8, 92, doi: 10.3389/feart.2020.00092.
Coppola, E. et al., 2014: Present and future climatologies in the phase I CREMA experiment. Climatic Change, 125(1) , 23–38, doi: 10.1007/s10584-014-1137-9.
Coppola, E. et al., 2021a: Assessment of the European Climate Projections as Simulated by the Large EURO-CORDEX Regional and Global Climate Model Ensemble. Journal of Geophysical Research: Atmospheres, 126(4) , e2019JD032356, doi: 10.1029/2019jd032356.
Coppola, E. et al., 2021b: Climate hazard indices projections based on CORDEX-CORE, CMIP5 and CMIP6 ensemble. Climate Dynamics, 57(5–6) , 1293–1383, doi: 10.1007/s00382-021-05640-z.
Cornes, R.C., G. van der Schrier, E.J.M. van den Besselaar, and P.D. Jones, 2018: An Ensemble Version of the E-OBS Temperature and Precipitation Data Sets. Journal of Geophysical Research: Atmospheres, 123(17) , 9391–9409, doi: 10.1029/2017jd028200.
Corrales-Suastegui, A., R. Fuentes-Franco, and E.G. Pavia, 2020: The mid-summer drought over Mexico and Central America in the 21st century. International Journal of Climatology, 40(3) , 1703–1715, doi: 10.1002/joc.6296.
Cruz, F.T. and H. Sasaki, 2017: Simulation of Present Climate over Southeast Asia Using the Non-Hydrostatic Regional Climate Model. SOLA, 13, 13–18, doi: 10.2151/sola.2017-003.
Cruz, F.T. et al., 2017: Sensitivity of temperature to physical parameterization schemes of RegCM4 over the CORDEX-Southeast Asia region. International Journal of Climatology, 37(15) , 5139–5153, doi: 10.1002/joc.5151.
CSGM, 2012: State of the Jamaican Climate 2012: Information for Resilience Building (Full Report). Climate Studies Group, Mona (CSGM). Produced for the Planning Institute of Jamaica (PIOJ), Kingston, Jamaica, 179 pp., www.mona.uwi.edu/physics/sites/default/files/physics/uploads/STATE%20OF%20THE%20JAMAICAN%20CLIMATE%20Information%20for%20Resilience%20Building.pdf .
CSIRO and BOM, 2015: Climate Change in Australia. Projections for Australia’s Natural Resource Management Regions: Technical Report. Commonwealth Scientific and Industrial Research Organisation (CSIRO) and Bureau of Meteorology (BOM), Australia, 222 pp., www.climatechangeinaustralia. gov.au/en/communication-resources/reports/.
Cucchi, M. et al., 2020: WFDE5: bias-adjusted ERA5 reanalysis data for impact studies. Earth System Science Data, 12(3) , 2097–2120, doi: 10.5194/essd-12-2097-2020.
Cueto, R.O.G., A.T. Martínez, and E.J. Ostos, 2010: Heat waves and heat days in an arid city in the northwest of México: current trends and in climate change scenarios. International Journal of Biometeorology, 54(4) , 335–345, doi: 10.1007/s00484-009-0283-7.
Dahlgren, P., T. Landelius, P. Kållberg, and S. Gollvik, 2016: A high-resolution regional reanalysis for Europe. Part 1: Three-dimensional reanalysis with the regional HIgh-Resolution Limited-Area Model (HIRLAM). Quarterly Journal of the Royal Meteorological Society, 142(698) , 2119–2131, doi: 10.1002/qj.2807.
Dahlke, S. et al., 2020: The observed recent surface air temperature development across Svalbard and concurring footprints in local sea ice cover. International Journal of Climatology, 40(12) , 5246–5265, doi: 10.1002/joc.6517.
Dai, A., 2011: Drought under global warming: a review. WIREs Climate Change, 2(1) , 45–65, doi: 10.1002/wcc.81.
Darmaraki, S. et al., 2019: Future evolution of Marine Heatwaves in the Mediterranean Sea. Climate Dynamics, 53(3–4) , 1371–1392, doi: 10.1007/s00382-019-04661-z.
Daron, J.D., S. Lorenz, P. Wolski, R.C. Blamey, and C. Jack, 2015: Interpreting climate data visualisations to inform adaptation decisions. Climate Risk Management, 10, 17–26, doi: 10.1016/j.crm.2015.06.007.
Daron, J.D. et al., 2018: Providing future climate projections using multiple models and methods: insights from the Philippines. Climatic Change, 148(1–2) , 187–203, doi: 10.1007/s10584-018-2183-5.
Dash, S.K., M.A. Kulkarni, U.C. Mohanty, and K. Prasad, 2009: Changes in the characteristics of rain events in India. Journal of Geophysical Research: Atmospheres, 114(D10) , D10109, doi: 10.1029/2008jd010572.
Davin, E.L., E. Maisonnave, and S.I. Seneviratne, 2016: Is land surface processes representation a possible weak link in current Regional Climate Models?Environmental Research Letters, 11(7) , 74027, doi: 10.1088/1748-9326/11/7/074027.
Davy, R. and S. Outten, 2020: The Arctic Surface Climate in CMIP6: Status and Developments since CMIP5. Journal of Climate, 33(18) , 8047–8068, doi: 10.1175/jcli-d-19-0990.1.
Davy, R., L. Chen, and E. Hanna, 2018: Arctic amplification metrics. International Journal of Climatology, 38(12) , 4384–4394, doi: 10.1002/joc.5675.
de Abreu, R.C. et al., 2019: Contribution of Anthropogenic Climate Change to April–May 2017 Heavy Precipitation over the Uruguay River Basin. Bulletin of the American Meteorological Society, 100(1) , S37–S41, doi: 10.1175/bams-d-18-0102.1.
de Barros Soares, D., H. Lee, P.C. Loikith, A. Barkhordarian, and C.R. Mechoso, 2017: Can significant trends be detected in surface air temperature and precipitation over South America in recent decades?International Journal of Climatology, 37(3) , 1483–1493, doi: 10.1002/joc.4792.
de Coninck, H. et al., 2018: Strengthening and Implementing the Global Response. In: Global Warming of 1.5°C. An IPCC Special Report on the impacts of global warming of 1.5°C above pre-industrial levels and related global greenhouse gas emission pathways, in the context of strengthening the global response to the threat of climate change, sustainable development, and efforts to eradicate poverty[Masson-Delmotte, V., P. Zhai, H.-O. Pörtner, D. Roberts, J. Skea, P.R. Shukla, A. Pirani, W. Moufouma-Okia, C. Péan, R. Pidcock, S. Connors, J.B.R. Matthews, Y. Chen, X. Zhou, M.I. Gomis, E. Lonnoy, T. Maycock, M. Tignor, and T. Waterfield (eds.)]. In Press, pp. 313–443, www.ipcc.ch/sr15/chapter/chapter-4.
de Jesus, E.M. et al., 2016: Contribution of cold fronts to seasonal rainfall in simulations over the southern La Plata Basin. Climate Research, 68(2–3) , 243–255, doi: 10.3354/cr01358.
Degirmendžić, J., K. Kożuchowski, and E. Żmudzka, 2004: Changes of air temperature and precipitation in Poland in the period 1951–2000 and their relationship to atmospheric circulation. International Journal of Climatology, 24(3) , 291–310, doi: 10.1002/joc.1010.
Dell’Aquila, A. et al., 2018: Evaluation of simulated decadal variations over the Euro-Mediterranean region from ENSEMBLES to Med-CORDEX. Climate Dynamics, 51(3) , 857–876, doi: 10.1007/s00382-016-3143-2.
Delworth, T.L. and F. Zeng, 2014: Regional rainfall decline in Australia attributed to anthropogenic greenhouse gases and ozone levels. Nature Geoscience, 7(8) , 583–587, doi: 10.1038/ngeo2201.
Deng, H. and Y. Chen, 2017: Influences of recent climate change and human activities on water storage variations in Central Asia. Journal of Hydrology, 544, 46–57, doi: 10.1016/j.jhydrol.2016.11.006.
Deng, H., Y. Chen, H. Wang, and S. Zhang, 2015: Climate change with elevation and its potential impact on water resources in the Tianshan Mountains, Central Asia. Global and Planetary Change, 135, 28–37, doi: 10.1016/j.gloplacha.2015.09.015.
Déqué, M. and S. Somot, 2008: Analysis of heavy precipitation for France using high resolution ALADIN RCM simulations. Idöjaras Quaterly Journal of the Hungarian Meteorological Service, 112(3–4) , 179–190, www.met.hu/en/ismeret-tar/kiadvanyok/idojaras/index.php?id=178.
Deser, C. et al., 2020: Insights from Earth system model initial-condition large ensembles and future prospects. Nature Climate Change, 10(4) , 277–286, doi: 10.1038/s41558-020-0731-2.
Dey, R., S.C. Lewis, J.M. Arblaster, and N.J. Abram, 2019: A review of past and projected changes in Australia’s rainfall. WIREs Climate Change, 10(3) , e577, doi: 10.1002/wcc.577.
Dhurmea, K.R., R. Boojhawon, and S.D.D.V. Rughooputh, 2019: A drought climatology for Mauritius using the standardized precipitation index. Hydrological Sciences Journal, 64(2) , 227–240, doi: 10.1080/02626667.2019.1570209.
Di Luca, A., J.P. Evans, and F. Ji, 2018: Australian snowpack in the NARCliM ensemble: evaluation, bias correction and future projections. Climate Dynamics, 51(1) , 639–666, doi: 10.1007/s00382-017-3946-9.
Di Virgilio, G. et al., 2019: Evaluating reanalysis-driven CORDEX regional climate models over Australia: model performance and errors. Climate Dynamics, 53(5–6) , 2985–3005, doi: 10.1007/s00382-019-04672-w.
Di Virgilio, G. et al., 2020: Realised added value in dynamical downscaling of Australian climate change. Climate Dynamics, 54(11–12) , 4675–4692, doi: 10.1007/s00382-020-05250-1.
Diaconescu, E.P., A. Mailhot, R. Brown, and D. Chaumont, 2018: Evaluation of CORDEX-Arctic daily precipitation and temperature-based climate indices over Canadian Arctic land areas. Climate Dynamics, 50(5–6) , 2061–2085, doi: 10.1007/s00382-017-3736-4.
Díaz, L.B. and C.S. Vera, 2017: Austral summer precipitation interannual variability and trends over Southeastern South America in CMIP5 models. International Journal of Climatology, 37, 681–695, doi: 10.1002/joc.5031.
Díaz, L.B., R.I. Saurral, and C.S. Vera, 2021: Assessment of South America summer rainfall climatology and trends in a set of global climate models large ensembles. International Journal of Climatology, 41(S1) , E59–E77, doi: 10.1002/joc.6643.
Diedhiou, A. et al., 2018: Changes in climate extremes over West and Central Africa at 1.5°C and 2°C global warming. Environmental Research Letters, 13(6) , 065020, doi: 10.1088/1748-9326/aac3e5.
Dieterich, C. et al., 2019: Surface Heat Budget over the North Sea in Climate Change Simulations. Atmosphere, 10(5) , 272, doi: 10.3390/atmos10050272.
Diffenbaugh, N.S., M. Scherer, and M. Ashfaq, 2013: Response of snow-dependent hydrologic extremes to continued global warming. Nature Climate Change, 3(4) , 379–384, doi: 10.1038/nclimate1732.
Diffenbaugh, N.S. et al., 2017: Quantifying the influence of global warming on unprecedented extreme climate events. Proceedings of the National Academy of Sciences, 114(19) , 4881–4886, doi: 10.1073/pnas.1618082114.
Dike, V.N. et al., 2015: Modelling present and future African climate using CMIP5 scenarios in HadGEM2-ES. International Journal of Climatology, 35(8) , 1784–1799, doi: 10.1002/joc.4084.
DiNezio, P.N. et al., 2009: Climate Response of the Equatorial Pacific to Global Warming. Journal of Climate, 22(18) , 4873–4892, doi: 10.1175/2009jcli2982.1.
Ding, Y. et al., 2014: Interdecadal variability of the East Asian winter monsoon and its possible links to global climate change. Journal of Meteorological Research, 28(5) , 693–713, doi: 10.1007/s13351-014-4046-y.
Donat, M.G. et al., 2014: Changes in extreme temperature and precipitation in the Arab region: long-term trends and variability related to ENSO and NAO. International Journal of Climatology, 34(3) , 581–592, doi: 10.1002/joc.3707.
Donat-Magnin, M. et al., 2020: Interannual variability of summer surface mass balance and surface melting in the Amundsen sector, West Antarctica. The Cryosphere, 14(1) , 229–249, doi: 10.5194/tc-14-229-2020.
Dong, B., R.T. Sutton, and L. Shaffrey, 2017: Understanding the rapid summer warming and changes in temperature extremes since the mid-1990s over Western Europe. Climate Dynamics, 48(5–6) , 1537–1554, doi: 10.1007/s00382-016-3158-8.
Dong, X. et al., 2020: Robustness of the Recent Global Atmospheric Reanalyses for Antarctic Near-Surface Wind Speed Climatology. Journal of Climate, 33(10) , 4027–4043, doi: 10.1175/jcli-d-19-0648.1.
Dosio, A., 2016: Projections of climate change indices of temperature and precipitation from an ensemble of bias-adjusted high-resolution EURO-CORDEX regional climate models. Journal of Geophysical Research: Atmospheres, 121(10) , 5488–5511, doi: 10.1002/2015jd024411.
Dosio, A. and H.J. Panitz, 2016: Climate change projections for CORDEX-Africa with COSMO-CLM regional climate model and differences with the driving global climate models. Climate Dynamics, 46(5–6) , 1599–1625, doi: 10.1007/s00382-015-2664-4.
Dosio, A. and E.M. Fischer, 2018: Will Half a Degree Make a Difference? Robust Projections of Indices of Mean and Extreme Climate in Europe Under 1.5°C, 2°C, and 3°C Global Warming. Geophysical Research Letters, 45(2) , 935–944, doi: 10.1002/2017gl076222.
Dosio, A. et al., 2019: What can we know about future precipitation in Africa? Robustness, significance and added value of projections from a large ensemble of regional climate models. Climate Dynamics, 53(9–10) , 5833–5858, doi: 10.1007/s00382-019-04900-3.
Dozier, J., E.H. Bair, and R.E. Davis, 2016: Estimating the spatial distribution of snow water equivalent in the world’s mountains. WIREs Water, 3(3) , 461–474, doi: 10.1002/wat2.1140.
Drobinski, P. et al., 2018: North-western Mediterranean sea-breeze circulation in a regional climate system model. Climate Dynamics, 51(3) , 1077–1093, doi: 10.1007/s00382-017-3595-z.
Drugé, T., P. Nabat, M. Mallet, and S. Somot, 2019: Model simulation of ammonium and nitrate aerosols distribution in the Euro-Mediterranean region and their radiative and climatic effects over 1979–2016. Atmospheric Chemistry and Physics, 19(6) , 3707–3731, doi: 10.5194/acp-19-3707-2019.
Duan, W. et al., 2015: Changes of precipitation amounts and extremes over Japan between 1901 and 2012 and their connection to climate indices. Climate Dynamics, 45(7) , 2273–2292, doi: 10.1007/s00382-015-2778-8.
Dunn, R.J.H. et al., 2020: Development of an Updated Global Land In Situ-Based Data Set of Temperature and Precipitation Extremes: HadEX3. Journal of Geophysical Research: Atmospheres, 125(16) , e2019JD032263, doi: 10.1029/2019jd032263.
Dunning, C.M., E. Black, and R.P. Allan, 2018: Later Wet Seasons with More Intense Rainfall over Africa under Future Climate Change. Journal of Climate, 31(23) , 9719–9738, doi: 10.1175/jcli-d-18-0102.1.
Dutheil, C. et al., 2019: Impact of surface temperature biases on climate change projections of the South Pacific Convergence Zone. Climate Dynamics, 53(5–6) , 3197–3219, doi: 10.1007/s00382-019-04692-6.
Easterling, D.R. et al., 2017: Precipitation change in the United States. In: Climate Science Special Report: Fourth National Climate Assessment, Volume I[Wuebbles, D.J., D.W. Fahey, K.A. Hibbard, D.J. Dokken, B.C. Stewart, and T.K. Maycock (eds.)]. U.S. Global Change Research Program, Washington, DC, USA, pp. 207-230, doi: 10.7930/j0h993cc.
EEA, 2018: National climate change vulnerability and risk assessments in Europe 2018. EEA Report No 1/2018, European Environment Agency (EEA), Copenhagen, Denmark, 79 pp., doi: 10.2800/348489.
Elvidge, A.D. and I.A. Renfrew, 2016: The causes of foehn warming in the lee of mountains. Bulletin of the American Meteorological Society, 97(3) , 455–466, doi: 10.1175/bams-d-14-00194.1.
Elvidge, A.D., P. Kuipers Munneke, J.C. King, I.A. Renfrew, and E. Gilbert, 2020: Atmospheric Drivers of Melt on Larsen C Ice Shelf: Surface Energy Budget Regimes and the Impact of Foehn. Journal of Geophysical Research: Atmospheres, 125(17) , e2020JD032463, doi: 10.1029/2020jd032463.
Elvidge, A.D. et al., 2015: Foehn jets over the Larsen C Ice Shelf, Antarctica. Quarterly Journal of the Royal Meteorological Society, 141(688) , 698–713, doi: 10.1002/qj.2382.
Endo, H., A. Kitoh, R. Mizuta, and M. Ishii, 2017: Future Changes in Precipitation Extremes in East Asia and Their Uncertainty Based on Large Ensemble Simulations with a High-Resolution AGCM. SOLA, 13, 7–12, doi: 10.2151/sola.2017-002.
Endris, H.S. et al., 2013: Assessment of the Performance of CORDEX Regional Climate Models in Simulating East African Rainfall. Journal of Climate, 26(21) , 8453–8475, doi: 10.1175/jcli-d-12-00708.1.
Endris, H.S. et al., 2016: Teleconnection responses in multi-GCM driven CORDEX RCMs over Eastern Africa. Climate Dynamics, 46(9–10) , 2821–2846, doi: 10.1007/s00382-015-2734-7.
Enfield, D.B., A.M. Mestas-Nuñez, and P.J. Trimble, 2001: The Atlantic Multidecadal Oscillation and its relation to rainfall and river flows in the continental U.S. Geophysical Research Letters, 28(10) , 2077–2080, doi: 10.1029/2000gl012745.
Engel, Z., K. Láska, D. Nývlt, and Z. Stachoň, 2018: Surface mass balance of small glaciers on James Ross Island, north-eastern Antarctic Peninsula, during 2009–2015. Journal of Glaciology, 64(245) , 349–361, doi: 10.1017/jog.2018.17.
Engelbrecht, F. et al., 2015: Projections of rapidly rising surface temperatures over Africa under low mitigation. Environmental Research Letters, 10(8) , 085004, doi: 10.1088/1748-9326/10/8/085004.
Espinoza, J.C. et al., 2020: Hydroclimate of the Andes Part I: Main Climatic Features. Frontiers in Earth Science, 8, doi: 10.3389/feart.2020.00064.
Evans, A., D. Jones, R. Smalley, and S. Lellyett, 2020: An enhanced gridded rainfall analysis scheme for Australia. Bureau Research Report – BRR041, Bureau of Meteorology (BOM), Australia, 45 pp., www.bom.gov.au/research/publications/researchreports/BRR-041.pdf .
Evans, J.P. et al., 2021: The CORDEX-Australasia ensemble: evaluation and future projections. Climate Dynamics, 57(5–6) , 1385–1401, doi: 10.1007/s00382-020-05459-0.
Eyring, V. et al., 2016: Overview of the Coupled Model Intercomparison Project Phase 6 (CMIP6) experimental design and organization. Geoscientific Model Development, 9(5) , 1937–1958, doi: 10.5194/gmd-9-1937-2016.
Falco, M., A.F. Carril, C.G. Menéndez, P.G. Zaninelli, and L.Z.X. Li, 2019: Assessment of CORDEX simulations over South America: added value on seasonal climatology and resolution considerations. Climate Dynamics, 52(7–8) , 4771–4786, doi: 10.1007/s00382-018-4412-z.
Fan, X., Q. Duan, C. Shen, Y. Wu, and C. Xing, 2020: Global surface air temperatures in CMIP6: Historical performance and future changes. Environmental Research Letters, 15(10) , 104056, doi: 10.1088/1748-9326/abb051.
Fantini, A. et al., 2018: Assessment of multiple daily precipitation statistics in ERA-Interim driven Med-CORDEX and EURO-CORDEX experiments against high resolution observations. Climate Dynamics, 51(3) , 877–900, doi: 10.1007/s00382-016-3453-4.
Fathian, F. et al., 2020: Assessment of changes in climate extremes of temperature and precipitation over Iran. Theoretical and Applied Climatology, 141(3–4) , 1119–1133, doi: 10.1007/s00704-020-03269-2.
Fausto, R.S. et al., 2018: A Snow Density Dataset for Improving Surface Boundary Conditions in Greenland Ice Sheet Firn Modeling. Frontiers in Earth Science, 6, 51, doi: 10.3389/feart.2018.00051.
Fay, A.R. and G.A. McKinley, 2014: Global open-ocean biomes: mean and temporal variability. Earth System Science Data, 6(2) , 273–284, doi: 10.5194/essd-6-273-2014.
Fei, L. and G. Yong-Qi, 2015: The Project Siberian High in CMIP5 Models. Atmospheric and Oceanic Science Letters, 8(4) , 179–184, doi: 10.3878/aosl20140101.
Fernandes, K., A. Giannini, L. Verchot, W. Baethgen, and M. Pinedo-Vasquez, 2015: Decadal covariability of Atlantic SSTs and western Amazon dry-season hydroclimate in observations and CMIP5 simulations. Geophysical Research Letters, 42(16) , 6793–6801, doi: 10.1002/2015gl063911.
Fernández, J. et al., 2019: Consistency of climate change projections from multiple global and regional model intercomparison projects. Climate Dynamics, 52(1–2) , 1139–1156, doi: 10.1007/s00382-018-4181-8.
Fernandez-Granja, J.A., A. Casanueva, J. Bedia, and J. Fernandez, 2021: Improved atmospheric circulation over Europe by the new generation of CMIP6 earth system models. Climate Dynamics, 56(11–12) , 3527–3540, doi: 10.1007/s00382-021-05652-9.
Fettweis, X. et al., 2020: GrSMBMIP: intercomparison of the modelled 1980–2012 surface mass balance over the Greenland Ice Sheet. The Cryosphere, 14(11) , 3935–3958, doi: 10.5194/tc-14-3935-2020.
Flaounas, E. et al., 2018: Assessment of an ensemble of ocean–atmosphere coupled and uncoupled regional climate models to reproduce the climatology of Mediterranean cyclones. Climate Dynamics, 51(3) , 1023–1040, doi: 10.1007/s00382-016-3398-7.
Flato, G. et al., 2013: Evaluation of Climate Models. In: Climate Change 2013: The Physical Science Basis. Contribution of Working Group I to the Fifth Assessment Report of the Intergovernmental Panel on Climate Change[Stocker, T.F., D. Qin, G.-K. Plattner, M. Tignor, S.K. Allen, J. Boschung, A. Nauels, Y. Xia, V. Bex, and P.M. Midgley (eds.)]. Cambridge University Press, Cambridge, United Kingdom and New York, NY, USA, pp. 741–866, doi: 10.1017/cbo9781107415324.020.
Foley, A.M., 2018: Climate impact assessment and “islandness”: Challenges and opportunities of knowledge production and decision-making for Small Island Developing States. International Journal of Climate Change Strategies and Management, 10(2) , 289–302, doi: 10.1108/ijccsm-06-2017-0142.
Ford, M., M.A. Merrifield, and J.M. Becker, 2018: Inundation of a low-lying urban atoll island: Majuro, Marshall Islands. Natural Hazards, 91(3) , 1273–1297, doi: 10.1007/s11069-018-3183-5.
Forster, P.M., A.C. Maycock, C.M. McKenna, and C.J. Smith, 2020: Latest climate models confirm need for urgent mitigation. Nature Climate Change, 10(1) , 7–10, doi: 10.1038/s41558-019-0660-0.
Franzke, C.L.E., S. Lee, and S.B. Feldstein, 2017: Evaluating Arctic warming mechanisms in CMIP5 models. Climate Dynamics, 48(9–10) , 3247–3260, doi: 10.1007/s00382-016-3262-9.
Frazier, A.G. and T.W. Giambelluca, 2017: Spatial trend analysis of Hawaiian rainfall from 1920 to 2012. International Journal of Climatology, 37(5) , 2522–2531, doi: 10.1002/joc.4862.
Frazier, A.G., O. Elison Timm, T.W. Giambelluca, and H.F. Diaz, 2018: The influence of ENSO, PDO and PNA on secular rainfall variations in Hawai‘i. Climate Dynamics, 51(5–6) , 2127–2140, doi: 10.1007/s00382-017-4003-4.
Frei, P., S. Kotlarski, M.A. Liniger, and C. Schär, 2018: Future snowfall in the Alps: projections based on the EURO-CORDEX regional climate models. The Cryosphere, 12(1) , 1–24, doi: 10.5194/tc-12-1-2018.
Frezzotti, M., C. Scarchilli, S. Becagli, M. Proposito, and S. Urbini, 2013: A synthesis of the Antarctic surface mass balance during the last 800 yr. Cryosphere, 7(1) , 303–319, doi: 10.5194/tc-7-303-2013.
Frieler, K. et al., 2015: Consistent evidence of increasing Antarctic accumulation with warming. Nature Climate Change, 5(4) , 348–352, doi: 10.1038/nclimate2574.
Frigg, R., L.A. Smith, and D.A. Stainforth, 2013: The myopia of imperfect climate models: The case of UKCP09. Philosophy of Science, 80(5) , 886–897, doi: 10.1086/673892.
Frolov, A. et al., 2014: Second Roshydromet Assessment Report on Climate Change and its Consequences in the Russian Federation. Federal Service for Hydrometeorology and Environmental Monitoring (Roshydromet), Moscow, Russia, 56 pp., http://cc.voeikovmgo.ru/images/dokumenty/2016/od2/resume_ob_eng.pdf .
Fu, R. et al., 2013: Increased dry-season length over southern Amazonia in recent decades and its implication for future climate projection. Proceedings of the National Academy of Sciences, 110(45) , 18110–18115, doi: 10.1073/pnas.1302584110.
Fuentes-Franco, R., F. Giorgi, E. Coppola, and K. Zimmermann, 2017: Sensitivity of tropical cyclones to resolution, convection scheme and ocean flux parameterization over Eastern Tropical Pacific and Tropical North Atlantic Oceans in the RegCM4 model. Climate Dynamics, 49(1) , 547–561, doi: 10.1007/s00382-016-3357-3.
Fuentes-Franco, R., E. Coppola, F. Giorgi, F. Graef, and E.G. Pavia, 2014: Assessment of RegCM4 simulated inter-annual variability and daily-scale statistics of temperature and precipitation over Mexico. Climate Dynamics, 42(3) , 629–647, doi: 10.1007/s00382-013-1686-z.
Fuentes-Franco, R. et al., 2015: Inter-annual variability of precipitation over Southern Mexico and Central America and its relationship to sea surface temperature from a set of future projections from CMIP5 GCMs and RegCM4 CORDEX simulations. Climate Dynamics, 45(1) , 425–440, doi: 10.1007/s00382-014-2258-6.
Fumière, Q. et al., 2020: Extreme rainfall in Mediterranean France during the fall: added value of the CNRM-AROME Convection-Permitting Regional Climate Model. Climate Dynamics, 55(1–2) , 77–91, doi: 10.1007/s00382-019-04898-8.
Fyfe, J.C., N.P. Gillett, and G.J. Marshall, 2012: Human influence on extratropical Southern Hemisphere summer precipitation. Geophysical Research Letters, 39(23) , L23711, doi: 10.1029/2012gl054199.
Fyfe, J.C. et al., 2017: Large near-term projected snowpack loss over the western United States. Nature Communications, 8(1) , 14996, doi: 10.1038/ncomms14996.
Gaertner, M. et al., 2018: Simulation of medicanes over the Mediterranean Sea in a regional climate model ensemble: impact of ocean–atmosphere coupling and increased resolution. Climate Dynamics, 51(3) , 1041–1057, doi: 10.1007/s00382-016-3456-1.
Gaetani, M. et al., 2017: West African monsoon dynamics and precipitation: the competition between global SST warming and CO2increase in CMIP5 idealized simulations. Climate Dynamics, 48(3–4) , 1353–1373, doi: 10.1007/s00382-016-3146-z.
García Cueto, O.R., N. Santillán Soto, M. Quintero Núñez, S. Ojeda Benítez, and N. Velázquez Limón, 2013: Extreme temperature scenarios in Mexicali, Mexico under climate change conditions. Atmósfera, 26(4) , 509–520, doi: 10.1016/s0187-6236(13)71092-0.
Gbobaniyi, E. et al., 2014: Climatology, annual cycle and interannual variability of precipitation and temperature in CORDEX simulations over West Africa. International Journal of Climatology, 34(7) , 2241–2257, doi: 10.1002/joc.3834.
Ge, J., X. Jia, and H. Lin, 2016: The interdecadal change of the leading mode of the winter precipitation over China. Climate Dynamics, 47(7) , 2397–2411, doi: 10.1007/s00382-015-2970-x.
Gevorgyan, A., H. Melkonyan, T. Aleksanyan, A. Iritsyan, and Y. Khalatyan, 2016: An assessment of observed and projected temperature changes in Armenia. Arabian Journal of Geosciences, 9(1) , 27, doi: 10.1007/s12517-015-2167-y.
Ghebrezgabher, M.G., T. Yang, and X. Yang, 2016: Long-Term Trend of Climate Change and Drought Assessment in the Horn of Africa. Advances in Meteorology, 2016, 8057641, doi: 10.1155/2016/8057641.
Gheuens, J., N. Nagabhatla, and E. Perera, 2019: Disaster-Risk, Water Security Challenges and Strategies in Small Island Developing States (SIDS). Water, 11(4) , 637, doi: 10.3390/w11040637.
Giannini, A., Y. Kushnir, and M.A. Cane, 2000: Interannual variability of Caribbean rainfall, ENSO, and the Atlantic Ocean. Journal of Climate, 13, 297–311, doi: 10.1175/1520-0442(2000)013<0297:ivocre>2.0.co;2.
Gibba, P. et al., 2019: State-of-the-art climate modeling of extreme precipitation over Africa: analysis of CORDEX added-value over CMIP5. Theoretical andApplied Climatology, 137(1–2) , 1041–1057, doi: 10.1007/s00704-018-2650-y.
Gibson, P.B., D.E. Waliser, H. Lee, B. Tian, and E. Massoud, 2019: Climate Model Evaluation in the Presence of Observational Uncertainty: Precipitation Indices over the Contiguous United States. Journal of Hydrometeorology, 20(7) , 1339–1357, doi: 10.1175/jhm-d-18-0230.1.
Gilbert, E. et al., 2020: Summertime cloud phase strongly influences surface melting on the Larsen C ice shelf, Antarctica. Quarterly Journal of the Royal Meteorological Society, 146(729) , 1575–1589, doi: 10.1002/qj.3753.
Giorgi, F., C. Jones, and G.R. Asrar, 2009: Addressing climate information needs at the regional level: the CORDEX framework. WMO Bulletin, 58(3) , 175–183, https://public.wmo.int/en/bulletin/addressing-climate-information-needs-regional-level-cordex-framework.
Giorgi, F., F. Raffaele, and E. Coppola, 2019: The response of precipitation characteristics to global warming from climate projections. Earth System Dynamics, 10(1) , 73–89, doi: 10.5194/esd-10-73-2019.
Giorgi, F. et al., 2016: Enhanced summer convective rainfall at Alpine high elevations in response to climate warming. Nature Geoscience, 9(8) , 584–589, doi: 10.1038/ngeo2761.
Giot, O. et al., 2016: Validation of the ALARO-0 model within the EURO-CORDEX framework. Geoscientific Model Development, 9(3) , 1143–1152, doi: 10.5194/gmd-9-1143-2016.
Gjelten, H.M. et al., 2016: Air temperature variations and gradients along the coast and fjords of western Spitsbergen. Polar Research, 35, doi: 10.3402/polar.v35.29878.
Glisan, J.M. and W.J. Gutowski, 2014: WRF winter extreme daily precipitation over the North American CORDEX Arctic. Journal of Geophysical Research: Atmospheres, 119(18) , 10738–10748, doi: 10.1002/2014jd021676.
Gloor, M. et al., 2015: Recent Amazon climate as background for possible ongoing and future changes of Amazon humid forests. Global Biogeochemical Cycles, 29(9) , 1384–1399, doi: 10.1002/2014gb005080.
Gong, H. et al., 2018: Revisiting the Northern Mode of East Asian Winter Monsoon Variation and Its Response to Global Warming. Journal of Climate, 31(21) , 9001–9014, doi: 10.1175/jcli-d-18-0136.1.
Gonzalez, S. and D. Fortuny, 2018: How robust are the temperature trends on the Antarctic Peninsula?Antarctic Science, 30(5) , 322–328, doi: 10.1017/s0954102018000251.
Gonzalez-Hidalgo, J.C., D. Peña-Angulo, M. Brunetti, and N. Cortesi, 2016: Recent trend in temperature evolution in Spanish mainland (1951–2010): from warming to hiatus. International Journal of Climatology, 36(6) , 2405–2416, doi: 10.1002/joc.4519.
Gorbatenko, V.P., V. Sevastyanov, D.A. Konstantinova, and O. Nosyreva, 2019: Characteristic of the snow cover for the Western Siberia territory. IOP Conference Series: Earth and Environmental Science, 232, 012003, doi: 10.1088/1755-1315/232/1/012003.
Gorodetskaya, I., T. Silva, H. Schmithüsen, and N. Hirasawa, 2020: Atmospheric River Signatures in Radiosonde Profiles and Reanalyses at the Dronning Maud Land Coast, East Antarctica. Advances in Atmospheric Sciences, 37(5) , 455–476, doi: 10.1007/s00376-020-9221-8.
Gorodetskaya, I. et al., 2014: The role of atmospheric rivers in anomalous snow accumulation in East Antarctica. Geophysical Research Letters, 41(17) , 6199–6206, doi: 10.1002/2014gl060881.
Gorodetskaya, I. et al., 2015: Cloud and precipitation properties from ground-based remote-sensing instruments in East Antarctica. The Cryosphere, 9(1) , 285–304, doi: 10.5194/tc-9-285-2015.
Gorte, T., J.T.M. Lenaerts, and B. Medley, 2020: Scoring Antarctic surface mass balance in climate models to refine future projections. The Cryosphere, 14(12) , 4719–4733, doi: 10.5194/tc-14-4719-2020.
Gossart, A. et al., 2019: An Evaluation of Surface Climatology in State-of-the-Art Reanalyses over the Antarctic Ice Sheet. Journal of Climate, 32(20) , 6899–6915, doi: 10.1175/jcli-d-19-0030.1.
Goswami, B.N., V. Venugopal, D. Sengupta, M.S. Madhusoodanan, and P.K. Xavier, 2006: Increasing Trend of Extreme Rain Events Over India in a Warming Environment. Science, 314(5804) , 1442–1445, doi: 10.1126/science.1132027.
Gouirand, I., V. Moron, and B. Sing, 2020: Seasonal atmospheric transitions in the Caribbean basin and Central America. Climate Dynamics, 55(7) , 1809–1828, doi: 10.1007/s00382-020-05356-6.
Graversen, R.G. and M. Burtu, 2016: Arctic amplification enhanced by latent energy transport of atmospheric planetary waves. Quarterly Journal of the Royal Meteorological Society, 142(698) , 2046–2054, doi: 10.1002/qj.2802.
Grazioli, J. et al., 2017: Measurements of precipitation in Dumont d’Urville, Adélie Land, East Antarctica. Cryosphere, 11(4) , 1797–1811, doi: 10.5194/tc-11-1797-2017.
Gregor, L., A.D. Lebehot, S. Kok, and P.M. Scheel Monteiro, 2019: A comparative assessment of the uncertainties of global surface ocean CO2estimates using a machine-learning ensemble (CSIR-ML6 version 2019a´) – Have we hit the wall?Geoscientific Model Development, 12(12) , 5113–5136, doi: 10.5194/gmd-12-5113-2019.
Grise, K.M., S.-W. Son, and J.R. Gyakum, 2013: Intraseasonal and Interannual Variability in North American Storm Tracks and Its Relationship to Equatorial Pacific Variability. Monthly Weather Review, 141(10) , 3610–3625, doi: 10.1175/mwr-d-12-00322.1.
Gröger, M., C. Dieterich, M.H.E. Meier, and S. Schimanke, 2015: Thermal air–sea coupling in hindcast simulations for the North Sea and Baltic Sea on the NW European shelf. Tellus A: Dynamic Meteorology and Oceanography, 67(1) , 26911, doi: 10.3402/tellusa.v67.26911.
Groisman, P.Y. et al., 2016: Recent changes in the frequency of freezing precipitation in North America and Northern Eurasia. Environmental Research Letters, 11(4) , 045007, doi: 10.1088/1748-9326/11/4/045007.
Grose, M.R., S. Foster, J.S. Risbey, S. Osbrough, and L. Wilson, 2019a: Using indices of atmospheric circulation to refine southern Australian winter rainfall climate projections. Climate Dynamics, 53(9–10) , 5481–5493, doi: 10.1007/s00382-019-04880-4.
Grose, M.R. et al., 2017: Constraints on Southern Australian Rainfall Change Based on Atmospheric Circulation in CMIP5 Simulations. Journal of Climate, 30(1) , 225–242, doi: 10.1175/jcli-d-16-0142.1.
Grose, M.R. et al., 2019b: The role of topography on projected rainfall change in mid-latitude mountain regions. Climate Dynamics, 53(5–6) , 3675–3690, doi: 10.1007/s00382-019-04736-x.
Grose, M.R. et al., 2020: Insights From CMIP6 for Australia’s Future Climate. Earth’s Future, 8(5) , e2019EF001469, doi: 10.1029/2019ef001469.
Grosvenor, D.P., J.C. King, T.W. Choularton, and T. Lachlan-Cope, 2014: Downslope föhn winds over the antarctic peninsula and their effect on the larsen ice shelves. Atmospheric Chemistry and Physics, 14(18) , 9481–9509, doi: 10.5194/acp-14-9481-2014.
Gruza, G.V., E.Y. Rankova, E.V. Rocheva, and V.D. Smirnov, 2015: Current Global Warming: Geographical and Seasonal Features. Фундаментальная и прикладная климатология, 2, 41–62, http://downloads.igce.ru/journals/FAC/FAC_2015/FAC_2015_2/Gruza_G_V_Rankova_E_Ya_etc_FAC_2015_N2_04122015.pdf .
Gudmundsson, L. and S.I. Seneviratne, 2016: Anthropogenic climate change affects meteorological drought risk in Europe. Environmental Research Letters, 11(4) , 44005, doi: 10.1088/1748-9326/11/4/044005.
Guhathakurta, P. and J. Revadekar, 2017: Observed Variability and Long-Term Trends of Rainfall Over India. In: Observed Climate Variability and Change over the Indian Region[Rajeevan, M. and S. Nayak (eds.)]. Springer, Singapore, doi: 10.1007/978-981-10-2531-0_1.
Gulizia, C. and I. Camilloni, 2015: Comparative analysis of the ability of a set of CMIP3 and CMIP5 global climate models to represent precipitation in South America. International Journal of Climatology, 35(4) , 583–595, doi: 10.1002/joc.4005.
Gulizia, C., I. Camilloni, and M. Doyle, 2013: Identification of the principal patterns of summer moisture transport in South America and their representation by WCRP/CMIP3 global climate models. Theoretical and Applied Climatology, 112(1–2) , 227–241, doi: 10.1007/s00704-012-0729-4.
Guo, D.-L., J.-Q. Sun, and E.-T. Yu, 2018: Evaluation of CORDEX regional climate models in simulating temperature and precipitation over the Tibetan Plateau. Atmospheric and Oceanic Science Letters, 11(3) , 219–227, doi: 10.1080/16742834.2018.1451725.
Guo, H. et al., 2017a: Meteorological Drought Analysis in the Lower Mekong Basin Using Satellite-Based Long-Term CHIRPS Product. Sustainability, 9(6) , 901, doi: 10.3390/su9060901.
Guo, H. et al., 2017b: Systematical Evaluation of Satellite Precipitation Estimates Over Central Asia Using an Improved Error-Component Procedure. Journal of Geophysical Research: Atmospheres, 122(20) , 10906–10927, doi: 10.1002/2017jd026877.
Guo, H. et al., 2018: Spatial and temporal characteristics of droughts in Central Asia during 1966–2015. Science of The Total Environment, 624, 1523–1538, doi: 10.1016/j.scitotenv.2017.12.120.
Guo, H. et al., 2021: Assessment of CMIP6 in simulating precipitation over arid Central Asia. Atmospheric Research, 252, 105451, doi: 10.1016/j.atmosres.2021.105451.
Guo, L. and L. Li, 2015: Variation of the proportion of precipitation occurring as snow in the Tian Shan Mountains, China. International Journal of Climatology, 35(7) , 1379–1393, doi: 10.1002/joc.4063.
Gusain, A., S. Ghosh, and S. Karmakar, 2020: Added value of CMIP6 over CMIP5 models in simulating Indian summer monsoon rainfall. Atmospheric Research, 232, 104680, doi: 10.1016/j.atmosres.2019.104680.
Gutiérrez, C. et al., 2018: Impact of aerosols on the spatiotemporal variability of photovoltaic energy production in the Euro-Mediterranean area. Solar Energy, 174, 1142–1152, doi: 10.1016/j.solener.2018.09.085.
Gutiérrez, C. et al., 2020: Future evolution of surface solar radiation and photovoltaic potential in Europe: investigating the role of aerosols. Environmental Research Letters, 15(3) , 034035, doi: 10.1088/1748-9326/ab6666.
Gutowski Jr., W.J. et al., 2016: WCRP COordinated Regional Downscaling EXperiment (CORDEX): a diagnostic MIP for CMIP6. Geoscientific Model Development, 9(11) , 4087–4095, doi: 10.5194/gmd-9-4087-2016.
Haag, I., P.D. Jones, and C. Samimi, 2019: Central Asia’s Changing Climate: How Temperature and Precipitation Have Changed across Time, Space, and Altitude. Climate, 7(10) , 123, doi: 10.3390/cli7100123.
Haarsma, R.J. et al., 2016: High Resolution Model Intercomparison Project (HighResMIP v1.0) for CMIP6. Geoscientific Model Development, 9(11) , 4185–4208, doi: 10.5194/gmd-9-4185-2016.
Haiden, T. et al., 2011: The integrated nowcasting through comprehensive analysis (INCA) system and its validation over the Eastern Alpine region. Weather and Forecasting, 26(2) , 166–183, doi: 10.1175/2010waf2222451.1.
Ham, S., J.-W. Lee, and K. Yoshimura, 2016: Assessing Future Climate Changes in the East Asian Summer and Winter Monsoon Using Regional Spectral Model. Journal of the Meteorological Society of Japan. Series II, 94A, 69–87, doi: 10.2151/jmsj.2015-051.
Hamman, J. et al., 2016: Land surface climate in the regional Arctic system model. Journal of Climate, 29(18) , 6543–6562, doi: 10.1175/jcli-d-15-0415.1.
Han, S. and Z. Yang, 2013: Cooling effect of agricultural irrigation over Xinjiang, Northwest China from 1959 to 2006. Environmental Research Letters, 8(2) , 024039, doi: 10.1088/1748-9326/8/2/024039.
Hanna, E. et al., 2020: Mass balance of the ice sheets and glaciers – Progress since AR5 and challenges. Earth-Science Reviews, 201, 102976, doi: 10.1016/j.earscirev.2019.102976.
Hanna, E. et al., 2021: Greenland surface air temperature changes from 1981 to 2019 and implications for ice-sheet melt and mass-balance change. International Journal of Climatology, 41(S1) , E1336–E1352, doi: 10.1002/joc.6771.
Hannart, A., C. Vera, B. Cerne, and F.E.L. Otto, 2015: Causal Influence of Anthropogenic Forcings on the Argentinian Heat Wave of December 2013. Bulletin of the American Meteorological Society, 96(12) , S41–S45, doi: 10.1175/bams-d-15-00137.1.
Hanssen-Bauer, I., E.J. Førland, H. Hisdal, S. Mayer, A.B. Sandø, and A. Sorteberg (eds.), 2019: Climate in Svalbard 2100 – a knowledge base for climate adaptation. NCCS report no. 1/2019, Norwegian Centre for Climate Services (NCCS), 207 pp., www.miljodirektoratet.no/globalassets/publikasjoner/M1242/M1242.pdf .
Hao, M. et al., 2018: Narrowing the surface temperature range in CMIP5 simulations over the Arctic. Theoretical and Applied Climatology, 132(3–4) , 1073–1088, doi: 10.1007/s00704-017-2161-2.
Harada, Y. et al., 2016: The JRA-55 Reanalysis: Representation of Atmospheric Circulation and Climate Variability. Journal of the Meteorological Society of Japan. Series II, 94(3) , 269–302, doi: 10.2151/jmsj.2016-015.
Harold, J., I. Lorenzoni, T.F. Shipley, and K.R. Coventry, 2016: Cognitive and psychological science insights to improve climate change data visualization. Nature Climate Change, 6(12) , 1080–1089, doi: 10.1038/nclimate3162.
Harris, I., P.D. Jones, T.J. Osborn, and D.H. Lister, 2014: Updated high-resolution grids of monthly climatic observations – the CRU TS3.10 Dataset. International Journal of Climatology, 34(3) , 623–642, doi: 10.1002/joc.3711.
Harris, I., T.J. Osborn, P. Jones, and D. Lister, 2020: Version 4 of the CRU TS monthly high-resolution gridded multivariate climate dataset. Scientific Data, 7(1) , 109, doi: 10.1038/s41597-020-0453-3.
Harter, D.E. et al., 2015: Impacts of global climate change on the floras of oceanic islands – Projections, implications and current knowledge. Perspectives in Plant Ecology, Evolution and Systematics, 17(2) , 160–183, doi: 10.1016/j.ppees.2015.01.003.
Hartmann, D.L. et al., 2013: Observations: Atmosphere and Surface. In: Climate Change 2013: The Physical Science Basis. Contribution of Working Group I to the Fifth Assessment Report of the Intergovernmental Panel on Climate Change[Stocker, T.F., D. Qin, G.-K. Plattner, M. Tignor, S.K. Allen, J. Boschung, A. Nauels, Y. Xia, V. Bex, and P.M. Midgley (eds.)]. Cambridge University Press, Cambridge, United Kingdom and New York, NY, USA, pp. 159–203, doi: 10.1017/cbo9781107415324.008.
Harzallah, A. et al., 2018: Long term evolution of heat budget in the Mediterranean Sea from Med-CORDEX forced and coupled simulations. Climate Dynamics, 51(3) , 1145–1165, doi: 10.1007/s00382-016-3363-5.
Hasson, S., J. Böhner, and F. Chishtie, 2019: Low fidelity of CORDEX and their driving experiments indicates future climatic uncertainty over Himalayan watersheds of Indus basin. Climate Dynamics, 52(1–2) , 777–798, doi: 10.1007/s00382-018-4160-0.
Hawkins, E. and R. Sutton, 2016: Connecting Climate Model Projections of Global Temperature Change with the Real World. Bulletin of the American Meteorological Society, 97(6) , 963–980, doi: 10.1175/bams-d-14-00154.1.
Hawkins, E. et al., 2020: Observed Emergence of the Climate Change Signal: From the Familiar to the Unknown. Geophysical Research Letters, 47(6) , e2019GL086259, doi: 10.1029/2019gl086259.
Hazeleger, W. et al., 2015: Tales of future weather. Nature Climate Change, 5(2) , 107–113, doi: 10.1038/nclimate2450.
He, C. and W. Zhou, 2020: Different Enhancement of the East Asian Summer Monsoon under Global Warming and Interglacial Epochs Simulated by CMIP6 Models: Role of the Subtropical High. Journal of Climate, 33(22) , 9721–9733, doi: 10.1175/jcli-d-20-0304.1.
He, C., Z. Wang, T. Zhou, and T. Li, 2019: Enhanced Latent Heating over the Tibetan Plateau as a Key to the Enhanced East Asian Summer Monsoon Circulation under a Warming Climate. Journal of Climate, 32(11) , 3373–3388, doi: 10.1175/jcli-d-18-0427.1.
He, S., Y. Gao, F. Li, H. Wang, and Y. He, 2017: Impact of Arctic Oscillation on the East Asian climate: A review. Earth-Science Reviews, 164, 48–62, doi: 10.1016/j.earscirev.2016.10.014.
Heidinger, H., L. Carvalho, C. Jones, A. Posadas, and R. Quiroz, 2018: A new assessment in total and extreme rainfall trends over central and southern Peruvian Andes during 1965–2010. International Journal of Climatology, 38, e998–e1015, doi: 10.1002/joc.5427.
Heikkilä, U. and A. Sorteberg, 2012: Characteristics of autumn-winter extreme precipitation on the Norwegian west coast identified by cluster analysis. Climate Dynamics, 39(3) , 929–939, doi: 10.1007/s00382-011-1277-9.
Hernández-Henríquez, M.A., S.J. Déry, and C. Derksen, 2015: Polar amplification and elevation-dependence in trends of Northern Hemisphere snow cover extent, 1971–2014. Environmental Research Letters, 10(4) , 44010, doi: 10.1088/1748-9326/10/4/044010.
Herrera, D.A. and T. Ault, 2017: Insights from a New High-Resolution Drought Atlas for the Caribbean Spanning 1950–2016. Journal of Climate, 30(19) , 7801–7825, doi: 10.1175/jcli-d-16-0838.1.
Herrera, D.A. et al., 2018: Exacerbation of the 2013–2016 Pan-Caribbean Drought by Anthropogenic Warming. Geophysical Research Letters, 45(19) , 10619–10626, doi: 10.1029/2018gl079408.
Herrera, S. et al., 2019: Iberia01: a new gridded dataset of daily precipitation and temperatures over Iberia. Earth System Science Data, 11(4) , 1947–1956, doi: 10.5194/essd-11-1947-2019.
Herrmann, M., T. Ngo-Duc, and L. Trinh-Tuan, 2020: Impact of climate change on sea surface wind in Southeast Asia, from climatological average to extreme events: results from a dynamical downscaling. Climate Dynamics, 54(3–4) , 2101–2134, doi: 10.1007/s00382-019-05103-6.
Hersbach, H. et al., 2020: The ERA5 global reanalysis. Quarterly Journal of the Royal Meteorological Society, 146(730) , 1999–2049, doi: 10.1002/qj.3803.
Hewitson, B. et al., 2014: Regional context. In: Climate Change 2014: Impacts, Adaptation, and Vulnerability. Part B: Regional Aspects. Contribution of Working Group II to the Fifth Assessment Report of the Intergovernmental Panel on Climate Change[Barros, V.R., C.B. Field, D.J. Dokken, M.D. Mastrandrea, K.J. Mach, T.E. Bilir, M. Chatterjee, K.L. Ebi, Y.O. Estrada, R.C. Genova, B. Girma, E.S. Kissel, A.N. Levy, S. MacCracken, P.R. Mastrandrea, and L.L. White (eds.)]. Cambridge University Press, Cambridge, United Kingdom and New York, NY, USA, pp. 1133–1197, doi: 10.1017/cbo9781107415386.001.
Hidalgo, H.G., E.J. Alfaro, and B. Quesada-Montano, 2017: Observed (1970–1999) climate variability in Central America using a high-resolution meteorological dataset with implication to climate change studies. Climatic Change, 141(1) , 13–28, doi: 10.1007/s10584-016-1786-y.
Hijioka, Y. et al., 2014: Asia. In: Climate Change 2014: Impacts, Adaptation, and Vulnerability. Part B: Regional Aspects. Contribution of Working Group II to the Fifth Assessment Report of the Intergovernmental Panel on Climate Change (AR5 edition)[Barros, V.R., C.B. Field, D.J. Dokken, M.D. Mastrandrea, K.J. Mach, T.E. Bilir, M. Chatterjee, K.L. Ebi, Y.O. Estrada, R.C. Genova, B. Girma, E.S. Kissel, A.N. Levy, S. MacCracken, P.R. Mastrandrea, and L.L. White (eds.)]. Cambridge University Press, Cambridge, United Kingdom and New York, NY, USA, pp. 1327–1370, doi: 10.1017/cbo9781107415386.004.
Hines, K.M. et al., 2019: Microphysics of summer clouds in central West Antarctica simulated by the Polar Weather Research and Forecasting Model (WRF) and the Antarctic Mesoscale Prediction System (AMPS). Atmospheric Chemistry and Physics, 19(19) , 12431–12454, doi: 10.5194/acp-19-12431-2019.
Hock, R. et al., 2019a: GlacierMIP – A model intercomparison of global-scale glacier mass-balance models and projections. Journal of Glaciology, 65(251) , 453–467, doi: 10.1017/jog.2019.22.
Hock, R. et al., 2019b: High Mountain Areas. In: IPCC Special Report on the Ocean and Cryosphere in a Changing Climate[Pörtner, H.-O., D.C. Roberts, V. Masson-Delmotte, P. Zhai, M. Tignor, E. Poloczanska, K. Mintenbeck, A. Alegría, M. Nicolai, A. Okem, J. Petzold, B. Rama, and N.M. Weyer (eds.)]. In press, pp. 131–202, www.ipcc.ch/srocc/chapter/chapter-2.
Hoegh-Guldberg, O. et al., 2018: Impacts of 1.5°C Global Warming on Natural and Human Systems. In: Global Warming of 1.5°C. An IPCC Special Report on the impacts of global warming of 1.5°C above pre-industrial levels and related global greenhouse gas emission pathways, in the context of strengthening the global response to the threat of climate change, sustainable development, and efforts to eradicate poverty[Masson-Delmotte, V., P. Zhai, H.-O. Pörtner, D. Roberts, J. Skea, P.R. Shukla, A. Pirani, W. Moufouma-Okia, C. Péan, R. Pidcock, S. Connors, J.B.R. Matthews, Y. Chen, X. Zhou, M.I. Gomis, E. Lonnoy, T. Maycock, M. Tignor, and T. Waterfield (eds.)]. In Press, pp. 175–311, w ww.ipcc.ch/sr15/chapter/chapter-3.
Hoell, A., M. Hoerling, J. Eischeid, X.-W. Quan, and B. Liebmann, 2017: Reconciling Theories for Human and Natural Attribution of Recent East Africa Drying. Journal of Climate, 30(6) , 1939–1957, doi: 10.1175/jcli-d-16-0558.1.
Hoerling, M., J. Hurrell, J. Eischeid, and A. Phillips, 2006: Detection and Attribution of Twentieth-Century Northern and Southern African Rainfall Change. Journal of Climate, 19(16) , 3989–4008, doi: 10.1175/jcli3842.1.
Hofer, S. et al., 2020: Greater Greenland Ice Sheet contribution to global sea level rise in CMIP6. Nature Communications, 11(1) , 6289, doi: 10.1038/s41467-020-20011-8.
Homar, V., C. Ramis, R. Romero, and S. Alonso, 2009: Recent trends in temperature and precipitation over the Balearic Islands (Spain). Climatic Change, 98(1–2) , 199–211, doi: 10.1007/s10584-009-9664-5.
Horinouchi, T., S. Matsumura, T. Ose, and Y.N. Takayabu, 2019: Jet–Precipitation Relation and Future Change of the Mei-Yu–Baiu Rainband and Subtropical Jet in CMIP5 Coupled GCM Simulations. Journal of Climate, 32(8) , 2247–2259, doi: 10.1175/jcli-d-18-0426.1.
Howard, E. and R. Washington, 2020: Tracing Future Spring and Summer Drying in Southern Africa to Tropical Lows and the Congo Air Boundary. Journal of Climate, 33(14) , 6205–6228, doi: 10.1175/jcli-d-19-0755.1.
Hu, Z., C. Zhang, Q. Hu, and H. Tian, 2014: Temperature Changes in Central Asia from 1979 to 2011 Based on Multiple Datasets. Journal of Climate, 27(3) , 1143–1167, doi: 10.1175/jcli-d-13-00064.1.
Hu, Z. et al., 2017: Variations and changes of annual precipitation in Central Asia over the last century. International Journal of Climatology, 37(S1) , 157–170, doi: 10.1002/joc.4988.
Huang, A. et al., 2014: Changes of the Annual Precipitation over Central Asia in the Twenty-First Century Projected by Multimodels of CMIP5. Journal of Climate, 27(17) , 6627–6646, doi: 10.1175/jcli-d-14-00070.1.
Huang, B. et al., 2017: Extended Reconstructed Sea Surface Temperature, Version 5 (ERSSTv5): Upgrades, Validations, and Intercomparisons. Journal of Climate, 30(20) , 8179–8205, doi: 10.1175/jcli-d-16-0836.1.
Huang, J., H. Yu, A. Dai, Y. Wei, and L. Kang, 2017: Drylands face potential threat under 2°C global warming target. Nature Climate Change, 7(6) , 417–422, doi: 10.1038/nclimate3275.
Huang, J., T. Ou, D. Chen, Y. Luo, and Z. Zhao, 2019: The Amplified Arctic Warming in the Recent Decades may Have Been Overestimated by CMIP5 Models. Geophysical Research Letters, 46(22) , 13338–13345, doi: 10.1029/2019gl084385.
Hurd, C.L., A. Lenton, B. Tilbrook, and P.W. Boyd, 2018: Current understanding and challenges for oceans in a higher-CO2 world. Nature Climate Change, 8(8) , 686–694, doi: 10.1038/s41558-018-0211-0.
IDOE, 2017: Islamic Republic of Iran Third National Communication to United Nations Framework Convention on Climate Change (UNFCCC). Department of Environment of the Government of the Islamic Republic of Iran, Tehran, Iran, 255 pp., https://unfccc.int/sites/default/files/resource/Third National communication IRAN.pdf .
Iles, C.E. et al., 2020: The benefits of increasing resolution in global and regional climate simulations for European climate extremes. Geoscientific Model Development, 13(11) , 5583–5607, doi: 10.5194/gmd-13-5583-2020.
Imbach, P. et al., 2018: Future climate change scenarios in Central America at high spatial resolution. PLOS ONE, 13(4) , e0193570, doi: 10.1371/journal.pone.0193570.
IMBIE team, 2020: Mass balance of the Greenland Ice Sheet from 1992 to 2018. Nature, 579(7798) , 233–239, doi: 10.1038/s41586-019-1855-2.
IMBIE team et al., 2018: Mass balance of the Antarctic Ice Sheet from 1992 to 2017. Nature, 558(7709) , 219–222, doi: 10.1038/s41586-018-0179-y.
IPCC, 2013a: Annex I: Atlas of Global and Regional Climate Projections [van Oldenborgh, G.J., M. Collins, J. Arblaster, J.H. Christensen, J. Marotzke, S.B. Power, M. Rummukainen and T. Zhou (eds.)]. In: Climate Change 2013: The Physical Science Basis. Contribution of Working Group I to the Fifth Assessment Report of the Intergovernmental Panel on Climate Change[Stocker, T.F., D. Qin, G.-K. Plattner, M. Tignor, S.K. Allen, J. Boschung, A. Nauels, Y. Xia, V. Bex, and P.M. Midgley (eds.)]. Cambridge University Press, Cambridge, United Kingdom and New York, NY, USA, pp. 1311–1394, doi: 10.1017/cbo9781107415324.029.
IPCC, 2013b: Climate Change 2013: The Physical Science Basis. Contribution of Working Group I to the Fifth Assessment Report of the Intergovernmental Panel on Climate Change [Stocker, T.F., D. Qin, G.-K. Plattner, M. Tignor, S.K. Allen, J. Boschung, A. Nauels, Y. Xia, V. Bex, and P.M. Midgley (eds.)]. Cambridge University Press, Cambridge, United Kingdom and New York, NY, USA, 1535 pp., doi: 10.1017/cbo9781107415324.
IPCC, 2013c: Summary for Policymakers. In: Climate Change 2013: The Physical Science Basis. Contribution of Working Group I to the Fifth Assessment Report of the Intergovernmental Panel on Climate Change[Stocker, T.F., D. Qin, G.-K. Plattner, M. Tignor, S.K. Allen, J. Boschung, A. Nauels, Y. Xia, V. Bex, and P.M. Midgley (eds.)]. Cambridge University Press, Cambridge, United Kingdom and New York, NY, USA, pp. 3–29, doi: 10.1017/cbo9781107415324.004.
IPCC, 2018a: Expert Meeting of the Intergovernmental Panel on Climate Change on Assessing Climate Information for Regions [Moufouma-Okia, W., V. Masson-Delmotte, P. Zhai, H.-O. Pörtner, D. Roberts, M. Howden, R. Pichs-Madruga, G. Flato, C. Vera, A. Pirani, M. Tignor, and E. Poloczanska (eds.)]. IPCC Working Group I Technical Support Unit, Université Paris Saclay, Saint Aubin, France, 50 pp., https://archive.ipcc.ch/pdf/supporting-material/AR6_WGI_EM_Regions.pdf .
IPCC, 2018b: Global warming of 1.5°C. An IPCC Special Report on the impacts of global warming of 1.5°C above pre-industrial levels and related global greenhouse gas emission pathways, in the context of strengthening the global response to the threat of climate change, sustainable development, and efforts to eradicate poverty [Masson-Delmotte, V., P. Zhai, H.-O. Pörtner, D. Roberts, J. Skea, P.R. Shukla, A. Pirani, W. Moufouma-Okia, C. Péan, R. Pidcock, S. Connors, J.B.R. Matthews, Y. Chen, X. Zhou, M.I. Gomis, E. Lonnoy, T. Maycock, M. Tignor, and T. Waterfield (eds.)]. In Press, 616 pp., www.ipcc.ch/sr15.
IPCC, 2018c: Summary for Policymakers. In: Global Warming of 1.5°C. An IPCC Special Report on the impacts of global warming of 1.5°C above pre-industrial levels and related global greenhouse gas emission pathways, in the context of strengthening the global response to the threat of climate change, sustainable development, and efforts to eradicate poverty[Masson-Delmotte, V., P. Zhai, H.-O. Pörtner, D. Roberts, J. Skea, P.R. Shukla, A. Pirani, W. Moufouma-Okia, C. Péan, R. Pidcock, S. Connors, J.B.R. Matthews, Y. Chen, X. Zhou, M.I. Gomis, E. Lonnoy, T. Maycock, M. Tignor, and T. Waterfield (eds.)]. In Press, pp. 3–24, www.ipcc.ch/sr15/chapter/spm.
IPCC, 2019a: Summary for Policymakers. In: IPCC Special Report on the Ocean and Cryosphere in a Changing Climate[Pörtner, H.-O., D.C. Roberts, V. Masson-Delmotte, P. Zhai, M. Tignor, E. Poloczanska, K. Mintenbeck, A. Alegría, M. Nicolai, A. Okem, J. Petzold, B. Rama, and N.M. Weyer (eds.)]. In Press, pp. 3–35, www.ipcc.ch/srocc/chapter/summary-for-policymakers.
IPCC, 2019b: Summary for Policymakers. In: Climate Change and Land: an IPCC special report on climate change, desertification, land degradation, sustainable land management, food security, and greenhouse gas fluxes in terrestrial ecosystems[Shukla, P.R., J. Skea, E.C. Buendia, V. Masson-Delmotte, H.-O. Pörtner, D.C. Roberts, P. Zhai, R. Slade, S. Connors, R. van Diemen, M. Ferrat, E. Haughey, S. Luz, S. Neogi, M. Pathak, J. Petzold, J.P. Pereira, P. Vyas, E. Huntley, K. Kissick, M. Belkacemi, and J. Malley (eds.)]. In Press, pp. 3–36, www.ipcc.ch/srccl/chapter/summary-for-policymakers.
IPCC, 2019c: Technical Summary [H.-O. Pörtner, D.C. Roberts, V. Masson-Delmotte, P. Zhai, E. Poloczanska, K. Mintenbeck, M. Tignor, A. Alegría, M. Nicolai, A. Okem, J. Petzold, B. Rama, N.M. Weyer (eds.)]. In: IPCC Special Report on the Ocean and Cryosphere in a Changing Climate[Pörtner, H.-O., D.C. Roberts, V. Masson-Delmotte, P. Zhai, M. Tignor, E. Poloczanska, K. Mintenbeck, A. Alegría, M. Nicolai, A. Okem, J. Petzold, B. Rama, and N.M. Weyer (eds.)]. In press, pp. 40–69, www.ipcc.ch/srocc/download.
Ippolitov, I.I., S. Loginov, E. Kharyutkina, and E.I. Moraru, 2014: Climate variability over the Asian territory of Russia during 1975–2012. Geography and Natural Resources, 35(4) , 310–318, doi: 10.1134/s1875372814040027.
Iqbal, W. et al., 2017: Mean climate and representation of jet streams in the CORDEX South Asia simulations by the regional climate model RCA4. Theoretical and Applied Climatology, 129(1–2) , 1–19, doi: 10.1007/s00704-016-1755-4.
Isaksen, K. et al., 2016: Recent warming on Spitsbergen – Influence of atmospheric circulation and sea ice cover. Journal of Geophysical Research: Atmospheres, 121(20) , 11913–11931, doi: 10.1002/2016jd025606.
Ito, R., T. Nakaegawa, and I. Takayabu, 2020a: Comparison of regional characteristics of land precipitation climatology projected by an MRI-AGCM multi-cumulus scheme and multi-SST ensemble with CMIP5 multi-model ensemble projections. Progress in Earth and Planetary Science, 7(1) , 77, doi: 10.1186/s40645-020-00394-4.
Ito, R., H. Shiogama, T. Nakaegawa, and I. Takayabu, 2020b: Uncertainties in climate change projections covered by the ISIMIP and CORDEX model subsets from CMIP5. Geoscientific Model Development, 13(3) , 859–872, doi: 10.5194/gmd-13-859-2020.
Iturbide, M. et al., 2019: The R-based climate4R open framework for reproducible climate data access and post-processing. Environmental Modelling & Software, 111, 42–54, doi: 10.1016/j.envsoft.2018.09.009.
Iturbide, M. et al., 2020: An update of IPCC climate reference regions for subcontinental analysis of climate model data: definition and aggregated datasets. Earth System Science Data, 12(4) , 2959–2970, doi: 10.5194/essd-12-2959-2020.
Iturbide, M. et al., 2021: Repository supporting the implementation of FAIR principles in the IPCC-WG1 Interactive Atlas. Zenodo. Retrieved from: http://doi.org/10.5281/zenodo.5171760.
Ivanov, M., K. Warrach-Sagi, and V. Wulfmeyer, 2018: Field significance of performance measures in the context of regional climate model evaluation. Part 1: temperature. Theoretical and Applied Climatology, 132(1–2) , 219–237, doi: 10.1007/s00704-017-2100-2.
Jacob, D. et al., 2012: Assessing the Transferability of the Regional Climate Model REMO to Different COordinated Regional Climate Downscaling EXperiment (CORDEX) Regions. Atmosphere, 3(1) , 181–199, doi: 10.3390/atmos3010181.
Jacob, D. et al., 2018: Climate Impacts in Europe Under +1.5°C Global Warming. Earth’s Future, 6(2) , 264–285, doi: 10.1002/2017ef000710.
James, R. et al., 2018: Evaluating Climate Models with an African Lens. Bulletin of the American Meteorological Society, 99(2) , 313–336, doi: 10.1175/bams-d-16-0090.1.
Jeong, D. and L. Sushama, 2018: Rain-on-snow events over North America based on two Canadian regional climate models. Climate Dynamics, 50(1) , 303–316, doi: 10.1007/s00382-017-3609-x.
Jiang, D., D. Hu, Z. Tian, and X. Lang, 2020: Differences between CMIP6 and CMIP5 Models in Simulating Climate over China and the East Asian Monsoon. Advances in Atmospheric Sciences, 37(10) , 1102–1118, doi: 10.1007/s00376-020-2034-y.
Jiang, Y. et al., 2020: Assessment of Uncertainty Sources in Snow Cover Simulation in the Tibetan Plateau. Journal of Geophysical Research: Atmospheres, 125(18) , e2020JD032674, doi: 10.1029/2020jd032674.
Jin, C.-S. et al., 2016: Evaluation of climatological tropical cyclone activity over the western North Pacific in the CORDEX-East Asia multi-RCM simulations. Climate Dynamics, 47(3) , 765–778, doi: 10.1007/s00382-015-2869-6.
Jin, Q. and C. Wang, 2017: A revival of Indian summer monsoon rainfall since 2002. Nature Climate Change, 7(8) , 587–594, doi: 10.1038/nclimate3348.
Jin, Q., J. Wei, Z.-L. Yang, and P. Lin, 2017: Irrigation-Induced Environmental Changes around the Aral Sea: An Integrated View from Multiple Satellite Observations. Remote Sensing, 9(9) , 900, doi: 10.3390/rs9090900.
Joetzjer, E., H. Douville, C. Delire, and P. Ciais, 2013: Present-day and future Amazonian precipitation in global climate models: CMIP5 versus CMIP3. Climate Dynamics, 41(11–12) , 2921–2936, doi: 10.1007/s00382-012-1644-1.
Jones, C. and L.M. Carvalho, 2013: Climate Change in the South American Monsoon System: Present Climate and CMIP5 Projections. Journal of Climate, 26(17) , 6660–6678, doi: 10.1175/jcli-d-12-00412.1.
Jones, D. et al., 2013: An updated analysis of homogeneous temperature data at Pacific Island stations. Australian Meteorological and Oceanographic Journal, 63(2) , 285–302, doi: 10.22499/2.6302.002.
Jones, J.M. et al., 2016: Assessing recent trends in high-latitude Southern Hemisphere surface climate. Nature Climate Change, 6(10) , 917–926, doi: 10.1038/nclimate3103.
Jones, M.E. et al., 2019: Sixty Years of Widespread Warming in the Southern Middle and High Latitudes (1957–2016). Journal of Climate, 32(20) , 6875–6898, doi: 10.1175/jcli-d-18-0565.1.
Jones, P.D., C. Harpham, A. Burton, and C.M. Goodess, 2016a: Downscaling regional climate model outputs for the Caribbean using a weather generator. International Journal of Climatology, 36(12) , 4141–4163, doi: 10.1002/joc.4624.
Jones, P.D. et al., 2016b: Long-term trends in precipitation and temperature across the Caribbean. International Journal of Climatology, 36(9) , 3314–3333, doi: 10.1002/joc.4557.
Jovanovic, B., K. Braganza, D. Collins, and D. Jones, 2013: Climate variations and change evident in high-quality climate data for Australia’s Antarctic and remote island weather stations. Australian Meteorological and Oceanographic Journal, 62(4) , 247–261, doi: 10.22499/2.6204.005.
Juneng, L. et al., 2016: Sensitivity of Southeast Asia rainfall simulations to cumulus and air–sea flux parameterizations in RegCM4. Climate Research, 69(1) , 59–77, doi: 10.3354/cr01386.
Jury, M.R., 2013: Climate trends in southern Africa. South African Journal of Science, 109(1/2) , 1–11, doi: 10.1590/sajs.2013/980.
Jylhä, K., S. Fronzek, H. Tuomenvirta, T.R. Carter, and K. Ruosteenoja, 2008: Changes in frost, snow and Baltic sea ice by the end of the twenty-first century based on climate model projections for Europe. Climatic Change, 86(3–4) , 441–462, doi: 10.1007/s10584-007-9310-z.
Kagawa-Viviani, A.K. and T.W. Giambelluca, 2020: Spatial Patterns and Trends in Surface Air Temperatures and Implied Changes in Atmospheric Moisture Across the Hawaiian Islands, 1905–2017. Journal of Geophysical Research: Atmospheres, 125(2) , e2019JD031571, doi: 10.1029/2019jd031571.
Kaiser-Weiss, A.K. et al., 2019: Added value of regional reanalyses for climatological applications. Environmental Research Communications, 1(7) , 071004, doi: 10.1088/2515-7620/ab2ec3.
Kalognomou, E.-A. et al., 2013: A Diagnostic Evaluation of Precipitation in CORDEX Models over Southern Africa. Journal of Climate, 26(23) , 9477–9506, doi: 10.1175/jcli-d-12-00703.1.
Kamil, S. et al., 2019: Long-term ENSO relationship to precipitation and storm frequency over western Himalaya–Karakoram–Hindukush region during the winter season. Climate Dynamics, 53(9–10) , 5265–5278, doi: 10.1007/s00382-019-04859-1.
Kang, I.-S., I.U. Rashid, F. Kucharski, M. Almazroui, and A.K. Alkhalaf, 2015: Multidecadal Changes in the Relationship between ENSO and Wet-Season Precipitation in the Arabian Peninsula. Journal of Climate, 28(12) , 4743–4752, doi: 10.1175/jcli-d-14-00388.1.
Kang, S., E.-S. Im, and E.A.B. Eltahir, 2019: Future climate change enhances rainfall seasonality in a regional model of western Maritime Continent. Climate Dynamics, 52(1–2) , 747–764, doi: 10.1007/s00382-018-4164-9.
Kaplan, A. et al., 1998: Analyses of global sea surface temperature 1856–1991. Journal of Geophysical Research: Oceans, 103(C9) , 18567–18589, doi: 10.1029/97jc01736.
Karim, R., G. Tan, B. Ayugi, H. Babaousmail, and F. Liu, 2020: Evaluation of Historical CMIP6 Model Simulations of Seasonal Mean Temperature over Pakistan during 1970–2014. Atmosphere, 11(9) , 1005, doi: 10.3390/atmos11091005.
Karlsson, N.B. et al., 2020: Surface accumulation in Northern Central Greenland during the last 300 years. Annals of Glaciology, 61(81) , 214–224, doi: 10.1017/aog.2020.30.
Karmacharya, J., R. Jones, W. Moufouma-Okia, and M. New, 2017a: Evaluation of the added value of a high-resolution regional climate model simulation of the South Asian summer monsoon climatology. International Journal of Climatology, 37(9) , 3630–3643, doi: 10.1002/joc.4944.
Karmacharya, J., M. New, R. Jones, and R. Levine, 2017b: Added value of a high-resolution regional climate model in simulation of intraseasonal variability of the South Asian summer monsoon. International Journal of Climatology, 37(2) , 1100–1116, doi: 10.1002/joc.4767.
Karmalkar, A.V., 2018: Interpreting Results from the NARCCAP and NA-CORDEX Ensembles in the Context of Uncertainty in Regional Climate Change Projections. Bulletin of the American Meteorological Society, 99(10) , 2093–2106, doi: 10.1175/bams-d-17-0127.1.
Karmalkar, A.V., R.S. Bradley, and H.F. Diaz, 2011: Climate change in Central America and Mexico: regional climate model validation and climate change projections. Climate Dynamics, 37(3–4) , 605–629, doi: 10.1007/s00382-011-1099-9.
Karmalkar, A.V. et al., 2013: A review of observed and projected changes in climate for the islands in the Caribbean. Atmósfera, 26(2) , 283–309, doi: 10.1016/s0187-6236(13)71076-2.
Katragkou, E. et al., 2015: Regional climate hindcast simulations within EURO-CORDEX: evaluation of a WRF multi-physics ensemble. Geoscientific Model Development, 8(3) , 603–618, doi: 10.5194/gmd-8-603-2015.
Kattsov, V.M., I.M. Shkolnik, and S. Efimov, 2017: Climate change projections in Russian regions: The detailing in physical and probability spaces. Russian Meteorology and Hydrology, 42(7) , 452–460, doi: 10.3103/s1068373917070044.
Katzfey, J. et al., 2016: High-resolution simulations for Vietnam – methodology and evaluation of current climate. Asia-Pacific Journal of Atmospheric Sciences, 52(2) , 91–106, doi: 10.1007/s13143-016-0011-2.
Kawase, H. et al., 2021: Regional Characteristics of Future Changes in Snowfall in Japan under RCP2.6 and RCP8.5 Scenarios. SOLA, 17, 1–7, doi: 10.2151/sola.2021-001.
Keener, V.W., J.J. Marra, M.L. Finucane, D. Spooner, and M.H. Smith (eds.), 2012: Climate Change and Pacific islands: Indicators and Impacts. Report for the 2012 Pacific Islands Regional Climate Assessment (PIRCA). Island Press, Washington, DC, USA, 170 pp., https://pirca.org/2016/01/26/download-pirca/.
Keener, V.W. et al., 2018: Hawai‘i and U.S.-Affiliated Pacific Islands. In: Impacts, Risks, and Adaptation in the United States: Fourth National Climate Assessment, Volume II[Reidmiller, D.R., C.W. Avery, D.R. Easterling, K.E. Kunkel, K.L.M. Lewis, T.K. Maycock, and B.C. Stewart (eds.)]. U.S. Global Change Research Program, Washington, DC, USA, pp. 1242–1308, doi: 10.7930/nca4.2018.ch27.
Kelley, C., M. Ting, R. Seager, and Y. Kushnir, 2012: The relative contributions of radiative forcing and internal climate variability to the late 20th Century winter drying of the Mediterranean region. Climate Dynamics, 38(9–10) , 2001–2015, doi: 10.1007/s00382-011-1221-z.
Kendon, E.J. et al., 2019: Enhanced future changes in wet and dry extremes over Africa at convection-permitting scale. Nature Communications, 10(1) , doi: 10.1038/s41467-019-09776-9.
Kennedy, J.J., N.A. Rayner, C.P. Atkinson, and R.E. Killick, 2019: An Ensemble Data Set of Sea Surface Temperature Change From 1850: The Met Office Hadley Centre HadSST.4.0.0.0 Data Set. Journal of Geophysical Research: Atmospheres, 124(14) , 7719–7763, doi: 10.1029/2018jd029867.
Khan, N., S. Shahid, T. Ismail, and X.-J. Wang, 2019: Spatial distribution of unidirectional trends in temperature and temperature extremes in Pakistan. Theoretical and Applied Climatology, 136(3–4) , 899–913, doi: 10.1007/s00704-018-2520-7.
Khan, N., S. Shahid, E.S. Chung, F. Behlil, and M.S.J. Darwish, 2020: Spatiotemporal changes in precipitation extremes in the arid province of Pakistan with removal of the influence of natural climate variability. Theoretical and Applied Climatology, 142(3–4) , 1447–1462, doi: 10.1007/s00704-020-03389-9.
Kharyutkina, E., S. Loginov, and I.I. Ippolitov, 2016: Influence of radiation and circulation factors on climate change in Western Siberia at the end of the 20th century and beginning of the 21st century. Izvestiya, Atmospheric and Oceanic Physics, 52(6) , 579–586, doi: 10.1134/s0001433816060098.
Khaydarov, M. and L. Gerlitz, 2019: Climate variability and change over Uzbekistan – an analysis based on high resolution CHELSA data. Central Asian Journal of Water Research, 5(2) , 1–19, doi: 10.29258/cajwr/2019-r1.v5-2/1-19.eng.
Khlebnikova, E.I., V.M. Kattsov, A.A. Pikaleva, and I.M. Shkolnik, 2018: Assessment of Climate Change Impacts on the Economic Development of the Russian Arctic in the 21st Century. Russian Meteorology and Hydrology, 43(6) , 347–356, doi: 10.3103/s1068373918060018.
Kieu-Thi, X. et al., 2016: Rainfall and Tropical Cyclone Activity over Vietnam Simulated and Projected by the Non-Hydrostatic Regional Climate Model – NHRCM. Journal of the Meteorological Society of Japan. Series II, 94A, 135–150, doi: 10.2151/jmsj.2015-057.
Kim, G. et al., 2020: Evaluation and Projection of Regional Climate over East Asia in CORDEX-East Asia Phase I Experiment. Asia-Pacific Journal of Atmospheric Sciences, 57(1) , 119–134, doi: 10.1007/s13143-020-00180-8.
Kim, H.-S., Y.-S. Chung, P.P. Tans, and M.-B. Yoon, 2016: Climatological variability of air temperature and precipitation observed in South Korea for the last 50 years. Air Quality, Atmosphere & Health, 9(6) , 645–651, doi: 10.1007/s11869-015-0366-z.
Kim, I.W., J. Oh, S. Woo, and R.H. Kripalani, 2018: Evaluation of precipitation extremes over the Asian domain: observation and modelling studies. Climate Dynamics, 52(3–4) , 1–26, doi: 10.1007/s00382-018-4193-4.
Kim, Y., M. Jun, S.-K. Min, M.-S. Suh, and H.-S. Kang, 2016: Spatial analysis of future East Asian seasonal temperature using two regional climate model simulations. Asia-Pacific Journal of Atmospheric Sciences, 52(2) , 237–249, doi: 10.1007/s13143-016-0022-z.
King, J.C. et al., 2017: The Impact of Föhn Winds on Surface Energy Balance During the 2010–2011 Melt Season Over Larsen C Ice Shelf, Antarctica. Journal of Geophysical Research: Atmospheres, 122(22) , 12062–12076, doi: 10.1002/2017jd026809.
Kirchmeier-Young, M.C., H. Wan, X. Zhang, and S.I. Seneviratne, 2019: Importance of Framing for Extreme Event Attribution: The Role of Spatial and Temporal Scales. Earth’s Future, 7(10) , 1192–1204, doi: 10.1029/2019ef001253.
Kirono, D.G. et al., 2015: Historical and future seasonal rainfall variability in Nusa Tenggara Barat Province, Indonesia: Implications for the agriculture and water sectors. Climate Risk Management, 12, 45–58, doi: 10.1016/j.crm.2015.12.002.
Kirtman, B., A. Adedoyin, and N. Bindoff, 2013: Near-term Climate Change: Projections and Predictability. In: Climate Change 2013: The Physical Science Basis. Contribution of Working Group I to the Fifth Assessment Report of the Intergovernmental Panel on Climate Change[Stocker, T.F., D. Qin, G.-K. Plattner, M. Tignor, S.K. Allen, J. Boschung, A. Nauels, Y. Xia, V. Bex, and P.M. Midgley (eds.)]. Cambridge University Press, Cambridge, United Kingdom and New York, NY, USA, pp. 953–1028, doi: 10.1017/cbo9781107415324.023.
Kisembe, J. et al., 2019: Evaluation of rainfall simulations over Uganda in CORDEX regional climate models. Theoretical and Applied Climatology, 137(1–2) , 1117–1134, doi: 10.1007/s00704-018-2643-x.
Kitoh, A., 2017: The Asian Monsoon and its Future Change in Climate Models: A Review. Journal of the Meteorological Society of Japan. Series II, 95(1) , 7–33, doi: 10.2151/jmsj.2017-002.
Kittel, C. et al., 2021: Diverging future surface mass balance between the Antarctic ice shelves and grounded ice sheet. The Cryosphere, 15(3) , 1215–1236, doi: 10.5194/tc-15-1215-2021.
Kjellström, E. et al., 2018: European climate change at global mean temperature increases of 1.5 and 2°C above pre-industrial conditions as simulated by the EURO-CORDEX regional climate models. Earth System Dynamics, 9(2) , 459–478, doi: 10.5194/esd-9-459-2018.
Klutse, N.A.B. et al., 2016: Daily characteristics of West African summer monsoon precipitation in CORDEX simulations. Theoretical and Applied Climatology, 123(1–2) , 369–386, doi: 10.1007/s00704-014-1352-3.
Klutse, N.A.B. et al., 2018: Potential impact of 1.5°C and 2°C global warming on consecutive dry and wet days over West Africa. Environmental Research Letters, 13(5) , 055013, doi: 10.1088/1748-9326/aab37b.
Knippertz, P., M. Christoph, and P. Speth, 2003: Long-term precipitation variability in Morocco and the link to the large-scale circulation in recent and future climates. Meteorology and Atmospheric Physics, 83(1–2) , 67–88, doi: 10.1007/s00703-002-0561-y.
Knowles, N., 2015: Trends in snow cover and related quantities at weather stations in the conterminous United States. Journal of Climate, 28(19) , 7518–7528, doi: 10.1175/jcli-d-15-0051.1.
Knutson, T.R. and F. Zeng, 2018: Model Assessment of Observed Precipitation Trends over Land Regions: Detectable Human Influences and Possible Low Bias in Model Trends. Journal of Climate, 31(12) , 4617–4637, doi: 10.1175/jcli-d-17-0672.1.
Knutson, T.R. et al., 2019: Tropical Cyclones and Climate Change Assessment: Part I: Detection and Attribution. Bulletin of the American Meteorological Society, 100(10) , 1987–2007, doi: 10.1175/bams-d-18-0189.1.
Knutti, R., D. Masson, and A. Gettelman, 2013: Climate model genealogy: Generation CMIP5 and how we got there. Geophysical Research Letters, 40, 1194–1199, doi: 10.1002/grl.50256.
Koenig, L.S. et al., 2016: Annual Greenland accumulation rates (2009–2012) from airborne snow radar. The Cryosphere, 10(4) , 1739–1752, doi: 10.5194/tc-10-1739-2016.
Koenigk, T., P. Berg, and R. Döscher, 2015: Arctic climate change in an ensemble of regional CORDEX simulations. Polar Research, 34(1) , 24603, doi: 10.3402/polar.v34.24603.
Kohler, J., O. Brandt, M. Johansson, and T. Callaghan, 2006: A long-term Arctic snow depth record from Abisko, northern Sweden, 1913–2004. Polar Research, 25(2) , 91–113, doi: 10.1111/j.1751-8369.2006.tb00026.x.
Kohnemann, S.H.E., G. Heinemann, D.H. Bromwich, and O. Gutjahr, 2017: Extreme Warming in the Kara Sea and Barents Sea during the Winter Period 2000–16. Journal of Climate, 30(22) , 8913–8927, doi: 10.1175/jcli-d-16-0693.1.
Kokorev, V.A. and A.B. Sherstiukov, 2015: Meteorological Data for Studying the Current and Projected for the Future Climate Change in Russia [in Russian]. Arctica.Natural Sciences, 2(3) , 5–23, https://permafrost.su/sites/default/files/%D0%9A%D0%BE%D0%BA%D0%BE%D1%80%D0%B5%D0%B2%20%D0%92.%D0%90.%2C%20%D0%A8%D0%B5%D1%80%D1%81%D1%82%D1%8E%D0%BA%D0%BE%D0%B2%20%D0%90.%D0%91._%D0%90%D1%80%D0%BA%D1%82%D0%B8%D0%BA%D0%B021_2015.pdf .
Komurcu, M., K.A. Emanuel, M. Huber, and R.P. Acosta, 2018: High-Resolution Climate Projections for the Northeastern United States Using Dynamical Downscaling at Convection-Permitting Scales. Earth and Space Science, 5(11) , 801–826, doi: 10.1029/2018ea000426.
Kotlarski, S. et al., 2014: Regional climate modeling on European scales: a joint standard evaluation of the EURO-CORDEX RCM ensemble. Geoscientific Model Development, 7(4) , 1297–1333, doi: 10.5194/gmd-7-1297-2014.
Kotlarski, S. et al., 2019: Observational uncertainty and regional climate model evaluation: A pan-European perspective. International Journal of Climatology, 39(9) , 3730–3749, doi: 10.1002/joc.5249.
Kovats, R.S. et al., 2014: Europe. In: Climate Change 2014: Impacts, Adaptation, and Vulnerability. Part B: Regional Aspects. Contribution of Working Group II to the Fifth Assessment Report of the Intergovernmental Panel on Climate Change[Barros, V.R., C.B. Field, D.J. Dokken, M.D. Mastrandrea, K.J. Mach, T.E. Bilir, M. Chatterjee, K.L. Ebi, Y.O. Estrada, R.C. Genova, B. Girma, E.S. Kissel, A.N. Levy, S. MacCracken, P.R. Mastrandrea, and L.L. White (eds.)]. Cambridge University Press, Cambridge, United Kingdom and New York, NY, USA, pp. 1267–1326, doi: 10.1017/cbo9781107415386.003.
Krakovska, S.V., 2018: Optimal ensemble of regional climate models for the ssessment of temperature regime change in Ukraine. Nature Management, 12(1) , 114–126, http://nature-nas.by/resources/journals/default/PRIRODA_1_2018.pdf .
Krakovska, S.V., L.V. Palamarchuk, N.V. Gnatiuk, T.M. Shpytal, and I.P. Shedemenko, 2017: Changes in precipitation distribution in Ukraine for the 21st century based on data of regional climate model ENSEMBLE. Geoinformatika, 4(64) , 62–74, www.geology.com.ua/en/7195-2/.
Krasting, J.P., A.J. Broccoli, K.W. Dixon, and J.R. Lanzante, 2013: Future changes in northern hemisphere snowfall. Journal of Climate, 26(20) , 7813–7828, doi: 10.1175/jcli-d-12-00832.1.
Krinner, G., J. Beaumet, V. Favier, M. Déqué, and C. Brutel-Vuilmet, 2019: Empirical Run-Time Bias Correction for Antarctic Regional Climate Projections With a Stretched-Grid AGCM. Journal of Advances in Modeling Earth Systems, 11(1) , 64–82, doi: 10.1029/2018ms001438.
Krinner, G., V. Kharin, R. Roehrig, J. Scinocca, and F. Codron, 2020: Historically-based run-time bias corrections substantially improve model projections of 100 years of future climate change. Communications Earth & Environment, 1(1) , 29, doi: 10.1038/s43247-020-00035-0.
Krishnan, R. et al., 2016: Deciphering the desiccation trend of the South Asian monsoon hydroclimate in a warming world. Climate Dynamics, 47(3–4) , 1007–1027, doi: 10.1007/s00382-015-2886-5.
Krishnan, R., J. Sanjay, C. Gnanaseelan, M. Mujumdar, A. Kulkarni, and S. Chakraborty (eds.), 2020: Assessment of Climate Change over the Indian Region: A Report of the Ministry of Earth Sciences (MoES), Government of India. Springer, Singapore, 226 pp., doi: 10.1007/978-981-15-4327-2.
Kröner, N. et al., 2017: Separating climate change signals into thermodynamic, lapse-rate and circulation effects: theory and application to the European summer climate. Climate Dynamics, 48(9) , 3425–3440, doi: 10.1007/s00382-016-3276-3.
Kruger, A.C. and S. Shongwe, 2004: Temperature trends in South Africa: 1960–2003. International Journal of Climatology, 24(15) , 1929–1945, doi: 10.1002/joc.1096.
Kruger, A.C. and S.S. Sekele, 2013: Trends in extreme temperature indices in South Africa: 1962–2009. International Journal of Climatology, 33(3) , 661–676, doi: 10.1002/joc.3455.
Kruger, A.C. and M.P. Nxumalo, 2017: Historical rainfall trends in South Africa: 1921–2015. Water SA, 43(2) , 285, doi: 10.4314/wsa.v43i2.12.
Kruk, M.C. et al., 2015: On the state of the knowledge of rainfall extremes in the western and northern Pacific basin. International Journal of Climatology, 35(3) , 321–336, doi: 10.1002/joc.3990.
Kug, J.-S. et al., 2015: Two distinct influences of Arctic warming on cold winters over North America and East Asia. Nature Geoscience, 8(10) , 759–762, doi: 10.1038/ngeo2517.
Kuleshov, Y., P. Gregory, A.B. Watkins, and R.J.B. Fawcett, 2020: Tropical cyclone early warnings for the regions of the Southern Hemisphere: strengthening resilience to tropical cyclones in small island developing states and least developed countries. Natural Hazards, 104(2) , 1295–1313, doi: 10.1007/s11069-020-04214-2.
Kulkarni, A. et al., 2017: Observed climate variability and change over India. In: Climate Change over India: An Interim Report[Krishnan, R. and J. Sanjay (eds.)]. Centre for Climate Change Research (CCCR), Indian Institute of Tropical Meteorology (IITM), Pune, India, pp. 3–9, http://cccr.tropmet.res.in/home/docs/cccr/climate-change-report-2017.pdf .
Kumar, K.N., D. Entekhabi, and A. Molini, 2015: Hydrological extremes in hyperarid regions: A diagnostic characterization of intense precipitation over the Central Arabian Peninsula. Journal of Geophysical Research: Atmospheres, 120(5) , 1637–1650, doi: 10.1002/2014jd022341.
Kumar, R., M. Stephens, and T. Weir, 2013: Temperature trends in Fiji: a clear signal of climate change. The South Pacific Journal of Natural and Applied Sciences, 31(1) , 27, doi: 10.1071/sp13002.
Kumi, N. and B.J. Abiodun, 2018: Potential impacts of 1.5°C and 2°C global warming on rainfall onset, cessation and length of rainy season in West Africa. Environmental Research Letters, 13(5) , 055009, doi: 10.1088/1748-9326/aab89e.
Kunkel, K.E. et al., 2007: Trend identification in twentieth-century U.S. snowfall: The challenges. Journal of Atmospheric and Oceanic Technology, 24(1) , 64–73, doi: 10.1175/jtech2017.1.
Kunkel, K.E. et al., 2016: Trends and Extremes in Northern Hemisphere Snow Characteristics. Current Climate Change Reports, 2(2) , 65–73, doi: 10.1007/s40641-016-0036-8.
Kusunoki, S., 2017: Future changes in global precipitation projected by the atmospheric model MRI-AGCM3.2H with a 60-km size. Atmosphere, 8(5) , 6–14, doi: 10.3390/atmos8050093.
Kusunoki, S., 2018a: Future changes in precipitation over East Asia projected by the global atmospheric model MRI-AGCM3.2. Climate Dynamics, 51(11) , 4601–4617, doi: 10.1007/s00382-016-3499-3.
Kusunoki, S., 2018b: Is the global atmospheric model MRI-AGCM3.2 better than the CMIP5 atmospheric models in simulating precipitation over East Asia?Climate Dynamics, 51(11) , 4489–4510, doi: 10.1007/s00382-016-3335-9.
Kusunoki, S., R. Mizuta, and M. Hosaka, 2015: Future changes in precipitation intensity over the Arctic projected by a global atmospheric model with a 60-km grid size. Polar Science, 9(3) , 277–292, doi: 10.1016/j.polar.2015.08.001.
Kwan, M.S., F.T. Tangang, and L. Juneng, 2014: Present-day regional climate simulation over Malaysia and western Maritime Continent region using PRECIS forced with ERA40 reanalysis. Theoretical and Applied Climatology, 115(1–2) , 1–14, doi: 10.1007/s00704-013-0873-5.
Landelius, T., P. Dahlgren, S. Gollvik, A. Jansson, and E. Olsson, 2016: A high-resolution regional reanalysis for Europe. Part 2: 2D analysis of surface temperature, precipitation and wind. Quarterly Journal of the Royal Meteorological Society, 142(698) , 2132–2142, doi: 10.1002/qj.2813.
Landrum, L. and M.M. Holland, 2020: Extremes become routine in an emerging new Arctic. Nature Climate Change, 10(12) , 1108–1115, doi: 10.1038/s41558-020-0892-z.
Lange, S., 2019a: Trend-preserving bias adjustment and statistical downscaling with ISIMIP3BASD (v1.0). Geoscientific Model Development, 12(7) , 3055–3070, doi: 10.5194/gmd-12-3055-2019.
Lange, S., 2019b: WFDE5 over land merged with ERA5 over the ocean (W5E5). V. 1.0. GFZ Data Services. Retrieved from: https://doi.org/10.5880/pik.2019.023.
Larue, F. et al., 2017: Validation of GlobSnow-2 snow water equivalent over Eastern Canada. Remote Sensing of Environment, 194, 264–277, doi: 10.1016/j.rse.2017.03.027.
Latif, M., F.S. Syed, and A. Hannachi, 2017: Rainfall trends in the South Asian summer monsoon and its related large-scale dynamics with focus over Pakistan. Climate Dynamics, 48(11) , 3565–3581, doi: 10.1007/s00382-016-3284-3.
Latif, M., A. Hannachi, and F.S. Syed, 2018: Analysis of rainfall trends over Indo-Pakistan summer monsoon and related dynamics based on CMIP5 climate model simulations. International Journal of Climatology, 38, e577–e595, doi: 10.1002/joc.5391.
Lavado Casimiro, W.S., D. Labat, J. Ronchail, J.C. Espinoza, and J.L. Guyot, 2012: Trends in rainfall and temperature in the Peruvian Amazon–Andes basin over the last 40 years (1965–2007). Hydrological Processes, 27(20) , 2944–2957, doi: 10.1002/hyp.9418.
Lee, J.-Y. et al., 2017: The long-term variability of Changma in the East Asian summer monsoon system: A review and revisit. Asia-Pacific Journal of Atmospheric Sciences, 53(2) , 257–272, doi: 10.1007/s13143-017-0032-5.
Lee, T.-C., T.R. Knutson, T. Nakaegawa, M. Ying, and E.J. Cha, 2020: Third assessment on impacts of climate change on tropical cyclones in the Typhoon Committee Region – Part I: Observed changes, detection and attribution. Tropical Cyclone Research and Review, 9(1) , 1–22, doi: 10.1016/j.tcrr.2020.03.001.
Legasa, M.N. et al., 2020: Assessing Multidomain Overlaps and Grand Ensemble Generation in CORDEX Regional Projections. Geophysical Research Letters, 47(4) , e2019GL086799, doi: 10.1029/2019gl086799.
Lehner, F. et al., 2020: Partitioning climate projection uncertainty with multiple large ensembles and CMIP5/6. Earth System Dynamics, 11(2) , 491–508, doi: 10.5194/esd-11-491-2020.
Lelieveld, J. et al., 2016: Strongly increasing heat extremes in the Middle East and North Africa (MENA) in the 21st century. Climatic Change, 137(1–2) , 245–260, doi: 10.1007/s10584-016-1665-6.
Lemos, M.C., C.J. Kirchhoff, and V. Ramprasad, 2012: Narrowing the climate information usability gap. Nature Climate Change, 2(11) , 789–794, doi: 10.1038/nclimate1614.
Lenaerts, J.T.M., J. Fyke, and B. Medley, 2018: The Signature of Ozone Depletion in Recent Antarctic Precipitation Change: A Study With the Community Earth System Model. Geophysical Research Letters, 45(23) , 12931–12939, doi: 10.1029/2018gl078608.
Lenaerts, J.T.M., B. Medley, M.R. Broeke, and B. Wouters, 2019: Observing and Modeling Ice Sheet Surface Mass Balance. Reviews of Geophysics, 57(2) , 376–420, doi: 10.1029/2018rg000622.
Lenaerts, J.T.M., M. Vizcaino, J. Fyke, L. van Kampenhout, and M.R. van den Broeke, 2016: Present-day and future Antarctic ice sheet climate and surface mass balance in the Community Earth System Model. Climate Dynamics, 47(5–6) , 1367–1381, doi: 10.1007/s00382-015-2907-4.
Lenaerts, J.T.M. et al., 2013: Recent snowfall anomalies in Dronning Maud Land, East Antarctica, in a historical and future climate perspective. Geophysical Research Letters, 40(11) , 2684–2688, doi: 10.1002/grl.50559.
Lenderink, G. et al., 2014: Preparing local climate change scenarios for the Netherlands using resampling of climate model output. Environmental Research Letters, 9(11) , 115008, doi: 10.1088/1748-9326/9/11/115008.
Lennard, C.J., G. Nikulin, A. Dosio, and W. Moufouma-Okia, 2018: On the need for regional climate information over Africa under varying levels of global warming. Environmental Research Letters, 13(6) , 060401, doi: 10.1088/1748-9326/aab2b4.
Li, B., Y. Chen, and X. Shi, 2012: Why does the temperature rise faster in the arid region of northwest China?Journal of Geophysical Research: Atmospheres, 117(D16) , D16115, doi: 10.1029/2012jd017953.
Li, B., Y. Chen, X. Shi, Z. Chen, and W. Li, 2013: Temperature and precipitation changes in different environments in the arid region of northwest China. Theoretical and Applied Climatology, 112(3–4) , 589–596, doi: 10.1007/s00704-012-0753-4.
Li, D., T. Zhou, L. Zou, W. Zhang, and L. Zhang, 2018a: Extreme High-Temperature Events Over East Asia in 1.5°C and 2°C Warmer Futures: Analysis of NCAR CESM Low-Warming Experiments. Geophysical Research Letters, 45(3) , 1541–1550, doi: 10.1002/2017gl076753.
Li, D. et al., 2018b: Present climate evaluation and added value analysis of dynamically downscaled simulations of CORDEX-East Asia. Journal of Applied Meteorology and Climatology, 57(10) , 2317–2341, doi: 10.1175/jamc-d-18-0008.1.
Li, J., Z. Liu, Z. Yao, and R. Wang, 2019: Comprehensive assessment of Coupled Model Intercomparison Project Phase 5 global climate models using observed temperature and precipitation over mainland Southeast Asia. International Journal of Climatology, 39(10) , 4139–4153, doi: 10.1002/joc.6064.
Li, J. et al., 2015: Precipitation over East Asia simulated by NCAR CAM5 at different horizontal resolutions. Journal of Advances in Modeling Earth Systems, 7(2) , 774–790, doi: 10.1002/2014ms000414.
Li, Q. et al., 2017: Comparisons of Time Series of Annual Mean Surface Air Temperature for China since the 1900s: Observations, Model Simulations, and Extended Reanalysis. Bulletin of the American Meteorological Society, 98(4) , 699–711, doi: 10.1175/bams-d-16-0092.1.
Li, W., L. Li, M. Ting, and Y. Liu, 2012: Intensification of Northern Hemisphere subtropical highs in a warming climate. Nature Geoscience, 5(11) , 830–834, doi: 10.1038/ngeo1590.
Li, Z., Y. Sun, T. Li, Y. Ding, and T. Hu, 2019: Future Changes in East Asian Summer Monsoon Circulation and Precipitation Under 1.5 to 5°C of Warming. Earth’s Future, 7(12) , 1391–1406, doi: 10.1029/2019ef001276.
Liebmann, B. et al., 2017: Climatology and Interannual Variability of Boreal Spring Wet Season Precipitation in the Eastern Horn of Africa and Implications for Its Recent Decline. Journal of Climate, 30(10) , 3867–3886, doi: 10.1175/jcli-d-16-0452.1.
Limsakul, A. and P. Singhruck, 2016: Long-term trends and variability of total and extreme precipitation in Thailand. Atmospheric Research, 169, 301–317, doi: 10.1016/j.atmosres.2015.10.015.
Lin, L. et al., 2019: CAM6 simulation of mean and extreme precipitation over Asia: sensitivity to upgraded physical parameterizations and higher horizontal resolution. Geoscientific Model Development, 12(8) , 3773–3793, doi: 10.5194/gmd-12-3773-2019.
Lindsay, R., M. Wensnahan, A. Schweiger, and J. Zhang, 2014: Evaluation of seven different atmospheric reanalysis products in the arctic. Journal of Climate, 27(7) , 2588–2606, doi: 10.1175/jcli-d-13-00014.1.
Lindvall, J. and G. Svensson, 2015: The diurnal temperature range in the CMIP5 models. Climate Dynamics, 44(1) , 405–421, doi: 10.1007/s00382-014-2144-2.
Lionello, P. and L. Scarascia, 2018: The relation between climate change in the Mediterranean region and global warming. Regional Environmental Change, 18(5) , 1481–1493, doi: 10.1007/s10113-018-1290-1.
Lionello, P. et al., 2012: Introduction: Mediterranean Climate – Background Information. In: The Climate of the Mediterranean Region: From the Past to the Future[Lionello, P. (ed.)]. Elsevier, pp. xxxv–xc, doi: 10.1016/b978-0-12-416042-2.00012-4.
Liu, C. et al., 2017: Continental-scale convection-permitting modeling of the current and future climate of North America. Climate Dynamics, 49(1) , 71–95, doi: 10.1007/s00382-016-3327-9.
Liu, H.W., T.J. Zhou, Y.X. Zhu, and Y.H. Lin, 2012: The strengthening East Asia summer monsoon since the early 1990s. Chinese Science Bulletin, 57(13) , 1553–1558, doi: 10.1007/s11434-012-4991-8.
Liu, W. et al., 2018: Global Freshwater Availability Below Normal Conditions and Population Impact Under 1.5 and 2°C Stabilization Scenarios. Geophysical Research Letters, 45(18) , 9803–9813, doi: 10.1029/2018gl078789.
Llopart, M., E. Coppola, F. Giorgi, R.P. da Rocha, and S. Cuadra, 2014: Climate change impact on precipitation for the Amazon and La Plata basins. Climatic Change, 125(1) , 111–125, doi: 10.1007/s10584-014-1140-1.
Llopart, M. et al., 2021: Assessing changes in the atmospheric water budget as drivers for precipitation change over two CORDEX-CORE domains. Climate Dynamics, 57(5–6) , 1615–1628, doi: 10.1007/s00382-020-05539-1.
Lloyd, E.A. and N. Oreskes, 2018: Climate Change Attribution: When Is It Appropriate to Accept New Methods?Earth’s Future, 6(3) , 311–325, doi: 10.1002/2017ef000665.
Loginov, S., I.I. Ippolitov, and E. Kharyutkina, 2014: The relationship of surface air temperature, heat balance at the surface, and radiative balance at the top of atmosphere over the Asian territory of Russia using reanalysis and remote-sensing data. International Journal of Remote Sensing, 35(15) , 5878–5898, doi: 10.1080/01431161.2014.945007.
Loginov, V.F. et al., 2018: Climate Research in the Institute for Nature Management of the National Academy of Sciences of Belarus. Nature Management, 1, 67–86, http://nature-nas.by/resources/journals/default/PRIRODA_1_2018.pdf .
Loh, J., F. Tangang, L. Juneng, D. Hein, and D.-I. Lee, 2016: Projected rainfall and temperature changes over Malaysia at the end of the 21st century based on PRECIS modelling system. Asia-Pacific Journal of Atmospheric Sciences, 52(2) , 191–208, doi: 10.1007/s13143-016-0019-7.
López-Moreno, J.I., S. Goyette, and M. Beniston, 2009: Impact of climate change on snowpack in the Pyrenees: Horizontal spatial variability and vertical gradients. Journal of Hydrology, 374(3–4) , 384–396, doi: 10.1016/j.jhydrol.2009.06.049.
Lorenz, S., S. Dessai, P.M. Forster, and J. Paavola, 2015: Tailoring the visual communication of climate projections for local adaptation practitioners in Germany and the UK. Philosophical Transactions of the Royal Society A: Mathematical, Physical and Engineering Sciences, 373(2055) , 20140457, doi: 10.1098/rsta.2014.0457.
Losada, T. et al., 2010: Tropical response to the Atlantic Equatorial mode: AGCM multimodel approach. Climate Dynamics, 35(1) , 45–52, doi: 10.1007/s00382-009-0624-6.
Lowe, J. et al., 2018: UKCP18 Science Overview Report. UK Met Office, 73 pp., www.metoffice.gov.uk/pub/data/weather/uk/ukcp18/science-reports/UKCP18-Overview-report.pdf .
Lucas-Picher, P., S. Somot, M. Déqué, B. Decharme, and A. Alias, 2013: Evaluation of the regional climate model ALADIN to simulate the climate over North America in the CORDEX framework. Climate Dynamics, 41(5) , 1117–1137, doi: 10.1007/s00382-012-1613-8.
Lucas-Picher, P. et al., 2012: Very high resolution regional climate model simulations over Greenland: Identifying added value. Journal of Geophysical Research: Atmospheres, 117(2) , D02108, doi: 10.1029/2011jd016267.
Luo, J., H. Chen, and B. Zhou, 2020: Comparison of snowfall variations over China identified from different snowfall/rainfall discrimination methods. Journal of Meteorological Research, 34(5) , 1114–1128, doi: 10.1007/s13351-020-0004-z.
Luo, M. et al., 2018: Defining spatiotemporal characteristics of climate change trends from downscaled GCMs ensembles: how climate change reacts in Xinjiang, China. International Journal of Climatology, 38(5) , 2538–2553, doi: 10.1002/joc.5425.
Luo, M. et al., 2019: Spatiotemporal characteristics of future changes in precipitation and temperature in Central Asia. International Journal of Climatology, 39(3) , 1571–1588, doi: 10.1002/joc.5901.
Luo, X., B. Wang, A.G. Frazier, and T.W. Giambelluca, 2020: Distinguishing Variability Regimes of Hawaiian Summer Rainfall: Quasi-Biennial and Interdecadal Oscillations. Geophysical Research Letters, 47(23) , e2020GL091260, doi: 10.1029/2020gl091260.
Luomaranta, A., J. Aalto, and K. Jylhä, 2019: Snow cover trends in Finland over 1961–2014 based on gridded snow depth observations. International Journal of Climatology, 39(7) , 3147–3159, doi: 10.1002/joc.6007.
Łupikasza, E.B. et al., 2019: The Role of Winter Rain in the Glacial System on Svalbard. Water, 11(2) , 334, doi: 10.3390/w11020334.
Lussana, C. et al., 2018: seNorge2 daily precipitation, an observational gridded dataset over Norway from 1957 to the present day. Earth System Science Data, 10(1) , 235–249, doi: 10.5194/essd-10-235-2018.
Lyon, B., 2014: Seasonal Drought in the Greater Horn of Africa and Its Recent Increase during the March–May Long Rains. Journal of Climate, 27(21) , 7953–7975, doi: 10.1175/jcli-d-13-00459.1.
Lyon, B. and D.G. DeWitt, 2012: A recent and abrupt decline in the East African long rains. Geophysical Research Letters, 39(2) , L02702, doi: 10.1029/2011gl050337.
Lyra, A. et al., 2018: Climate change projections over three metropolitan regions in Southeast Brazil using the non-hydrostatic Eta regional climate model at 5-km resolution. Theoretical and Applied Climatology, 132(1–2) , 663–682, doi: 10.1007/s00704-017-2067-z.
Lyu, Z., A.J. Orsi, and H. Goosse, 2020: Comparison of observed borehole temperatures in Antarctica with simulations using a forward model driven by climate model outputs covering the past millennium. Climate of the Past, 16(4) , 1411–1428, doi: 10.5194/cp-16-1411-2020.
MacAyeal, D.R. and O. Sergienko, 2013: The flexural dynamics of melting ice shelves. Annals of Glaciology, 54(63) , 1–10, doi: 10.3189/2013aog63a256.
Machguth, H. et al., 2016: Greenland surface mass-balance observations from the ice-sheet ablation area and local glaciers. Journal of Glaciology, 62(235) , 861–887, doi: 10.1017/jog.2016.75.
MacKellar, N., M. New, and C. Jack, 2014: Observed and modelled trends in rainfall and temperature for South Africa: 1960–2010. South African Journal of Science, 110(7/8) , 1–13, doi: 10.1590/sajs.2014/20130353.
Magaña, V., J.A. Amador, and S. Medina, 1999: The Midsummer Drought over Mexico and Central America. Journal of Climate, 12(6) , 1577–1588, doi: 10.1175/1520-0442(1999)012<1577:tmdoma>2.0.co;2.
Magnan, A.K. et al., 2019: Cross-Chapter Box 9: Integrative Cross-Chapter Box on Low-Lying Islands and Coasts. In: IPCC Special Report on the Ocean and Cryosphere in a Changing Climate[Pörtner, H.-O., D.C. Roberts, V. Masson-Delmotte, P. Zhai, M. Tignor, E. Poloczanska, K. Mintenbeck, A. Alegría, M. Nicolai, A. Okem, J. Petzold, B. Rama, and N.M. Weyer (eds.)]. In press, pp. 657–674, www.ipcc.ch/srocc/chapter/cross-chapter-box-9-integrative-cross-chapter-box-on-low-lying-islands-and-coasts.
Magrin, G.O. et al., 2014: Central and South America. In: Climate Change 2014: Impacts, Adaptation, and Vulnerability. Part B: Regional Aspects. Contribution of Working Group II to the Fifth Assessment Report of the Intergovernmental Panel on Climate Change[Barros, V.R., C.B. Field, D.J. Dokken, M.D. Mastrandrea, K.J. Mach, T.E. Bilir, M. Chatterjee, K.L. Ebi, Y.O. Estrada, R.C. Genova, B. Girma, E.S. Kissel, A.N. Levy, S. MacCracken, P.R. Mastrandrea, and L.L. White (eds.)]. Cambridge University Press, Cambridge, United Kingdom and New York, NY, USA, pp. 1499–1566, doi: 10.1017/cbo9781107415386.007.
Maher, N., S.B. Power, and J. Marotzke, 2021: More accurate quantification of model-to-model agreement in externally forced climatic responses over the coming century. Nature Communications, 12(1) , 788, doi: 10.1038/s41467-020-20635-w.
Mahmoudi, P., M. Mohammadi, and H. Daneshmand, 2019: Investigating the trend of average changes of annual temperatures in Iran. International Journal of Environmental Science and Technology, 16(2) , 1079–1092, doi: 10.1007/s13762-018-1664-4.
Mahoney, K. et al., 2021: Cool season precipitation projections for California and the Western United States in NA-CORDEX models. Climate Dynamics, 56(9–10) , 3081–3102, doi: 10.1007/s00382-021-05632-z.
Maidment, R.I., R.P. Allan, and E. Black, 2015: Recent observed and simulated changes in precipitation over Africa. Geophysical Research Letters, 42(19) , 8155–8164, doi: 10.1002/2015gl065765.
Maldonado, T., A. Rutgersson, E. Alfaro, J. Amador, and B. Claremar, 2016: Interannual variability of the midsummer drought in Central America and the connection with sea surface temperatures. Advances in Geosciences, 42, 35–50, doi: 10.5194/adgeo-42-35-2016.
Maloney, E.D. et al., 2014: North American Climate in CMIP5 Experiments: Part III: Assessment of Twenty-First-Century Projections. Journal of Climate, 27(6) , 2230–2270, doi: 10.1175/jcli-d-13-00273.1.
Mankin, J.S. and N.S. Diffenbaugh, 2015: Influence of temperature and precipitation variability on near-term snow trends. Climate Dynamics, 45(3–4) , 1099–1116, doi: 10.1007/s00382-014-2357-4.
Mannig, B. et al., 2013: Dynamical downscaling of climate change in Central Asia. Global and Planetary Change, 110, 26–39, doi: 10.1016/j.gloplacha.2013.05.008.
Manomaiphiboon, K., M. Octaviani, K. Torsri, and S. Towprayoon, 2013: Projected changes in means and extremes of temperature and precipitation over Thailand under three future emissions scenarios. Climate Research, 58(2) , 97–115, doi: 10.3354/cr01188.
Manzanas, R., L.K. Amekudzi, K. Preko, S. Herrera, and J.M. Gutiérrez, 2014: Precipitation variability and trends in Ghana: An intercomparison of observational and reanalysis products. Climatic Change, 124(4) , 805–819, doi: 10.1007/s10584-014-1100-9.
Marengo, J.A. and J.C. Espinoza, 2016: Extreme seasonal droughts and floods in Amazonia: causes, trends and impacts. International Journal of Climatology, 36(3) , 1033–1050, doi: 10.1002/joc.4420.
Marengo, J.A. et al., 2012: Recent developments on the South American monsoon system. International Journal of Climatology, 32(1) , 1–21, doi: 10.1002/joc.2254.
Marengo, J.A. et al., 2018a: Climatic characteristics of the 2010–2016 drought in the semiarid Northeast Brazil region. Anais da Academia Brasileira de Ciências, 90(2 suppl 1) , 1973–1985, doi: 10.1590/0001-3765201720170206.
Marengo, J.A. et al., 2018b: Changes in Climate and Land Use Over the Amazon Region: Current and Future Variability and Trends. Frontiers in Earth Science, 6, 228, doi: 10.3389/feart.2018.00228.
Mariotti, A., Y. Pan, N. Zeng, and A. Alessandri, 2015: Long-term climate change in the Mediterranean region in the midst of decadal variability. Climate Dynamics, 44(5–6) , 1437–1456, doi: 10.1007/s00382-015-2487-3.
Martinez, C., L. Goddard, Y. Kushnir, and M. Ting, 2019: Seasonal climatology and dynamical mechanisms of rainfall in the Caribbean. Climate Dynamics, 53(1) , 825–846, doi: 10.1007/s00382-019-04616-4.
Martínez-Asensio, A. et al., 2019: Relative sea-level rise and the influence of vertical land motion at Tropical Pacific Islands. Global and Planetary Change, 176, 132–143, doi: 10.1016/j.gloplacha.2019.03.008.
Martínez-Austria, P.F. and E.R. Bandala, 2017: Temperature and Heat-Related Mortality Trends in the Sonoran and Mojave Desert Region. Atmosphere, 8(12) , 53, doi: 10.3390/atmos8030053.
Martínez-Austria, P.F., E.R. Bandala, and C. Patiño-Gómez, 2016: Temperature and heat wave trends in northwest Mexico. Physics and Chemistry of the Earth, Parts A/B/C, 91, 20–26, doi: 10.1016/j.pce.2015.07.005.
Martínez-Castro, D. et al., 2018: The performance of RegCM4 over the Central America and Caribbean region using different cumulus parameterizations. Climate Dynamics, 50(11–12) , 4103–4126, doi: 10.1007/s00382-017-3863-y.
Marty, C., S. Schlögl, M. Bavay, and M. Lehning, 2017: How much can we save? Impact of different emission scenarios on future snow cover in the Alps. The Cryosphere, 11(1) , 517–529, doi: 10.5194/tc-11-517-2017.
Martynov, A. et al., 2013: Reanalysis-driven climate simulation over CORDEX North America domain using the Canadian Regional Climate Model, version 5: model performance evaluation. Climate Dynamics, 41(11–12) , 2973–3005, doi: 10.1007/s00382-013-1778-9.
Matsumoto, J., F. Fujibe, and H. Takahashi, 2017: Urban climate in the Tokyo metropolitan area in Japan. Journal of Environmental Sciences, 59, 54–62, doi: 10.1016/j.jes.2017.04.012.
Matthes, H., A. Rinke, and K. Dethloff, 2015: Recent changes in Arctic temperature extremes: Warm and cold spells during winter and summer. Environmental Research Letters, 10(11) , 114020, doi: 10.1088/1748-9326/10/11/114020.
Maturilli, M., A. Herber, and G. König-Langlo, 2015: Surface radiation climatology for Ny-Ålesund, Svalbard (78.9°N), basic observations for trend detection. Theoretical and Applied Climatology, 120(1–2) , 331–339, doi: 10.1007/s00704-014-1173-4.
Maúre, G. et al., 2018: The southern African climate under 1.5°C and 2°C of global warming as simulated by CORDEX regional climate models. Environmental Research Letters, 13(6) , 065002, doi: 10.1088/1748-9326/aab190.
Mayer, S. et al., 2015: Identifying added value in high-resolution climate simulations over Scandinavia. Tellus A: Dynamic Meteorology and Oceanography, 67(1) , 24941, doi: 10.3402/tellusa.v67.24941.
Mayowa, O.O. et al., 2015: Trends in rainfall and rainfall-related extremes in the east coast of peninsular Malaysia. Journal of Earth System Science, 124(8) , 1609–1622, doi: 10.1007/s12040-015-0639-9.
Mba, W.P. et al., 2018: Consequences of 1.5°C and 2°C global warming levels for temperature and precipitation changes over Central Africa. Environmental Research Letters, 13(5) , 055011, doi: 10.1088/1748-9326/aab048.
McCrary, R.R. and L.O. Mearns, 2019: Quantifying and Diagnosing Sources of Uncertainty in Midcentury Changes in North American Snowpack from NARCCAP. Journal of Hydrometeorology, 20(11) , 2229–2252, doi: 10.1175/jhm-d-18-0248.1.
Mccrary, R.R., S. Mcginnis, and L.O. Mearns, 2017: Evaluation of snow water equivalent in NARCCAP simulations, including measures of observational uncertainty. Journal of Hydrometeorology, 18(9) , 2425–2452, doi: 10.1175/jhm-d-16-0264.1.
McDermid, S.S. and J. Winter, 2017: Anthropogenic forcings on the climate of the Aral Sea: A regional modeling perspective. Anthropocene, 20, 48–60, doi: 10.1016/j.ancene.2017.03.003.
McGowan, H. et al., 2018: Global warming in the context of 2000 years of Australian alpine temperature and snow cover. Scientific Reports, 8(1) , 4394, doi: 10.1038/s41598-018-22766-z.
McGree, S., S. Schreider, and Y. Kuleshov, 2016: Trends and variability in droughts in the Pacific islands and Northeast Australia. Journal of Climate, 29(23) , 8377–8397, doi: 10.1175/jcli-d-16-0332.1.
McGree, S. et al., 2014: An updated assessment of trends and variability in total and extreme rainfall in the western Pacific. International Journal of Climatology, 34(8) , 2775–2791, doi: 10.1002/joc.3874.
McGree, S. et al., 2019: Recent Changes in Mean and Extreme Temperature and Precipitation in the Western Pacific Islands. Journal of Climate, 32(16) , 4919–4941, doi: 10.1175/jcli-d-18-0748.1.
McKenzie, M.M., T.W. Giambelluca, and H.F. Diaz, 2019: Temperature trends in Hawai‘i: A century of change, 1917–2016. International Journal of Climatology, 39(10) , 3987–4001, doi: 10.1002/joc.6053.
McLean, N.M. et al., 2015: Characterization of Future Caribbean Rainfall and Temperature Extremes across Rainfall Zones. Advances in Meteorology, 2015, 1–18, doi: 10.1155/2015/425987.
McMahon, R., M. Stauffacher, and R. Knutti, 2015: The unseen uncertainties in climate change: reviewing comprehension of an IPCC scenario graph. Climatic Change, 133(2) , 141–154, doi: 10.1007/s10584-015-1473-4.
McSweeney, C.F. and R.G. Jones, 2016: How representative is the spread of climate projections from the 5 CMIP5 GCMs used in ISI-MIP?Climate Services, 1, 24–29, doi: 10.1016/j.cliser.2016.02.001.
Mearns, L. et al., 2017: The NA-CORDEX dataset, version 1.0. NCAR Climate Data Gateway, Boulder, CO, USA. Retrieved from: https://dx.doi.org/10.5065/D6SJ1JCH.
Mearns, L.O. et al., 2009: A Regional Climate Change Assessment Program for North America. Eos, Transactions American Geophysical Union, 90(36) , 311–311, doi: 10.1029/2009eo360002.
MedECC, 2020: Summary for Policymakers. In: Climate and Environmental Change in the Mediterranean Basin – Current Situation and Risks for the Future. First Mediterranean Assessment Report[Cramer, W., J. Guiot, and K. Marini (eds.)]. Union for the Mediterranean, Plan Bleu, UNEP/MAP, Marseille, France, pp. 11–40, www.medecc.org/first-mediterranean-assessment-report-mar1/.
Medley, B. and E.R. Thomas, 2019: Increased snowfall over the Antarctic Ice Sheet mitigated twentieth-century sea-level rise. Nature Climate Change, 9(1) , 34–39, doi: 10.1038/s41558-018-0356-x.
Medley, B. et al., 2013: Airborne-radar and ice-core observations of annual snow accumulation over Thwaites Glacier, West Antarctica confirm the spatiotemporal variability of global and regional atmospheric models. Geophysical Research Letters, 40(14) , 3649–3654, doi: 10.1002/grl.50706.
Medley, B. et al., 2018: Temperature and Snowfall in Western Queen Maud Land Increasing Faster Than Climate Model Projections. Geophysical Research Letters, 45(3) , 1472–1480, doi: 10.1002/2017gl075992.
MEE, 2016: Second National Communication of Maldives to the United Nations Framework Convention on Climate Change. Ministry of Environment and Energy (MEE), Malé, Republic of Maldives, 146 pp., https://unfccc.int/sites/default/files/resource/SNC PDF_Resubmission.pdf .
Meehl, G.A. and A. Hu, 2006: Megadroughts in the Indian Monsoon Region and Southwest North America and a Mechanism for Associated Multidecadal Pacific Sea Surface Temperature Anomalies. Journal of Climate, 19(9) , 1605–1623, doi: 10.1175/jcli3675.1.
Mei, R., M. Ashfaq, D. Rastogi, L.R. Leung, and F. Dominguez, 2015: Dominating controls for wetter South Asian summer monsoon in the twenty-first century. Journal of Climate, 28(8) , 3400–3419, doi: 10.1175/jcli-d-14-00355.1.
Meleshko, V.P. et al., 2019: The Arctic Climate Warming and Extremely Cold Winters in North Eurasia during 1979–2017. Russian Meteorology and Hydrology, 44(4) , 223–230, doi: 10.3103/s1068373919040010.
Mendes, D., J.A. Marengo, S. Rodrigues, and M. Oliveira, 2014: Downscaling Statistical Model Techniques for Climate Change Analysis Applied to the Amazon Region. Advances in Artificial Neural Systems, 2014, 1–10, doi: 10.1155/2014/595462.
Méndez, M. and V. Magaña, 2010: Regional Aspects of Prolonged Meteorological Droughts over Mexico and Central America. Journal of Climate, 23(5) , 1175–1188, doi: 10.1175/2009jcli3080.1.
Méndez-Lázaro, P.A., A. Nieves-Santiango, and J. Miranda-Bermúdez, 2014: Trends in total rainfall, heavy rain events, and number of dry days in San Juan, Puerto Rico, 1955–2009. Ecology and Society, 19(2) , 50, doi: 10.5751/es-06464-190250.
Menéndez, C.G., P.G. Zaninelli, A.F. Carril, and E. Sánchez, 2016: Hydrological cycle, temperature, and land surface–atmosphere interaction in the La Plata Basin during summer: response to climate change. Climate Research, 68(2–3) , 231–241, doi: 10.3354/cr01373.
Menon, S., 2002: Climate Effects of Black Carbon Aerosols in China and India. Science, 297(5590) , 2250–2253, doi: 10.1126/science.1075159.
MENRPG, 2015: Georgia’s Third National Communication to the UNFCCC. Ministry of Environment and Natural Resources Protection of Georgia (MENRPG), Tbilisi, Georgia, 262 pp., https://unfccc.int/resource/docs/natc/geonc3.pdf .
Meque, A. and B.J. Abiodun, 2015: Simulating the link between ENSO and summer drought in Southern Africa using regional climate models. Climate Dynamics, 44(7), 1881–1900, doi: 10.1007/s00382-014-2143-3.
Meredith, M. et al., 2019: Polar Regions. In: IPCC Special Report on the Ocean and Cryosphere in a Changing Climate[Pörtner, H.-O., D.C. Roberts, V. Masson-Delmotte, P. Zhai, M. Tignor, E. Poloczanska, K. Mintenbeck, A. Alegría, M. Nicolai, A. Okem, J. Petzold, B. Rama, and N.M. Weyer (eds.)]. In Press, pp. 203–320, www.ipcc.ch/srocc/chapter/chapter-3-2.
MESDDBM, 2016: Republic of Mauritius Third National Communication: Report to the United Nations Framework Convention on Climate Change. TNC Report 2016, Ministry of Environment, Sustainable Development, and Disaster and Beach Management (MESDDBM), Government of Mauritius, Port Louis, Republic of Mauritius, 210 pp., https://unfccc.int/sites/default/files/resource/NC3_Republic of Mauritius_20Jan17.pdf .
Météo-France, 2020: Bulletin climatologique 2019 de l’île de la Réunion. Météo-France, Direction Interrégionale pour l’Océan Indien, Sainte Clotilde, La Réunion, 29 pp., www.meteofrance.re/documents/3714872/20731758/BCA2019.pdf .
MfE, 2018: Climate Change Projections for New Zealand: Atmosphere Projections Based on Simulations from the IPCC Fifth Assessment, 2nd Edition. Ministry for the Environment (MfE), Wellington, New Zealand, 131 pp., www.mfe.govt.nz/sites/default/files/media/Climate Change/Climate-change-projections-2nd-edition-final.pdf .
MfE and Stats NZ, 2017: New Zealand’s Environmental Reporting Series: Our atmosphere and climate 2017. Ministry for the Environment (MfE) and Stats NZ, 58 pp., https://environment.govt.nz/publications/our-atmosphere-and-climate-2017/.
MfE and Stats NZ, 2020: New Zealand’s Environmental Reporting Series: Our atmosphere and climate 2020. Ministry for the Environment (MfE) & Stats NZ, New Zealand, 79 pp., https://environment.govt.nz/publications/our-atmosphere-and-climate-2020/.
Miao, C. et al., 2014: Assessment of CMIP5 climate models and projected temperature changes over Northern Eurasia. Environmental Research Letters, 9, 12, doi: 10.1088/1748-9326/9/5/055007.
Miao, J. and T. Wang, 2020: Decadal variations of the East Asian winter monsoon in recent decades. Atmospheric Science Letters, 21(4) , e960, doi: 10.1002/asl.960.
Miao, J., T. Wang, and D. Chen, 2020: More robust changes in the East Asian winter monsoon from 1.5 to 2.0°C global warming targets. International Journal of Climatology, 40(11) , 4731–4749, doi: 10.1002/joc.6485.
Min, S.-K. and A. Hense, 2007: A Bayesian Assessment of Climate Change Using Multimodel Ensembles. Part II: Regional and Seasonal Mean Surface Temperatures. Journal of Climate, 20(12) , 2769–2790, doi: 10.1175/jcli4178.1.
Mindlin, J. et al., 2020: Storyline description of Southern Hemisphere midlatitude circulation and precipitation response to greenhouse gas forcing. Climate Dynamics, 54(9) , 4399–4421, doi: 10.1007/s00382-020-05234-1.
Mioduszewski, J.R., A.K. Rennermalm, D.A. Robinson, and T.L. Mote, 2014: Attribution of snowmelt onset in Northern Canada. Journal of Geophysical Research: Atmospheres, 119(16) , 9638–9653, doi: 10.1002/2013jd021024.
Mioduszewski, J.R., A.K. Rennermalm, D.A. Robinson, and L. Wang, 2015: Controls on Spatial and Temporal Variability in Northern Hemisphere Terrestrial Snow Melt Timing, 1979–2012. Journal of Climate, 28(6) , 2136–2153, doi: 10.1175/jcli-d-14-00558.1.
Mirzabaev, A. et al., 2019: Desertification. In: Climate Change and Land: an IPCC special report on climate change, desertification, land degradation, sustainable land management, food security, and greenhouse gas fluxes in terrestrial ecosystems[Shukla, P.R., J. Skea, E.C. Buendia, V. Masson-Delmotte, H.-O. Pörtner, D.C. Roberts, P. Zhai, R. Slade, S. Connors, R. van Diemen, M. Ferrat, E. Haughey, S. Luz, S. Neogi, M. Pathak, J. Petzold, J.P. Pereira, P. Vyas, E. Huntley, K. Kissick, M. Belkacemi, and J. Malley (eds.)]. In Press, pp. 249–343, www.ipcc.ch/srccl/chapter/chapter-3.
Mishra, V., 2015: Climatic uncertainty in Himalayan water towers. Journal of Geophysical Research: Atmospheres, 120(7) , 2689–2705, doi: 10.1002/2014jd022650.
Mishra, V., U. Bhatia, and A.D. Tiwari, 2020: Bias-corrected climate projections for South Asia from Coupled Model Intercomparison Project-6. Scientific Data, 7(1) , 1–13, doi: 10.1038/s41597-020-00681-1.
MNP, 2015: Armenia’s Third National Communication on Climate Change. Ministry of Nature Protection of the Republic of Armenia (MNP). “Lusabats” Publishing House, Yerevan, Armenia, 165 pp., www.nature-ic.am/wp-content/uploads/2013/10/1.Armenias-TNC_2015_ENG.pdf .
Mokhov, I.I., 2015: Contemporary climate changes in the Arctic. Herald of the Russian Academy of Sciences, 85(3) , 265–271, doi: 10.1134/s1019331615030168.
Mokhov, I.I., A. Timazhev, and A.R. Lupo, 2014: Changes in atmospheric blocking characteristics within Euro-Atlantic region and Northern Hemisphere as a whole in the 21st century from model simulations using RCP anthropogenic scenarios. Global and Planetary Change, 122, 265–270, doi: 10.1016/j.gloplacha.2014.09.004.
Montgomery, L., L. Koenig, J.T.M. Lenaerts, and P. Kuipers Munneke, 2020: Accumulation rates (2009–2017) in Southeast Greenland derived from airborne snow radar and comparison with regional climate models. Annals of Glaciology, 61(81) , 225–233, doi: 10.1017/aog.2020.8.
Moon, S. and K.-J. Ha, 2017: Temperature and precipitation in the context of the annual cycle over Asia: Model evaluation and future change. Asia-Pacific Journal of Atmospheric Sciences, 53(2) , 229–242, doi: 10.1007/s13143-017-0024-5.
Mora, C. et al., 2013: The projected timing of climate departure from recent variability. Nature, 502(7470) , 183–187, doi: 10.1038/nature12540.
Moreau, L., P. Groth, J. Cheney, T. Lebo, and S. Miles, 2015: The rationale of PROV. Journal of Web Semantics, 35, 235–257, doi: 10.1016/j.websem.2015.04.001.
Morim, J. et al., 2019: Robustness and uncertainties in global multivariate wind-wave climate projections. Nature Climate Change, 9(9) , 711–718, doi: 10.1038/s41558-019-0542-5.
Mortimer, C. et al., 2020: Evaluation of long-term Northern Hemisphere snow water equivalent products. Cryosphere, 14(5) , 1579–1594, doi: 10.5194/tc-14-1579-2020.
Mote, P.W., S. Li, D.P. Lettenmaier, M. Xiao, and R. Engel, 2018: Dramatic declines in snowpack in the western US. npj Climate and Atmospheric Science, 1(1) , 2, doi: 10.1038/s41612-018-0012-1.
Mote, P.W. et al., 2016: Perspectives on the causes of exceptionally low 2015 snowpack in the western United States. Geophysical Research Letters, 43(20) , 10980-10988, doi: 10.1002/2016gl069965.
Mottram, R., K.P. Nielsen, E. Gleeson, and X. Yang, 2017: Modelling Glaciers in the HARMONIE-AROME NWP model. Advances in Science and Research, 14, 323–334, doi: 10.5194/asr-14-323-2017.
Mottram, R. et al., 2019: An Integrated View of Greenland Ice Sheet Mass Changes Based on Models and Satellite Observations. Remote Sensing, 11(12) , 1407, doi: 10.3390/rs11121407.
Mottram, R. et al., 2021: What is the surface mass balance of Antarctica? An intercomparison of regional climate model estimates. The Cryosphere, 15(8), 3751–3784, doi: 10.5194/tc-15-3751-2021.
Mouginot, J. et al., 2019: Forty-six years of Greenland Ice Sheet mass balance from 1972 to 2018. Proceedings of the National Academy of Sciences, 116(19) , 9239–9244, doi: 10.1073/pnas.1904242116.
Mouhamed, L., S.B. Traore, A. Alhassane, and B. Sarr, 2013: Evolution of some observed climate extremes in the West African Sahel. Weather and Climate Extremes, 1, 19–25, doi: 10.1016/j.wace.2013.07.005.
Mudryk, L.R., C. Derksen, P.J. Kushner, and R. Brown, 2015: Characterization of Northern Hemisphere snow water equivalent datasets, 1981–2010. Journal of Climate, 28(20) , 8037–8051, doi: 10.1175/jcli-d-15-0229.1.
Mudryk, L.R. et al., 2018: Canadian snow and sea ice: Historical trends and projections. Cryosphere, 12(4) , 1157–1176, doi: 10.5194/tc-12-1157-2018.
Mudryk, L.R. et al., 2020: Historical Northern Hemisphere snow cover trends and projected changes in the CMIP6 multi-model ensemble. The Cryosphere, 14(7) , 2495–2514, doi: 10.5194/tc-14-2495-2020.
Murphy, C. et al., 2020: Multi-century trends to wetter winters and drier summers in the England and Wales precipitation series explained by observational and sampling bias in early records. International Journal of Climatology, 40(1) , 610–619, doi: 10.1002/joc.6208.
Musselman, K.N. et al., 2018: Projected increases and shifts in rain-on-snow flood risk over western North America. Nature Climate Change, 8(9) , 808–812, doi: 10.1038/s41558-018-0236-4.
Mycoo, M.A., 2018: Achieving SDG 6: water resources sustainability in Caribbean Small Island Developing States through improved water governance. Natural Resources Forum, 42(1) , 54–68, doi: 10.1111/1477-8947.12141.
Nabat, P., F. Solmon, M. Mallet, J.F. Kok, and S. Somot, 2012: Dust emission size distribution impact on aerosol budget and radiative forcing over the Mediterranean region: a regional climate model approach. Atmospheric Chemistry and Physics, 12(21) , 10545–10567, doi: 10.5194/acp-12-10545-2012.
Nabat, P., S. Somot, M. Mallet, A. Sanchez-Lorenzo, and M. Wild, 2014: Contribution of anthropogenic sulfate aerosols to the changing Euro-Mediterranean climate since 1980. Geophysical Research Letters, 41(15) , 5605–5611, doi: 10.1002/2014gl060798.
Nabat, P. et al., 2013: A 4-D climatology (1979–2009) of the monthly tropospheric aerosol optical depth distribution over the Mediterranean region from a comparative evaluation and blending of remote sensing and model products. Atmospheric Measurement Techniques, 6(5) , 1287–1314, doi: 10.5194/amt-6-1287-2013.
Nabat, P. et al., 2015: Dust aerosol radiative effects during summer 2012 simulated with a coupled regional aerosol–atmosphere–ocean model over the Mediterranean. Atmospheric Chemistry and Physics, 15(6) , 3303–3326, doi: 10.5194/acp-15-3303-2015.
Nabat, P. et al., 2020: Modulation of radiative aerosols effects by atmospheric circulation over the Euro-Mediterranean region. Atmospheric Chemistry and Physics, 20(14) , 8315–8349, doi: 10.5194/acp-20-8315-2020.
Nakaegawa, T., A. Kitoh, S. Kusunoki, H. Murakami, and O. Arakawa, 2014: Hydroclimate changes over Central America and the Caribbean in a global warming climate projected with 20-km and 60-km mesh MRI atmospheric general circulation models. Papers in Meteorology and Geophysics, 65, 15–33, doi: 10.2467/mripapers.65.15.
Naranjo-Diaz, L.R. and A. Centella, 1998: Recent trends in the climate of Cuba. Weather, 53(3) , 78–85, doi: 10.1002/j.1477-8696.1998.tb03964.x.
Narsey, S.Y. et al., 2020: Climate Change Projections for the Australian Monsoon From CMIP6 Models. Geophysical Research Letters, 47(13) , e2019GL086816, doi: 10.1029/2019gl086816.
Nengker, T., A. Choudhary, and A.P. Dimri, 2018: Assessment of the performance of CORDEX-SA experiments in simulating seasonal mean temperature over the Himalayan region for the present climate: Part I. Climate Dynamics, 50(7–8) , 2411–2441, doi: 10.1007/s00382-017-3597-x.
Nesbitt, S.W., D.J. Gochis, and T.J. Lang, 2008: The Diurnal Cycle of Clouds and Precipitation along the Sierra Madre Occidental Observed during NAME-2004: Implications for Warm Season Precipitation Estimation in Complex Terrain. Journal of Hydrometeorology, 9(4) , 728–743, doi: 10.1175/2008jhm939.1.
Neukom, R. et al., 2010: Multi-centennial summer and winter precipitation variability in southern South America. Geophysical Research Letters, 37(14) , L14708, doi: 10.1029/2010gl043680.
New, M. et al., 2006: Evidence of trends in daily climate extremes over southern and west Africa. Journal of Geophysical Research: Atmospheres, 111(D14) , D14102, doi: 10.1029/2005jd006289.
Ngo-Duc, T., C. Kieu, M. Thatcher, D. Nguyen-Le, and T. Phan-Van, 2014: Climate projections for Vietnam based on regional climate models. Climate Research, 60(3) , 199–213, doi: 10.3354/cr01234.
Ngo-Duc, T. et al., 2017: Performance evaluation of RegCM4 in simulating extreme rainfall and temperature indices over the CORDEX-Southeast Asia region. International Journal of Climatology, 37(3) , 1634–1647, doi: 10.1002/joc.4803.
Nguyen-Thi, T. et al., 2021: Climate analogue and future appearance of novel climate in Southeast Asia. International Journal of Climatology, 41(S1) , E392–E409, doi: 10.1002/joc.6693.
Nguyen-Thuy, H. et al., 2021: Time of emergence of climate signals over Vietnam detected from the CORDEX-SEA experiments. International Journal of Climatology, 41(3) , 1599–1618, doi: 10.1002/joc.6897.
Nguyen-Xuan, T. et al., 2016: The Vietnam Gridded Precipitation (VnGP) Dataset: Construction and Validation. SOLA, 12, 291–296, doi: 10.2151/sola.2016-057.
Niang, I. et al., 2014: Africa. In: Climate Change 2014: Impacts, Adaptation, and Vulnerability. Part B: Regional Aspects. Contribution of Working Group II to the Fifth Assessment Report of the Intergovernmental Panel on Climate Change[Barros, V.R., C.B. Field, D.J. Dokken, M.D. Mastrandrea, K.J. Mach, T.E. Bilir, M. Chatterjee, K.L. Ebi, Y.O. Estrada, R.C. Genova, B. Girma, E.S. Kissel, A.N. Levy, S. MacCracken, P.R. Mastrandrea, and L.L. White (eds.)]. Cambridge University Press, Cambridge, United Kingdom and New York, NY, USA, pp. 1199–1265, doi: 10.1017/cbo9781107415386.002.
Nicolas, J.P. et al., 2017: January 2016 extensive summer melt in West Antarctica favoured by strong El Niño. Nature Communications, 8(1) , 15799, doi: 10.1038/ncomms15799.
Nikulin, G. et al., 2018: The effects of 1.5 and 2 degrees of global warming on Africa in the CORDEX ensemble. Environmental Research Letters, 13(6) , 065003, doi: 10.1088/1748-9326/aab1b1.
Ning, L. and R.S. Bradley, 2015: Snow occurrence changes over the central and eastern United States under future warming scenarios. Scientific Reports, 5, 1–8, doi: 10.1038/srep17073.
Nkrumah, F. et al., 2019: Recent Trends in the Daily Rainfall Regime in Southern West Africa. Atmosphere, 10(12) , 741, doi: 10.3390/atmos10120741.
Nobre, C.A. et al., 2016: Land-use and climate change risks in the Amazon and the need of a novel sustainable development paradigm. Proceedings of the National Academy of Sciences, 113(39) , 10759–10768, doi: 10.1073/pnas.1605516113.
Noël, B. et al., 2015: Evaluation of the updated regional climate model RACMO2.3: Summer snowfall impact on the Greenland Ice Sheet. Cryosphere, 9(5) , 1831–1844, doi: 10.5194/tc-9-1831-2015.
Nordli, Ø. et al., 2020: Revisiting the extended Svalbard Airport monthly temperature series, and the compiled corresponding daily series 1898–2018. Polar Research, 39, doi: 10.33265/polar.v39.3614.
Notaro, M., V. Bennington, and S. Vavrus, 2015: Dynamically Downscaled Projections of Lake-Effect Snow in the Great Lakes Basin. Journal of Climate, 28(4) , 1661–1684, doi: 10.1175/jcli-d-14-00467.1.
Nowicki, S. et al., 2020: Experimental protocol for sea level projections from ISMIP6 stand-alone ice sheet models. The Cryosphere, 14(7) , 2331–2368, doi: 10.5194/tc-14-2331-2020.
Nurse, L.A. et al., 2014: Small Islands. In: Climate Change 2014: Impacts, Adaptation, and Vulnerability. Part B: Regional Aspects. Contribution of working Group II to the Fifth Assessment Report of the Intergovernmental Panel on Climate Change[Barros, V.R., C.B. Field, D.J. Dokken, M.D. Mastrandrea, K.J. Mach, T.E. Bilir, M. Chatterjee, K.L. Ebi, Y.O. Estrada, R.C. Genova, B. Girma, E.S. Kissel, A.N. Levy, S. MacCracken, P.R. Mastrandrea, and L.L. White (eds.)]. Cambridge University Press, Cambridge, United Kingdom and New York, NY, USA, pp. 1613–1654, doi: 10.1017/cbo9781107415386.009.
Nygård, T., T. Naakka, and T. Vihma, 2020: Horizontal Moisture Transport Dominates the Regional Moistening Patterns in the Arctic. Journal of Climate, 33(16) , 6793–6807, doi: 10.1175/jcli-d-19-0891.1.
O’Neill, B.C. et al., 2016: The Scenario Model Intercomparison Project (ScenarioMIP) for CMIP6. Geoscientific Model Development, 9(9) , 3461–3482, doi: 10.5194/gmd-9-3461-2016.
Odry, J. et al., 2020: Using artificial neural networks to estimate snow water equivalent from snow depth. Canadian Water Resources Journal, 45(3) , 252–268, doi: 10.1080/07011784.2020.1796817.
Oh, S.G. and M.S. Suh, 2018: Changes in seasonal and diurnal precipitation types during summer over South Korea in the late twenty-first century (2081–2100) projected by the RegCM4.0 based on four RCP scenarios. Climate Dynamics, 51(7–8) , 3041–3060, doi: 10.1007/s00382-017-4063-5.
Olson, R., J.P. Evans, A. Di Luca, and D. Argüeso, 2016: The NARCliM project: model agreement and significance of climate projections. Climate Research, 69(3) , 209–227, doi: 10.3354/cr01403.
Ongoma, V., H. Chen, and C. Gao, 2018: Projected changes in mean rainfall and temperature over East Africa based on CMIP5 models. International Journal of Climatology, 38(3) , 1375–1392, doi: 10.1002/joc.5252.
Onyutha, C., H. Tabari, A. Rutkowska, P. Nyeko-Ogiramoi, and P. Willems, 2016: Comparison of different statistical downscaling methods for climate change rainfall projections over the Lake Victoria basin considering CMIP3 and CMIP5. Journal of Hydro-environment Research, 12, 31–45, doi: 10.1016/j.jher.2016.03.001.
Orsolini, Y. et al., 2019: Evaluation of snow depth and snow cover over the Tibetan Plateau in global reanalyses using in situ and satellite remote sensing observations. Cryosphere, 13(8) , 2221–2239, doi: 10.5194/tc-13-2221-2019.
Osakada, Y. and E. Nakakita, 2018: Future Change of Occurrence Frequency of Baiu Heavy Rainfall and Its Linked Atmospheric Patterns by Multiscale Analysis. SOLA, 14, 79–85, doi: 10.2151/sola.2018-014.
Osborn, T.J., C.J. Wallace, I.C. Harris, and T.M. Melvin, 2016: Pattern scaling using ClimGen: monthly-resolution future climate scenarios including changes in the variability of precipitation. Climatic Change, 134(3) , 353–369, doi: 10.1007/s10584-015-1509-9.
Osborn, T.J. et al., 2021: Land Surface Air Temperature Variations Across the Globe Updated to 2019: The CRUTEM5 Data Set. Journal of Geophysical Research: Atmospheres, 126(2) , e2019JD032352, doi: 10.1029/2019jd032352.
Ose, T., 2017: Future precipitation changes during summer in East Asia and model dependence in high-resolution MRI-AGCM experiments. Hydrological Research Letters, 11(3) , 168–174, doi: 10.3178/hrl.11.168.
Osima, S. et al., 2018: Projected climate over the Greater Horn of Africa under 1.5°C and 2°C global warming. Environmental Research Letters, 13(6) , 065004, doi: 10.1088/1748-9326/aaba1b.
Otto, F.E.L. et al., 2015: Factors Other Than Climate Change, Main Drivers of 2014/15 Water Shortage in Southeast Brazil. Bulletin of the American Meteorological Society, 96(12) , S35–S40, doi: 10.1175/bams-d-15-00120.1.
Outten, S.D. and I. Esau, 2012: A link between Arctic sea ice and recent cooling trends over Eurasia. Climatic Change, 110(3–4) , 1069–1075, doi: 10.1007/s10584-011-0334-z.
Overland, J.E., M. Wang, J.E. Walsh, and J.C. Stroeve, 2014: Future Arctic climate changes: Adaptation and mitigation time scales. Earth’s Future, 2(2) , 68–74, doi: 10.1002/2013ef000162.
Overland, J.E. et al., 2016: Nonlinear response of mid-latitude weather to the changing Arctic. Nature Climate Change, 6(11) , 992–999, doi: 10.1038/nclimate3121.
Overland, J.E. et al., 2019: The urgency of Arctic change. Polar Science, 21, 6–13, doi: 10.1016/j.polar.2018.11.008.
Overly, T.B., R.L. Hawley, V. Helm, E.M. Morris, and R.N. Chaudhary, 2016: Greenland annual accumulation along the EGIG line, 1959–2004, from ASIRAS airborne radar and neutron-probe density measurements. The Cryosphere, 10(4) , 1679–1694, doi: 10.5194/tc-10-1679-2016.
Ozturk, T., M.T. Turp, M. Türkeş, and M.L. Kurnaz, 2017: Projected changes in temperature and precipitation climatology of Central Asia CORDEX Region 8 by using RegCM4.3.5. Atmospheric Research, 183, 296–307, doi: 10.1016/j.atmosres.2016.09.008.
Ozturk, T., M.T. Turp, M. Türkeş, and M.L. Kurnaz, 2018: Future projections of temperature and precipitation climatology for CORDEX-MENA domain using RegCM4.4. Atmospheric Research, 206, 87–107, doi: 10.1016/j.atmosres.2018.02.009.
Pabón-Caicedo, J.D. et al., 2020: Observed and Projected Hydroclimate Changes in the Andes. Frontiers in Earth Science, 8, 61, doi: 10.3389/feart.2020.00061.
Pal, S., H.-I. Chang, C.L. Castro, and F. Dominguez, 2019: Credibility of Convection-Permitting Modeling to Improve Seasonal Precipitation Forecasting in the Southwestern United States. Frontiers in Earth Science, 7, 11, doi: 10.3389/feart.2019.00011.
Palerme, C. et al., 2014: How much snow falls on the Antarctic ice sheet?The Cryosphere, 8(4) , 1577–1587, doi: 10.5194/tc-8-1577-2014.
Palerme, C. et al., 2017: Evaluation of current and projected Antarctic precipitation in CMIP5 models. Climate Dynamics, 48(1–2) , 225–239, doi: 10.1007/s00382-016-3071-1.
Palomino-Lemus, R., S. Córdoba-Machado, S.R. Gámiz-Fortis, Y. Castro-Díez, and M.J. Esteban-Parra, 2015: Summer precipitation projections over northwestern South America from CMIP5 models. Global and Planetary Change, 131, 11–23, doi: 10.1016/j.gloplacha.2015.05.004.
Palomino-Lemus, R., S. Córdoba-Machado, S.R. Gámiz-Fortis, Y. Castro-Díez, and M.J. Esteban-Parra, 2017: Climate change projections of boreal summer precipitation over tropical America by using statistical downscaling from CMIP5 models. Environmental Research Letters, 12(12) , 124011, doi: 10.1088/1748-9326/aa9bf7.
Palomino-Lemus, R., S. Córdoba-Machado, S.R. Gámiz-Fortis, Y. Castro-Díez, and M.J. Esteban-Parra, 2018: High-resolution boreal winter precipitation projections over tropical America from CMIP5 models. Climate Dynamics, 51(5–6) , 1773–1792, doi: 10.1007/s00382-017-3982-5.
Panitz, H.J., A. Dosio, M. Büchner, D. Lüthi, and K. Keuler, 2014: COSMO-CLM (CCLM) climate simulations over CORDEX-Africa domain: Analysis of the ERA-Interim driven simulations at 0.44° and 0.22° resolution. Climate Dynamics, doi: 10.1007/s00382-013-1834-5.
Panthou, G., A. Mailhot, E. Laurence, and G. Talbot, 2014: Relationship between Surface Temperature and Extreme Rainfalls: A Multi-Time-Scale and Event-Based Analysis. Journal of Hydrometeorology, 15(5) , 1999–2011, doi: 10.1175/jhm-d-14-0020.1.
Panthou, G., M. Vrac, P. Drobinski, S. Bastin, and L. Li, 2018a: Impact of model resolution and Mediterranean sea coupling on hydrometeorological extremes in RCMs in the frame of HyMeX and MED-CORDEX. Climate Dynamics, 51(3) , 915–932, doi: 10.1007/s00382-016-3374-2.
Panthou, G. et al., 2018b: Rainfall intensification in tropical semi-arid regions: the Sahelian case. Environmental Research Letters, 13(6) , 064013, doi: 10.1088/1748-9326/aac334.
Park, B.-J. et al., 2017: Long-Term Warming Trends in Korea and Contribution of Urbanization: An Updated Assessment. Journal of Geophysical Research: Atmospheres, 122(20) , 10637–10654, doi: 10.1002/2017jd027167.
Park, C. et al., 2016: Evaluation of multiple regional climate models for summer climate extremes over East Asia. Climate Dynamics, 46(7) , 2469–2486, doi: 10.1007/s00382-015-2713-z.
Park, C. et al., 2020: Evaluation of summer precipitation over Far East Asia and South Korea simulated by multiple regional climate models. International Journal of Climatology, 40(4) , 2270–2284, doi: 10.1002/joc.6331.
Partasenok, I.S., B. Geyer, and V.I. Melnik, 2015: Studies of possible scenarios of changes in the climate of Belarus based on ensemble concept. Proceedings of Hydrometcentre of Russia, 358, 99–111, http://method.meteorf.ru/publ/tr/tr358/tr358.pdf .
Pavlidis, V. et al., 2020: Investigating the sensitivity to resolving aerosol interactions in downscaling regional model experiments with WRFv3.8.1 over Europe. Geoscientific Model Development, 13(6) , 2511–2532, doi: 10.5194/gmd-13-2511-2020.
Peel, M.C., B.L. Finlayson, and T.A. McMahon, 2007: Updated world map of the Köppen-Geiger climate classification. Hydrology and Earth System Sciences, 11(5) , 1633–1644, doi: 10.5194/hess-11-1633-2007.
Peeters, B. et al., 2019: Spatiotemporal patterns of rain-on-snow and basal ice in high Arctic Svalbard: detection of a climate–cryosphere regime shift. Environmental Research Letters, 14(1) , 15002, doi: 10.1088/1748-9326/aaefb3.
Peña-Angulo, D. et al., 2020: Long-term precipitation in Southwestern Europe reveals no clear trend attributable to anthropogenic forcing. Environmental Research Letters, 15(9) , 094070, doi: 10.1088/1748-9326/ab9c4f .
Peng, D. and T. Zhou, 2017: Why was the arid and semiarid northwest China getting wetter in the recent decades?Journal of Geophysical Research: Atmospheres, 122(17) , 9060–9075, doi: 10.1002/2016jd026424.
Peng, X. et al., 2019: Evaluation and quantification of surface air temperature over Eurasia based on CMIP5 models. Climate Research, 77(2) , 167–180, doi: 10.3354/cr01549.
Perdigón-Morales, J., R. Romero-Centeno, P.O. Pérez, and B.S. Barrett, 2018: The midsummer drought in Mexico: perspectives on duration and intensity from the CHIRPS precipitation database. International Journal of Climatology, 38(5) , 2174–2186, doi: 10.1002/joc.5322.
Perevedentsev, Y.P., A.A. Vasil’ev, K.M. Shantalinskii, and V. Gur’yanov, 2017: Long-term variations in surface air pressure and surface air temperature in the Northern Hemisphere mid-latitudes. Russian Meteorology and Hydrology, 42(7) , 461–470, doi: 10.3103/s1068373917070056.
Perry, S.J., S. McGregor, A. Sen Gupta, M.H. England, and N. Maher, 2020: Projected late 21st century changes to the regional impacts of the El Niño-Southern Oscillation. Climate Dynamics, 54(1–2) , 395–412, doi: 10.1007/s00382-019-05006-6.
Pham, T., J. Brauch, B. Früh, and B. Ahrens, 2017: Simulation of snowbands in the Baltic Sea area with the coupled atmosphere–ocean–ice model COSMO-CLM/NEMO. Meteorologische Zeitschrift, 26(1) , 71–82, doi: 10.1127/metz/2016/0775.
Philandras, C.M., P.T. Nastos, I.N. Kapsomenakis, and C.C. Repapis, 2015: Climatology of upper air temperature in the Eastern Mediterranean region. Atmospheric Research, 152, 29–42, doi: 10.1016/j.atmosres.2013.12.002.
Pichelli, E. et al., 2021: The first multi-model ensemble of regional climate simulations at kilometer-scale resolution part 2: historical and future simulations of precipitation. Climate Dynamics, 56(11–12) , 3581–3602, doi: 10.1007/s00382-021-05657-4.
Pinto, I., C. Jack, and B. Hewitson, 2018: Process-based model evaluation and projections over southern Africa from Coordinated Regional Climate Downscaling Experiment and Coupled Model Intercomparison Project Phase 5 models. International Journal of Climatology, 38(11) , 4251–4261, doi: 10.1002/joc.5666.
Pinto, I. et al., 2016: Evaluation and projections of extreme precipitation over southern Africa from two CORDEX models. Climatic Change, 135(3–4) , 655–668, doi: 10.1007/s10584-015-1573-1.
Pithan, F. and T. Mauritsen, 2014: Arctic amplification dominated by temperature feedbacks in contemporary climate models. Nature Geoscience, 7(3) , 181–184, doi: 10.1038/ngeo2071.
Planos Gutiérrez, E.O., R. Rivero Vega, and V. Guevara Velazco (eds.), 2012: Impacto del Cambio Climático y Medidas de Adaptación en Cuba. Agencia de Medio Ambiente, Ministerio de Ciencia Tecnología y Medio Ambiente, La Habana, Cuba, 520 pp., www.redciencia.cu/geobiblio/paper/2012_Planos_Impacto%20y%20Adaptacion,%20Libro.pdf .
Poan, E.D. et al., 2018: Investigating added value of regional climate modeling in North American winter storm track simulations. Climate Dynamics, 50(5) , 1799–1818, doi: 10.1007/s00382-017-3723-9.
Poli, P. et al., 2016: ERA-20C: An Atmospheric Reanalysis of the Twentieth Century. Journal of Climate, 29(11) , 4083–4097, doi: 10.1175/jcli-d-15-0556.1.
Post, E. et al., 2019: The polar regions in a 2°C warmer world. Science Advances, 5(12) , eaaw9883, doi: 10.1126/sciadv.aaw9883.
Post, V.E.A., A.L. Bosserelle, S.C. Galvis, P.J. Sinclair, and A.D. Werner, 2018: On the resilience of small-island freshwater lenses: Evidence of the long-term impacts of groundwater abstraction on Bonriki Island, Kiribati. Journal of Hydrology, 564, 133–148, doi: 10.1016/j.jhydrol.2018.06.015.
Prakash, S., 2019: Performance assessment of CHIRPS, MSWEP, SM2RAIN-CCI, and TMPA precipitation products across India. Journal of Hydrology, 571, 50–59, doi: 10.1016/j.jhydrol.2019.01.036.
Prakash, S. et al., 2014: Comparison of TMPA-3B42 Versions 6 and 7 Precipitation Products with Gauge-Based Data over India for the Southwest Monsoon Period. Journal of Hydrometeorology, 16(1) , 346–362, doi: 10.1175/jhm-d-14-0024.1.
Prein, A.F. and A. Gobiet, 2017: Impacts of uncertainties in European gridded precipitation observations on regional climate analysis. International Journal of Climatology, 37(1) , 305–327, doi: 10.1002/joc.4706.
Prein, A.F., R. Rasmussen, and G. Stephens, 2017a: Challenges and Advances in Convection-Permitting Climate Modeling. Bulletin of the American Meteorological Society, 98(5) , 1027–1030, doi: 10.1175/bams-d-16-0263.1.
Prein, A.F., M.S. Bukovsky, L.O. Mearns, C.L. Bruyère, and J.M. Done, 2019: Simulating North American Weather Types With Regional Climate Models. Frontiers in Environmental Science, 7, 36, doi: 10.3389/fenvs.2019.00036.
Prein, A.F. et al., 2015: A review on regional convection-permitting climate modeling: Demonstrations, prospects, and challenges. Reviews of Geophysics, 53(2) , 323–361, doi: 10.1002/2014rg000475.
Prein, A.F. et al., 2016: Precipitation in the EURO-CORDEX 0.11° and 0.44° simulations: high resolution, high benefits?Climate Dynamics, 46(1–2) , 383–412, doi: 10.1007/s00382-015-2589-y.
Prein, A.F. et al., 2017b: Increased rainfall volume from future convective storms in the US. Nature Climate Change, 7(12) , 880–884, doi: 10.1038/s41558-017-0007-7.
Previdi, M. and L.M. Polvani, 2016: Anthropogenic impact on Antarctic surface mass balance, currently masked by natural variability, to emerge by mid-century. Environmental Research Letters, 11(9) , 094001, doi: 10.1088/1748-9326/11/9/094001.
Przybylak, R. and P. Wyszyński, 2020: Air temperature changes in the Arctic in the period 1951–2015 in the light of observational and reanalysis data. Theoretical and Applied Climatology, 139(1–2) , 75–94, doi: 10.1007/s00704-019-02952-3.
Pulliainen, J. et al., 2020: Patterns and trends of Northern Hemisphere snow mass from 1980 to 2018. Nature, 581(7808) , 294–298, doi: 10.1038/s41586-020-2258-0.
Rae, J.G.L. et al., 2012: Greenland ice sheet surface mass balance: evaluating simulations and making projections with regional climate models. The Cryosphere, 6(6) , 1275–1294, doi: 10.5194/tc-6-1275-2012.
Raghavan, S., M.T. Vu, and S.Y. Liong, 2016: Regional climate simulations over Vietnam using the WRF model. Theoretical and Applied Climatology, 126(1–2) , 161–182, doi: 10.1007/s00704-015-1557-0.
Raghavan, S., J. Liu, N.S. Nguyen, M.T. Vu, and S.-Y. Liong, 2018: Assessment of CMIP5 historical simulations of rainfall over Southeast Asia. Theoretical and Applied Climatology, 132(3–4) , 989–1002, doi: 10.1007/s00704-017-2111-z.
Rahimi, M. and S.S. Fatemi, 2019: Mean versus Extreme Precipitation Trends in Iran over the Period 1960–2017. Pure and Applied Geophysics, 176(8) , 3717–3735, doi: 10.1007/s00024-019-02165-9.
Rahmawati, N. and M.W. Lubczynski, 2018: Validation of satellite daily rainfall estimates in complex terrain of Bali Island, Indonesia. Theoretical and Applied Climatology, 134(1–2) , 513–532, doi: 10.1007/s00704-017-2290-7.
Ramanathan, V. and G. Carmichael, 2008: Global and regional climate changes due to black carbon. Nature Geoscience, 1(4) , 221–227, doi: 10.1038/ngeo156.
Ramanathan, V. et al., 2007: Atmospheric brown clouds: Hemispherical and regional variations in long-range transport, absorption, and radiative forcing. Journal of Geophysical Research: Atmospheres, 112(D22) , D22S21, doi: 10.1029/2006jd008124.
Ramarao, M.V.S. et al., 2019: On observed aridity changes over the semiarid regions of India in a warming climate. Theoretical and Applied Climatology, 136(1–2) , 693–702, doi: 10.1007/s00704-018-2513-6.
Rana, A. et al., 2020: Contrasting regional and global climate simulations over South Asia. Climate Dynamics, 54(5–6) , 2883–2901, doi: 10.1007/s00382-020-05146-0.
Rao, V.B., S.H. Franchito, C.M.E. Santo, and M.A. Gan, 2016: An update on the rainfall characteristics of Brazil: seasonal variations and trends in 1979–2011. International Journal of Climatology, 36(1) , 291–302, doi: 10.1002/joc.4345.
Rapaić, M., R. Brown, M. Markovic, and D. Chaumont, 2015: An Evaluation of Temperature and Precipitation Surface-Based and Reanalysis Datasets for the Canadian Arctic, 1950–2010. Atmosphere-Ocean, 53(3) , 283–303, doi: 10.1080/07055900.2015.1045825.
Rasmussen, R. et al., 2014: Climate Change Impacts on the Water Balance of the Colorado Headwaters: High-Resolution Regional Climate Model Simulations. Journal of Hydrometeorology, 15(3) , 1091–1116, doi: 10.1175/jhm-d-13-0118.1.
Ratna, S.B., J.V. Ratnam, S.K. Behera, F.T. Tangang, and T. Yamagata, 2017: Validation of the WRF regional climate model over the subregions of Southeast Asia: climatology and interannual variability. Climate Research, 71(3) , 263–280, doi: 10.3354/cr01445.
Rauniyar, S.P. and S.B. Power, 2020: The Impact of Anthropogenic Forcing and Natural Processes on Past, Present, and Future Rainfall over Victoria, Australia. Journal of Climate, 33(18) , 8087–8106, doi: 10.1175/jcli-d-19-0759.1.
Rauscher, S.A., F. Giorgi, N.S. Diffenbaugh, and A. Seth, 2008: Extension and Intensification of the Meso-American mid-summer drought in the twenty-first century. Climate Dynamics, 31(5) , 551–571, doi: 10.1007/s00382-007-0359-1.
Rauthe, M., H. Steiner, U. Riediger, A. Mazurkiewicz, and A. Gratzki, 2013: A Central European precipitation climatology – Part I: Generation and validation of a high-resolution gridded daily data set (HYRAS). Meteorologische Zeitschrift, 22(3) , 235–256, doi: 10.1127/0941-2948/2013/0436.
Reboita, M.S., R.P. da Rocha, C.G. Dias, and R.Y. Ynoue, 2014: Climate Projections for South America: RegCM3 Driven by HadCM3 and ECHAM5. Advances in Meteorology, 2014, 376738, doi: 10.1155/2014/376738.
Reboita, M.S. et al., 2021: Future changes in the wintertime cyclonic activity over the CORDEX-CORE southern hemisphere domains in a multi-model approach. Climate Dynamics, 57(5–6) , 1533–1549, doi: 10.1007/s00382-020-05317-z.
Reisinger, A. et al., 2014: Australasia. In: Climate Change 2014: Impacts, Adaptation, and Vulnerability. Part B: Regional Aspects. Contribution of Working Group II to the Fifth Assessment Report of the Intergovernmental Panel on Climate Change[Barros, V.R., C.B. Field, D.J. Dokken, M.D. Mastrandrea, K.J. Mach, T.E. Bilir, M. Chatterjee, K.L. Ebi, Y.O. Estrada, R.C. Genova, B. Girma, E.S. Kissel, A.N. Levy, S. MacCracken, P.R. Mastrandrea, and L.L. White (eds.)]. Cambridge University Press, Cambridge, United Kingdom and New York, NY, USA, pp. 1371–1438, doi: 10.1017/cbo9781107415386.005.
Ren, Y., B. Zhou, L. Song, and Y. Xiao, 2017: Interannual variability of western North Pacific subtropical high, East Asian jet and East Asian summer precipitation: CMIP5 simulation and projection. Quaternary International, 440, 64–70, doi: 10.1016/j.quaint.2016.08.033.
Retamales-Muñoz, G., C. Durán-Alarcón, and C. Mattar, 2019: Recent land surface temperature patterns in Antarctica using satellite and reanalysis data. Journal of South American Earth Sciences, 95, 102304, doi: 10.1016/j.jsames.2019.102304.
Retchless, D.P. and C.A. Brewer, 2016: Guidance for representing uncertainty on global temperature change maps. International Journal of Climatology, 36(3) , 1143–1159, doi: 10.1002/joc.4408.
Reyer, C.P.O. et al., 2017: Climate change impacts in Central Asia and their implications for development. Regional Environmental Change, 17(6) , 1639–1650, doi: 10.1007/s10113-015-0893-z.
Rhoades, A.M., A.D. Jones, and P.A. Ullrich, 2018: Assessing Mountains as Natural Reservoirs With a Multimetric Framework. Earth’s Future, 6(9) , 1221–1241, doi: 10.1002/2017ef000789.
Rignot, E. et al., 2019: Four decades of Antarctic Ice Sheet mass balance from 1979–2017. Proceedings of the National Academy of Sciences, 116(4) , 1095–1103, doi: 10.1073/pnas.1812883116.
Ringard, J. et al., 2016: The intensification of thermal extremes in west Africa. Global and Planetary Change, 139, 66–77, doi: 10.1016/j.gloplacha.2015.12.009.
Rinke, A. et al., 2019: Trends of vertically integrated water vapor over the Arctic during 1979–2016: Consistent moistening all over?Journal of Climate, 32(18) , 6097–6116, doi: 10.1175/jcli-d-19-0092.1.
Rivera, J.A. and G. Arnould, 2020: Evaluation of the ability of CMIP6 models to simulate precipitation over Southwestern South America: Climatic features and long-term trends (1901–2014). Atmospheric Research, 241, 104953, doi: 10.1016/j.atmosres.2020.104953.
Rizzi, J., I.B. Nilsen, J.H. Stagge, K. Gisnås, and L.M. Tallaksen, 2018: Five decades of warming: Impacts on snow cover in Norway. Hydrology Research, 49(3) , 670–688, doi: 10.2166/nh.2017.051.
RMetS, 2019: Warming Stripes show the changing climate across the globe. Royal Meteorological Society (RMetS), Reading, UK. Retrieved from: w ww.rmets.org/news/warming-stripes-show-changing-climate-across-globe.
Roach, L.A. et al., 2020: Antarctic Sea Ice Area in CMIP6. Geophysical Research Letters, 47(9) , 1–10, doi: 10.1029/2019gl086729.
Robel, A.A. and A.F. Banwell, 2019: A Speed Limit on Ice Shelf Collapse Through Hydrofracture. Geophysical Research Letters, 46(21) , 12092–12100, doi: 10.1029/2019gl084397.
Roberts, M.J. et al., 2018: The Benefits of Global High Resolution for Climate Simulation: Process Understanding and the Enabling of Stakeholder Decisions at the Regional Scale. Bulletin of the American Meteorological Society, 99(11) , 2341–2359, doi: 10.1175/bams-d-15-00320.1.
Roehrig, R., D. Bouniol, F. Guichard, F. Hourdin, and J.-L. Redelsperger, 2013: The Present and Future of the West African Monsoon: A Process-Oriented Assessment of CMIP5 Simulations along the AMMA Transect. Journal of Climate, 26(17) , 6471–6505, doi: 10.1175/jcli-d-12-00505.1.
Rohde, R.A. and Z. Hausfather, 2020: The Berkeley Earth Land/Ocean Temperature Record. Earth System Science Data, 12(4) , 3469–3479, doi: 10.5194/essd-12-3469-2020.
Rosenzweig, C. et al., 2017: Assessing inter-sectoral climate change risks: the role of ISIMIP. Environmental Research Letters, 12(1) , 010301, doi: 10.1088/1748-9326/12/1/010301.
Roshydromet, 2019: A Report on Climate Features on the Territory of the Russian Federation in 2018[in Russian]. Russian Federal Service for Hydrometeorology and Environmental Monitoring (Roshydromet), Moscow, Russia, 79 pp., www.meteorf.ru/upload/pdf_download/o-klimate-rf-2018.pdf .
Roussel, M.-L., F. Lemonnier, C. Genthon, and G. Krinner, 2020: Brief communication: Evaluating Antarctic precipitation in ERA5 and CMIP6 against CloudSat observations. The Cryosphere, 14(8) , 2715–2727, doi: 10.5194/tc-14-2715-2020.
Rowell, D.P., 2013: Simulating SST Teleconnections to Africa: What is the State of the Art?Journal of Climate, 26(15) , 5397–5418, doi: 10.1175/jcli-d-12-00761.1.
Rowell, D.P., B.B.B. Booth, S.E. Nicholson, and P. Good, 2015: Reconciling Past and Future Rainfall Trends over East Africa. Journal of Climate, 28(24) , 9768–9788, doi: 10.1175/jcli-d-15-0140.1.
Rowell, D.P., C.A. Senior, M. Vellinga, and R.J. Graham, 2016: Can climate projection uncertainty be constrained over Africa using metrics of contemporary performance?Climatic Change, 134(4) , 621–633, doi: 10.1007/s10584-015-1554-4.
Roxy, M.K. et al., 2015: Drying of Indian subcontinent by rapid Indian Ocean warming and a weakening land-sea thermal gradient. Nature Communications, 6, 7423, doi: 10.1038/ncomms8423.
Roxy, M.K. et al., 2017: A threefold rise in widespread extreme rain events over central India. Nature Communications, 8(1) , 708, doi: 10.1038/s41467-017-00744-9.
Rozante, J.R., E.R. Gutierrez, A.A. Fernandes, and D.A. Vila, 2020: Performance of precipitation products obtained from combinations of satellite and surface observations. International Journal of Remote Sensing, 41(19) , 7585–7604, doi: 10.1080/01431161.2020.1763504.
Rupp, D.E., P.W. Mote, N.L. Bindoff, P. Stott, and D. Robinson, 2013: Detection and Attribution of Observed Changes in Northern Hemisphere Spring Snow Cover. Journal of Climate, 26(18) , 6904–6914, doi: 10.1175/jcli-d-12-00563.1.
Ruscica, R.C., C.G. Menéndez, and A.A. Sörensson, 2016: Land surface–atmosphere interaction in future South American climate using a multi-model ensemble. Atmospheric Science Letters, 17(2) , 141–147, doi: 10.1002/asl.635.
Russo, E., I. Kirchner, S. Pfahl, M. Schaap, and U. Cubasch, 2019: Sensitivity studies with the regional climate model COSMO-CLM 5.0 over the CORDEX Central Asia Domain. Geoscientific Model Development, 12(12) , 5229–5249, doi: 10.5194/gmd-12-5229-2019.
Rutgersson, A. et al., 2015: Recent Change – Atmosphere. In: Second Assessment of Climate Change for the Baltic Sea Basin[The BACC II Author Team (ed.)]. Springer, Cham, Switzerland, pp. 69–97, doi: 10.1007/978-3-319-16006-1_4.
Ruti, P.M. et al., 2016: Med-CORDEX Initiative for Mediterranean Climate Studies. Bulletin of the American Meteorological Society, 97(7) , 1187–1208, doi: 10.1175/bams-d-14-00176.1.
Ryu, J.-H. and K. Hayhoe, 2014: Understanding the sources of Caribbean precipitation biases in CMIP3 and CMIP5 simulations. Climate Dynamics, 42(11) , 3233–3252, doi: 10.1007/s00382-013-1801-1.
Sa’adi, Z., S. Shahid, T. Ismail, E.-S. Chung, and X.-J. Wang, 2019: Trends analysis of rainfall and rainfall extremes in Sarawak, Malaysia using modified Mann–Kendall test. Meteorology and Atmospheric Physics, 131(3) , 263–277, doi: 10.1007/s00703-017-0564-3.
Sabin, T.P. et al., 2013: High resolution simulation of the South Asian monsoon using a variable resolution global climate model. Climate Dynamics, 41(1) , 173–194, doi: 10.1007/s00382-012-1658-8.
Saeed, F. and H. Athar, 2018: Assessment of simulated and projected climate change in Pakistan using IPCC AR4-based AOGCMs. Theoretical and Applied Climatology, 134(3–4) , 967–980, doi: 10.1007/s00704-017-2320-5.
Safarianzengir, V. et al., 2020: Monitoring and Analysis of Changes in the Depth and Surface Area Snow of the Mountains in Iran Using Remote Sensing Data. Journal of the Indian Society of Remote Sensing, 48(11) , 1479–1494, doi: 10.1007/s12524-020-01145-0.
Saha, A., S. Ghosh, A.S. Sahana, and E.P. Rao, 2014: Failure of CMIP5 climate models in simulating post-1950 decreasing trend of Indian monsoon. Geophysical Research Letters, 41(20) , 7323–7330, doi: 10.1002/2014gl061573.
Salinger, M.J., B.B. Fitzharris, and T. Chinn, 2019: Atmospheric circulation and ice volume changes for the small and medium glaciers of New Zealand’s Southern Alps mountain range 1977–2018. International Journal of Climatology, 39(11) , 4274–4287, doi: 10.1002/joc.6072.
Salinger, M.J., S. McGree, F. Beucher, S.B. Power, and F. Delage, 2014: A new index for variations in the position of the South Pacific convergence zone 1910/11–2011/2012. Climate Dynamics, 43(3–4) , 881–892, doi: 10.1007/s00382-013-2035-y.
Salio, P., M.P. Hobouchian, Y. García Skabar, and D. Vila, 2015: Evaluation of high-resolution satellite precipitation estimates over southern South America using a dense rain gauge network. Atmospheric Research, 163, 146–161, doi: 10.1016/j.atmosres.2014.11.017.
Salman, S.A., S. Shahid, T. Ismail, E.-S. Chung, and A.M. Al-Abadi, 2017: Long-term trends in daily temperature extremes in Iraq. Atmospheric Research, 198, 97–107, doi: 10.1016/j.atmosres.2017.08.011.
Salman, S.A. et al., 2018: Unidirectional trends in daily rainfall extremes of Iraq. Theoretical and Applied Climatology, 134(3–4) , 1165–1177, doi: 10.1007/s00704-017-2336-x.
Sánchez, E. et al., 2015: Regional climate modelling in CLARIS-LPB: a concerted approach towards twentyfirst century projections of regional temperature and precipitation over South America. Climate Dynamics, 45(7–8) , 2193–2212, doi: 10.1007/s00382-014-2466-0.
Sanchez-Gomez, E. and S. Somot, 2018: Impact of the internal variability on the cyclone tracks simulated by a regional climate model over the Med-CORDEX domain. Climate Dynamics, 51(3) , 1005–1021, doi: 10.1007/s00382-016-3394-y.
Sanchez-Lorenzo, A. et al., 2015: Reassessment and update of long-term trends in downward surface shortwave radiation over Europe (1939–2012). Journal of Geophysical Research: Atmospheres, 120(18) , 9555–9569, doi: 10.1002/2015jd023321.
Sanjay, J., M.V.S. Ramarao, M. Mujumdar, and R. Krishnan, 2017: Regional Climate Change Scenarios. In: Observed Climate Variability and Change over the Indian Region[Rajeevan, M. and S. Nayak (eds.)]. Springer, Singapore, pp. 285–304, doi: 10.1007/978-981-10-2531-0_16.
Sanogo, S. et al., 2015: Spatio-temporal characteristics of the recent rainfall recovery in West Africa. International Journal of Climatology, 35(15) , 4589–4605, doi: 10.1002/joc.4309.
Santer, B.D. et al., 2008: Consistency of modelled and observed temperature trends in the tropical troposphere. International Journal of Climatology, 28(13) , 1703–1722, doi: 10.1002/joc.1756.
Saros, J.E. et al., 2019: Arctic climate shifts drive rapid ecosystem responses across the West Greenland landscape. Environmental Research Letters, 14(7) , 074027, doi: 10.1088/1748-9326/ab2928.
Satgé, F., D. Ruelland, M.-P. Bonnet, J. Molina, and R. Pillco, 2019: Consistency of satellite-based precipitation products in space and over time compared with gauge observations and snow-hydrological modelling in the Lake Titicaca region. Hydrology and Earth System Sciences, 23(1) , 595–619, doi: 10.5194/hess-23-595-2019.
Scarchilli, C. et al., 2020: Characterization of snowfall estimated by in situ and ground-based remote-sensing observations at Terra Nova Bay, Victoria Land, Antarctica. Journal of Glaciology, 66(260) , 1006–1023, doi: 10.1017/jog.2020.70.
Schaller, N. et al., 2016: Human influence on climate in the 2014 southern England winter floods and their impacts. Nature Climate Change, 6(6) , 627–634, doi: 10.1038/nclimate2927.
Schiermeier, Q., 2018: Droughts, heatwaves and floods: How to tell when climate change is to blame. Nature, 560, 20–22, doi: 10.1038/d41586-018-05849-9.
Schilling, J., K.P. Freier, E. Hertig, and J. Scheffran, 2012: Climate change, vulnerability and adaptation in North Africa with focus on Morocco. Agriculture, Ecosystems & Environment, 156, 12–26, doi: 10.1016/j.agee.2012.04.021.
Schmucki, E., C. Marty, C. Fierz, and M. Lehning, 2015: Simulations of 21st century snow response to climate change in Switzerland from a set of RCMs. International Journal of Climatology, 35(11) , 3262–3273, doi: 10.1002/joc.4205.
Schneider, D.P., J.E. Kay, and J. Lenaerts, 2020: Improved clouds over Southern Ocean amplify Antarctic precipitation response to ozone depletion in an earth system model. Climate Dynamics, 55(5–6) , 1665–1684, doi: 10.1007/s00382-020-05346-8.
Schneider, U. et al., 2011: GPCC Full Data Reanalysis Version 6.0 at 1.0°: Monthly Land-Surface Precipitation from Rain-Gauges built on GTS-based and Historic Data. Retrieved from: https://doi.org/10.5676/DWD_GPCC/FD_M_V6_100.
Schwingshackl, C. et al., 2019: Regional climate model projections underestimate future warming due to missing plant physiological CO2response. Environmental Research Letters, 14(11) , 114019, doi: 10.1088/1748-9326/ab4949.
Scott, R.C., J.P. Nicolas, D.H. Bromwich, J.R. Norris, and D. Lubin, 2019: Meteorological Drivers and Large-Scale Climate Forcing of West Antarctic Surface Melt. Journal of Climate, 32(3) , 665–684, doi: 10.1175/jcli-d-18-0233.1.
Screen, J.A. and I. Simmonds, 2010: Increasing fall-winter energy loss from the Arctic Ocean and its role in Arctic temperature amplification. Geophysical Research Letters, 37(16) , L16707, doi: 10.1029/2010gl044136.
Sellami, H., S. Benabdallah, I. La Jeunesse, and M. Vanclooster, 2016: Quantifying hydrological responses of small Mediterranean catchments under climate change projections. Science of The Total Environment, 543, 924–936, doi: 10.1016/j.scitotenv.2015.07.006.
Sellar, A.A. et al., 2019: UKESM1: Description and evaluation of the UK Earth System Model. Journal of Advances in Modeling Earth Systems, 11(12) , 4513–4558, doi: 10.1029/2019ms001739.
Semenov, V.A., 2016: Link between anomalously cold winters in Russia and sea-ice decline in the Barents Sea. Izvestiya, Atmospheric and Oceanic Physics, 52(3) , 225–233, doi: 10.1134/s0001433816030105.
Semenov, V.A., I.I. Mokhov, and M. Latif, 2012: Influence of the ocean surface temperature and sea ice concentration on regional climate changes in Eurasia in recent decades. Izvestiya, Atmospheric and Oceanic Physics, 48(4) , 355–372, doi: 10.1134/s0001433812040135.
Seneviratne, S.I. and M. Hauser, 2020: Regional Climate Sensitivity of Climate Extremes in CMIP6 Versus CMIP5 Multimodel Ensembles. Earth’s Future, 8(9) , e2019EF001474, doi: 10.1029/2019ef001474.
Seneviratne, S.I. et al., 2012: Changes in Climate Extremes and their Impacts on the Natural Physical Environment. In: Managing the Risks of Extreme Events and Disasters to Advance Climate Change Adaptation. A Special Report of Working Groups I and II of the Intergovernmental Panel on Climate Change[Field, C.B., V. Barros, T.F. Stocker, Q. Dahe, D.J. Dokken, K.L. Ebi, M.D. Mastrandrea, K.J. Mach, G.-K. Plattner, S.K. Allen, M. Tignor, and P.M. Midgley (eds.)]. Cambridge University Press, Cambridge, United Kingdom and New York, NY, USA, pp. 109–230, doi: 10.1017/cbo9781139177245.006.
Šeparović, L. et al., 2013: Present climate and climate change over North America as simulated by the fifth-generation Canadian regional climate model. Climate Dynamics, 41(11–12) , 3167–3201, doi: 10.1007/s00382-013-1737-5.
Seroussi, H. et al., 2020: ISMIP6 Antarctica: a multi-model ensemble of the Antarctic ice sheet evolution over the 21st century. The Cryosphere, 14(9) , 3033–3070, doi: 10.5194/tc-14-3033-2020.
Serreze, M.C. and R.G. Barry, 2011: Processes and impacts of Arctic amplification: A research synthesis. Global and Planetary Change, 77(1–2) , 85–96, doi: 10.1016/j.gloplacha.2011.03.004.
Sharafi, S. and N. Mir Karim, 2020: Investigating trend changes of annual mean temperature and precipitation in Iran. Arabian Journal of Geosciences, 13(16) , 759, doi: 10.1007/s12517-020-05695-y.
Sharma, A., H.-P. Huang, P. Zavialov, and V. Khan, 2018: Impact of Desiccation of Aral Sea on the Regional Climate of Central Asia Using WRF Model. Pure and Applied Geophysics, 175(1) , 465–478, doi: 10.1007/s00024-017-1675-y.
Shepherd, T.G. et al., 2018: Storylines: an alternative approach to representing uncertainty in physical aspects of climate change. Climatic Change, 151(3–4) , 555–571, doi: 10.1007/s10584-018-2317-9.
Sherstyukov, B.G., 2016: The climatic conditions of the Arctic and new approaches to the forecast of the climate change. Арктика и Север, 24, 35–60, www.arcticandnorth.ru/upload/iblock/eaf/04_sherstyukov.pdf .
Shin, S.-H. and J.-Y. Moon, 2018: Prediction Skill for the East Asian Winter Monsoon Based on APCC Multi-Models. Atmosphere, 9(8) , 300, doi: 10.3390/atmos9080300.
Shongwe, M.E. et al., 2015: An evaluation of CORDEX regional climate models in simulating precipitation over Southern Africa. Atmospheric Science Letters, 16(3) , 199–207, doi: 10.1002/asl2.538.
Shultz, J.M. et al., 2019: Risks, Health Consequences, and Response Challenges for Small-Island-Based Populations: Observations From the 2017 Atlantic Hurricane Season. Disaster Medicine and Public Health Preparedness, 13(01) , 5–17, doi: 10.1017/dmp.2018.28.
Sierra, J.P., P.A. Arias, and S.C. Vieira, 2015: Precipitation over Northern South America and Its Seasonal Variability as Simulated by the CMIP5 Models. Advances in Meteorology, 2015, 1–22, doi: 10.1155/2015/634720.
Sierra, J.P., P.A. Arias, S.C. Vieira, and J. Agudelo, 2018: How well do CMIP5 models simulate the low-level jet in western Colombia?Climate Dynamics, 51(5–6) , 2247–2265, doi: 10.1007/s00382-017-4010-5.
Siew, J.H., F.T. Tangang, and L. Juneng, 2013: Evaluation of CMIP5 coupled atmosphere-ocean general circulation models and projection of the Southeast Asian winter monsoon in the 21st century. International Journal of Climatology, 34(9) , 2872–2884, doi: 10.1002/joc.3880.
Silber, I. et al., 2019: Persistent Supercooled Drizzle at Temperatures Below –25°C Observed at McMurdo Station, Antarctica. Journal of Geophysical Research: Atmospheres, 124(20) , 10878–10895, doi: 10.1029/2019jd030882.
Sillmann, J., V. Kharin, X. Zhang, F.W. Zwiers, and D. Bronaugh, 2013: Climate extremes indices in the CMIP5 multimodel ensemble: Part 1. Model evaluation in the present climate. Journal of Geophysical Research: Atmospheres, 118(4) , 1716–1733, doi: 10.1002/jgrd.50203.
Silvestri, G. and C. Vera, 2009: Nonstationary Impacts of the Southern Annular Mode on Southern Hemisphere Climate. Journal of Climate, 22(22) , 6142–6148, doi: 10.1175/2009jcli3036.1.
Singh, D., M. Tsiang, B. Rajaratnam, and N.S. Diffenbaugh, 2014: Observed changes in extreme wet and dry spells during the South Asian summer monsoon season. Nature Climate Change, 4(6) , 456–461, doi: 10.1038/nclimate2208.
Singh, M.S., Z. Kuang, E.D. Maloney, W.M. Hannah, and B.O. Wolding, 2017: Increasing potential for intense tropical and subtropical thunderstorms under global warming. Proceedings of the National Academy of Sciences, 114(44) , 11657–11662, doi: 10.1073/pnas.1707603114.
Singh, S., S. Ghosh, A.S. Sahana, H. Vittal, and S. Karmakar, 2017: Do dynamic regional models add value to the global model projections of Indian monsoon?Climate Dynamics, 48(3–4) , 1375–1397, doi: 10.1007/s00382-016-3147-y.
Skansi, M.M. et al., 2013: Warming and wetting signals emerging from analysis of changes in climate extreme indices over South America. Global and Planetary Change, 100, 295–307, doi: 10.1016/j.gloplacha.2012.11.004.
Skaugen, T., H.B. Stranden, and T. Saloranta, 2012: Trends in snow water equivalent in Norway (1931–2009). Hydrology Research, 43(4) , 489–499, doi: 10.2166/nh.2012.109.
Skrynyk, O. et al., 2020: Ukrainian early (pre-1850) historical weather observations. Geoscience Data Journal, 8(1) , 55–73, doi: 10.1002/gdj3.108.
Slivinski, L.C. et al., 2019: Towards a more reliable historical reanalysis: Improvements for version 3 of the Twentieth Century Reanalysis system. Quarterly Journal of the Royal Meteorological Society, 145(724) , 2876–2908, doi: 10.1002/qj.3598.
Smith, C.D., A. Kontu, R. Laffin, and J.W. Pomeroy, 2017: An assessment of two automated snow water equivalent instruments during the WMO Solid Precipitation Intercomparison Experiment. Cryosphere, 11(1) , 101–116, doi: 10.5194/tc-11-101-2017.
Smith, D.M. et al., 2019: The Polar Amplification Model Intercomparison Project (PAMIP) contribution to CMIP6: investigating the causes and consequences of polar amplification. Geoscientific Model Development, 12(3) , 1139–1164, doi: 10.5194/gmd-12-1139-2019.
Soares, P.M.M. and R.M. Cardoso, 2018: A simple method to assess the added value using high-resolution climate distributions: application to the EURO-CORDEX daily precipitation. International Journal of Climatology, 38(3) , 1484–1498, doi: 10.1002/joc.5261.
Soares dos Santos, T., D. Mendes, and R. Rodrigues Torres, 2016: Artificial neural networks and multiple linear regression model using principal components to estimate rainfall over South America. Nonlinear Processes in Geophysics, 23(1) , 13–20, doi: 10.5194/npg-23-13-2016.
Solman, S.A., 2013: Regional Climate Modeling over South America: A Review. Advances in Meteorology, 2013, 1–13, doi: 10.1155/2013/504357.
Solman, S.A., 2016: Systematic temperature and precipitation biases in the CLARIS-LPB ensemble simulations over South America and possible implications for climate projections. Climate Research, 68(2–3) , 117–136, doi: 10.3354/cr01362.
Solman, S.A. and J. Blázquez, 2019: Multiscale precipitation variability over South America: Analysis of the added value of CORDEX RCM simulations. Climate Dynamics, 53(3–4) , 1547–1565, doi: 10.1007/s00382-019-04689-1.
Solman, S.A., M.N. Nuñez, and M.F. Cabré, 2008: Regional climate change experiments over southern South America. I: present climate. Climate Dynamics, 30(5) , 533–552, doi: 10.1007/s00382-007-0304-3.
Solman, S.A. et al., 2013: Evaluation of an ensemble of regional climate model simulations over South America driven by the ERA-Interim reanalysis: Model performance and uncertainties. Climate Dynamics, 41(5–6) , 1139–1157, doi: 10.1007/s00382-013-1667-2.
Song, S. and J. Bai, 2016: Increasing Winter Precipitation over Arid Central Asia under Global Warming. Atmosphere, 7(10) , 139, doi: 10.3390/atmos7100139.
Sørland, S.L., C. Schär, D. Lüthi, and E. Kjellström, 2018: Bias patterns and climate change signals in GCM-RCM model chains. Environmental Research Letters, 13(7) , 074017, doi: 10.1088/1748-9326/aacc77.
Souverijns, N. et al., 2019: A New Regional Climate Model for POLAR-CORDEX: Evaluation of a 30-Year Hindcast with COSMO-CLM2 Over Antarctica. Journal of Geophysical Research: Atmospheres, 124(3) , 1405–1427, doi: 10.1029/2018jd028862.
Souvignet, M., H. Gaese, L. Ribbe, N. Kretschmer, and R. Oyarzún, 2010: Statistical downscaling of precipitation and temperature in north-central Chile: an assessment of possible climate change impacts in an arid Andean watershed. Hydrological Sciences Journal, 55(1) , 41–57, doi: 10.1080/02626660903526045.
Sperber, K.R. et al., 2013: The Asian summer monsoon: An intercomparison of CMIP5 vs. CMIP3 simulations of the late 20th century. Climate Dynamics, 41(9–10) , 2711–2744, doi: 10.1007/s00382-012-1607-6.
Spinoni, J., G. Naumann, J. Vogt, and P. Barbosa, 2015a: The biggest drought events in Europe from 1950 to 2012. Journal of Hydrology: Regional Studies, 3, 509–524, doi: 10.1016/j.ejrh.2015.01.001.
Spinoni, J. et al., 2015b: Climate of the Carpathian Region in the period 1961–2010: Climatologies and trends of 10 variables. International Journal of Climatology, 35(7) , 1322–1341, doi: 10.1002/joc.4059.
Spinoni, J. et al., 2020: Future Global Meteorological Drought Hot Spots: A Study Based on CORDEX Data. Journal of Climate, 33(9) , 3635–3661, doi: 10.1175/jcli-d-19-0084.1.
Srivastava, A., R. Grotjahn, and P.A. Ullrich, 2020: Evaluation of historical CMIP6 model simulations of extreme precipitation over contiguous US regions. Weather and Climate Extremes, 29, 100268, doi: 10.1016/j.wace.2020.100268.
Srivastava, A.K. and T. Delsole, 2014: Robust forced response in South Asian summer monsoon in a future climate. Journal of Climate, 27(20) , 7849–7860, doi: 10.1175/jcli-d-13-00599.1.
Srivastava, A.K., D.R. Kothawale, and M.N. Rajeevan, 2017: Variability and Long-Term Changes in Surface Air Temperatures Over the Indian Subcontinent. In: Observed Climate Variability and Change over the Indian Region[Rajeevan, M. and S. Nayak (eds.)]. Springer, Singapore, pp. 17–35, doi: 10.1007/978-981-10-2531-0_2.
Srivastava, A.K., J. Revadekar, and M. Rajeevan, 2019: South Asia [in “State of the climate in 2018”]. Bulletin of the American Meteorological Society, 100(9) , S236–S240, doi: 10.1175/2019bamsstateoftheclimate.1.
Steger, C., S. Kotlarski, T. Jonas, and C. Schär, 2013: Alpine snow cover in a changing climate: A regional climate model perspective. Climate Dynamics, 41(3–4) , 735–754, doi: 10.1007/s00382-012-1545-3.
Stennett-Brown, R.K., J.J.P. Jones, T.S. Stephenson, and M.A. Taylor, 2017: Future Caribbean temperature and rainfall extremes from statistical downscaling. International Journal of Climatology, 37(14) , 4828–4845, doi: 10.1002/joc.5126.
Stenni, B. et al., 2017: Antarctic climate variability on regional and continental scales over the last 2000 years. Climate of the Past, 13(11) , 1609–1634, doi: 10.5194/cp-13-1609-2017.
Stephenson, T.S. et al., 2014: Changes in extreme temperature and precipitation in the Caribbean region, 1961–2010. International Journal of Climatology, 34(9) , 2957–2971, doi: 10.1002/joc.3889.
Steptoe, H., S.E.O. Jones, and H. Fox, 2018: Correlations Between Extreme Atmospheric Hazards and Global Teleconnections: Implications for Multihazard Resilience. Reviews of Geophysics, 56(1) , 50–78, doi: 10.1002/2017rg000567.
Stocker, T.F. et al., 2013: Technical Summary. In: Climate Change 2013: The Physical Science Basis. Contribution of Working Group I to the Fifth Assessment Report of the Intergovernmental Panel on Climate Change[Stocker, T.F., D. Qin, G.-K. Plattner, M. Tignor, S.K. Allen, J. Boschung, A. Nauels, Y. Xia, V. Bex, and P.M. Midgley (eds.)]. Cambridge University Press, Cambridge, United Kingdom and New York, NY, USA, pp. 33–115, doi: 10.1017/cbo9781107415324.005.
Stott, P.A., N. Christidis, and R.A. Betts, 2011: Changing return periods of weather-related impacts: the attribution challenge. Climatic Change, 109(3–4) , 263–268, doi: 10.1007/s10584-011-0265-8.
Stott, P.A. et al., 2010: Detection and attribution of climate change: a regional perspective. WIREs Climate Change, 1(2) , 192–211, doi: 10.1002/wcc.34.
St-Pierre, M., J.M. Thériault, and D. Paquin, 2019: Influence of the Model Horizontal Resolution on Atmospheric Conditions Leading to Freezing Rain in Regional Climate Simulations. Atmosphere-Ocean, 57(2) , 101–119, doi: 10. 1080/07055900.2019.1583088.
Stratton, R.A. et al., 2018: A Pan-African Convection-Permitting Regional Climate Simulation with the Met Office Unified Model: CP4-Africa. Journal of Climate, 31(9) , 3485–3508, doi: 10.1175/jcli-d-17-0503.1.
Strauch, A.M., R.A. MacKenzie, C.P. Giardina, and G.L. Bruland, 2015: Climate driven changes to rainfall and streamflow patterns in a model tropical island hydrological system. Journal of Hydrology, 523, 160–169, doi: 10.1016/j.jhydrol.2015.01.045.
Stuecker, M.F. et al., 2018: Polar amplification dominated by local forcing and feedbacks. Nature Climate Change, 8(12) , 1076–1081, doi: 10.1038/s41558-018-0339-y.
Sturman, A. and H. Quénol, 2013: Changes in atmospheric circulation and temperature trends in major vineyard regions of New Zealand. International Journal of Climatology, 33(12) , 2609–2621, doi: 10.1002/joc.3608.
Sun, B., H. Wang, and B. Zhou, 2019: Climatic Condition and Synoptic Regimes of Two Intense Snowfall Events in Eastern China and Implications for Climate Variability. Journal of Geophysical Research: Atmospheres, 124(2) , 926–941, doi: 10.1029/2018jd029921.
Sun, H. et al., 2018: Impacts of global warming of 1.5°C and 2.0°C on precipitation patterns in China by regional climate model (COSMO-CLM). Atmospheric Research, 203, 83–94, doi: 10.1016/j.atmosres.2017.10.024.
Sun, Q. et al., 2018: A Review of Global Precipitation Data Sets: Data Sources, Estimation, and Intercomparisons. Reviews of Geophysics, 56(1) , 79–107, doi: 10.1002/2017rg000574.
Sun, Y. et al., 2014: Rapid increase in the risk of extreme summer heat in Eastern China. Nature Climate Change, 4(12) , 1082–1085, doi: 10.1038/nclimate2410.
Supari, F. Tangang, L. Juneng, and E. Aldrian, 2017: Observed changes in extreme temperature and precipitation over Indonesia. International Journal of Climatology, 37(4) , 1979–1997, doi: 10.1002/joc.4829.
Supari et al., 2018: ENSO modulation of seasonal rainfall and extremes in Indonesia. Climate Dynamics, 51(7–8) , 2559–2580, doi: 10.1007/s00382-017-4028-8.
Supari et al., 2020: Multi-model projections of precipitation extremes in Southeast Asia based on CORDEX-Southeast Asia simulations. Environmental Research, 184, 109350, doi: 10.1016/j.envres.2020.109350.
Suriano, Z.J. and D.J. Leathers, 2016: Twenty-first century snowfall projections within the eastern Great Lakes region: Detecting the presence of a lake-induced snowfall signal in GCMs. International Journal of Climatology, 36(5) , 2200–2209, doi: 10.1002/joc.4488.
Susskind, J., G.A. Schmidt, J.N. Lee, and L. Iredell, 2019: Recent global warming as confirmed by AIRS. Environmental Research Letters, 14(4) , 044030, doi: 10.1088/1748-9326/aafd4e.
Suzuki-Parker, A. et al., 2018: Contributions of GCM/RCM Uncertainty in Ensemble Dynamical Downscaling for Precipitation in East Asian Summer Monsoon Season. SOLA, 14, 97–104, doi: 10.2151/sola.2018-017.
Syed, F.S., W. Iqbal, A.A.B. Syed, and G. Rasul, 2014: Uncertainties in the regional climate models simulations of South-Asian summer monsoon and climate change. Climate Dynamics, 42(7) , 2079–2097, doi: 10.1007/s00382-013-1963-x.
Syed, F.S., M. Latif, A. Al-Maashi, and A. Ghulam, 2019: Regional climate model RCA4 simulations of temperature and precipitation over the Arabian Peninsula: sensitivity to CORDEX domain and lateral boundary conditions. Climate Dynamics, 53(11) , 7045–7064, doi: 10.1007/s00382-019-04974-z.
Sylla, M.B., F. Giorgi, E. Coppola, and L. Mariotti, 2013: Uncertainties in daily rainfall over Africa: Assessment of gridded observation products and evaluation of a regional climate model simulation. International Journal of Climatology, 33, 1805–1817, doi: 10.1002/joc.3551.
Sylla, M.B., A. Faye, N.A.B. Klutse, and K. Dimobe, 2018: Projected increased risk of water deficit over major West African river basins under future climates. Climatic Change, 151(2) , 247–258, doi: 10.1007/s10584-018-2308-x.
Sylla, M.B., P.M. Nikiema, P. Gibba, I. Kebe, and N.A.B. Klutse, 2016: Climate Change over West Africa: Recent Trends and Future Projections. In: Adaptation to Climate Change and Variability in Rural West Africa[Yaro, J. and J. Hesselberg (eds.)]. Springer, Cham, Switzerland, pp. 25–40, doi: 10.1007/978-3-319-31499-0_3.
Tabary, P. et al., 2012: A 10-year (1997–2006) reanalysis of Quantitative Precipitation Estimation over France: methodology and first results. In: Weather Radar and Hydrology (Proceedings of a symposium held in Exeter, UK, April 2011) [Moore, R.J., S.J. Cole, and A.J. Illingworth (eds.)]. IAHS Press, Wallingford, UK, pp. 255–260.
Takaya, Y., I. Ishikawa, C. Kobayashi, H. Endo, and T. Ose, 2020: Enhanced Meiyu-Baiu Rainfall in Early Summer 2020: Aftermath of the 2019 Super IOD Event. Geophysical Research Letters, 47(22) , e2020GL090671, doi: 10.1029/2020gl090671.
Takhsha, M. et al., 2018: Dynamical downscaling with the fifth-generation Canadian regional climate model (CRCM5) over the CORDEX Arctic domain: effect of large-scale spectral nudging and of empirical correction of sea-surface temperature. Climate Dynamics, 51(1) , 161–186, doi: 10.1007/s00382-017-3912-6.
Tan, J., C. Jakob, W.B. Rossow, and G. Tselioudis, 2015: Increases in tropical rainfall driven by changes in frequency of organized deep convection. Nature, 519(7544) , 451–454, doi: 10.1038/nature14339.
Tan, M.L., L. Juneng, F.T. Tangang, J.X. Chung, and R.B. Radin Firdaus, 2021: Changes in temperature extremes and their relationship with ENSO in Malaysia from 1985 to 2018. International Journal of Climatology, 41(S1) , E2564–E2580, doi: 10.1002/joc.6864.
Tang, J. et al., 2016: Building Asian climate change scenario by multi-regional climate models ensemble. Part I: surface air temperature. International Journal of Climatology, 36(13) , 4241–4252, doi: 10.1002/joc.4628.
Tangang, F. et al., 2017: Characteristics of precipitation extremes in Malaysia associated with El Niño and La Niña events. International Journal of Climatology, 37, 696–716, doi: 10.1002/joc.5032.
Tangang, F. et al., 2018: Future changes in annual precipitation extremes over Southeast Asia under global warming of 2°C. APN Science Bulletin, 8(1) , 3–8, doi: 10.30852/sb.2018.436.
Tangang, F. et al., 2020: Projected future changes in rainfall in Southeast Asia based on CORDEX–SEA multi-model simulations. Climate Dynamics, 55(5–6) , 1247–1267, doi: 10.1007/s00382-020-05322-2.
Tatebe, H. et al., 2019: Description and basic evaluation of simulated mean state, internal variability, and climate sensitivity in MIROC6. Geoscientific Model Development, 12(7) , 2727–2765, doi: 10.5194/gmd-12-2727-2019.
Taylor, A.L., S. Dessai, and W.B. de Bruin, 2015: Communicating uncertainty in seasonal and interannual climate forecasts in Europe. Philosophical Transactions of the Royal Society A: Mathematical, Physical and Engineering Sciences, 373(2055) , 20140454, doi: 10.1098/rsta.2014.0454.
Taylor, C.M. et al., 2017: Frequency of extreme Sahelian storms tripled since 1982 in satellite observations. Nature, 544(7651) , 475–478, doi: 10.1038/nature22069.
Taylor, K.E., R.J. Stouffer, and G.A. Meehl, 2012: An Overview of CMIP5 and the Experiment Design. Bulletin of the American Meteorological Society, 93(4) , 485–498, doi: 10.1175/bams-d-11-00094.1.
Taylor, M.A. and E.J. Alfaro, 2005: Central America and the Caribbean, Climate of. In: Encyclopedia of World Climatology[Oliver, J.E. (ed.)]. Springer, Dordrecht, The Netherlands, pp. 183–189, doi: 10.1007/1-4020-3266-8_37.
Taylor, M.A., T.S. Stephenson, A.A. Chen, and K.A. Stephenson, 2012: Climate Change and the Caribbean: Review and Response. Caribbean Studies, 40(2) , 169–200, doi: 10.1353/crb.2012.0020.
Taylor, M.A., F.S. Whyte, T.S. Stephenson, and J.D. Campbell, 2013a: Why dry? Investigating the future evolution of the Caribbean Low Level Jet to explain projected Caribbean drying. International Journal of Climatology, 33(3) , 784–792, doi: 10.1002/joc.3461.
Taylor, M.A. et al., 2013b: The Precis Caribbean Story: Lessons and Legacies. Bulletin of the American Meteorological Society, 94(7) , 1065–1073, doi: 10.1175/bams-d-11-00235.1.
Taylor, M.A. et al., 2018: Future Caribbean Climates in a World of Rising Temperatures: The 1.5 vs 2.0 Dilemma. Journal of Climate, 31(7) , 2907–2926, doi: 10.1175/jcli-d-17-0074.1.
Tebaldi, C., J.M. Arblaster, and R. Knutti, 2011: Mapping model agreement on future climate projections. Geophysical Research Letters, 38(23) , L23701, doi: 10.1029/2011gl049863.
Tedeschi, R.G. and M. Collins, 2016: The influence of ENSO on South American precipitation during austral summer and autumn in observations and models. International Journal of Climatology, 36(2) , 618–635, doi: 10.1002/joc.4371.
Teichmann, C. et al., 2018: Avoiding Extremes: Benefits of Staying below +1.5°C Compared to +2.0°C and +3.0°C Global Warming. Atmosphere, 9(4) , 115, doi: 10.3390/atmos9040115.
Teichmann, C. et al., 2021: Assessing mean climate change signals in the global CORDEX-CORE ensemble. Climate Dynamics, 57(5–6) , 1269–1292, doi: 10.1007/s00382-020-05494-x.
Terzago, S., J. von Hardenberg, E. Palazzi, and A. Provenzale, 2017: Snow water equivalent in the Alps as seen by gridded data sets, CMIP5 and CORDEX climate models. The Cryosphere, 11(4) , 1625–1645, doi: 10.5194/tc-11-1625-2017.
Tetzner, D., E. Thomas, and C. Allen, 2019: A Validation of ERA5 Reanalysis Data in the Southern Antarctic Peninsula – Ellsworth Land Region, and Its Implications for Ice Core Studies. Geosciences, 9(7) , 289, doi: 10.3390/geosciences9070289.
Thirumalai, K., P.N. DiNezio, Y. Okumura, and C. Deser, 2017: Extreme temperatures in Southeast Asia caused by El Niño and worsened by global warming. Nature Communications, 8, 15531, doi: 10.1038/ncomms15531.
Thomas, E.R. et al., 2017: Regional Antarctic snow accumulation over the past 1000 years. Climate of the Past, 13(11) , 1491–1513, doi: 10.5194/cp-13-1491-2017.
Thompson, E., R. Frigg, and C. Helgeson, 2016: Expert Judgment for Climate Change Adaptation. Philosophy of Science, 83(5) , 1110–1121, doi: 10.1086/687942.
Thorarinsdottir, T.L., J. Sillmann, M. Haugen, N. Gissibl, and M. Sandstad, 2020: Evaluation of CMIP5 and CMIP6 simulations of historical surface air temperature extremes using proper evaluation methods. Environmental Research Letters, 15(12) , 124041, doi: 10.1088/1748-9326/abc778.
Thornton, P.E. et al., 2016: Daymet: Daily Surface Weather Data on a 1-km Grid for North America, Version 3. Oak Ridge National Laboratory Distributed Active Archive Center (ORNL DAAC), Oak Ridge, TN, USA. Retrieved from: https://dx.doi.org/10.3334/ORNLDAAC/1328.
Tian, T. et al., 2013: Resolved complex coastlines and land–sea contrasts in a high-resolution regional climate model: a comparative study using prescribed and modelled SSTs. Tellus A: Dynamic Meteorology and Oceanography, 65(1) , 19951, doi: 10.3402/tellusa.v65i0.19951.
Tierney, J.E., C.C. Ummenhofer, and P.B. DeMenocal, 2015: Past and future rainfall in the Horn of Africa. Science Advances, 1(9) , e1500682, doi: 10.1126/sciadv.1500682.
Timm, O.E., T.W. Giambelluca, and H.F. Diaz, 2015: Statistical downscaling of rainfall changes in Hawai‘i based on the CMIP5 global model projections. Journal of Geophysical Research: Atmospheres, 120(1) , 92–112, doi: 10.1002/2014jd022059.
Top, S. et al., 2021: Evaluation of regional climate models ALARO-0 and REMO2015 at 0.22° resolution over the CORDEX Central Asia domain. Geoscientific Model Development, 14(3) , 1267–1293, doi: 10.5194/gmd-14-1267-2021.
Torma, C. and F. Giorgi, 2020: On the evidence of orographical modulation of regional fine scale precipitation change signals: The Carpathians. Atmospheric Science Letters, 21(6) , e967, doi: 10.1002/asl.967.
Torres, R.R. and J.A. Marengo, 2013: Uncertainty assessments of climate change projections over South America. Theoretical and Applied Climatology, 112(1–2) , 253–272, doi: 10.1007/s00704-012-0718-7.
Torzhkov, I.O. et al., 2019: Assessment of Future Climate Change Impacts on Forestry in Russia. Russian Meteorology and Hydrology, 44(3) , 180–186, doi: 10.3103/s1068373919030038.
Trewin, B. et al., 2020: An updated long-term homogenized daily temperature data set for Australia. Geoscience Data Journal, 7(2) , 149–169, doi: 10.1002/gdj3.95.
Trinh-Tuan, L. et al., 2018: Application of Quantile Mapping Bias Correction for Mid-future Precipitation Projections over Vietnam. SOLA, 15, 1–6, doi: 10.2151/sola.2019-001.
Tripathi, O.P. and F. Dominguez, 2013: Effects of spatial resolution in the simulation of daily and subdaily precipitation in the southwestern US. Journal of Geophysical Research: Atmospheres, 118(14) , 7591–7605, doi: 10.1002/jgrd.50590.
Troin, M. et al., 2016: A complete hydro-climate model chain to investigate the influence of sea surface temperature on recent hydroclimatic variability in subtropical South America (Laguna Mar Chiquita, Argentina). Climate Dynamics, 46(5–6) , 1783–1798, doi: 10.1007/s00382-015-2676-0.
Trusel, L.D. et al., 2015: Divergent trajectories of Antarctic surface melt under two twenty-first-century climate scenarios. Nature Geoscience, 8(12) , 927–932, doi: 10.1038/ngeo2563.
Turner, J. et al., 2016: Absence of 21st century warming on Antarctic Peninsula consistent with natural variability. Nature, 535(7612) , 411–415, doi: 10.1038/nature18645.
Turner, J. et al., 2019: The Dominant Role of Extreme Precipitation Events in Antarctic Snowfall Variability. Geophysical Research Letters, 46(6) , 3502–3511, doi: 10.1029/2018gl081517.
Turner, J. et al., 2020: Antarctic temperature variability and change from station data. International Journal of Climatology, 40(6) , 2986–3007, doi: 10.1002/joc.6378.
Turton, J., A. Kirchgaessner, A.N. Ross, and J.C. King, 2017: Does high-resolution modelling improve the spatial analysis of föhn flow over the Larsen C Ice Shelf?Weather, 72(7) , 192–196, doi: 10.1002/wea.3028.
Turton, J., A. Kirchgaessner, A.N. Ross, J.C. King, and P. Kuipers Munneke, 2020: The influence of föhn winds on annual and seasonal surface melt on the Larsen C Ice Shelf, Antarctica. The Cryosphere, 14(11) , 4165–4180, doi: 10.5194/tc-14-4165-2020.
Ullah, S. et al., 2020: Evaluation of CMIP5 models and projected changes in temperatures over South Asia under global warming of 1.5°C, 2°C, and 3°C. Atmospheric Research, 246, 105122, doi: 10.1016/j.atmosres.2020.105122.
Vaittinada Ayar, P. et al., 2016: Intercomparison of statistical and dynamical downscaling models under the EURO- and MED-CORDEX initiative framework: present climate evaluations. Climate Dynamics, 46(3–4) , 1301–1329, doi: 10.1007/s00382-015-2647-5.
Valdés-Pineda, R., J.B. Valdés, H.F. Diaz, and R. Pizarro-Tapia, 2016: Analysis of spatio-temporal changes in annual and seasonal precipitation variability in South America-Chile and related ocean–atmosphere circulation patterns. International Journal of Climatology, 36(8) , 2979–3001, doi: 10.1002/joc.4532.
van Angelen, J.H., M.R. van den Broeke, B. Wouters, and J.T.M. Lenaerts, 2014: Contemporary (1960–2012) Evolution of the Climate and Surface Mass Balance of the Greenland Ice Sheet. Surveys in Geophysics, 35(5) , 1155–1174, doi: 10.1007/s10712-013-9261-z.
van den Besselaar, E.J.M. et al., 2017: SA-OBS: A Daily Gridded Surface Temperature and Precipitation Dataset for Southeast Asia. Journal of Climate, 30(14) , 5151–5165, doi: 10.1175/jcli-d-16-0575.1.
van den Hurk, B. et al., 2018: The match between climate services demands and Earth System Models supplies. Climate Services, 12, 59–63, doi: 10.1016/j.cliser.2018.11.002.
Van der Bilt, W. et al., 2019: Climate in Svalbard 2100 – a knowledge base for climate adaptation. NCCS report no. 1/2019, The Norwegian Centre for Climate Services (NCCS), 207 pp., www.miljodirektoratet.no/globalassets/publikasjoner/M1242/M1242.pdf .
Van Khiem, M., G. Redmond, C. McSweeney, and T. Thuc, 2014: Evaluation of dynamically downscaled ensemble climate simulations for Vietnam. International Journal of Climatology, 34(7) , 2450–2463, doi: 10.1002/joc.3851.
Van Meerbeeck, C.J., 2020: Climate Trends and Projections for the OECS Region. Organisation of Eastern Caribbean States (OECS), 77 pp., w ww.oecs.org/en/our-work/knowledge/library/climate-change/climate-trends-and-projections-for-the-oecs-region.
Van Pham, T., J. Brauch, C. Dieterich, B. Frueh, and B. Ahrens, 2014: New coupled atmosphere–ocean–ice system COSMO-CLM/NEMO: assessing air temperature sensitivity over the North and Baltic Seas. Oceanologia, 56(2) , 167–189, doi: 10.5697/oc.56-2.167.
van Wessem, J.M. et al., 2016: The modelled surface mass balance of the Antarctic Peninsula at 5.5 km horizontal resolution. The Cryosphere, 10(1) , 271–285, doi: 10.5194/tc-10-271-2016.
van Wessem, J.M. et al., 2018: Modelling the climate and surface mass balance of polar ice sheets using RACMO2 – Part 2: Antarctica (1979–2016). The Cryosphere, 12(4) , 1479–1498, doi: 10.5194/tc-12-1479-2018.
Vandecrux, B. et al., 2019: Firn data compilation reveals widespread decrease of firn air content in western Greenland. The Cryosphere, 13(3) , 845–859, doi: 10.5194/tc-13-845-2019.
Vandecrux, B. et al., 2020: The firn meltwater Retention Model Intercomparison Project (RetMIP): evaluation of nine firn models at four weather station sites on the Greenland ice sheet. The Cryosphere, 14(11) , 3785–3810, doi: 10.5194/tc-14-3785-2020.
Vaughan, D.G. et al., 2013: Observations: Cryosphere. In: Climate Change 2013: The Physical Science Basis. Contribution of Working Group I to the Fifth Assessment Report of the Intergovernmental Panel on Climate Change[Stocker, T.F., D. Qin, G.-K. Plattner, M. Tignor, S.K. Allen, J. Boschung, A. Nauels, Y. Xia, V. Bex, and P.M. Midgley (eds.)]. Cambridge University Press, Cambridge, United Kingdom and New York, NY, USA, pp. 317–382, doi: 10.1017/cbo9781107415324.012.
Vautard, R. et al., 2013: The simulation of European heat waves from an ensemble of regional climate models within the EURO-CORDEX project. Climate Dynamics, 41(9–10) , 2555–2575, doi: 10.1007/s00382-013-1714-z.
Vautard, R. et al., 2021: Evaluation of the Large EURO-CORDEX Regional Climate Model Ensemble. Journal of Geophysical Research: Atmospheres, 126(17) , e2019JD032344, doi: 10.1029/2019jd032344.
Vecchi, G.A. and B.J. Soden, 2007: Global Warming and the Weakening of the Tropical Circulation. Journal of Climate, 20(17) , 4316–4340, doi: 10.1175/jcli4258.1.
Vecchi, G.A. et al., 2006: Weakening of tropical Pacific atmospheric circulation due to anthropogenic forcing. Nature, 441(7089) , 73–76, doi: 10.1038/nature04744.
Vera, C.S. and L. Díaz, 2015: Anthropogenic influence on summer precipitation trends over South America in CMIP5 models. International Journal of Climatology, 35(10) , 3172–3177, doi: 10.1002/joc.4153.
Vicente-Serrano, S.M., E. Rodríguez-Camino, F. Domínguez-Castro, A. El Kenawy, and C. Azorín-Molina, 2017: An updated review on recent trends in observational surface atmospheric variables and their extremes over Spain. Cuadernos de Investigacion Geografica, 43(1) , 209–232, doi: 10.18172/cig.3134.
Vicente-Serrano, S.M. et al., 2018: Recent changes in monthly surface air temperature over Peru, 1964–2014. International Journal of Climatology, 38(1) , 283–306, doi: 10.1002/joc.5176.
Vichot-Llano, A. and D. Martínez-Castro, 2017: Estado actual de las representación de los principales factores del clima del Caribe por modelos climáticos regionales. Estudios de sensibilidad y validación. Revista Cubana de Meteorología, 23(2) , 232–261, http://rcm.insmet.cu/index.php/rcm/article/view/243/238.
Vichot-Llano, A., D. Martínez-Castro, A. Centella-Artola, and A. Bezanilla-Morlot, 2014: Sensibilidad al cambio de dominio y resolución de tres configuraciones del modelo climático regional RegCM 4.3 para la región de América Central y el Caribe. Revista de Climatología, 14, 45–62, www.climatol.eu/reclim/reclim14e.pdf .
Vichot-Llano, A., A. Bezanilla-Morlot, D. Martínez-Castro, and A. Centella-Artola, 2019: Present situation of the application of downscaling methods to the climate change projections in Central America and the Caribbean. Revista Cubana de Meteorología, 25(2) , 218–237, http://rcm.insmet.cu/index.php/rcm/article/view/467.
Vichot-Llano, A., D. Martinez-Castro, A. Bezanilla-Morlot, A. Centella-Artola, and F. Giorgi, 2021a: Projected changes in precipitation and temperature regimes and extremes over the Caribbean and Central America using a multiparameter ensemble of RegCM4. International Journal of Climatology, 41(2) , 1328–1350, doi: 10.1002/joc.6811.
Vichot-Llano, A., D. Martinez-Castro, F. Giorgi, A. Bezanilla-Morlot, and A. Centella-Artola, 2021b: Comparison of GCM and RCM simulated precipitation and temperature over Central America and the Caribbean. Theoretical and Applied Climatology, 143(1–2) , 389–402, doi: 10.1007/s00704-020-03400-3.
Vidal, J.-P., E. Martin, L. Franchistéguy, M. Baillon, and J.-M. Soubeyroux, 2010: A 50-year high-resolution atmospheric reanalysis over France with the Safran system. International Journal of Climatology, 30(11) , 1627–1644, doi: 10.1002/joc.2003.
Vignon, O. Traullé, and A. Berne, 2019: On the fine vertical structure of the low troposphere over the coastal margins of East Antarctica. Atmospheric Chemistry and Physics, 19(7) , 4659–4683, doi: 10.5194/acp-19-4659-2019.
Vignon et al., 2018: Modeling the Dynamics of the Atmospheric Boundary Layer Over the Antarctic Plateau With a General Circulation Model. Journal of Advances in Modeling Earth Systems, 10(1) , 98–125, doi: 10.1002/2017ms001184.
Vihma, T. et al., 2016: The atmospheric role in the Arctic water cycle: A review on processes, past and future changes, and their impacts. Journal of Geophysical Research: Biogeosciences, 121(3) , 586–620, doi: 10.1002/2015jg003132.
Villafuerte, M.Q. and J. Matsumoto, 2015: Significant influences of global mean temperature and ENSO on extreme rainfall in Southeast Asia. Journal of Climate, 28(5) , 1905–1919, doi: 10.1175/jcli-d-14-00531.1.
Villafuerte, M.Q. et al., 2014: Long-term trends and variability of rainfall extremes in the Philippines. Atmospheric Research, 137, 1–13, doi: 10.1016/j.atmosres.2013.09.021.
Vincent, L.A. et al., 2015: Observed Trends in Canada’s Climate and Influence of Low-Frequency Variability Modes. Journal of Climate, 28(11) , 4545–4560, doi: 10.1175/jcli-d-14-00697.1.
Viste, E., D. Korecha, and A. Sorteberg, 2013: Recent drought and precipitation tendencies in Ethiopia. Theoretical and Applied Climatology, 112(3–4) , 535–551, doi: 10.1007/s00704-012-0746-3.
Vizcaino, M., 2014: Ice sheets as interactive components of Earth System Models: progress and challenges. WIREs Climate Change, 5(4) , 557–568, doi: 10.1002/wcc.285.
Vizy, E.K. and K.H. Cook, 2012: Mid-Twenty-First-Century Changes in Extreme Events over Northern and Tropical Africa. Journal of Climate, 25(17) , 5748–5767, doi: 10.1175/jcli-d-11-00693.1.
Voldoire, A. et al., 2019: Evaluation of CMIP6 DECK Experiments With CNRM-CM6-1. Journal of Advances in Modeling Earth Systems, 11(7) , 2177–2213, doi: 10.1029/2019ms001683.
Vose, R.S., D.R. Easterling, K.E. Kunkel, A.N. LeGrande, and M.F. Wehner, 2017: Temperature changes in the United States. In: Climate Science Special Report: Fourth National Climate Assessment, Volume I[Wuebbles, D.J., D.W. Fahey, K.A. Hibbard, D.J. Dokken, B.C. Stewart, and T.K. Maycock (eds.)]. U.S. Global Change Research Program, Washington, DC, USA, pp. 185–206, doi: 10.7930/j0n29v45.
Vuille, M., E. Franquist, R. Garreaud, W.S. Lavado Casimiro, and B. Cáceres, 2015: Impact of the global warming hiatus on Andean temperature. Journal of Geophysical Research: Atmospheres, 120(9) , 3745–3757, doi: 10.1002/2015jd023126.
Wainwright, C.M. et al., 2019: ‘Eastern African Paradox’ rainfall decline due to shorter not less intense Long Rains. npj Climate and Atmospheric Science, 2(1) , 34, doi: 10.1038/s41612-019-0091-7.
Walsh, K. et al., 2010: The Tropical Cyclone Climate Model Intercomparison Project. In: Hurricanes and Climate Change[Elsner, J., R. Hodges, J. Malmstadt, and K. Scheitlin (eds.)]. Springer, Dordrecht, The Netherlands, pp. 1–24, doi: 10.1007/978-90-481-9510-7_1.
Walters, D. et al., 2017: The Met Office Unified Model Global Atmosphere 6.0/6.1 and JULES Global Land 6.0/6.1 configurations. Geoscientific Model Development, 10(4) , 1487–1520, doi: 10.5194/gmd-10-1487-2017.
Wang, B., R. Wu, and X. Fu, 2000: Pacific–East Asian Teleconnection: How Does ENSO Affect East Asian Climate?Journal of Climate, 13(9) , 1517–1536, doi: 10.1175/1520-0442(2000)013<1517:peathd>2.0.co;2.
Wang, C., L. Zhang, S.-K. Lee, L. Wu, and C.R. Mechoso, 2014: A global perspective on CMIP5 climate model biases. Nature Climate Change, 4(3) , 201–205, doi: 10.1038/nclimate2118.
Wang, G., S.B. Power, and S. McGree, 2016: Unambiguous warming in the western tropical Pacific primarily caused by anthropogenic forcing. International Journal of Climatology, 36(2) , 933–944, doi: 10.1002/joc.4395.
Wang, J. and V.R. Kotamarthi, 2015: High-resolution dynamically downscaled projections of precipitation in the mid and late 21st century over North America. Earth’s Future, 3(7) , 268–288, doi: 10.1002/2015ef000304.
Wang, L. and W. Chen, 2014: The East Asian winter monsoon: re-amplification in the mid-2000s. Chinese Science Bulletin, 59(4) , 430–436, doi: 10.1007/s11434-013-0029-0.
Wang, L. and M.-M. Lu, 2016: The East Asian Winter Monsoon. In: The Global Monsoon System: Research and Forecast (3rd Edition)[Chang, C.-P., H.-C. Kuo, N.-C. Lau, R.H. Johnson, B. Wang, and M.C. Wheeler (eds.)]. World Scientific, pp. 51–61, doi: 10.1142/9789813200913_0005.
Wang, Q., P.-M. Zhai, and D.-H. Qin, 2020: New perspectives on ‘warming–wetting’ trend in Xinjiang, China. Advances in Climate Change Research, 11(3) , 252–260, doi: 10.1016/j.accre.2020.09.004.
Wang, S. et al., 2015: Development and evaluation of a new regional coupled atmosphere–ocean model in the North Sea and Baltic Sea. Tellus A: Dynamic Meteorology and Oceanography, 67(1) , 24284, doi: 10.3402/tellusa.v67.24284.
Wang, T., J.-P. Miao, J.-Q. Sun, and Y.-H. Fu, 2018: Intensified East Asian summer monsoon and associated precipitation mode shift under the 1.5°C global warming target. Advances in Climate Change Research, 9(2) , 102–111, doi: 10.1016/j.accre.2017.12.002.
Wang, X.L., H. Xu, B. Qian, Y. Feng, and E. Mekis, 2017: Adjusted Daily Rainfall and Snowfall Data for Canada. Atmosphere-Ocean, 55(3) , 155–168, doi: 10. 1080/07055900.2017.1342163.
Wang, Y. et al., 2015: Recent surface mass balance from Syowa Station to Dome F, East Antarctica: comparison of field observations, atmospheric reanalyses, and a regional atmospheric climate model. Climate Dynamics, 45(9–10) , 2885–2899, doi: 10.1007/s00382-015-2512-6.
Wang, Y. et al., 2019: A New 200-Year Spatial Reconstruction of West Antarctic Surface Mass Balance. Journal of Geophysical Research: Atmospheres, 124(10) , 5282–5295, doi: 10.1029/2018jd029601.
Wang, Z., Y. Jiang, H. Wan, J. Yan, and X. Zhang, 2017: Detection and Attribution of Changes in Extreme Temperatures at Regional Scale. Journal of Climate, 30(17) , 7035–7047, doi: 10.1175/jcli-d-15-0835.1.
Watterson, I.G., J. Bathols, and C. Heady, 2014: What Influences the Skill of Climate Models over the Continents?Bulletin of the American Meteorological Society, 95(5) , 689–700, doi: 10.1175/bams-d-12-00136.1.
Wegmann, M., Y. Orsolini, and O. Zolina, 2018: Warm Arctic-cold Siberia: comparing the recent and the early 20th-century Arctic warmings. Environmental Research Letters, 13(2) , 025009, doi: 10.1088/1748-9326/aaa0b7.
Wen, G. et al., 2014: Changes in the characteristics of precipitation over northern Eurasia. Theoretical and Applied Climatology, 119(3–4) , 653–665, doi: 10.1007/s00704-014-1137-8.
Wester, P., A. Mishra, A. Mukherji, and A.B. Shrestha (eds.), 2019: The Hindu Kush Himalaya Assessment: Mountains, Climate Change, Sustainability and People. Springer, Cham, Switzerland, 627 pp., doi: 10.1007/978-3-319-92288-1.
Whan, K. and F. Zwiers, 2017: The impact of ENSO and the NAO on extreme winter precipitation in North America in observations and regional climate models. Climate Dynamics, 48(5–6) , 1401–1411, doi: 10.1007/s00382-016-3148-x.
Whan, K. et al., 2014: Trends and variability of temperature extremes in the tropical Western Pacific. International Journal of Climatology, 34(8) , 2585–2603, doi: 10.1002/joc.3861.
Whetton, P.H., M.R. Grose, and K.J. Hennessy, 2016: A short history of the future: Australian climate projections 1987–2015. Climate Services, 2–3, 1–14, doi: 10.1016/j.cliser.2016.06.001.
Whetton, P.H., K. Hennessy, J. Clarke, K. McInnes, and D. Kent, 2012: Use of Representative Climate Futures in impact and adaptation assessment. Climatic Change, 115(3–4) , 433–442, doi: 10.1007/s10584-012-0471-z.
Whittleston, D., S.E. Nicholson, A. Schlosser, and D. Entekhabi, 2017: Climate Models Lack Jet–Rainfall Coupling over West Africa. Journal of Climate, 30(12) , 4625–4632, doi: 10.1175/jcli-d-16-0579.1.
Whyte, F.S., M.A. Taylor, T.S. Stephenson, and J.D. Campbell, 2008: Features of the Caribbean low level jet. International Journal of Climatology, 28(1) , 119–128, doi: 10.1002/joc.1510.
Wilkinson, M.D. et al., 2016: The FAIR Guiding Principles for scientific data management and stewardship. Scientific Data, 3(1) , 160018, doi: 10.1038/sdata.2016.18.
Wille, J.D. et al., 2019: West Antarctic surface melt triggered by atmospheric rivers. Nature Geoscience, 12(11) , 911–916, doi: 10.1038/s41561-019-0460-1.
Williams, A.P. and C. Funk, 2011: A westward extension of the warm pool leads to a westward extension of the Walker circulation, drying eastern Africa. Climate Dynamics, 37(11–12) , 2417–2435, doi: 10.1007/s00382-010-0984-y.
WMO, 2017: WMO Guidelines on the Calculation of Climate Normals. WMO-No. 1203, World Meteorological Organization (WMO), Geneva, Switzerland, 18 pp., https://library.wmo.int/doc_num.php?explnum_id=4166.
Woo, S., G. Prakash, S. Jai, H. Oh, and K. Min, 2019: Projection of seasonal summer precipitation over Indian sub-continent with a high-resolution AGCM based on the RCP scenarios. Meteorology and Atmospheric Physics, 131(4) , 897–916, doi: 10.1007/s00703-018-0612-7.
Wöppelmann, G. and M. Marcos, 2016: Vertical land motion as a key to understanding sea level change and variability. Reviews of Geophysics, 54(1) , 64–92, doi: 10.1002/2015rg000502.
Wright, D.M., D.J. Posselt, and A.L. Steiner, 2013: Sensitivity of Lake-Effect Snowfall to Lake Ice Cover and Temperature in the Great Lakes Region. Monthly Weather Review, 141(2) , 670–689, doi: 10.1175/mwr-d-12-00038.1.
Wright, E.E., J.R.P. Sutton, N.T. Luchetti, M.C. Kruk, and J.J. Marra, 2016: Closing the Pacific Rainfall Data Void. Eos, Transactions American Geophysical Union, 97, doi: 10.1029/2016eo055053.
Wu, C.-H., N. Freychet, C.-A. Chen, and H.-H. Hsu, 2017: East Asian presummer precipitation in the CMIP5 at high versus low horizontal resolution. International Journal of Climatology, 37(11) , 4158–4170, doi: 10.1002/joc.5055.
Wu, J. and X. Gao, 2020: Present day bias and future change signal of temperature over China in a series of multi-GCM driven RCM simulations. Climate Dynamics, 54(1) , 1113–1130, doi: 10.1007/s00382-019-05047-x.
Wu, P., Y. Ding, Y. Liu, and X. Li, 2019: The characteristics of moisture recycling and its impact on regional precipitation against the background of climate warming over Northwest China. International Journal of Climatology, 39(14) , 5241–5255, doi: 10.1002/joc.6136.
Wu, T. et al., 2019: The Beijing Climate Center Climate System Model (BCC-CSM): the main progress from CMIP5 to CMIP6. Geoscientific Model Development, 12(4) , 1573–1600, doi: 10.5194/gmd-12-1573-2019.
Xiao, H. et al., 2020: Long-term trends in Arctic surface temperature and potential causality over the last 100 years. Climate Dynamics, 55(5–6) , 1443–1456, doi: 10.1007/s00382-020-05330-2.
Xie, Y., Y. Liu, and J. Huang, 2016: Overestimated Arctic warming and underestimated Eurasia mid-latitude warming in CMIP5 simulations. International Journal of Climatology, 36(14) , 4475–4487, doi: 10.1002/joc.4644.
Xu, C., J. Li, J. Zhao, S. Gao, and Y. Chen, 2015: Climate variations in northern Xinjiang of China over the past 50 years under global warming. Quaternary International, 358, 83–92, doi: 10.1016/j.quaint.2014.10.025.
Xu, M., S. Kang, H. Wu, and X. Yuan, 2018: Detection of spatio-temporal variability of air temperature and precipitation based on long-term meteorological station observations over Tianshan Mountains, Central Asia. Atmospheric Research, 203, 141–163, doi: 10.1016/j.atmosres.2017.12.007.
Xu, Y., A. Jones, and A. Rhoades, 2019: A quantitative method to decompose SWE differences between regional climate models and reanalysis datasets. Scientific Reports, 9(1) , 1–11, doi: 10.1038/s41598-019-52880-5.
Yang, J., G. Fang, Y. Chen, and P. De-Maeyer, 2017: Climate change in the Tianshan and northern Kunlun Mountains based on GCM simulation ensemble with Bayesian model averaging. Journal of Arid Land, 9(4) , 622–634, doi: 10.1007/s40333-017-0100-9.
Yang, M., X. Wang, G. Pang, G. Wan, and Z. Liu, 2019: The Tibetan Plateau cryosphere: Observations and model simulations for current status and recent changes. Earth-Science Reviews, 190, 353–369, doi: 10.1016/j.earscirev.2018.12.018.
Yang, W., R. Seager, M.A. Cane, and B. Lyon, 2015: The Rainfall Annual Cycle Bias over East Africa in CMIP5 Coupled Climate Models. Journal of Climate, 28(24) , 9789–9802, doi: 10.1175/jcli-d-15-0323.1.
Yang, Y., J. Tang, S. Wang, and G. Liu, 2018: Differential Impacts of 1.5 and 2°C Warming on Extreme Events Over China Using Statistically Downscaled and Bias-Corrected CESM Low-Warming Experiment. Geophysical Research Letters, 45(18) , 9852–9860, doi: 10.1029/2018gl079272.
Yao, J., Q. Yang, W. Mao, Y. Zhao, and X. Xu, 2016: Precipitation trend–Elevation relationship in arid regions of the China. Global and Planetary Change, 143, 1–9, doi: 10.1016/j.gloplacha.2016.05.007.
Yao, J. et al., 2017: Improved Performance of High-Resolution Atmospheric Models in Simulating the East Asian Summer Monsoon Rain Belt. Journal of Climate, 30(21) , 8825–8840, doi: 10.1175/jcli-d-16-0372.1.
Yao, T., J. Pu, A. Lu, Y. Wang, and W. Yu, 2007: Recent glacial retreat and its impact on hydrological processes on the Tibetan Plateau, China, and surrounding regions. Arctic, Antarctic, and Alpine Research, 39(4) , 642–650, doi: 10.1657/1523-0430(07-510)[yao]2.0.co;2.
Yatagai, A., M. Maeda, S. Khadgarai, M. Masuda, and P. Xie, 2020: End of the Day (EOD) Judgment for Daily Rain-Gauge Data. Atmosphere, 11(8) , 772, doi: 10.3390/atmos11080772.
Yatagai, A. et al., 2012: APHRODITE: Constructing a Long-Term Daily Gridded Precipitation Dataset for Asia Based on a Dense Network of Rain Gauges. Bulletin of the American Meteorological Society, 93(9) , 1401–1415, doi: 10.1175/bams-d-11-00122.1.
Ye, H., E.J. Fetzer, S. Wong, and B.H. Lambrigtsen, 2017: Rapid decadal convective precipitation increase over Eurasia during the last three decades of the 20th century. Science Advances, 3(1) , e1600944, doi: 10.1126/sciadv.1600944.
Ye, H. et al., 2016: Increasing daily precipitation intensity associated with warmer air temperatures over northern Eurasia. Journal of Climate, 29(2) , 623–636, doi: 10.1175/jcli-d-14-00771.1.
Yeh, S.W. et al., 2018: ENSO Atmospheric Teleconnections and Their Response to Greenhouse Gas Forcing. Reviews of Geophysics, 56(1) , 185–206, doi: 10.1002/2017rg000568.
Yin, L., R. Fu, E. Shevliakova, and R.E. Dickinson, 2013: How well can CMIP5 simulate precipitation and its controlling processes over tropical South America?Climate Dynamics, 41(11–12) , 3127–3143, doi: 10.1007/s00382-012-1582-y.
Yoon, J.-H., L. Ruby Leung, and J. Correia, 2012: Comparison of dynamically and statistically downscaled seasonal climate forecasts for the cold season over the United States. Journal of Geophysical Research: Atmospheres, 117(D21) , D21109, doi: 10.1029/2012jd017650.
Yoon, J.-H. et al., 2015: Increasing water cycle extremes in California and in relation to ENSO cycle under global warming. Nature Communications, 6, 1–6, doi: 10.1038/ncomms9657.
Yu, Y. et al., 2019: Climate change, water resources and sustainable development in the arid and semi-arid lands of Central Asia in the past 30 years. Journal of Arid Land, 11(1) , 1–14, doi: 10.1007/s40333-018-0073-3.
Yuan, X. et al., 2017: Vegetation changes and land surface feedbacks drive shifts in local temperatures over Central Asia. Scientific Reports, 7(1) , 1–8, doi: 10.1038/s41598-017-03432-2.
Zagorodnov, V. et al., 2012: Borehole temperatures reveal details of 20th century warming at Bruce Plateau, Antarctic Peninsula. The Cryosphere, 6(3) , 675–686, doi: 10.5194/tc-6-675-2012.
Zampieri, M. and P. Lionello, 2011: Anthropic land use causes summer cooling in Central Europe. Climate Research, 46(3) , 255–268, doi: 10.3354/cr00981.
Zaninelli, P.G., C.G. Menéndez, M. Falco, N. López-Franca, and A.F. Carril, 2019: Future hydroclimatological changes in South America based on an ensemble of regional climate models. Climate Dynamics, 52(1–2) , 819–830, doi: 10.1007/s00382-018-4225-0.
Zappa, G., E. Bevacqua, and T.G. Shepherd, 2021: Communicating potentially large but non-robust changes in multi-model projections of future climate. International Journal of Climatology, 41(6) , 3657–3669, doi: 10.1002/joc.7041.
Zazulie, N., M. Rusticucci, and G.B. Raga, 2017: Regional climate of the subtropical central Andes using high-resolution CMIP5 models – part I: past performance (1980–2005). Climate Dynamics, 49(11–12) , 3937–3957, doi: 10.1007/s00382-017-3560-x.
Zeng, X., P. Broxton, and N. Dawson, 2018: Snowpack Change From 1982 to 2016 Over Conterminous United States. Geophysical Research Letters, 45(23) , 12940–12947, doi: 10.1029/2018gl079621.
Zhang, D. et al., 2018: High-resolution ensemble projections and uncertainty assessment of regional climate change over China in CORDEX East Asia. Hydrology and Earth System Sciences, 22(5) , 3087–3103, doi: 10.5194/hess-22-3087-2018.
Zhang, H., Z. Ouyang, H. Zheng, and X. Wang, 2009: Recent climate trends on the northern slopes of the Tianshan Mountains, Xinjiang, China. Journal of Mountain Science, 6(3) , 255–265, doi: 10.1007/s11629-009-0236-y.
Zhang, M., Y. Chen, Y. Shen, and Y. Li, 2017: Changes of precipitation extremes in arid Central Asia. Quaternary International, 436, 16–27, doi: 10.1016/j.quaint.2016.12.024.
Zhang, M., Y. Chen, Y. Shen, and B. Li, 2019a: Tracking climate change in Central Asia through temperature and precipitation extremes. Journal of Geographical Sciences, 29(1) , 3–28, doi: 10.1007/s11442-019-1581-6.
Zhang, M. et al., 2018: Coordination to Understand and Reduce Global Model Biases by U.S. and Chinese Institutions. Bulletin of the American Meteorological Society, 99(7) , ES109–ES113, doi: 10.1175/bams-d-17-0301.1.
Zhang, M. et al., 2019b: Numerical Simulation of the Irrigation Effects on Surface Fluxes and Local Climate in Typical Mountain–Oasis–Desert Systems in the Central Asia Arid Area. Journal of Geophysical Research: Atmospheres, 124(23) , 12485–12506, doi: 10.1029/2019jd030507.
Zhao, S., J. Li, R. Yu, and H. Chen, 2015: Recent Reversal of the Upper-Tropospheric Temperature Trend and its Role in Intensifying the East Asian Summer Monsoon. Scientific Reports, 5(1) , 11847, doi: 10.1038/srep11847.
Zhong, X. et al., 2018: Spatiotemporal variability of snow depth across the Eurasian continent from 1966 to 2012. The Cryosphere, 12(1) , 227–245, doi: 10.5194/tc-12-227-2018.
Zhou, B., Z. Wang, Y. Shi, Y. Xu, and Z. Han, 2018: Historical and Future Changes of Snowfall Events in China under a Warming Background. Journal of Climate, 31(15) , 5873–5889, doi: 10.1175/jcli-d-17-0428.1.
Zhou, C. and K. Wang, 2017: Quantifying the Sensitivity of Precipitation to the Long-Term Warming Trend and Interannual–Decadal Variation of Surface Air Temperature over China. Journal of Climate, 30(10) , 3687–3703, doi: 10.1175/jcli-d-16-0515.1.
Zhou, L., R.E. Dickinson, A. Dai, and P. Dirmeyer, 2010: Detection and attribution of anthropogenic forcing to diurnal temperature range changes from 1950 to 1999: comparing multi-model simulations with observations. Climate Dynamics, 35(7–8) , 1289–1307, doi: 10.1007/s00382-009-0644-2.
Zhou, T., D. Gong, J. Li, and B. Li, 2009: Detecting and understanding the multi-decadal variability of the East Asian Summer Monsoon – Recent progress and state of affairs. Meteorologische Zeitschrift, 18(4) , 455–467, doi: 10.1127/0941-2948/2009/0396.
Zhou, T. et al., 2017: A Robustness Analysis of CMIP5 Models over the East Asia-Western North Pacific Domain. Engineering, 3(5) , 773–778, doi: 10.1016/j.eng.2017.05.018.
Zhou, W. et al., 2016: Evaluation of regional climate simulations over the CORDEX-EA-II domain using the COSMO-CLM model. Asia-Pacific Journal of Atmospheric Sciences, 52(2) , 107–127, doi: 10.1007/s13143-016-0013-0.
Zittis, G., 2018: Observed rainfall trends and precipitation uncertainty in the vicinity of the Mediterranean, Middle East and North Africa. Theoretical and Applied Climatology, 134(3–4) , 1207–1230, doi: 10.1007/s00704-017-2333-0.
Zittis, G. and P. Hadjinicolaou, 2017: The effect of radiation parameterization schemes on surface temperature in regional climate simulations over the MENA-CORDEX domain. International Journal of Climatology, 37(10) , 3847–3862, doi: 10.1002/joc.4959.
Zou, L. and T. Zhou, 2016: A regional ocean–atmosphere coupled model developed for CORDEX East Asia: assessment of Asian summer monsoon simulation. Climate Dynamics, 47(12) , 3627–3640, doi: 10.1007/s00382-016-3032-8.
1 The term ‘recent decades’ refers to a period of approximately 30 to 40 years which ends within the period 2010–2020. This is used as many studies in the literature will analyse datasets over a range of climatologically significant periods (i.e., 30 years or more) with precise start and end dates and periods depending on data availability and the year of the study. An equivalent approximate description using specific years would be ‘since the 1980s’.


